Article

Effect of Clay Minerals and Rock Fabric on Hydrocarbon Generation and Retention by Thermal Pyrolysis of Maoming Oil Shale

1
South China Sea Institute of Planning and Environment Research, South China Sea Branch, State Oceanic Administration, Guangzhou 510300, China
2
State Key Laboratory of Organic Geochemistry, Guangzhou Institute of Geochemistry, Institutions of Earth Science, Chinese Academic of Sciences, Guangzhou 510640, China
3
Guangdong Zeyu Experimental Equipment Co., Ltd., Guangzhou 510400, China
*
Author to whom correspondence should be addressed.
Processes 2023, 11(3), 894; https://doi.org/10.3390/pr11030894
Submission received: 2 February 2023 / Revised: 8 March 2023 / Accepted: 8 March 2023 / Published: 16 March 2023

Abstract

:
In traditional kerogen pyrolysis experiments, the effects of minerals and rock fabric on the pyrolysis products were ignored. To further clarify the role of the mineral matrix and rock fabric on hydrocarbon generation and retention, a closed anhydrous pyrolysis experiment was conducted on core plugs, powdered rock and kerogen from a clay-rich sample of Maoming oil shale within a temperature range of 312 °C to 600 °C, at a fixed pressure of 30 Mpa. The experiment’s results showed that the yields of heavy hydrocarbons (C14+) generated from the core plugs and powdered rock were obviously lower than that of kerogen, which may be caused by the retention effect of clay minerals in raw shale. The yields of gaseous hydrocarbons generated from core plugs were lower compared with powdered rock due to the retention of C2+ hydrocarbons by the intact rock fabric and the preferential generation of methane. Light hydrocarbon (C6-14) yields generated from the core plugs and powdered rock were higher than kerogen, which may be the consequence of the cleavage of extraction bitumen and the interactions with kerogen. Moreover, the ratios of iso to normal paraffin (iC4/nC4, iC5/nC5) of the core plugs and powdered rock were higher than kerogen. Our experimental results show that kerogen pyrolysis in a confined system may overestimate the hydrocarbon generation potential due to the negligence of the retention effect of minerals and the rock fabric, especially in the source rocks rich in clay minerals.

1. Introduction

In recent years, kerogen pyrolysis has been widely used in various fields of oil/gas geochemistry, including the determination of petroleum formation stages [1,2,3], the kinetics of hydrocarbon generation [4,5], thermal maturation indices [6], natural gas genesis [7,8] and the primary migration and generation of oil [9]. However, kerogen can only represent the pyrolysis behavior of pure organic matter in pyrolysis experiments. In addition to kerogen, the source rocks contained various types of inorganic compounds, which may have an important effect on the pyrolysis products.
Inorganic compounds, such as minerals, transition metals and water, have been known to play an important role in the thermal maturation of kerogen. Clay minerals can significantly reduce the amount of heavy hydrocarbons (C14+) due to mineral retention and increase the isomerization [10,11]. Transition metals (iron/cobalt/nickel) can promote the hydrogenation of olefins, thus promoting the generation of natural gas [12,13,14,15,16,17,18,19]; H2O can promote the thermal pyrolysis of kerogen and inhibit the cross-linking reaction of carbon–carbon bonds by the exogenous source of hydrogen, which results in the formation of more saturate-enriched oil and gaseous hydrocarbons [20,21]. In addition, a certain amount of extractable bitumen in the source rocks, which was often removed in the traditional kerogen pyrolysis experiments, may contribute to the generation of hydrocarbons [22,23,24,25].
In addition, the particle size of the rock sample is another important factor influencing pyrolysis products [26,27,28,29,30,31]. Size-dependent effects on the generated hydrocarbons have been demonstrated on coal/oil shale samples in open-system pyrolysis, and a large particle diameter from 0.2–0.5 mm to 1–4 mm would limit the escape of generated volatile hydrocarbons [26,27,28]. However, open system pyrolysis changes the physical and chemical characteristics of a rock sample, which largely eliminates the effect of the rock fabric on hydrocarbon generation [29,30]. In closed system pyrolysis, the effect of the particle on pyrolysis products is less studied [31,32].
In this study, the effect of the mineral matrix and rock fabric on the hydrocarbon generation and retention were systematically investigated. Three groups of anhydrous closed system pyrolysis experiments were carried out on a clay-rich Maoming shale sample within 312–600 °C, under a pressure of 30 Mpa. The first group used a small cylindrical sample with a diameter of 4.8 mm and a length of 20–30 mm, hereafter named “core plugs”, the second group used powdered shale that was crushed to a particle size of below 0.25 mm, and the third group used kerogen, which was obtained by removing inorganic minerals from the shale. The objectives of this study are: (1) to compare the yield and composition of the generated hydrocarbons from three groups of experiments; (2) to reveal the role of the mineral matrix in hydrocarbon generation and retention by comparing the differences between kerogen and powdered shale; and (3) to characterize the effect of the rock fabric on gas retention by comparing powdered rock and core plugs.

2. Experimental Procedures
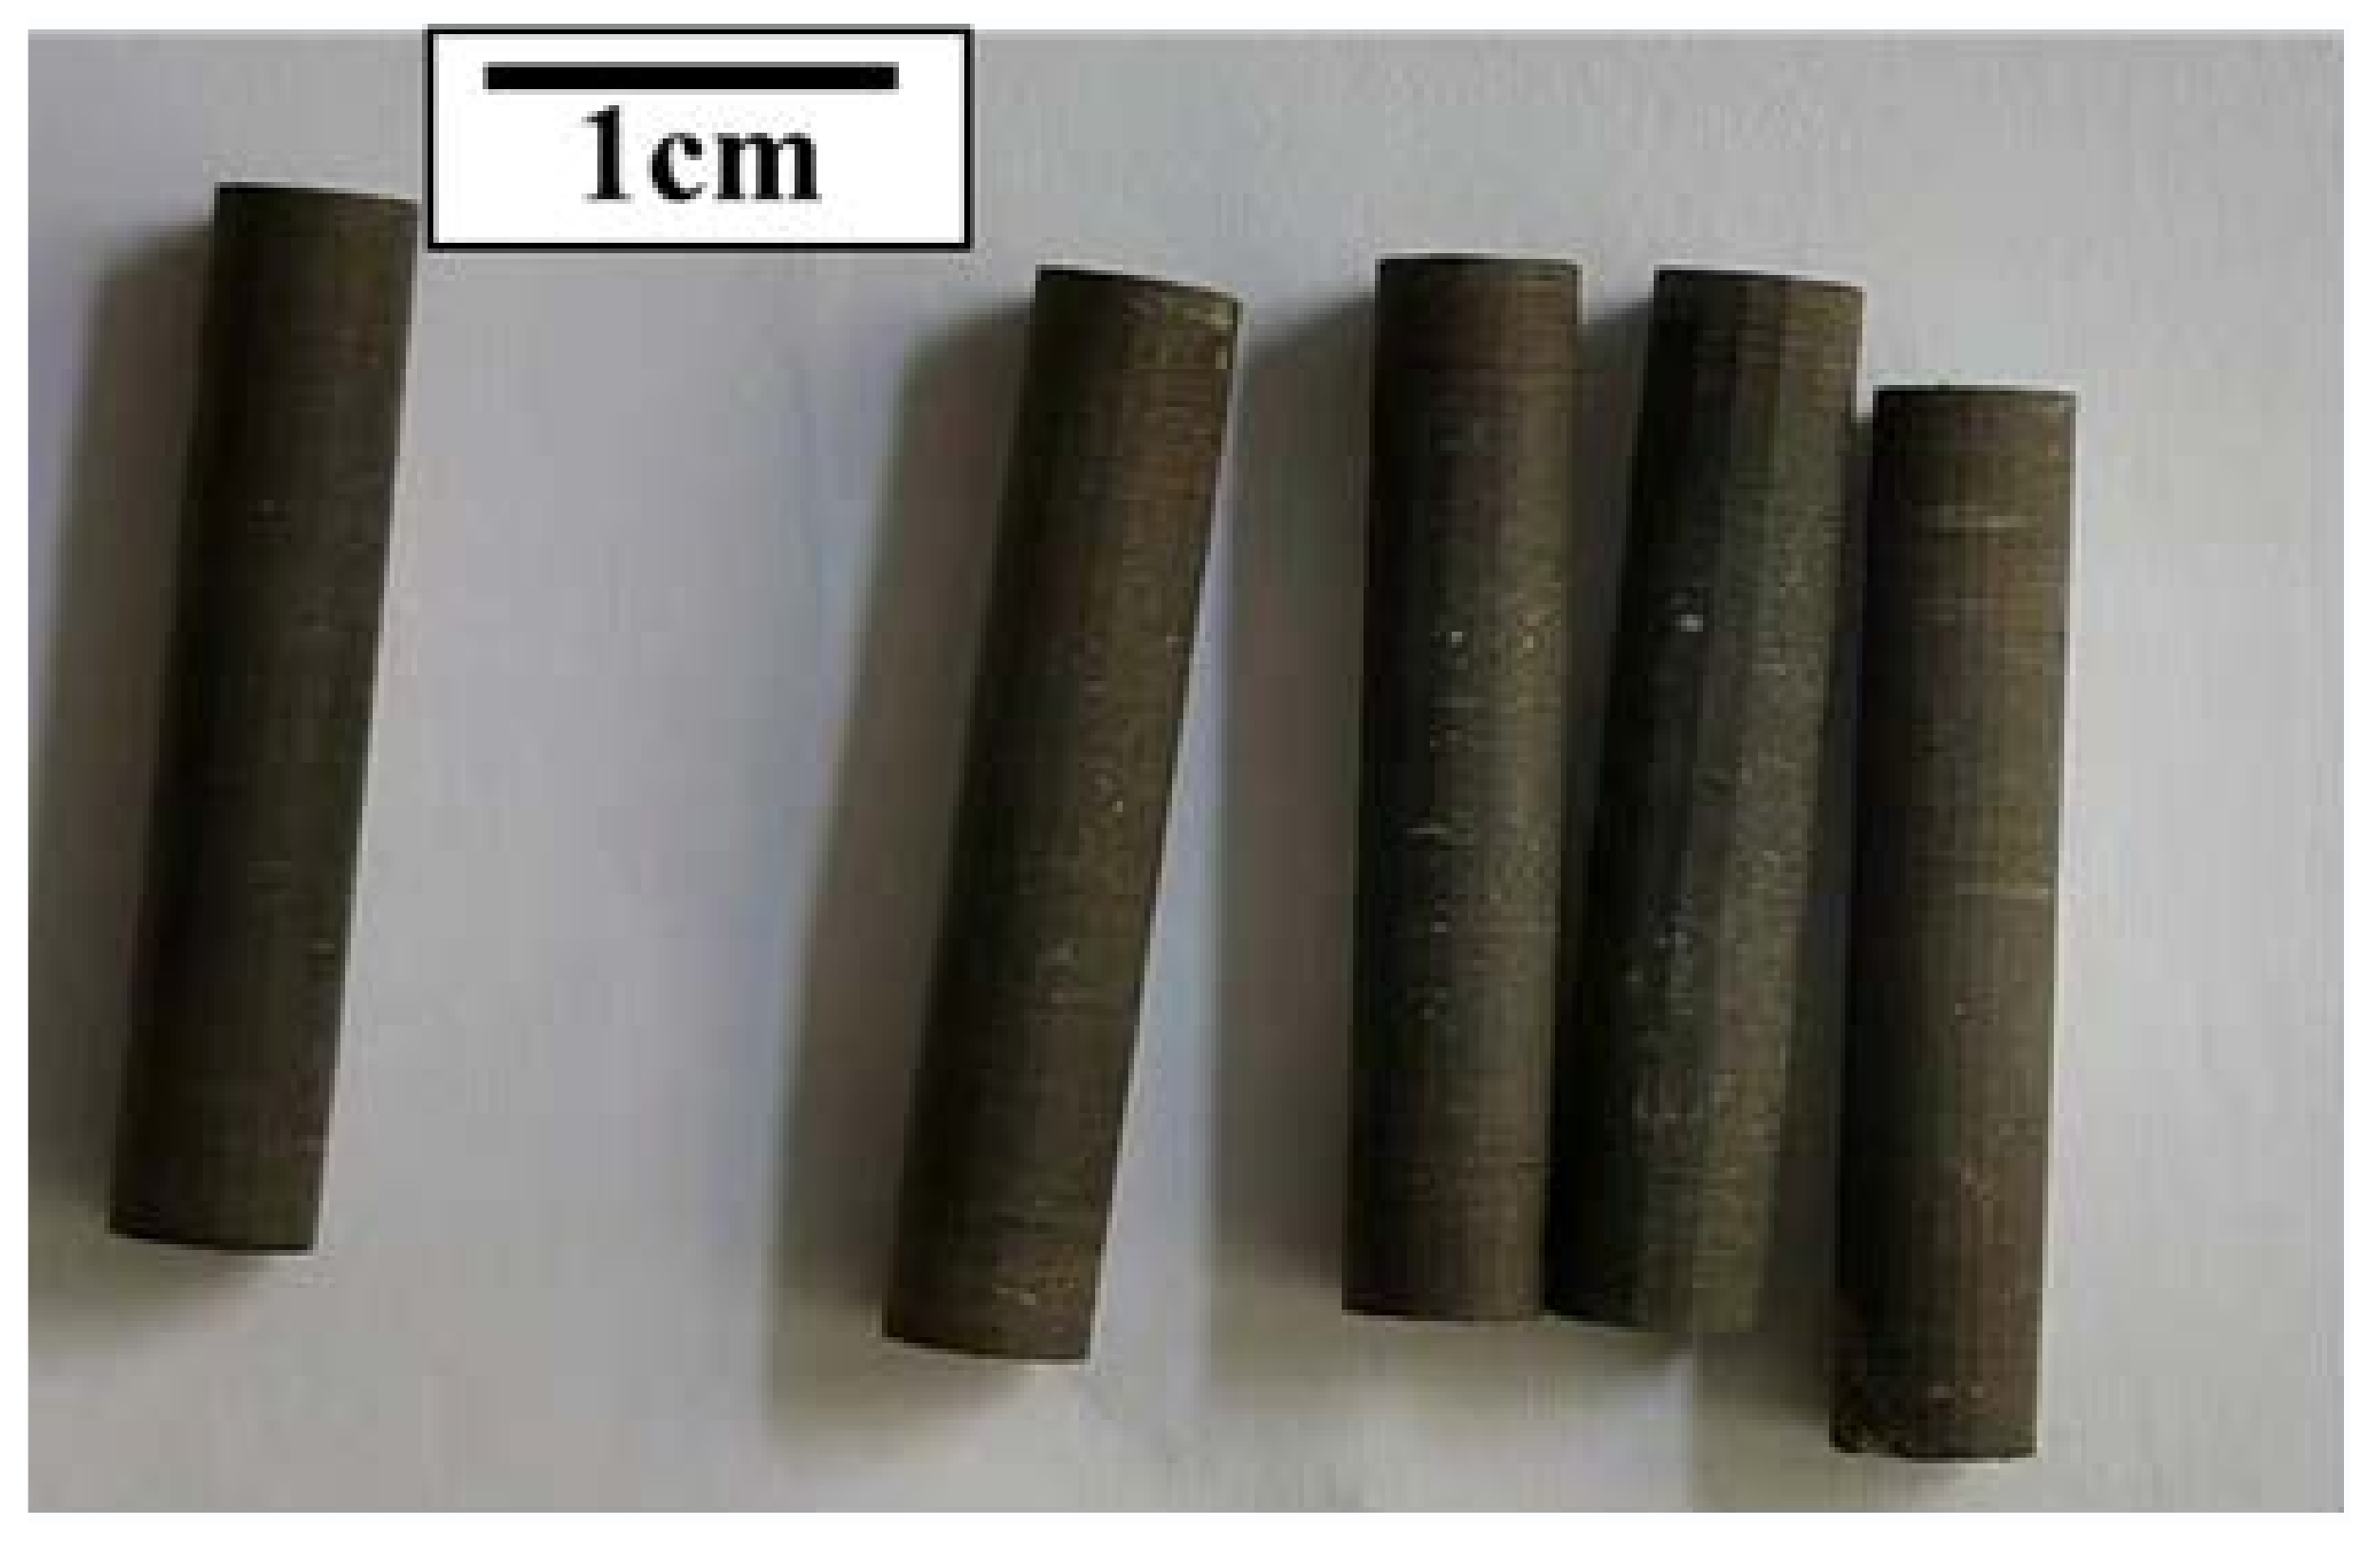
2.1. Samples

The source rocks used in this pyrolysis experiment were collected from Eocene Youganwo Formation at Maoming basin in Guangdong Province, south-east China. The oil shale is immature, with an Ro value of 0.5% [33]. Each core plug with a diameter of 5 mm and a length of 20–30 mm was drilled perpendicular to the bedding from an intact piece of oil shale using a cutter (SH289-YX) (Figure 1). A total of 13 core plugs were prepared and each core plug was lightly smoothed with gauze to remove sharp edges. The remaining oil shale was crushed to a size of 60 mesh and homogenized for preparing the powdered rock. Subsequently, kerogen was isolated from a portion of the powdered source rock, and the preparation process has been described in detail in other literature [34]. Briefly, the soluble organic matter in the powdered sample was removed by Soxhlet extraction with dichloromethane/methanol (9:1) for 72 h, and the content of soluble organic matter (bitumen) was approximately 27.3 mg/g. After extraction, the powdered shale was treated with HCl and HF three times to remove carbonate and silicate minerals. The experimental procedure of this research is shown in Figure 2.
The basic geochemical data of samples are shown in Table 1. The powdered rock has high total organic carbon content of 22.89%, with a HI (hydrogen index) of 605 mg/g TOC, Tmax of 428 °C, and the values of TOC and pyrolysis parameter are generally consistent with those of core plugs. Kerogen has a higher TOC of 68%, HI of 680 mg/g TOC and S2 of 453.87 mg/g, which may be because more lipid structures were exposed during acid treatment.
XRD analysis show that the source rock samples (core plugs and powdered rock) contain illite, kaolinite and quartz, accounting for 65.2%, 15.2% and 19.6%, respectively, which indicated that the source rock samples are rich in clay minerals. The kerogen only contains quartz (Figure 3), indicating that clay minerals were removed during the preparation of kerogen.

2.2. Pyrolysis Apparatus

Three sets of core plugs, powdered rock and kerogen were pyrolyzed in sealed gold tube. The pyrolysis experimental procedure has previously been reported [34]. Briefly, one end of the empty tube was welded before loading the sample and then certain amount of samples were put into the tube. After loading, the open end of each tube was purified with argon for 15 min to remove the air, which was subsequently welded. The open end of the gold tube was clamped to make an initial seal, which was sealed by welding under argon gas. Then, the sealed tube was put in hot water for leak testing.

2.3. Heating Procedure

The samples in the sealed gold tubes were pyrolyzed in 15 separate autoclaves, maintained at 30 Mpa to keep the pressure balance. The detailed procedures were as follows: the autoclaves were pyrolyzed from room temperature to 250 °C within 8 h, then rose to 600 °C at 2 °C/h. The autoclave was taken continuously at a temperature interval of 24 °C from 312 °C to 600 °C. After that, the autoclave was quenched in a cold water bath after taken out and the tubes were examined for leakage.

2.4. Gaseous Hydrocarbons and Inorganic Gas Analysis

An auxiliary needle was used to release the gas under the closed condition after cleaning the gold tubes, then introduced into the HP 6980 GC for quantitative analysis. Detailed methods have been described in other literature [34]. Briefly, the gaseous hydrocarbons were analysed by the flame ionization detector (FID), the hydrogen was analysed by the thermal conductivity detector (TCD), and other inorganic gases (CO2 and H2S) were analysed by another TCD detector. The oven temperature was initially maintained at 60 °C for 5 min, raised to 130 °C at 15 °C/min and then to 180 °C at 25 °C/min, and maintained for 4 min. The yields of the gas components were quantified by the responses of FID and TCD, and standard gas was used to determine the related response coefficient.

2.5. Light and Heavy Hydrocarbons

The method for quantifying light hydrocarbons (C6-14) has been described in other literature [34]. Briefly, the gold tube after gas analysis was frozen by liquid nitrogen for 5 min, then the tube was quickly cut into several pieces and put into 3 mL n-pentane. The tube immersed in n-pentane was subjected to ultrasonic treatment for ten minutes, and then left for 72 h. A known weight of internal standard (deuterated C24) was added to measure the yield by using Agilent 6890 GC. The GC oven temperature was maintained at 40 °C for 5 min, then raised to 290 °C at 4 °C/min and held for 30 min.
After analysis of the gaseous and light hydrocarbons, the solid residue in the gold tube was further extracted with dichloromethane to separate the soluble organic matter, which was defined as heavy hydrocarbons. The heavy hydrocarbons were weighed after evaporation of the solvent.

3. Experimental Result

3.1. Hydrocarbon Yields

The yields of heavy hydrocarbons (C14+), light hydrocarbons (C6-14), gaseous hydrocarbons and inorganic gases generated from kerogen, powdered rock and core plugs are summarized in Table 2, and Figure 4 and Figure 5.
Heavy hydrocarbons (C14+): The C14+ yields in three sets increased initially to the maximum value and then decreased gradually as temperature increased. In addition, the C14+ peak yield of core plugs (203.61 mg/g TOC) was close to that of powdered rock (198.94 mg/g TOC), but the peak yields of two sets were much lower than that of kerogen (361.27 mg/g TOC) (Figure 4a).
Light hydrocarbons (C6-14): The yields of C6-14 in three sets increased to the maximum value at 408 °C or 432 °C and then decreased gradually as temperature rose (Figure 4b), which was similar to the variation trend of C14+. However, the peak yield of kerogen (77.16 mg/g TOC) was much lower than that of the powdered rock (117.09 mg/g TOC) and core plugs (108.26 mg/g TOC).
Wet gases (∑C2-5): The ∑C2-5 yields of the kerogen, powdered rock and core plugs continuously increased to the maximum at 480 °C and then decreased as temperature increased (Figure 4c), and the yields were in the ranges of 1.54–257.12 mg/g TOC, 1.52–239.13 mg/g TOC and 0.73–206.95 mg/g TOC, respectively, which showed a yield trend of core plugs < powdered rock < kerogen.
The yield variation trends of individual gaseous hydrocarbons (ethane, propane, butane, pentane) was similar, which increased to the maximum and then gradually decreased as temperature increased (Figure 5). The maximum yields from ethane to propane (108.01 mg/g TOC, 76.07 mg/g TOC, 40.26 mg/g TOC, 10.55 mg/g TOC, respectively) in core plugs were obviously lower than those in the powdered rock (117.86 mg/g TOC, 96.18 mg/g TOC, 48.45 mg/g TOC, 12.68 mg/g TOC, respectively), and both were lower than kerogen.
Methane (C1): The methane yields of the kerogen, powdered rock and core plugs increased consistently with the increase in temperature (Figure 4d), ranging from 1.68 to 356.51 mg/g TOC, 1.7 to 353.50 mg/g TOC and 1.15 to 340.69 mg/g TOC, respectively. The methane yields in three sets were generally similar, but the kerogen had a higher methane yield at 600 °C.
Inorganic gases: The inorganic gases generated from the pyrolysis of kerogen, powdered rock and core plugs mainly included H2S, CO2 and H2 (Table 2), and CO2 was the main inorganic gas. The CO2 yields of the kerogen, powdered rock and core plugs gradually increased as the temperature increased, ranging from 61.88 to 147.44 mg/g TOC, 79.90 to 287.56 mg/g TOC and 60.18 to 275.25 mg/g TOC, respectively. The kerogen had a lower CO2 yield, probably due to the removal of part of the carboxyl structure during acid treatment. The H2S yields of the core plugs, powdered rock and kerogen were 0.00~4.41 mg/g TOC, 0.00~2.62 mg/g TOC and 0.85~9.08 mg/g TOC, respectively. Kerogen had the highest H2S yield of the three series, which may be because sulfur-containing compounds in kerogen are more prone to cracking than core plugs and powdered rock. The yields of H2 for three series were relatively low and the differences were not significant.

3.2. Gas Parameter Ratio

C1/∑C1-5: The ratios of C1/∑C1-5 for the kerogen, powdered rock and core plugs decreased firstly to the lowest value at 456 °C and then increased consistently as the temperature increased (Figure 6), with the ratio ranges of 0.29–0.98, 0.27–0.92 and 0.24–0.98, respectively. More importantly, the ratios in the powdered rock and kerogen were lower than that of the core plugs.
iC4/nC4, iC5/nC5: The ratios of iC4/nC4 and iC5/nC5 for the kerogen, powdered rock and core plugs initially decreased and then increased (Figure 7). The isomerization ratios of the core plugs and powdered rock were similar, but were significantly higher than that of the kerogen (Figure 7), which may be caused by the catalysis of clay minerals [35,36].

4. Discussion

4.1. Retention Effects of Clay Minerals

The C14+ yields for the core plugs and powdered rock were almost the same in our pyrolysis experiments, which were obviously lower than that of kerogen (Figure 4a). The isolated kerogen can represent the hydrocarbon generation behavior of pure organic matter, and the core plugs/powdered rock represent the natural state of hydrocarbon generation and expulsion [37]. Therefore, the yield difference between the core plugs/powdered source rock and kerogen indicates hydrocarbon retention. The maximum retention of heavy hydrocarbons in the core plugs and powdered rock is 178.94 mg/g TOC and 166.17 mg/g TOC (Table 3), respectively, which can nearly account for 50% of the total hydrocarbon generated. The core plugs and powdered rock contained high contents of clay minerals compared with kerogen (Table 1), which may affect the retention of heavy hydrocarbons.
Numerous studies have demonstrated that clay minerals can not only accelerate the pyrolysis of organic matter [38,39,40,41] but also have a strong retention effect on heavy hydrocarbons [10,11,42]. Espitalie et al. [10] found that the yield of heavy hydrocarbons generated by pyrolysis of source rock was significantly lower than that of isolated kerogen, which was believed to be caused by the retention of heavy hydrocarbons by clay minerals. Additionally, Rahman et al. [42] found that the yield differences of macromolecular hydrocarbon generated by pyrolysis of Monterey and Stuart source rocks and isolated kerogen were 85–142 mg/g TOC and 56–210 mg/g TOC, respectively, which were comparable with our experimental results. The contents of clay minerals in the core plugs and powdered rock were up to 80% in our experiment, so the high content of clay minerals may limit the expulsion of heavy hydrocarbons. Moreover, the petrographic characteristics of the Maoming shale can also support the retention effect of clay minerals. Oil and other byproducts of kerogen maturation occupy clay and kerogen porosity. Relevant studies have demonstrated that the interparticle pores in clay minerals vanished at the oil window because of filling OM [43,44,45,46,47]. For the OM-rich pyrolyzed Maoming shale, the predominant pore type consisted of interparticle pores between minerals and the intra-clay platelet pores. FE-SEM observations showed that the clay mineral pores and mineral dissolution pores were mostly occupied by petroleum at the oil generation stage [48], which also indicated the retention of hydrocarbons by clay minerals.
According to the retention mechanism proposed by Espitalie [10], we proposed a similar hydrocarbon retention process for our experiment. In the first step, the heavy (C14+) and low molecular weight hydrocarbons (C14−) were generated by the thermal breakdown of kerogen in source rocks. The low molecular weight hydrocarbons (C14−) were released immediately, but the heavy hydrocarbons were trapped on the surface of the minerals. In the second step, the trapped hydrocarbons were cracked to reveal low molecular weight hydrocarbons and carbon residue, and these hydrocarbons were subsequently released.

4.2. Effect of Rock Fabric on Gaseous Hydrocarbons

The wet gas (∑C2-5) yields showed a trend of core plugs < source rock < kerogen, and the highest ∑C2-5 yields in kerogen can be attributed to its higher amount of liquid hydrocarbons, which subsequently undergo secondary cracking at a high temperature [49]. It is worth noting that though the kerogen has the highest yield of gaseous hydrocarbon in three series, the yield differences are not as large as the heavy hydrocarbons. The main reason may be as follows: (1) Two Soxhlet extractions were experienced while preparing kerogen compared with shale, which resulted in the reduction in macromolecular precursors. (2) Although the heavy hydrocarbon yields of the core plugs and powdered rock were relatively low, the retained heavy hydrocarbons can be further cracked [10].
However, both the core plugs and powdered rock had similar liquid hydrocarbon yields and experienced the same thermal evolution (Table 2 and Figure 4) [32], but the powdered rock had a higher yield of gaseous hydrocarbons, which indicates that the intact rock fabric limits the expulsion of gaseous hydrocarbons. Previous studies have shown that the intact rock fabric or larger particle size can significantly inhibit the generation of C2+ gaseous hydrocarbons in either open or closed systems [28,29,30,32]. Inan [30] found that the yields of wet gas generated by pyrolysis of source rock with a large particle diameter (1–4 mm) were lower than those of powdered rock (below 0.106 mm), which was mainly due to the retention of C2+ hydrocarbons by the rock fabric. Shao et al. [32] suggested that the wet gas yields generated by the pyrolysis of core plugs with a diameter of 5 mm were lower than those of powdered rock, and believed that the intact rock fabric limited the gas generation. The diameter (4.7 mm) of the core plugs used in our experiment is comparable with previous studies [30,32], so we thought that the rock fabric in core plugs may have restricted the generation of C2+ hydrocarbons, which is reflected well by the yield ratios of gaseous hydrocarbons and the dryness coefficient.
The variations in yield ratios between the core plugs and the powdered rock were compared to further clarify the influence of the rock fabric on gas generation and retention (Figure 8). Overall, the yield ratios are lower than 1.0 except for methane, which can be divided into two stages in detail: (1) The yield ratios from C1 to C5 are relatively low at 312–336 °C, indicating that gas generated from the core plugs is obviously lower than that of the powdered rock. At this stage, a viscous bitumen phase was generated during kerogen pyrolysis and the interconnected pore and pore throats of the rock were impregnated [31]. The SEM images of Maoming shale at this stage demonstrated the presence of primary inter-mineral pores and OM pores, which had been filled with OM [48]. Consequently, gas expulsion was limited due to reduced porosity and permeability. (2) The yield ratios from C2 to C5 are generally stable at 0.8, except the ethane and propane at 576 °C, but the methane ratio is close to or even higher than 1.0, which indicates that the higher molecular weight gaseous hydrocarbons (C2+) are prone to being selectively retained in rocks [29,30,32]. At this stage, organic bubble pores and modified mineral pores are developed in the Maoming shale and both of them are in the macropore range [50,51]. These pores could provide storage space as well as permeability pathways for gas molecules through the shale [51], which may lead to the selective retention of C2+ and the preferential expulsion of methane.
In addition, the ratios of C1/∑C1-5 of the core plugs are higher than those of the powdered rock in the entire temperature range (Figure 6), which may be due to the partial retention of C2-5 component by the rock fabric and the preferential generation of methane [29,30,32], which are consistent with the results of the yield ratios. Previous studies have demonstrated that the mobility and diffusion of gaseous alkanes within the confined rock matrix are significantly influenced by the molecular size [52,53,54,55,56], and methane is characterized by high mobility due to its higher ability of desorption/diffusion and lower molecular size compared to C2+ gases. Therefore, we believe that the C2+ gas generated by the core plugs was retained in the rock fabric due to its high molecular size and poor mobility, resulting in a high drying coefficient compared with the powdered rock.

4.3. Effect of Extractable Bitumen on the Generation of Light Hydrocarbons

Although the yields of heavy hydrocarbon in the core plugs and powdered rock were significantly lower than kerogen (discussion in Section 4.1), the peak yields of light hydrocarbon (117.09 mg/g TOC for powdered rock; 108.26 mg/g TOC for core plugs) were increased by 40.3% compared with the kerogen (77.16 mg/g TOC). These results are not consistent with the classical theory that light hydrocarbons (C6-14) are mainly generated by thermal cracking of heavy hydrocarbons [49], and this indicates that other paths may exist for the generation of light hydrocarbons.
A certain amount of extractable bitumen (27.3 mg/g TOC) were contained in the core plugs and powdered rock compared with the kerogen, which is comparable to the difference in the light hydrocarbon yield between the core plugs/powdered rock and the kerogen. The amounts of extractable bitumen in the source rocks of different lithology are significantly different [57,58,59]. The bitumen content in carbonate makes up a high percentage of the immature organic matter (typically 120 mg/g TOC) [57] and is even higher in low-rank coal (90–200 mg/g TOC) [59]. The amount of bitumen in immature clastic source rocks makes up a small part of the organic matter (<30 mg/g TOC), which is comparable with our results (27.3 mg/g TOC). Relevant studies have suggested that both kerogen and extractable bitumen are macromolecular organic matter and petroleum precursors in source rocks, which may contribute nearly 15% of light hydrocarbons during pyrolysis [59]. Moreover, the extractable bitumen can act as a hydrogen donor or hydrogen transfer agent to interact with kerogen, which could increase the generation of liquid hydrocarbons by preventing the reorganization or polymerization during pyrolysis [59,60,61]. Therefore, we believe that light hydrocarbons generated in core plugs and powdered rock may be promoted through the cleavage of bitumen and the intermolecular interactions with kerogen.

4.4. Implications for the Natural System

The methane content (10–60%) generated by thermal pyrolysis is much lower than that in natural gas reservoirs (above 90%), which can be attributed to the catalysis by transition metals [12,13,14,15,16,17,18,19]. However, more scholars have suggested that the migration and fractionation of natural gas in nature, rather than transition metal catalysis, leads to the higher methane content in the gas [29,30,32,62]. Our results show that the generation of hydrocarbons from source rocks under pyrolysis conditions can lead to the generation of drier gases, especially for the core plugs [30,32]. In addition, the gas composition in pyrolysis experiments can be much closer to the natural gas than expected, which may be achieved by pyrolysis of larger particle size samples.
Our results showed that nearly 50% of heavy hydrocarbons can be retained by clay minerals. Considering the possible effects of clay minerals on the generation and retention of petroleum under geological conditions, two extreme models were adapted to account for the strong and mild effects of minerals on oil retention based on a previous study [10]. On the left in Figure 9a, the source rock is characterized by a high carbonate content with low specific activity and a high content of organic carbon to minimize the retention effect of clay minerals. Only a small part of the heavy hydrocarbons were retained in the clay minerals, and the hydrocarbon reservoirs include heavy oil at moderate depths, light hydrocarbons at deeper depths and finally gas. On the right in Figure 9b, the source rock is characterized by a high clay mineral content with high specific activity to maximize the retention effect of minerals. The heavy hydrocarbons generated are largely retained, and then the heavy hydrocarbons may be subsequently cracked to reveal light hydrocarbons and gases. Therefore, the hydrocarbon reservoirs are mainly light hydrocarbons and gas, and finally gas. However, more commonly, the generation and retention of heavy hydrocarbons depends on the type of mineral, the content and type of organic matter and the properties of heavy hydrocarbons likely to be generated in a sedimentary basin.

5. Conclusions

A closed anhydrous pyrolysis experiment on core plugs, powdered rock and kerogen of clay-rich Maoming shale was conducted to reveal the role of clay minerals and the rock fabric on hydrocarbon generation and retention. The core plugs in our experiment preserved the relatively intact rock fabric, while the powdered rock represents the homogeneous mixture of the inorganic and organic matter, and the isolated kerogen represents the hydrocarbon generation behavior of pure organic matter. The main conclusions are as follows: The heavy hydrocarbon yields of the core plugs and powdered rock were almost the same in our pyrolysis experiments but much lower than that of kerogen. This may be mainly because the high content of clay minerals in Maoming shale restricted the expulsion of heavy hydrocarbons, which is consistent with the filling of oil in the interparticle pores in the clay minerals at the oil window. The wet gas generated from the core plugs was obviously lower than that of powdered rock at lower temperatures, but the difference diminished as the temperature increased, which is mainly due to the rock fabric restricting the expulsion of C2+ hydrocarbons. Moreover the light hydrocarbons generated from the core plugs and powdered rock were higher than those from kerogen, which can be attributed to the cracking of extraction bitumen and the interaction with kerogen. Our results show that clay minerals and the rock fabric have a significant influence on hydrocarbon generation and expulsion. In future studies, pore evolution characteristics should be further combined to reveal the mechanism of hydrocarbon generation/expulsion more accurately.

Author Contributions

K.L.: data collection, formal analysis, visualization and writing—original draft. Q.W.: data collection and analysis. H.M.: formal analysis; H.H.: data collection and analysis, and visualization. H.L.: conceptualization, validation, formal analysis, writing—review and editing, supervision and funding acquisition. P.P.: formal analysis and validation. All authors have read and agreed to the published version of the manuscript.

Funding

This work was supported by the China Ocean Development Foundation (2022): Monitoring and assessment of coastal blue carbon ecosystem and mechanism study on consolidation and enhancement of carbon sink capacity (CODF-002-ZX-2021); Marine Economy Development Special Foundation of Guangdong Province (2023): Investigation and estimation of marine carbon sources, carbon sinks and carbon fluxes and application research of technology evaluation; The 2023 Special Fund for Natural Resources of Forestry Administration of Guangdong Province (Carbon storage verification, carbon sequestration potential assessment and carbon trading mechanism of typical coastal wetlands); and the Project of Guangdong Forestry Administration (2023): Verification of human activities in marine protected areas and monitoring and assessment of typical ecosystems.

Data Availability Statement

All the data obtained in this research have been present in the manuscript.

Acknowledgments

We thank the three anonymous reviewers for their valuable suggestions. We also thank XR Liu for preparing the core plugs of Maoming shale.

Conflicts of Interest

The authors declare no conflict of interest.

References

  1. Tissot, B.; Durand, B.; Espitalie, J.; Combaz, A. Influence of nature and diagenesis of organic matter in formation of petroleum. AAPG Bull. 1974, 58, 499–506. [Google Scholar]
  2. Ko, L.T.; Loucks, R.G.; Zhang, T.W.; Ruppel, S.C. Pore and pore network evolution of Upper Cretaceous Boquillas (Eagle Ford–equivalent) mudrocks: Results from gold tube pyrolysis experiments. AAPG Bull. 2016, 100, 1693–1722. [Google Scholar] [CrossRef]
  3. Ko, L.T.; Ruppel, S.C.; Loucks, R.G.; Hackley, P.C.; Zhang, T.W.; Shao, D.Y. Pore-types and pore-network evolution in Upper Devonian-Lower Mississippian Woodford and Mississippian Barnett mudstones: Insights from laboratory thermal maturation and organic petrology. Int. J. Coal Geol. 2018, 190, 3–28. [Google Scholar] [CrossRef]
  4. Hunt, J.M.; Lewan, M.D.; Hennet, R.J.C. Modeling oil generation with time-temperature index graphs based on the Arrhenius equation. AAPG Bull. 1991, 75, 795–807. [Google Scholar]
  5. Zhao, Z.F.; Feng, Q.; Liu, X.R.; Peng, P.A.; Liu, J.Z.; HSU, C.S. Petroleum Maturation Processes Simulated by High-Pressure Pyrolysis and Kinetic Modeling of Low-Maturity Type I Kerogen. Energy Fuels 2022, 36, 1882–1893. [Google Scholar] [CrossRef]
  6. Lewan, M.D. Evaluation of petroleum generation by hydrous pyrolysis experimentation. Philos. Trans. A Math. Phys. Sci. 1985, 315, 123–134. [Google Scholar]
  7. Schoell, M. Genetic characterization of natural gases. AAPG Bull. 1983, 67, 2225–2238. [Google Scholar]
  8. Galimov, E.M. Sources and mechanisms of formation of gaseous hydrocarbons in sedimentary rocks. Chem. Geol. 1988, 71, 77–95. [Google Scholar] [CrossRef]
  9. Lewan, M.D.; Williams, J.A. Evaluation of petroleum generation from resinites by hydrous pyrolysis. AAPG Bull. 1987, 71, 207–214. [Google Scholar]
  10. Espitalie, J.; Madec, M.; Tissot, B. Role of mineral matrix in kerogen pyrolysis: Influence on petroleum generation and migration. AAPG Bull. 1980, 64, 59–66. [Google Scholar]
  11. Kelemen, S.R.; Sansone, M.; Walters, C.C.; Kwiatek, P.J.; Bolin, T. Thermal transformations of organic and inorganic sulfur in Type II kerogen quantified by S-XANES. Geochim. Cosmochim. Acta 2012, 83, 61–78. [Google Scholar] [CrossRef]
  12. Mango, F.D. Transition metal catalysis in the generation of petroleum and natural gas. Geochim. Cosmochim. Acta 1992, 56, 553–555. [Google Scholar] [CrossRef]
  13. Mango, F.D.; Hightower, J.W.; James, A.T. Role of transition-metal catalysis in the formation of natural gas. Nature 1994, 368, 536–538. [Google Scholar] [CrossRef]
  14. Mango, F.D.; Hightower, J. The catalytic decomposition of petroleum into natural gas. Geochim. Cosmochim. Acta 1997, 61, 5347–5350. [Google Scholar] [CrossRef]
  15. Lewan, M.D.; Maynard, J.B. Factors controlling enrichment of vanadium and nickel in the bitumen of organic sedimentary rocks. Geochim. Cosmochim. Acta 1982, 46, 2547–2560. [Google Scholar] [CrossRef]
  16. Gao, J.; Liu, J.; Ni, Y. Gas generation and its isotope composition during coal pyrolysis: The catalytic effect of nickel and magnetite. Fuel 2018, 222, 74–82. [Google Scholar] [CrossRef]
  17. Gao, J.; Zou, C.; Li, W.; Ni, Y.; Yuan, Y. Transition metal catalysis in natural gas generation: Evidence from nonhydrous pyrolysis experiment. Mar. Pet. Geol. 2020, 115, 104280. [Google Scholar] [CrossRef]
  18. Medina, J.C.; Butala, S.J.; Bartholomew, C.H.; Lee, M.L. Low temperature iron-and nickel-catalyzed reactions leading to coalbed gas formation. Geochim. Cosmochim. Acta 2000, 64, 643–649. [Google Scholar] [CrossRef]
  19. Seewald, J.S.; Eglinton, L.B.; Ong, Y.L. An experimental study of organic-inorganic interactions during vitrinite maturation. Geochim. Cosmochim. Acta 2000, 64, 1577–1591. [Google Scholar] [CrossRef]
  20. Lewan, M.D. Experiments on the role of water in petroleum formation. Geochim. Cosmochim. Acta 1997, 61, 3691–3723. [Google Scholar] [CrossRef]
  21. Seewald, J.S. Organic–inorganic interactions in petroleum-producing sedimentary basins. Nature 2003, 426, 327–333. [Google Scholar] [CrossRef] [PubMed]
  22. Hill, R.J.; Jarvie, D.M.; Zumberge, J.; Henry, M.; Pollastro, R.M. Oil and gas geochemistry and petroleum systems of the Fort Worth Basin. AAPG Bull. 2007, 91, 445–473. [Google Scholar] [CrossRef] [Green Version]
  23. Jarvie, D.M.; Hill, R.J.; Ruble, T.E.; Pollastro, R.M. Unconventional shale-gas systems: The Mississippian Barnett Shale of north-central Texas as one model for thermogenic shale-gas assessment. AAPG Bull. 2007, 91, 475–499. [Google Scholar] [CrossRef]
  24. Curtis, J.B. Fractured shale-gas systems. AAPG Bull. 2002, 86, 1921–1938. [Google Scholar]
  25. Li, E.T.; Pan, C.C.; Yu, S.; Jin, X.D.; Liu, J.Z. Hydrocarbon generation from coal, extracted coal and bitumen rich coal in confined pyrolysis experiments. Org. Geochem. 2013, 64, 58–75. [Google Scholar] [CrossRef]
  26. Jüntgen, H.; Van Heek, K.H. An update of German non-isothermal coal pyrolysis work. Fuel Process. Technol. 1979, 2, 261–293. [Google Scholar] [CrossRef]
  27. Jüntgen, H. Review of the kinetics of pyrolysis and hydropyrolysis in relation to the chemical constitution of coal. Fuel 1984, 63, 731–737. [Google Scholar] [CrossRef]
  28. Wagner, R.; Wanzl, W.; van Heek, K.H. Influence of transport effects on pyrolysis reaction of coal at high heating rates. Fuel 1985, 64, 571–573. [Google Scholar] [CrossRef]
  29. Inan, S.; Yalçin, M.N.; Mann, U. Expulsion of oil from petroleum source rocks: Inferences from pyrolysis of samples of unconventional grain size. Org. Geochem. 1998, 29, 45–61. [Google Scholar] [CrossRef]
  30. Inan, S. Gaseous hydrocarbons generated during pyrolysis of petroleum source rocks using unconventional grain-size: Implications for natural gas composition. Org. Geochem. 2000, 31, 1409–1418. [Google Scholar] [CrossRef]
  31. Lewan, M.D. Laboratory simulation of petroleum formation: Hydrous pyrolysis. In Organic Geochemistry-Principles and Applications; Engel, M., Macko, S., Eds.; Plenum Press: New York, NY, USA, 1993; pp. 419–442. [Google Scholar]
  32. Shao, D.Y.; Ellis, G.S.; Li, Y.F.; Zhang, T.W. Experimental investigation of the role of rock fabric in gas generation and expulsion during thermal maturation: Anhydrous closed-system pyrolysis of a bitumen-rich Eagle Ford Shale. Org. Geochem. 2018, 119, 22–35. [Google Scholar] [CrossRef]
  33. Liu, Y.K.; Xiong, Y.Q.; Li, Y.; Peng, P.A. Effects of oil expulsion and pressure on nanopore development in highly mature shale: Evidence from a pyrolysis study of the Eocene Maoming oil shale, south China. Mar. Pet. Geol. 2017, 86, 526–536. [Google Scholar] [CrossRef]
  34. Li, K.; Lu, H.; Zhao, Z.F.; Peng, P.A.; Hsu, C.S. Hydroconversion for Hydrocarbon Generation of Highly Overmature Kerogens under Fischer–Tropsch Synthesis Conditions. Energy Fuels 2021, 35, 7808–7818. [Google Scholar] [CrossRef]
  35. Ma, X.X.; Zheng, G.D.; Sajjad, W.; Wang, X.; Fan, Q.H.; Zheng, J.J.; Xia, Y.Q. Influence of minerals and iron on natural gases generation during pyrolysis of type-III kerogen. Mar. Pet. Geol. 2018, 89, 216–224. [Google Scholar] [CrossRef]
  36. Kissin, Y.V. Catagenesis and composition of petroleum: Origin of n-alkanes and isoalkanes in petroleum crude. Geochim. Cosmochim. Acta 1987, 51, 2445–2457. [Google Scholar] [CrossRef]
  37. Liao, L.L.; Wang, Y.; Chen, C.S.; Shi, S.Y.; Deng, R. Kinetic study of marine and lacustrine shale grains using Rock-Eval pyrolysis: Implications to hydrocarbon generation, retention and expulsion. Mar. Pet. Geol. 2018, 89, 164–173. [Google Scholar] [CrossRef]
  38. Gao, Y.P.; Long, Q.L.; Su, J.S.; He, J.Y.; Guo, P. Approaches to improving the porosity and permeability of Maoming oil shale, South China. Oil Shale 2016, 33, 216–227. [Google Scholar] [CrossRef] [Green Version]
  39. Tannenbaum, E.; Kaplan, I.R. Low-Mr hydrocarbons generated during hydrous and dry pyrolysis of kerogen. Nature 1985, 317, 708–709. [Google Scholar] [CrossRef]
  40. Tannenbaum, E.; Kaplan, I.R. Role of minerals in the thermal alteration of organic matter—I: Generation of gases and condensates under dry condition. Geochim. Cosmochim. Acta 1985, 49, 2589–2604. [Google Scholar] [CrossRef]
  41. Pan, C.C.; Geng, A.S.; Zhong, N.N.; Liu, J.Z.; Yu, L.P. Kerogen pyrolysis in the presence and absence of water and minerals. 1. Gas components. Energy Fuels 2008, 22, 416–427. [Google Scholar] [CrossRef]
  42. Rahman, H.M.; Kennedy, M.; Löhr, S.; Dewhurst, D.N. Clay-organic association as a control on hydrocarbon generation in shale. Org. Geochem. 2017, 105, 42–55. [Google Scholar] [CrossRef]
  43. Javadpour, F.; Fisher, D.; Unsworth, M. Nanoscale gas flow in shale gas sediments. J. Can. Pet. Technol. 2007, 46, PETSOC-07-10-06. [Google Scholar] [CrossRef]
  44. Javadpour, F. Nanopores and Apparent Permeability of Gas Flow in Mudrocks (Shales and Siltstone). J. Can. Pet. Technol. 2009, 48, 16–21. [Google Scholar] [CrossRef]
  45. Ross, D.; Bustin, R.M. The importance of shale composition and pore structure upon gas storage potential of shale gas reservoirs. Mar. Pet. Geol. 2009, 26, 916–927. [Google Scholar] [CrossRef]
  46. Zhang, T.; Ellis, G.S.; Ruppel, S.C. Effect of organic-matter type and thermal maturity on methane adsorption in shale-gas systems. Org. Geochem. 2012, 47, 120–131. [Google Scholar] [CrossRef]
  47. Zargari, S.; Canter, K.L.; Prasad, M. Porosity evolution in oil-prone source rocks. Fuel 2015, 153, 110–117. [Google Scholar] [CrossRef]
  48. Guo, H.; Jia, W.; He, R. Distinct evolution trends of nanometer-scale pores displayed by the pyrolysis of organic matter-rich lacustrine shales: Implications for the pore development mechanisms. Mar. Pet. Geol. 2020, 121, 104622. [Google Scholar] [CrossRef]
  49. Behar, F.; Kressmann, S.; Rudkiewicz, J.L.; Vandenbrcoucke, M. Experimental simulation in a confined system and kinetic modelling of kerogen and oil cracking. Org. Geochem. 1992, 19, 173–189. [Google Scholar] [CrossRef]
  50. Loucks, R.G.; Reed, R.M.; Ruppel, S.C.; Jarvie, D.M. Morphology, genesis, and distribution of nanometer-scale pores in siliceous mudstones of the Mississippian Barnett Shale. J. Sediment. Res. 2009, 79, 848–861. [Google Scholar] [CrossRef] [Green Version]
  51. Slatt, R.M.; O’Brien, N.R. Pore types in the Barnett and Woodford gas shales: Contribution to understanding gas storage and migration pathways in fine-grained rocks. AAPG Bull. 2011, 95, 2017–2030. [Google Scholar] [CrossRef]
  52. Krooss, B.M. Experimental investigation of the molecular migration of C1–C6 hydrocarbons: Kinetics of hydrocarbon release from source rocks. Org. Geochem. 1988, 13, 513–523. [Google Scholar] [CrossRef]
  53. Clayton, C. Carbon isotope fractionation during natural gas generation from kerogen. Mar. Pet. Geol. 1991, 8, 232–240. [Google Scholar] [CrossRef]
  54. Price, L.C. Thermal stability of hydrocarbons in nature: Limits, evidence, characteristics, and possible controls. Geochim. Cosmochim. Acta 1993, 57, 3261–3280. [Google Scholar] [CrossRef]
  55. Whiticar, M.J. Stable isotope geochemistry of coals, humic kerogens and related natural gases. Int. J. Coal Geol. 1996, 32, 191–215. [Google Scholar] [CrossRef]
  56. Rice, D.D.; Threlkeld, C.N.; Vuletich, A.K. Character, origin and occurrence of natural gases in the Anadarko basin, southwestern Kansas, western Oklahoma and Texas Panhandle, USA. Chem. Geol. 1988, 71, 149–157. [Google Scholar] [CrossRef]
  57. Palacas, J.G.; Anders, D.E.; King, J.D. South Florida basin—A prime example of carbonate source rocks of petroleum. AAPG Bull. 1984, 18, 71–96. [Google Scholar]
  58. Horsfield, B. Pyrolysis studies and petroleum exploration. Adv. Pet. Geochem. 1984, 1, 247–298. [Google Scholar]
  59. Tiem, V.T.A.; Horsfield, B.; Sykes, R. Influence of in-situ bitumen on the generation of gas and oil in New Zealand coals. Org. Geochem. 2008, 39, 1606–1619. [Google Scholar]
  60. Mansuy, L.; Landais, P.; Ruau, O. Importance of the reacting medium in artificial maturation of a coal by confined pyrolysis. 1. Hydrocarbons and polar compounds. Energy Fuels 1995, 9, 691–703. [Google Scholar] [CrossRef]
  61. Li, E.T.; Pan, C.C.; Yu, S.; Jin, X.D.; Liu, J.Z. Interaction of coal and oil in confined pyrolysis experiments: Insight from the yields and carbon isotopes of gas and liquid hydrocarbons. Mar. Pet. Geol. 2016, 69, 13–37. [Google Scholar] [CrossRef]
  62. Price, L.C.; Schoell, M. Constraints on the origins of hydrocarbon gas from compositions of gases at their site of origin. Nature 1995, 378, 368–371. [Google Scholar] [CrossRef] [PubMed]
Figure 1. Examples of core plugs drilled from bulk Maoming oil shale.
Processes 11 00894 g001
Figure 2. Basic experimental procedure of this study.
Processes 11 00894 g002
Figure 3. XRD spectra of powdered rock and kerogen of Maoming oil shale.
Processes 11 00894 g003
Figure 4. Hydrocarbon yield generated from pyrolysis of core plugs, powdered rock and kerogen of Maoming oil shale. (a) Heavy hydrocarbons (C14+); (b) light hydrocarbons (C6-14); (c) wet gas (∑C2-5); (d) methane (C1).
Processes 11 00894 g004
Figure 5. Individual gaseous hydrocarbon yield generated by pyrolysis of core plugs, powdered rock and kerogen of Maoming oil shale. (a) Ethane (C2); (b) propane (C3); (c) butane (C4); (d) pentane (C5).
Processes 11 00894 g005
Figure 6. The dryness ratio varies with temperature.
Processes 11 00894 g006
Figure 7. The isomerization ratio varies with temperature. (a) iC4/nC4; (b) iC5/nC5.
Processes 11 00894 g007
Figure 8. Yield ratio of individual gaseous hydrocarbons of core plugs to powdered rock.
Processes 11 00894 g008
Figure 9. Possible effects of minerals on hydrocarbon pool in nature. (a) The left panel tends to minimize the retention effect; (b) the right panel tends to maximize the retention effect.
Processes 11 00894 g009
Table 1. Basic geochemical data and mineral composition of kerogen, powdered rock and core plugs of Maoming oil shale.
TOC
(wt%)
HI
(mg/g TOC)
Tmax
(°C)
S1
(mg/g Sample)
S2
(mg/g Sample)
S3
(mg/g Sample)
Quartz (%)Illite
(%)
Kaolite
(%)
Kerogen686674353.56453.8712.9510000
Powdered rock22.896054281.53138.414.319.665.215.2
Core plug23.026004271.61138.204.121.26414.8
Table 2. Yields of gaseous, liquid hydrocarbons and inorganic gases generated by pyrolysis of kerogen, powdered rock and core plugs of Maoming oil shale.
SeriesC1C2H6C2H4C3H8C3H6iC4nC4iC5nC5H2CO2H2S∑C1-5∑C2-5∑C6-14C14+C1/∑C1-5iC4/
nC4
iC5/nC5
MK-3121.68 0.61 0.00 0.52 0.01 0.14 0.15 0.04 0.06 0.05 61.88 0.85 3.22 1.54 3.72 94.13 0.52 0.95 0.76
MK-3363.34 1.73 0.00 1.49 0.02 0.30 0.50 0.13 0.19 0.05 74.26 1.43 7.71 4.37 6.89 194.43 0.43 0.61 0.69
MK-3606.89 5.21 0.01 4.32 0.03 0.68 1.67 0.36 0.66 0.04 92.38 2.91 19.82 12.93 15.30 361.27 0.35 0.41 0.55
MK-38414.38 12.90 0.01 10.71 0.06 1.56 4.68 0.92 1.93 0.09 113.48 5.95 47.15 32.77 33.57 310.18 0.31 0.33 0.48
MK-40825.05 22.10 0.01 19.48 0.13 2.84 9.13 1.79 3.84 0.16 115.31 7.04 84.38 59.33 48.73 160.75 0.30 0.31 0.47
MK-43242.02 38.64 0.03 38.95 0.41 5.64 20.70 3.74 9.24 0.24 119.23 7.09 159.38 117.36 77.16 104.32 0.26 0.27 0.40
MK-45675.26 78.91 0.09 86.67 0.81 12.64 44.80 5.96 14.88 0.35 128.25 9.08 320.00 244.74 37.42 31.94 0.24 0.28 0.40
MK-480122.36 112.45 0.13 102.08 0.69 16.74 22.02 1.52 1.48 0.53 130.31 8.48 379.48 257.12 26.89 33.02 0.32 0.76 1.03
MK-504180.59 124.46 0.19 66.29 0.50 4.61 5.95 0.40 0.39 0.77 136.92 8.15 383.39 202.80 20.93 24.60 0.47 0.77 \
MK-528235.98 118.52 0.14 17.21 0.19 0.72 0.55 0.05 0.08 1.00 142.03 7.84 373.45 137.47 10.72 23.42 0.63 \\
MK-552295.25 71.54 0.06 0.99 0.03 0.02 0.09 0.00 0.01 1.36 142.44 7.33 368.00 72.75 9.74 0.00 0.80 \\
MK-576332.18 31.50 0.04 0.33 0.01 0.00 0.02 0.00 0.00 1.54 147.44 6.66 364.09 31.91 6.79 0.00 0.91 \\
MK-600366.51 6.55 0.02 0.42 0.01 0.07 0.06 0.00 0.00 1.62 146.78 7.22 373.64 7.13 2.20 0.00 0.98 \\
MP-3121.70 0.58 0.01 0.54 0.02 0.15 0.14 0.04 0.05 0.00 79.90 0.00 3.22 1.52 24.44 125.63 0.53 0.04 0.93
MP-3363.37 1.44 0.01 1.30 0.03 0.31 0.40 0.12 0.14 0.00 86.07 0.00 7.13 3.76 33.46 166.20 0.47 0.78 0.83
MP-3607.06 4.06 0.01 3.52 0.06 0.73 1.26 0.30 0.45 0.02 132.34 0.00 19.82 12.93 42.09 195.10 0.36 0.58 0.68
MP-38413.76 10.33 0.02 9.14 0.16 1.63 3.70 0.82 1.33 0.10 160.65 1.05 40.89 27.13 65.90 203.61 0.34 0.44 0.61
MP-40826.92 20.76 0.04 17.51 0.34 2.57 6.60 1.23 2.07 0.20 180.15 1.53 78.05 51.13 117.09 185.81 0.34 0.39 0.59
MP-43247.38 43.88 0.07 42.56 0.71 5.97 18.95 3.22 6.07 0.33 207.87 2.19 172.59 121.42 98.92 76.40 0.27 0.32 0.53
MP-45678.41 81.81 0.16 84.92 1.25 12.61 35.84 4.68 8.00 0.48 202.30 0.00 313.96 229.27 48.75 39.79 0.25 0.35 0.58
MP-480132.86 111.49 0.20 95.31 0.86 14.78 15.12 0.82 0.54 0.63 220.52 2.56 371.99 239.13 41.40 11.92 0.36 0.98 0.50
MP-504184.01 117.47 0.38 45.30 0.78 3.80 2.26 0.17 0.12 0.87 219.64 2.62 369.00 170.28 38.51 28.45 0.50 0.68 \
MP-528241.82 106.33 0.12 6.31 0.08 0.16 0.14 0.01 0.01 1.39 248.65 2.60 374.31 113.15 24.30 6.63 0.65 \\
MP-552291.73 54.31 0.05 0.46 0.01 0.01 0.02 0.00 0.00 1.80 265.14 2.54 369.93 54.87 18.53 \0.79 \\
MP-576328.96 18.55 0.03 0.11 0.00 0.00 0.00 0.00 0.00 2.05 281.53 2.14 373.97 18.70 10.37 \0.88 \\
MP-600353.50 2.19 0.01 0.01 0.00 0.00 0.00 0.00 0.00 2.79 287.56 0.00 384.00 2.21 6.55 \0.92 \\
MC-3121.15 0.32 0.00 0.25 0.01 0.06 0.05 0.02 0.02 0.01 60.18 0.00 1.88 0.73 18.83 118.89 0.61 1.13 0.84
MC-3362.82 1.07 0.01 0.81 0.02 0.17 0.21 0.05 0.07 0.00 79.39 0.00 5.22 2.41 27.52 150.11 0.54 0.83 0.76
MC-3606.67 3.74 0.01 3.02 0.06 0.57 0.98 0.22 0.35 0.02 123.01 0.00 15.62 8.95 39.34 182.33 0.43 0.58 0.63
MC-38413.18 9.53 0.02 7.82 0.18 1.28 2.87 0.60 1.05 0.10 149.32 1.55 36.52 23.35 65.01 198.94 0.36 0.45 0.57
MC-40822.62 17.46 0.05 14.59 0.42 2.13 5.57 1.12 1.95 0.21 163.03 2.46 65.92 43.29 108.26 171.19 0.34 0.38 0.58
MC-43244.75 38.81 0.12 36.40 1.23 4.70 16.07 2.56 5.50 0.29 178.66 4.41 150.14 105.39 88.75 62.67 0.30 0.29 0.46
MC-45682.72 78.08 0.23 73.03 1.81 10.38 29.89 3.87 6.67 0.42 192.60 3.15 286.68 203.95 44.03 36.04 0.29 0.35 0.58
MC-480138.75 107.74 0.27 74.79 1.28 11.56 9.94 0.77 0.59 0.56 195.42 2.84 345.71 206.95 39.36 19.75 0.40 1.16 1.31
MC-504190.01 102.36 0.33 34.60 0.79 2.59 2.10 0.15 0.14 0.65 200.32 1.86 333.07 143.06 31.77 25.24 0.57 \\
MC-528234.26 74.10 0.19 5.33 0.20 0.20 0.20 0.00 0.00 0.91 210.58 3.12 314.48 80.22 22.89 7.40 0.74 \\
MC-552291.39 45.28 0.08 0.47 0.03 0.01 0.02 0.00 0.00 1.30 231.89 1.80 337.27 45.88 20.61 0.00 0.86 \\
MC-576339.23 21.09 0.04 0.14 0.01 0.00 0.00 0.00 0.00 1.98 249.37 2.98 360.51 21.28 12.68 0.00 0.94 \\
MC-600340.69 6.40 0.02 0.03 0.00 0.00 0.00 0.00 0.00 2.35 275.25 1.27 347.14 6.45 6.390.00 0.98 \\
Note: MC: core plugs; MP: powdered rock; MK: kerogen; 312/336: pyrolysis temperature.
Table 3. Yields of hydrocarbon retention and proportion for core plugs and powdered rock.
Sample FormC14+ RetainedRetention ProportionSample FormC14+ RetainedRetention Proportion
MP-312//MC-312//
MP-33628.2314.52MC-33644.3222.79
MP-360166.1746.00MC-360178.9449.53
MP-384106.5734.36MC-384111.2435.86
MP-408//MC-408//
MP-43227.9226.76MC-43241.6539.93
MP-456//MC-456//
MP-48021.1063.90MC-48013.2740.19
MP-504//MC-504//
MP-52816.7971.69MC-52816.0268.40
Disclaimer/Publisher’s Note: The statements, opinions and data contained in all publications are solely those of the individual author(s) and contributor(s) and not of MDPI and/or the editor(s). MDPI and/or the editor(s) disclaim responsibility for any injury to people or property resulting from any ideas, methods, instructions or products referred to in the content.

