Article

Adsorption of Methylene Blue by Bentonite Supported Nano Zero Valent Iron (B-nZVI)

by
Nur ‘Aishah Zarime
1,*,
Badariah Solemon
1,
Wan Zuhairi Wan Yaacob
2,
Habibah Jamil
2,
Rohayu Che Omar
1,
Abdul Ghani Rafek
1 and
Rasyikin Roslan
1
1
Institute of Energy Infrastructure (IEI), Universiti Tenaga Nasional (UNITEN), Putrajaya Campus, Jalan IKRAM-UNITEN, Kajang 43000, Selangor, Malaysia
2
Department of Earth Sciences and Environmental, Faculty of Science and Technology, Universiti Kebangsaan Malaysia, Bangi 43600, Selangor, Malaysia
*
Author to whom correspondence should be addressed.
Processes 2023, 11(3), 788; https://doi.org/10.3390/pr11030788
Submission received: 17 November 2022 / Revised: 5 January 2023 / Accepted: 16 January 2023 / Published: 7 March 2023
(This article belongs to the Section Materials Processes)

Abstract

:
Dyes used in textiles, foods, cosmetics, and chemicals have become a major environmental pollution issue around the world. To address this issue, a number of technologies have been created to remove these pollutants from the environment. Due to their superior properties at nanoscale, numerous nanomaterials have been applied to remove dyes from polluted waters. This research presents the findings of the development of bentonite nano zero-valent iron (B-nZVI) for the treatment of synthetic cationic dyes. This study has three objectives: (i) to produce bentonite nano zero-valence iron (B-nZVI), (ii) to characterize its adsorbents (B-nZVI), (iii) to characterize its adsorption capacity. Four main tests were used for this purpose: (i) a physical test (Brunauer–Emmett–Teller (BET) surface area), (ii) a chemical test (cation exchange capacity (CEC) and X-ray fluorescence (XRF)), (iii) morphology (field emission scanning electron microscopy (FESEM) and (iv) mineralogy (Fourier transform infrared spectroscopy (FTIR). The five factors for the batch equilibrium test are adsorbent dose, concentration, kinetic, pH, and temperature. The batch test showed that the optimum dose for all adsorbents is 0.5 g. For the concentration factor, B-nZVI exhibits larger adsorption capacity (KL = 30,314.0536 L/g; R2 = 1) compared to bentonite (Kd = 0.0219 L/g; R2 = 0.8892). The kinetic factor showed that the adsorption capacity by pseudo-second-order model was the best for both adsorbents (qe = 1.2038 mg/g, R2 = 0.9993 for bentonite and qe = 6.9979 mg/g, R2 = 1 for B-nZVI). For B-nZVI, the interparticle diffusion model (Kf = 0.8645 m2 g−1 min L−1; R2 = 0.9) and intraparticle diffusion model (Kd = 2.3829 m2 g−1 min L−1; R2 = 0.9189) showed a good correlation with the adsorption data, while bentonite showed a lower correlation with the interparticle diffusion model (Kf = 0.0002 m2 g−1 min L−1; R2 = 0.6253) and intraparticle diffusion model (Kd = 0.2886 m2 g−1 min L−1; R2 = 0.6026), respectively. The pH factor showed that the adsorption capacity of bentonite (qe = 0.5674 mg/g) and B-nZVI (qe = 5.3284 mg/g) was highest in acidic conditions (pH 2). As for the temperature factor, there was no significant effect on bentonite and B-nZVI. Therefore, tests can be conducted at room temperature, saving energy. It was also concluded that B-nZVI is the best material for removing MB compared to bentonite and can be considered for the treatment materials of contaminated water.

1. Introduction

Water contamination caused by dye discharge into water bodies is a significant environmental problem [1]. The dyes can potentially physically, chemically, and biologically modify river and groundwater ecosystems, thereby endangering the health of human livestock, wildlife, fish, and other forms of life.
The daily use of dyes is widespread in the paper, printing, pharmaceutical, textile, and food industries [2]. The majority of dyes are synthetic in nature and contain complex aromatic structures, making them almost non-biodegradable and cannot be oxidized [3]. They are dispersed in large quantities from these industries in the form of aqueous waste [4]. One of the materials produced to treat environmental contamination is nano materials. Nano zero-valence iron (nZVI) is very safe for soil and underground water treatment [5]. It has a specific core–shell structure, with the core being distinguished by metallic iron or zero-valent (Fe0) and the shell being distinguished by the mixing of different iron oxides [Fe(II) and Fe(III)] as a result of the oxidation of Fe0 nanoparticles [6]. According to [7], nZVI material refers to zero-valent iron particles with a particle size of 1 to 100 nm. The nZVI particles can also break down contaminants by various mechanisms, including electrostatic attraction, redox reactions, surface processes, adsorption, ion exchange, and surface complexes [7]. The nZVI exploits its distinctive center shell structure to fix organic pollutants through adsorption that initiates a redox reaction. The oxide shell of nZVI particles serves as a destination for chemisorbed organic and inorganic contaminants, while the particle’s core serves as an electron source for redox processes [6]. According to studies by [8], the treatment of contaminated sites using nZVI particles has many benefits, including high reactivity, high mobility in porous media, long-life reactivity, low toxicity, and being easily oxidized when oxygen is present [6].
The author of [9] also found that the cobalt nanoparticles present in microgels could change the nitroarenes into less harmful aminoarenes. Nitroarenes are hazardous substances found in water. However, the limitation of nZVI is a tendency to aggregate and agglomerate. Agglomeration is the grouping of atoms or molecules by strong bonds and the combination of atoms by weak bonds due to Van der Waals forces [10,11]. To overcome agglomeration, composite nZVI particles with substances like resin [12], clay [13,14], magnetite [15], and rectorite [16] are produced. According to [17], clay is an abundant natural resource on earth, is inexpensive, and has a good structure used as a composite material. In this study, bentonite nano zero-valent iron (B-nZVI) is chosen to treat the cationic synthetic dye, methylene blue (MB). Three main objectives of this study were to produce bentonite nano zero valence iron, to characterize it as an adsorbent material, and to study its adsorption capacity.

2. Materials and Methods

2.1. Materials

The main material used in this study is bentonite purchased from R&M Chemicals and used without further treatment. The chemicals used in this study are iron chloride hexahydrate, FeCl3·6H2O (Acros organics, 99+%); sodium borohydrate, NaBH4 (Acros organics, 98+%); and ethanol, C2H6O (Fisher Scientific, 99.4%). These chemicals are used to synthesize zero-valence iron nanocomposite bentonite (B-nZVI). The synthetic dye methylene blue (MFM.F.: C16H18CIN3S·3H2O 319.85 g mol−1, λ maximum 668 nm) was used as a pollutant. Figure 1 shows the molecular structure of MB.

2.2. Methods

2.2.1. Synthesis of Bentonite Composite Nano Zero-Valent Iron (B-nZVI)

To synthesize B-nZVI, chemical reduction [19,20] was employed. An FeCl3·6H2O solution was prepared by mixing 4.38 g of FeCl3·6H2O and 50 mL of a mixture ethanol and deionized water (35 mL of ethanol + 15 mL of deionized water). About 4 g of bentonite was added to the FeCl3·6H2O solution. That solution was ultrasonically shaken for 30 min. For the preparation of sodium borohydride solution, 6.091 g of NaBH4 was weighed and mixed with 100 mL of deionized water. The NaBH4 solution was transferred to a pipette and then dropped into the FeCl3·6H2O solution (60–70 drops per minute). The mixture was stirred with a magnetic stirrer before being left for 20 min. The black particles of B-nZVI were filtered and washed with ethanol (50 mL) 3 times before they were dried in an oven for 12 h at a temperature of 50 °C.

2.2.2. Material Characterization

To identify the characterization of each adsorbent material, analysis using four types of tests is performed: physical tests (Brunauer–Emmett–Teller surface area (BET)), chemical tests (cation exchange capacity (CEC) and X-ray fluorescence (XRF)), morphological tests (field emission electron scanning (FESEM) and mineralogical tests (infrared spectroscopy Fourier transform (FTIR)).

2.2.3. Batch Equilibrium Test

Before the batch adsorption test was performed, the MB was prepared based on [2]. All synthetic dye solutions were analyzed using a UV-Vis spectrophotometer (UV1201). The pH of each solution was also determined using a Hanna Instrument HI 2211 pH Meter. The batch adsorption test was carried out based on [21]. About 0.5 g of adsorbent materials was added into the centrifuge tube. After that, 50 mL of MB solution (concentration 5 mg/L) was added to the centrifuge tube and marked as Co. The mixture was shaken using a Junior Orbital shaker at 150× g RPM for 3 h. The sample was then centrifuged at 1500× g RPM for 15 min using a Sigma 416S centrifuge to separate the sample and solution. The solution was also filtered with a 0.45 μm microcellulose membrane filter and analyzed using a UV-Vis spectrophotometer (UV1201). This solution was marked as C e . The amount of MB transferred from the solution to the adsorbents can be calculated using Formula (1) [22]. The graph of q e   against C e was plotted, while the K d value was determined from the slope of the graph.
q e   ( mg / g ) = C o C e V m
where q e (mg/g) is the amount of the MB removed from the solution; C o   (mg/L) is the initial concentration of MB solution; C f (mg/L) is the concentration in equilibrium, which is the final solution of the MB; V (L) is the volume used; and m (g) is the mass of the adsorbent sample.
The Langmuir model is the most common isotherm model used to analyze the adsorption of pollutants [23]. The Langmuir isotherm is also based on several assumptions: (i) the surface is homogeneous, (ii) adsorption is at a constant rate from certain adsorption sites, (iii) all adsorption sites are fixed, (iv) each adsorption site can only accommodate one molecule, and (v) there is no interaction between the adsorbed molecules with other or adjacent adsorption sites [24]. The calculation of the Langmuir isotherm is shown in Equation (2) and the linear equation for the Langmuir isotherm is shown in Equation (3). A graph of C e / q e against C e is also plotted to calculate the slope (1/ A m ), the y-intercept (1/ K L . A m ) and the R2 correlation. The value of the adsorption coefficient, K L determines the movement of pollutants through the adsorbent.
q e = K L A m C e 1 + K L . C e
Ce/qe = 1/KL Am + Ce/Am
where qe (mg/g) is the amount of dye adsorbed at the equilibrium phase; K L   (L/mg) is the Langmuir adsorption coefficient, which is closely related to the adsorption energy; A m (mg/g) is the maximum amount of adsorption of the dye at ion monolayer; and   C e (mg/L) is the equilibrium concentration of the dye.
The Freundlich isotherm is often used when it comes to heterogeneous adsorption [25]. The Freundlich model calculation is as shown in Equation (4) and the linear equation for the Freundlich isotherm is shown in Equation (5). The graph of log qe versus log Ce is plotted to calculate the slope (1/n), y-intercept (log K F ) and correlation R2.
q e   = K F C e 1 n
Log qe = logKF + (1/n) log Ce
where K F is the Freundlich adsorption coefficient, 1/n is the Freundlich adsorption exponent and Ce (mg/L) is the final equilibrium concentration of the dye.

3. Results and Discussion

3.1. Materials Characterization

The physical characterization of bentonite and B-nZVI, using the BET surface area, is shown in Table 1. The test showed that the B-nZVI has a lower total surface area and pore volume (5.6418 m²/g; 0.0226 cm³/g) than bentonite (74.7755 m²/g; 0.0994 cm³/g). Prior research by the authors of [26] has proven that the reduction of surface area in B-nZVI is due to increased iron content in B-nZVI. The pore size in B-nZVI (160.2891Å) is higher than the pore size in bentonite (53.1595 Å). This proves that nZVI particles have filled the interstitial space between the bentonite sheets.
The results of the chemical test are tabulated in Table 2. Bentonite showed the highest average CEC value (48.35 ± 6.70 meq/100 g), while for B-nZVI, it showed a lower CEC value (30.81 ± 3.33 meq/100 g). This was due to bentonite having a high clay fraction (<2 μm) compared to other adsorbent materials. According to [20], a large fraction of clay and organic matter contributes to a high CEC value, which in turn contributes to a high adsorption capacity of bentonites. Through XRF chemical analysis (Table 3), B-nZVI shows the highest percentage of Fe2O3, followed by Na2O. The Fe2O3 showed the presence of Fe ions (nZVI) and the presence of Na2O was due to nZVI being synthesized by NaBH4 and FeCl2·6H2O.
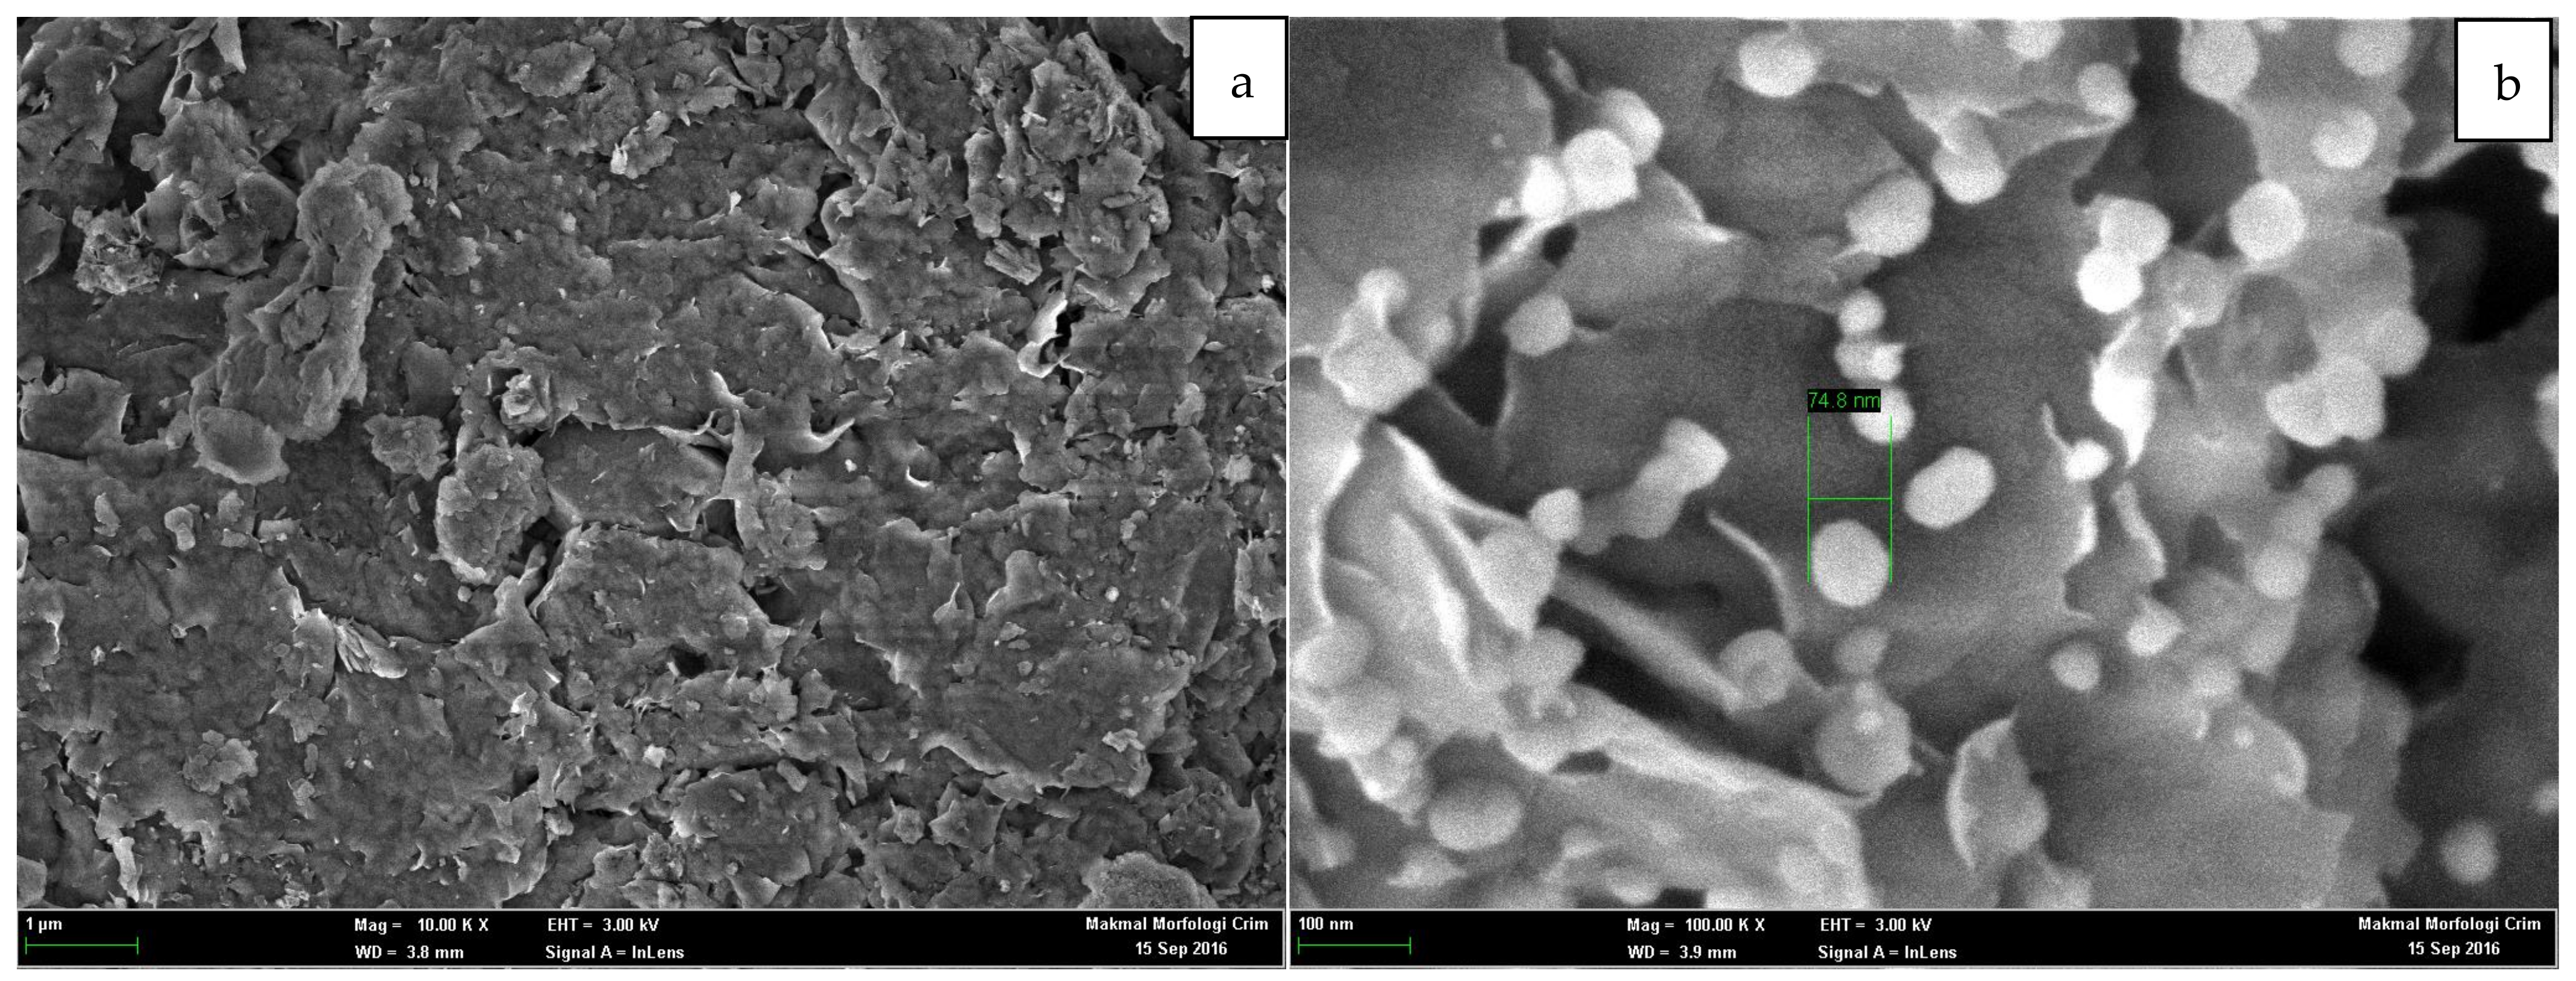
Field emission scanning electron microscopy (FESEM) images of bentonite and B-nZVI are shown in Figure 2. Bentonite shows a flaky texture while the B-nZVI shows the spherical texture of nZVI (the diameter ranged from 41.91 nm to 74.88 nm) that is well dispersed on the bentonite sheets. The nZVI in bentonite also does not form nanoparticle chains and is dispersed well. According to [28], there are exchangeable Fe3+ ions located on the hexagonal prisms and sodalite cages close to the clay mineral framework. These act as seed for the Fe0 growth, producing nZVI that is well dispersed on the clay mineral surfaces. Bentonite prevents the accumulation and agglomeration of nanoparticles and subsequently provides more active sites for the adsorption of contaminants [20]. The FTIR spectra for bentonite and B-nZVI are scanned in the wavelength range of 4000 cm−1 to 650 cm−1 and are shown in Figure 3. The vibration near to 3620 cm−1 in wavelength was due to the stretching of Al-OH in bentonite spectra and this findings are same with the study reported by [26]. Both bentonite and B-nZVI also displayed a larger adsorption band between 3250 cm−1 and 3550 cm−1. According to [29], these vibration ranged are corresponds to the vibration of hydroxyl groups in aliphatic and phenolic structures. The vibration peak at 1631 cm−1 (bentonite) and 3550 cm−1(B-nZVI) are also correspond to the stretching vibration of H-O-H in water species [26] and hydrogen-bonding of Si–O–H in bentonite [6]. The vibration at peak 1409 cm−1 in B-nZVI demonstrated its successful in synthesizing the composite nZVI. The bentonite not showing any peak at this peak due to not involved in synthesis of nZVI and this study showed the same result with the study by [29].

3.2. Adsorption Materials

There are five factors involved in MB adsorption by bentonite and B-nZVI. They are dose effect, concentration effect, kinetic effect, pH effect, and temperature effect.

3.2.1. Dose Effect

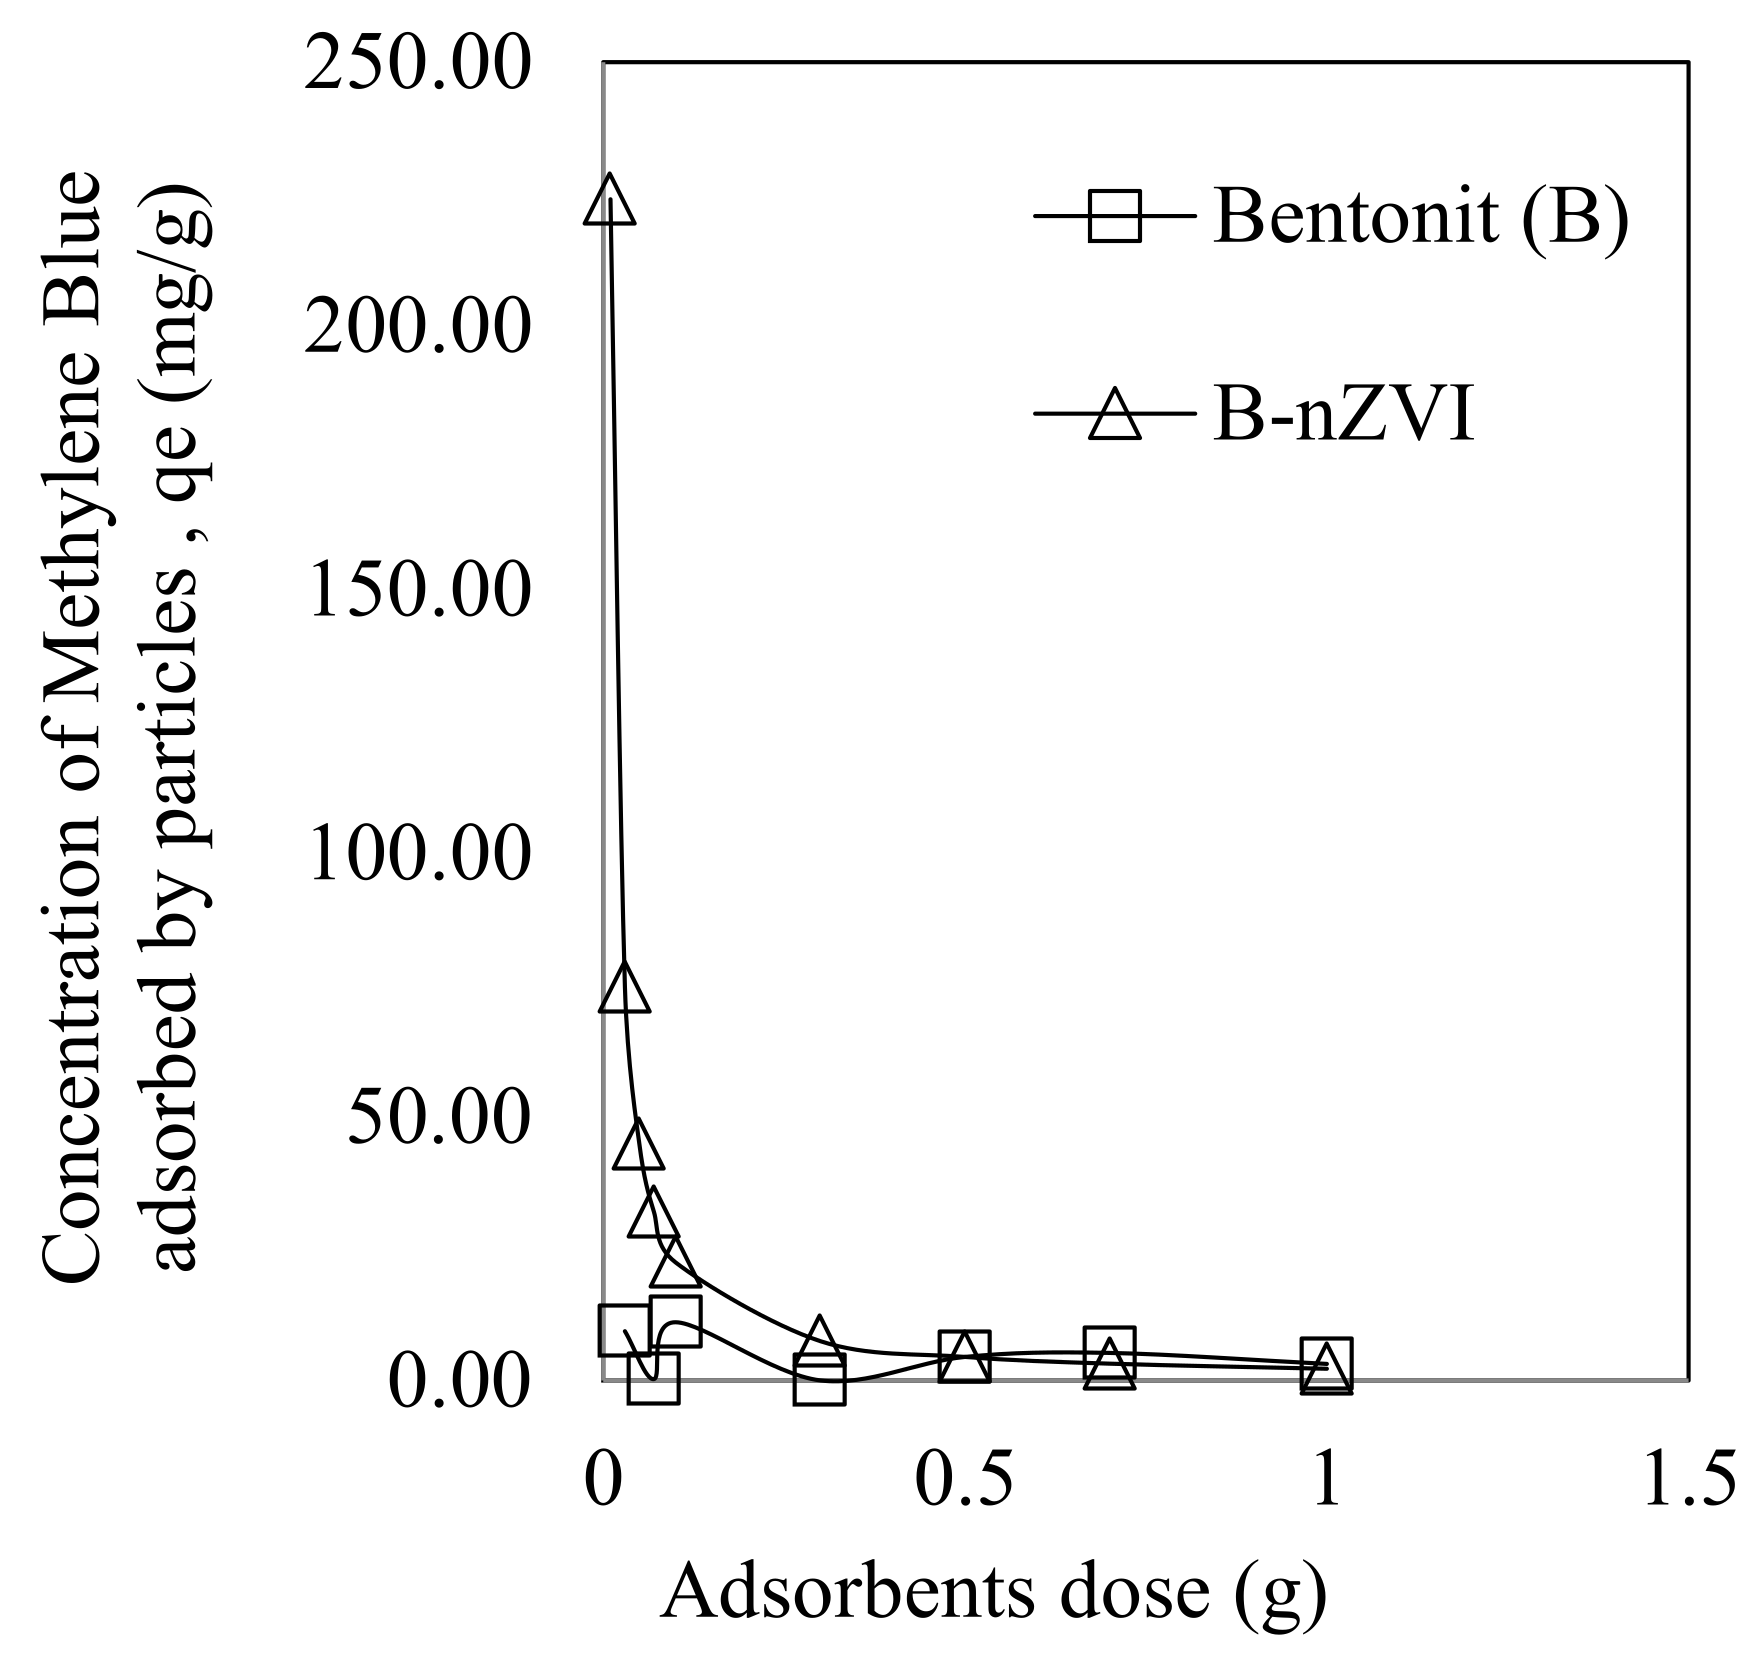
Figure 4 shows the impact of the adsorption capacity of MB using different adsorbent doses ranging from 0.01 g to 1.0 g. The adsorption curves for both bentonite and B-nZVI adsorbents showed that the adsorption rate decreases with increasing adsorbents. A previous study by the authors of [31] reported that at lower doses all active sites are fully exposed to the contaminants and caused higher adsorption until saturation occurs. The study by the author of [32] also supports the unsaturation of the active sites on the adsorbent surface during the adsorption process when the adsorbent dosage is increased. Furthermore, due to this the adsorption value, qe rises. The adsorption curve finally reaches a constant level, showing the most optimum adsorption rate. This study shows that the adsorbent dose of 0.5 g is an optimum adsorption value. Therefore, further testing was done using this dose.

3.2.2. Concentration Effect

Figure 5 shows the adsorption curve for the concentration effect. The adsorption curve of B-nZVI is along the y-axis up to the tested concentration of B-nZVI (17.24 mg/g). This implies that the adsorption is independent of the equilibrium concentration, Ce, since the plot is a vertical line along the y-axis. Similar results were reported in [33]. In contrast, for the bentonite case, the adsorption follows the shown curve. The adsorption curve of bentonite initially shows low adsorption, which increases with an increase in equilibrium concentration. For B-nZVI, from low concentrations to the tested maximum value (17.24 mg/g), the adsorption rate is maximal due to the availability of Fe particles in contact with MB. According to [33,34], adsorption sites are still available for adsorption activity. The adsorption isotherm can also be determined using an adsorption curve where the adsorption isotherm describes the interaction between the contaminants and adsorbent materials. Table 4 shows the adsorption value, Kd, using three isotherm models: linear, Langmuir, and Freundlich equations for both bentonite and B-nZVI. Bentonite shows a higher correlation on the linear equation model (Kd = 0.0219 L/g; R2 = 0.8892), while a lower correlation was reported by B-nZVI (Kd = 12.3610 L/g; R2 = 0.2740). For B-nZVI, the Kd value in the linear equation is not taken into account; however, the adsorption value from the Langmuir equation (KL = 30,314.0536 L/g; R2 = 1) and Freundlich equation (KF = 256.7438 L/g; R2 = 0.8111) can be used due to having higher correlations. The higher adsorption value by B-nZVI (Langmuir and Freundlich equations) also proves the higher adsorption capacity of B-nZVI towards MB.

3.2.3. Kinetic Effect

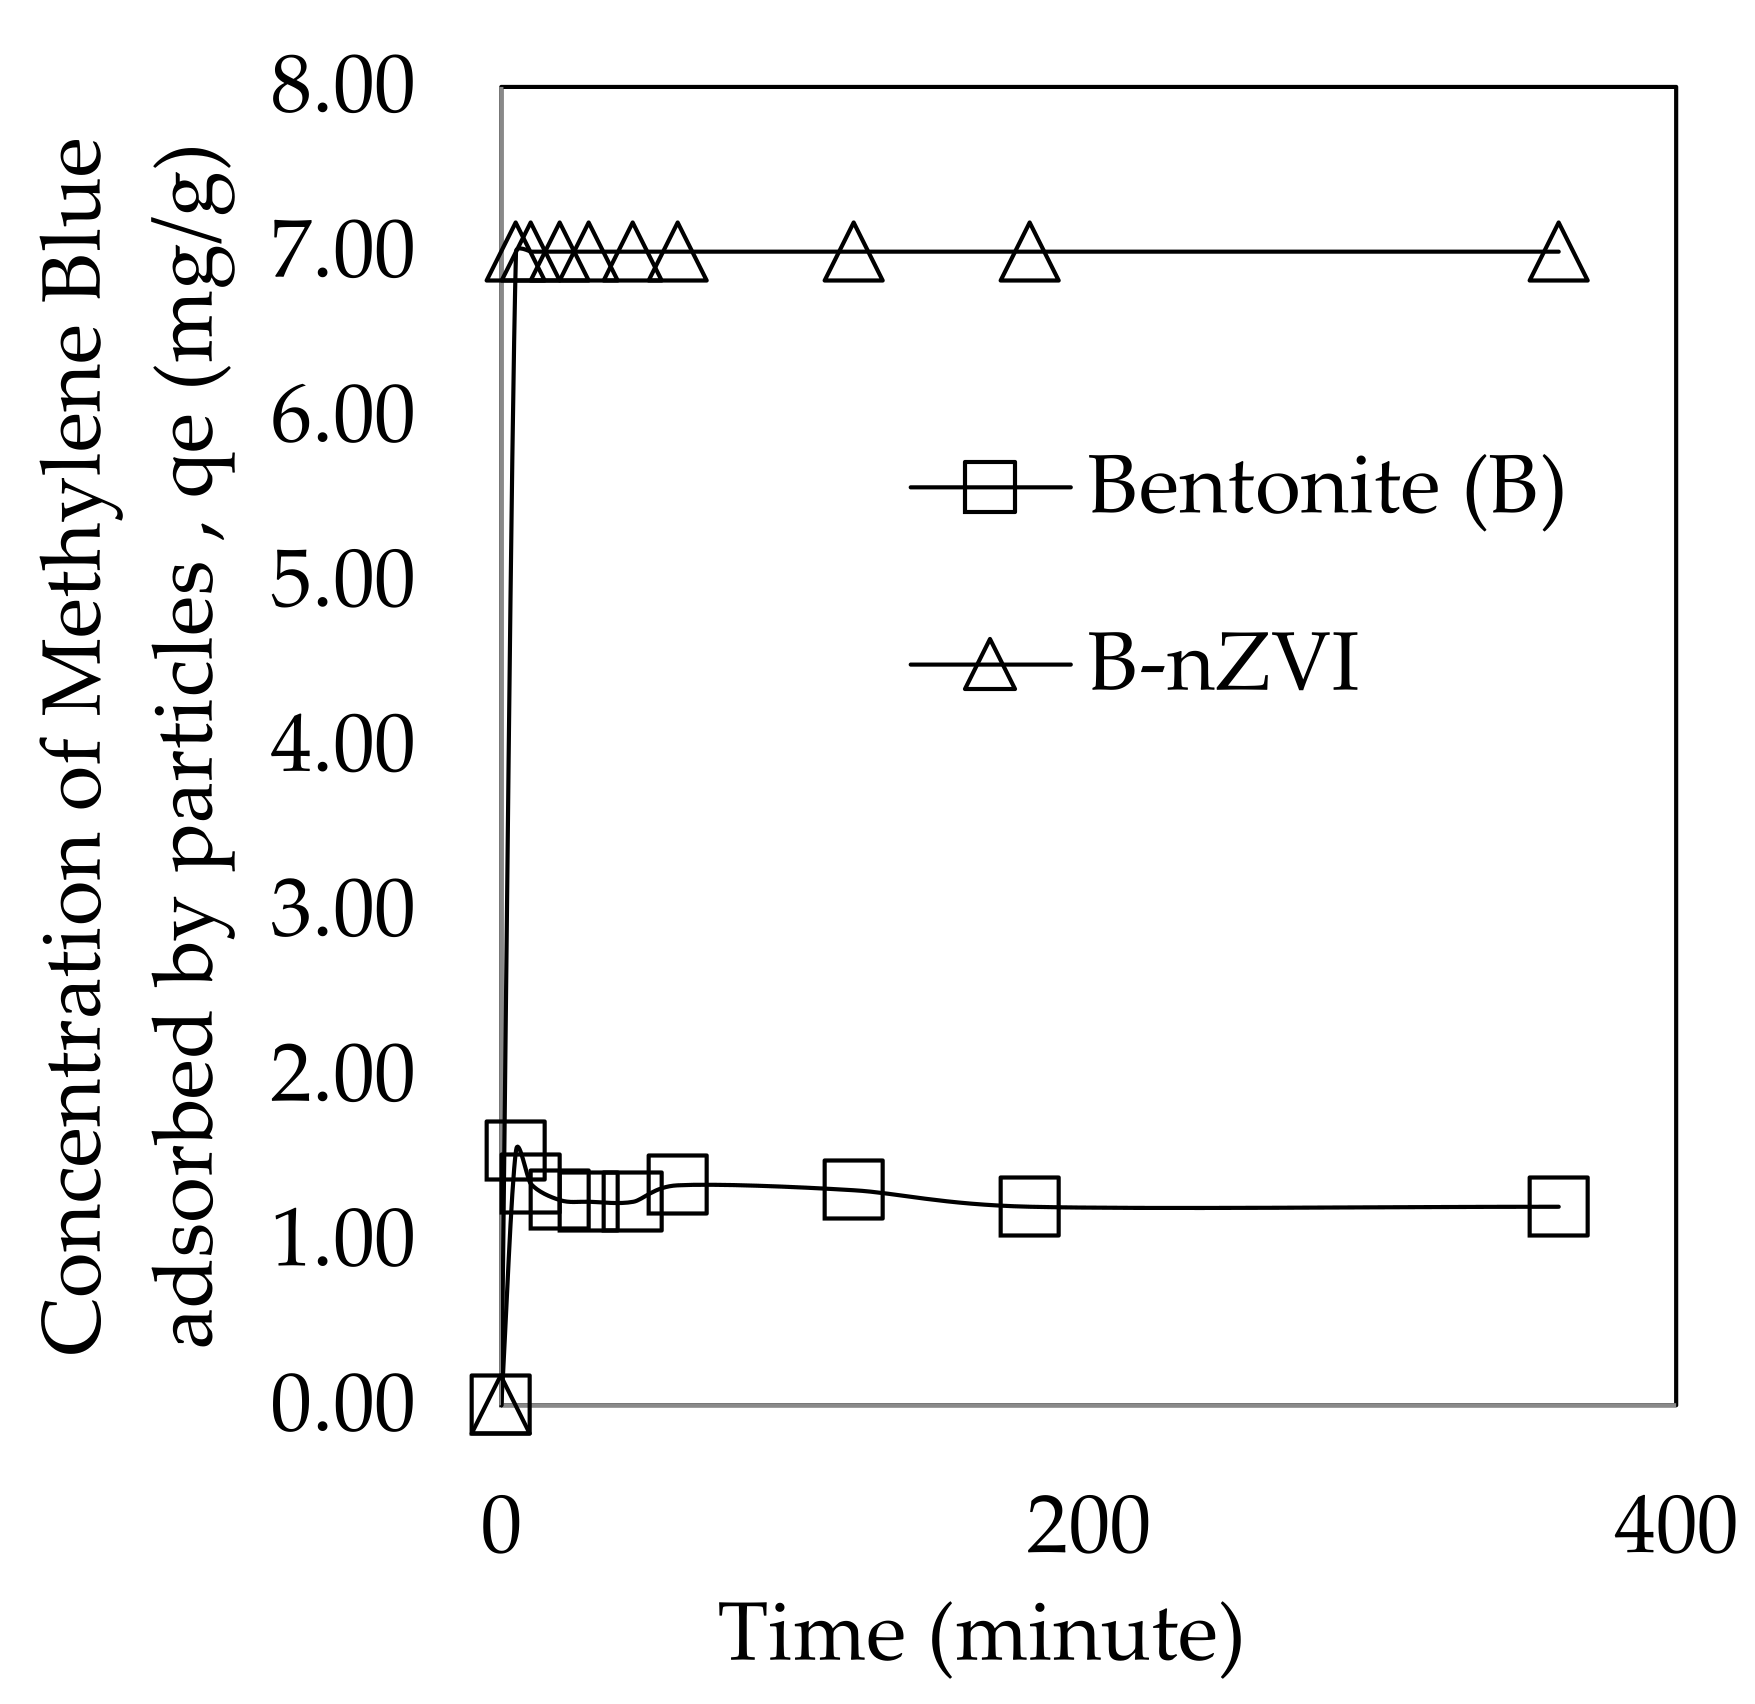
The adsorption capacity of MB versus time is shown in Figure 6. Both bentonite and B-nZVI adsorption curves show the same trend, linearly proportional at the beginning of adsorption. After 5 min, the adsorption curve becomes constant until 360 min. The curves are linear, indicating that the adsorption rate is at its highest. According to [35], at this point, the contaminants will initially be adsorbed on the active sites. After 5 min, the adsorption rate decreases and at this point the equilibrium adsorption has been achieved where the active sites are limited, causing the adsorption rate to decrease [32,36,37]. These findings are also similar to [38].
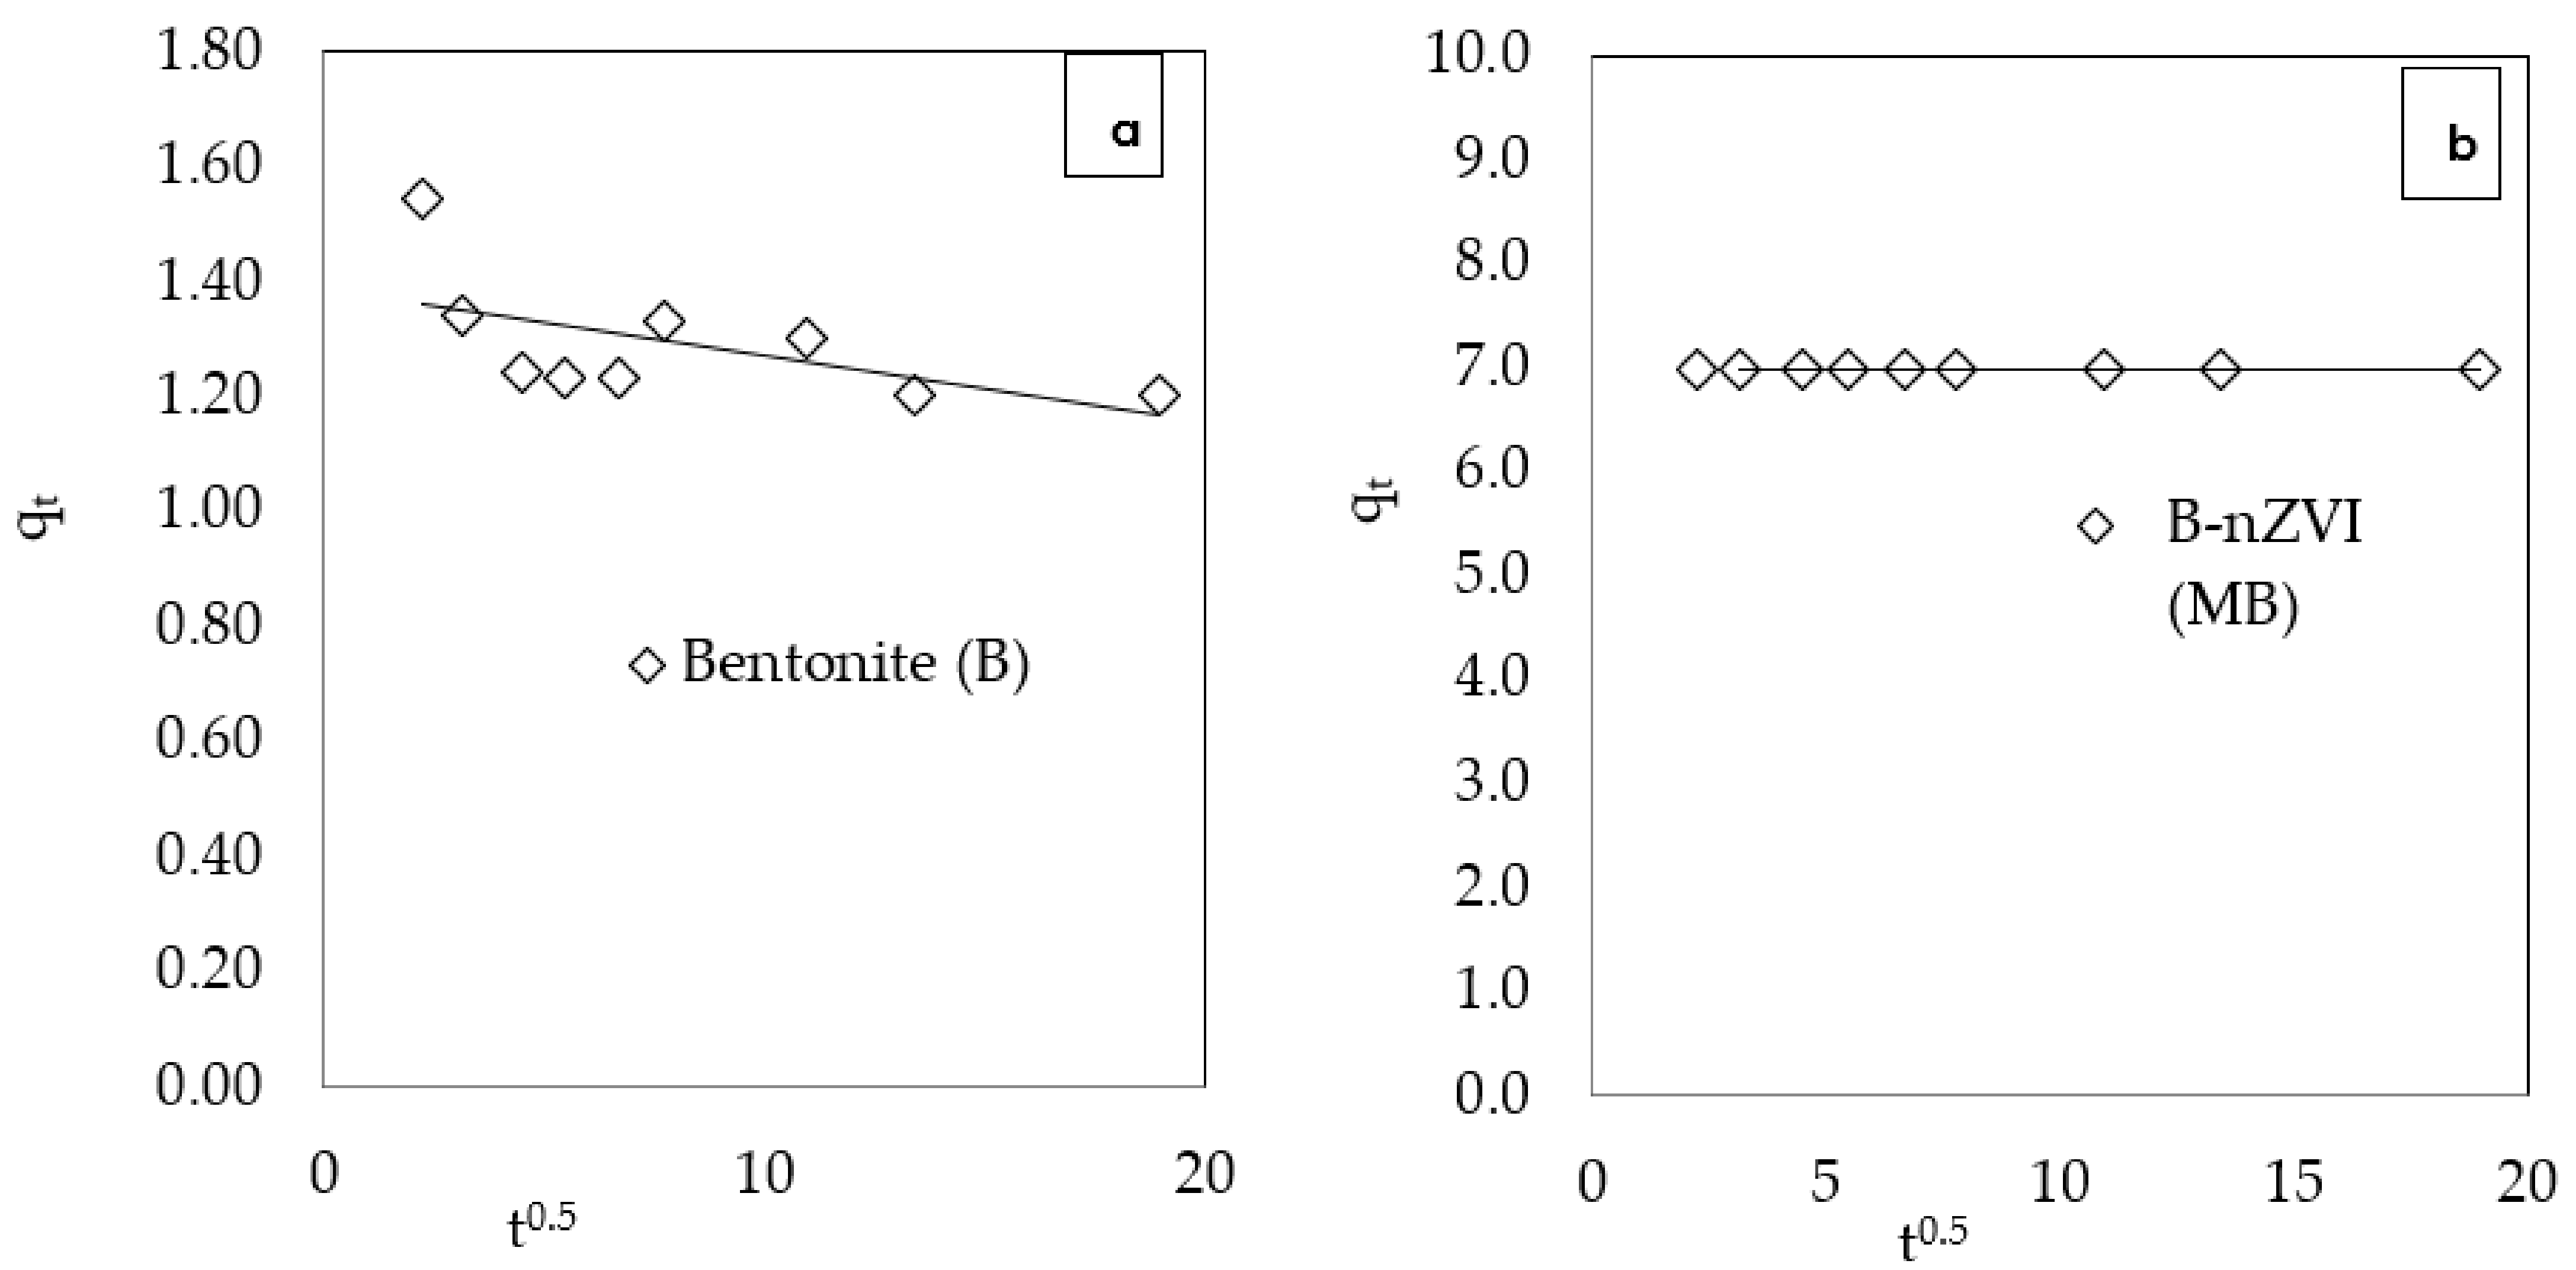
Figure 6 also shows that the adsorption capacity of B-nZVI (qe = 7.000 mg/g) is higher than bentonite (qe = 1.5447 mg/g). Bentonite shows a lower adsorption capacity due to a slightly acidic initial pH value of MB (pH = 6.6). This is due to excess H+ ions from acidic MB competing with the dye cations for active sites. The adsorption kinetic study of B-nZVI on MB showed excellent adsorption values and good correlation (Kf= 0.8645 m2 g−1 min L−1; R2 = 0.9). This indicates that MB is involved in the adsorption process on the outer surface of B-nZVI particles [39]. Bentonite shows a lower correlation value (R2 < 0.75) in the external diffusion model. This indicates that bentonite does not favor the adsorption of MB. Table 5 shows the results of the internal diffusion model, while Figure 7 shows the curve of qt versus t0.5. The intraparticle diffusion model by [40] states that (i) the plot of qt versus t0.5 should be linear if intraparticle diffusion is involved in the adsorption process, (ii) these lines should pass through the origin when the intraparticle diffusion is the rate-controlling step, and (iii) multi-step adsorption process occurs if two or more slopes appear in the plot.
The internal diffusion model analysis also shows that only B-nZVI has a higher correlation (R2 > 0.9) for all contaminants. B-nZVI produces a straight line (graph of qt against t0.5) where it does not originate from the origin. This indicates that only internal diffusion is involved in the adsorption process but is not the rate-limiting step [41]. According to [41,42], the adsorption rate is also controlled by other mechanisms such as complex ions or ion exchange.
The C value refers to the thickness of the boundary layer or surface adsorption. The greater the y-intercept value, the higher the rate-limiting in surface adsorption [43]. The C value in B-nZVI (C = 0.3787) shows a higher value compared to the C value in bentonite (C = 0.3214). At the start of the process, the adsorbent materials will form a thick layer (due to inter-ionic attraction and intermolecular association), and subsequently there is a decrease in the ability of the adsorbent material. At this point, the adsorption rate is controlled by the contaminants transported from the outside to the internal side of the adsorbent particles [28].

3.2.4. pH Effect

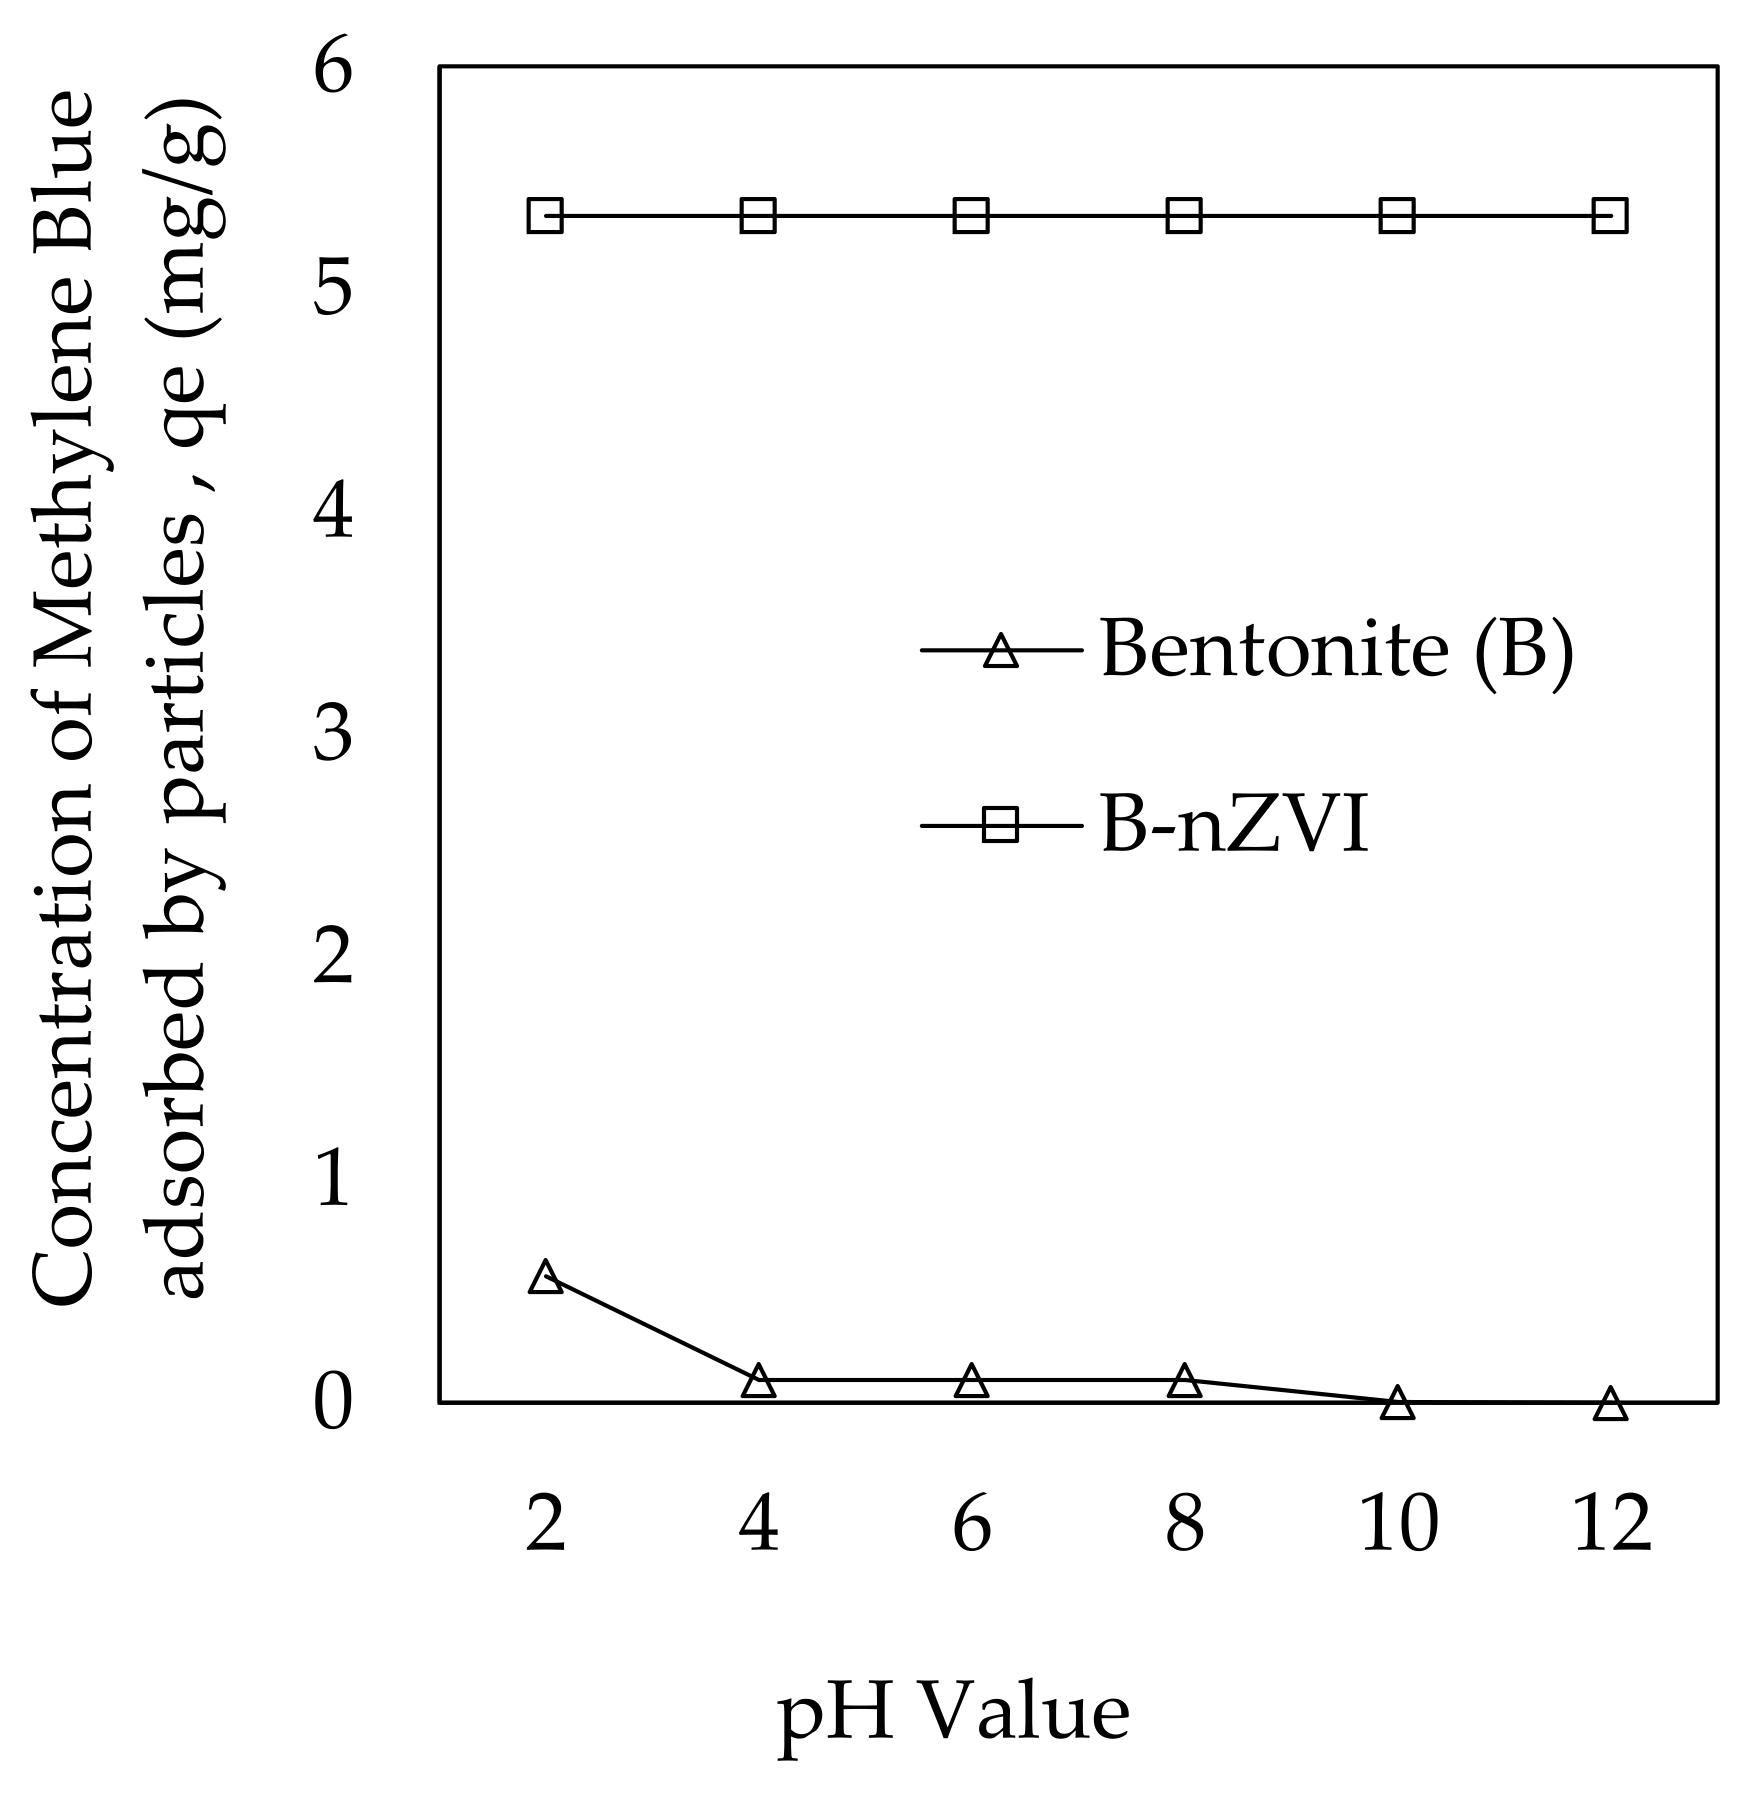
The adsorption capacity of MB by bentonite and B-nZVI was also studied for the pH range from pH 2 to pH 12 and is shown in Figure 8. According to [6], the pH values of the solution can alter the adsorbent’s shape, charges on its surface, and degree of adsorbate dissociation. Through this study, B-nZVI exhibits a high adsorption capacity of qe= 5.3284 mg/g at pH 2. It maintains this high and constant value with increasing pH. These findings are in agreement with [32], where the maximum adsorption of ion chromium (VI) by PAC-Fe0/Ag occurred at acidic pH. This is due to the electrostatic attraction between the Cr(VI) anions and the positive charges located on the adsorbent surface. For the case of bentonite, it exhibits a low adsorption value of qe = 0.5674 mg/g at pH 2. This value decreases with increasing pH to a minimum value of qe = 0.0047 mg/g at pH 10. This is because, at a lower pH, there are positive charges in the adsorption system due to the presence of H3O+. These ions together with the positive ions from the MB will be quickly adsorbed on the negative charges of bentonite and B-nZVI. In the case of B-nZVI, the high adsorption rate remains the same with increasing pH. However, an increased pH value causes the adsorption capacity to decrease due to the limited number of positive ions available to be adsorbed on the negatively charged surface of bentonite. The use of composite nZVI and bentonite also helps to increase the adsorption of MB [44]. According to [45], the adsorption of cation ions at low pH values shows that the adsorption process is sufficient to overcome electrostatic repulsion. The authors of [46] also stated that if there is a large amount of nZVI in the solution, most Fe3+ ions will change into Fe(OH)2+ ions. This situation causes the acidity rate to decrease and lowers the adsorption rate for bentonite.

3.2.5. Temperature Effect

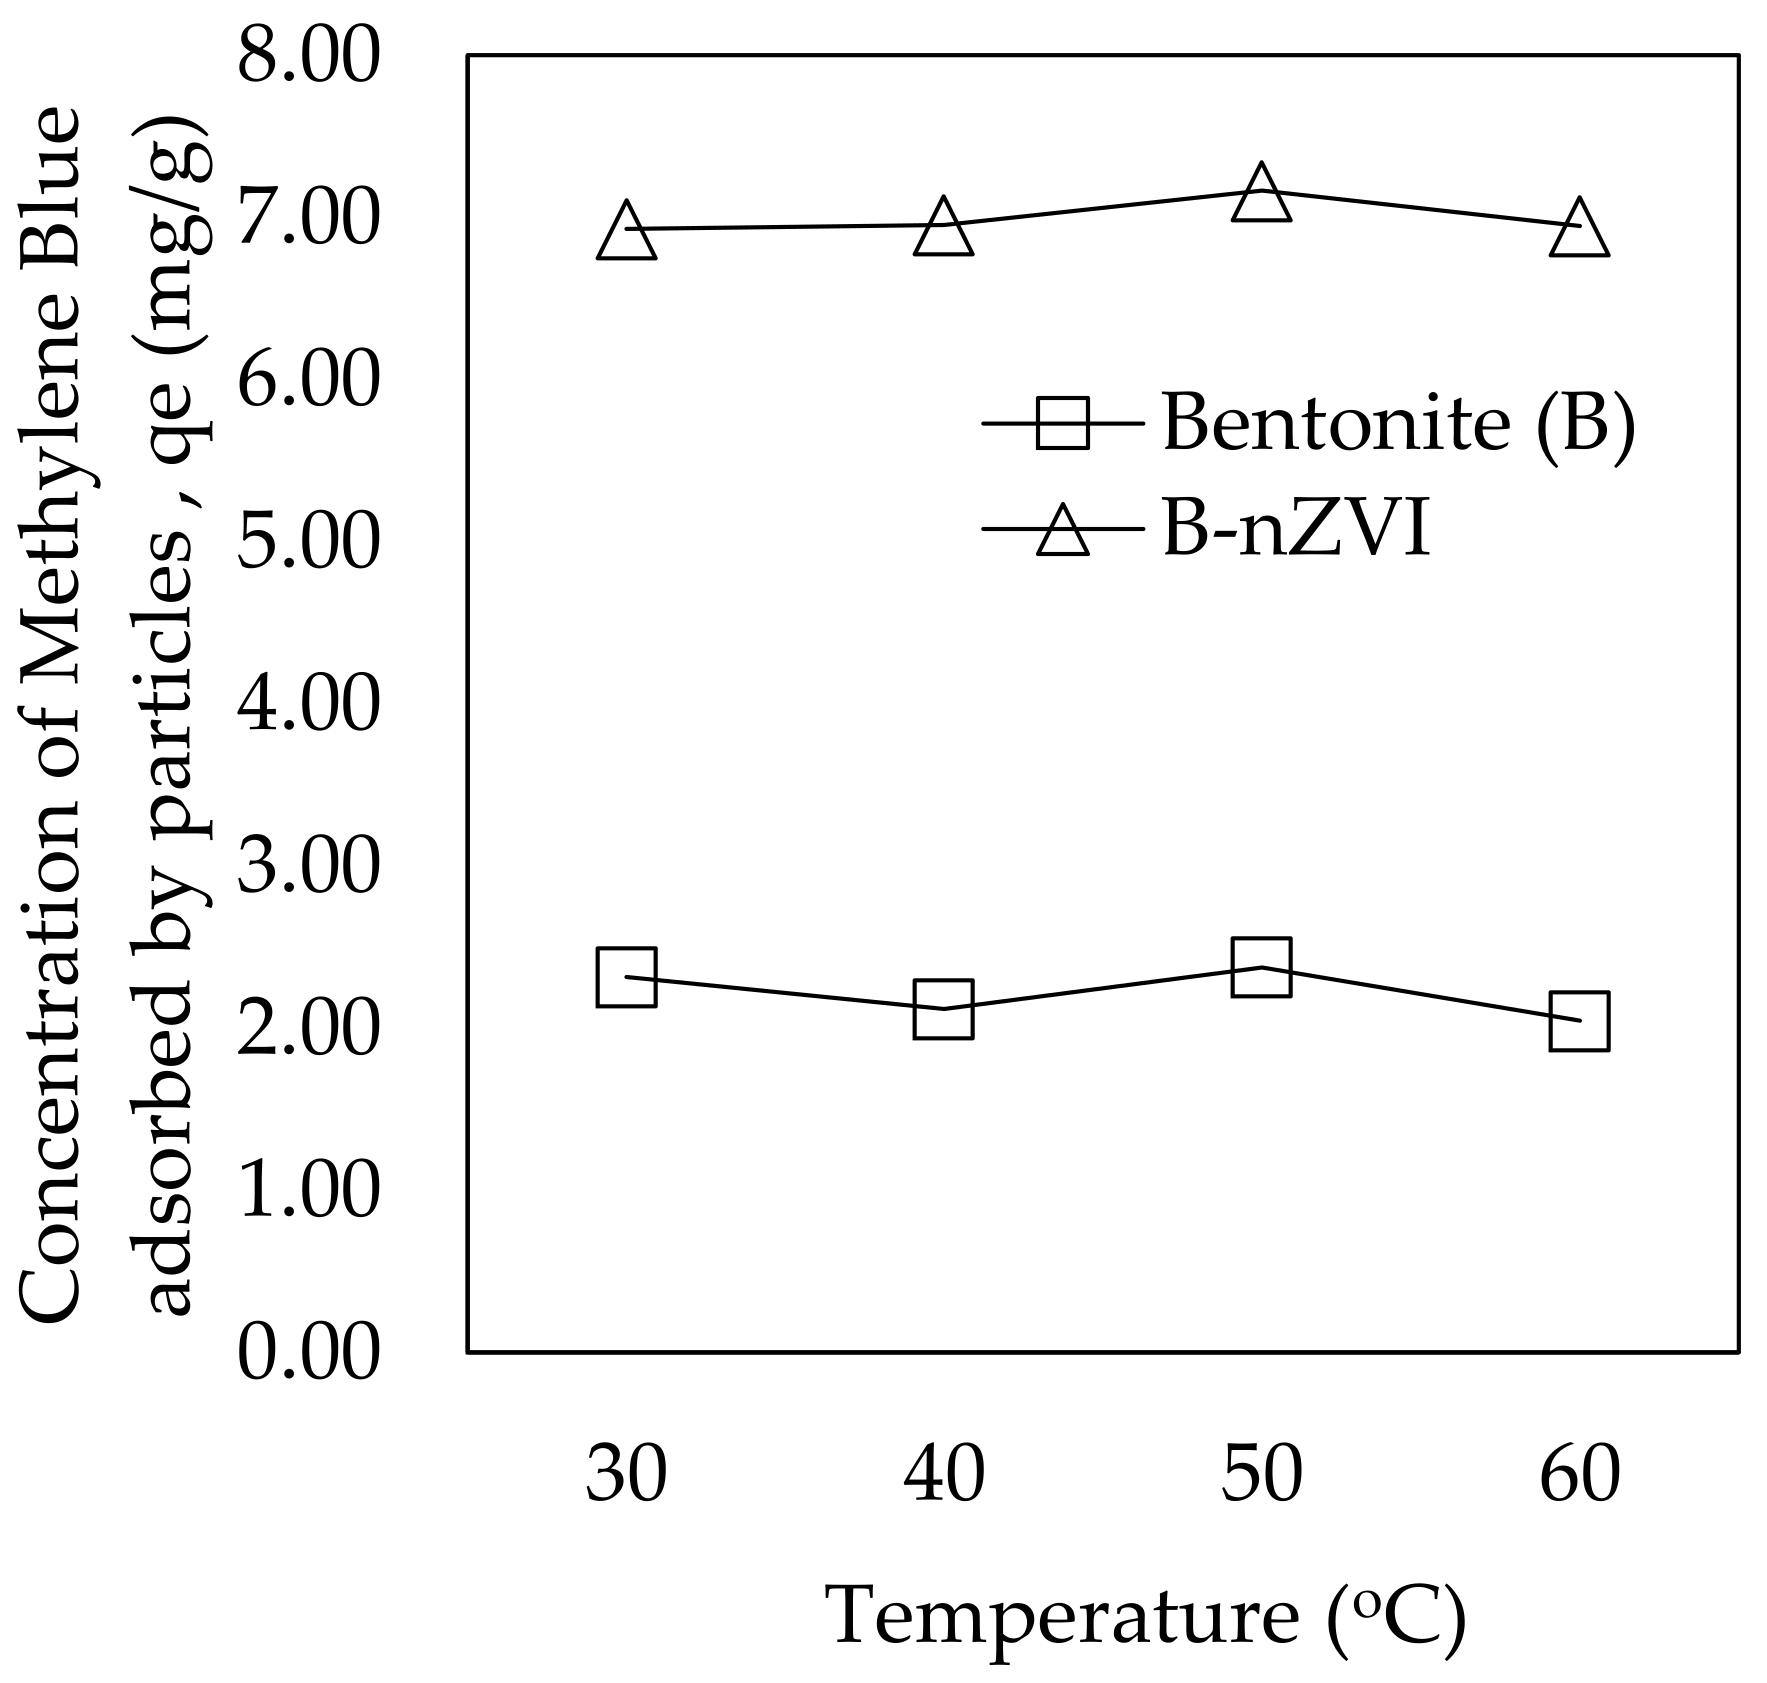
Figure 9 shows the adsorption curve versus temperature. Overall, the temperature did not affect the adsorption capacity of MB by B-nZVI. The adsorption curve of B-nZVI shows a higher adsorption capacity (qe = 7.16 mg/g) compared to bentonite (qe = 2.05 mg/g). At the highest temperature of 60 °C, bentonite shows the lowest adsorption capacity (qe = 2.05 mg/g).
Previous studies [47,48] stated that increasing the temperature slows down specific interactions, weakens electrostatic forces and the ions become smaller due to reduced solubility. The minerals may be physically damaged at high temperatures, which decreases their adsorption capacity [48,49]. This study also shows that B-nZVI does not affect the temperature-responsive behavior [50] and the validity of evaluating the adsorption capacity of adsorbent materials at room temperature. This is because, at higher temperatures, the operating cost may increase. From this study, the stability of B-nZVI versus temperature can be identified and B-nZVI is proven to be a better adsorbent material than bentonite.

4. Conclusions

This study has successfully produced B-nZVI. This study has also successfully identified the physico-chemistry, mineralogy, and morphology of the composite nZVI. Based on the characterization results, the presence of nanoparticles, Fe0, in B-nZVI can be identified where these materials play an important role in the adsorption of MB. The presence of bentonite as an nZVI composite material causes nano particles, Fe0, to spread widely on bentonite sheets. It can also prevent agglomeration and aggregation of nZVI, therefore accelerating the decolorization of MB. Through batch test analysis, all factors showed B-nZVI has a higher adsorption capacity compared to bentonite. Bentonite and B-nZVI also showed optimum adsorption capacity at lower (acidic) pH and neither showed a significant influence of temperature. This study also proposes the evaluation of the adsorption capacity of an adsorbent at room temperature to reduce cost. This study confirms that B-nZVI has a better adsorption capacity toward MB compared to bentonite.

Author Contributions

Conceptualization, N.‘A.Z. and W.Z.W.Y.; methodology, N.‘A.Z. and W.Z.W.Y.; software, N.‘A.Z.; formal analysis, N.‘A.Z.; writing—original draft preparation, N.‘A.Z.; writing—review and editing, N.‘A.Z., W.Z.W.Y., B.S., A.G.R., R.R., R.C.O. and H.J.; supervision, W.Z.W.Y., B.S. and R.C.O.; funding acquisition, W.Z.W.Y., B.S., R.R. and R.C.O. All authors have read and agreed to the published version of the manuscript.

Funding

This research was funded by Zamalah Research Scheme, Centre for Research & Instrumentation Management (CRIM), Universiti Kebangsaan Malaysia and Ministry of Education Malaysia for financial support throughout the study period. This work also supported by Institute of Energy Infrastructure (IEI.), Universiti Tenaga Nasional (UNITEN), grant number: J510050002/REE2022.

Data Availability Statement

The research data used to support the findings of this study.

Acknowledgments

Authors wish to thank Geology Programme, Department of Earth Sciences and Environmental, Faculty of Science and Technology, Universiti Kebangsaan Malaysia for their technical support to conduct the laboratory work throughout this study.

Conflicts of Interest

The authors declare no conflict of interest.

References

  1. Aminu, I.; Gumel, S.M.; Ahmad, W.A.; Idris, A.A. Adsorption Isotherms and Kinetic Studies of Congo-Red Removal from Waste Water Using Activated Carbon Prepared from Jujube Seed. Am. J. Anal. Chem. 2020, 11, 47–59. [Google Scholar] [CrossRef] [Green Version]
  2. Haddadian, Z.; Shavandi, M.A.; Zainal, Z.; Halim, M.; Ismail, S. Removal Methyl Orange from Aqueous Solutions Using Dragon Fruit (Hylocereusundatus ) Foliage. Chem. Sci. Trans. 2013, 2, 900–910. [Google Scholar] [CrossRef] [Green Version]
  3. Chen, S.; Zhang, J.; Zhang, C.; Yue, Q.; Li, Y.; Li, C. Equilibrium and Kinetic Studies of Methyl Orange and Methyl Violet Adsorption on Activated Carbon Derived from Phragmites australis. Desalination 2010, 252, 149–156. [Google Scholar] [CrossRef]
  4. Shahid, M.; Farooqi, Z.H.; Begum, R.; Arif, M.; Wu, W.; Irfan, A. Hybrid Microgels for Catalytic and Photocatalytic Removal of Nitroarenes and Organic Dyes From Aqueous Medium: A Review. Crit. Rev. Anal. Chem. 2020, 50, 513–537. [Google Scholar] [CrossRef] [PubMed]
  5. Dutta, S.; Ghosh, A.; Satpathi, S.; Saha, R. Modified synthesis of nanoscale zero-valent iron and its ultrasound-assisted reactivity study on a reactive dye and textile industry effluent. Desalin. Water Treat. 2015, 57, 19321–19332. [Google Scholar] [CrossRef]
  6. Sulaiman, S.M.; Al-Jabari, M.H. Enhanced adsorptive removal of diclofenac sodium from aqueous solution by bentonite-supported nanoscale zero-valent iron. Arab J. Basic Appl. Sci. 2021, 28, 51–63. [Google Scholar] [CrossRef]
  7. Medina-Pérez, G.; Fernández-Luqueño, F.; Vazquez-Nuñez, E.; López-Valdez, F.; Prieto-Mendez, J.; Madariaga-Navarrete, A.; Miranda-Arámbula, M. Remediating Polluted Soils Using Nanotechnologies: Environmental Benefits and Risks. Pol. J. Environ. Stud. 2019, 28, 1013–1030. [Google Scholar] [CrossRef]
  8. Sombra, F.; Lago, F.R.; Yokoyama, L. Synthesis and characterization of zero-valent iron nanoparticles supported on SBA-15. J. Mater. Res. Technol. 2016, 6, 178–183. [Google Scholar] [CrossRef]
  9. Arif, M. Complete life of cobalt nanoparticles loaded into cross-linked organic polymers: A review. RSC Adv. 2022, 12, 15447–15460. [Google Scholar] [CrossRef]
  10. Jiang, J.; Oberdo, G.; Biswas, P. Characterization of size, surface charge, and agglomeration state of nanoparticle dispersions for toxicological studies. J. Nanopart. Res. 2009, 11, 77–89. [Google Scholar] [CrossRef]
  11. Tourinho, P.S.; Van Gestel, C.A.M.; Lofts, S.; Svendsen, C.; Soares, A.M.V.M.; Loureiro, S. Metal-based nanoparticles in soil: Fate, behaviour, and effects on soil invertebrates. Environ. Toxicol. Chem. 2012, 31, 1679–1692. [Google Scholar] [CrossRef]
  12. Zhao, Z.; Liu, J.; Tai, C.; Zhou, Q.; Hu, J.; Jiang, G. Rapid decolorization of water soluble azo-dyes by nanosized zero-valent iron immobilized on the exchange resin. Sci. China Ser. B Chem. 2008, 51, 186–192. [Google Scholar] [CrossRef]
  13. Chen, Z.; Jin, X.; Chen, Z.; Megharaj, M.; Naidu, R. Removal of methyl orange from aqueous solution using bentonite-supported nanoscale zero-valent iron. J. Colloid Interface Sci. 2011, 363, 601–607. [Google Scholar] [CrossRef]
  14. Tomašević, D.D.; Kozma, G.; Kerkez, D.V.; Dalmacija, B.D.; Dalmacija, M.B.; Bečelić-Tomin, M.R.; Kukovecz, Á.; Kónya, Z.; Rončević, S. Toxic metal immobilization in contaminated sediment using bentonite- and kaolinite-supported nano zero-valent iron. J. Nanoparticle Res. 2014, 16, 2548. [Google Scholar] [CrossRef]
  15. Kim, K.R.; Lee, B.T.; Kim, K.W. Arsenic stabilization in mine tailings using nano-sized magnetite and zero valent iron with the enhancement of mobility by surface coating. J. Geochemical Explor. 2012, 113, 124–129. [Google Scholar] [CrossRef]
  16. Luo, S.; Qin, P.; Shao, J.; Peng, L.; Zeng, Q.; Gu, J.D. Synthesis of reactive nanoscale zero valent iron using rectorite supports and its application for Orange II removal. Chem. Eng. J. 2013, 223, 1–7. [Google Scholar] [CrossRef]
  17. Xi, Y.; Megharaj, M.; Naidu, R. Dispersion of zerovalent iron nanoparticles onto bentonites and use of these catalysts for orange II decolourisation. Appl. Clay Sci. 2011, 53, 716–722. [Google Scholar] [CrossRef] [Green Version]
  18. Tan, I.A.W.; Ahmad, A.L.; Hameed, B.H. Adsorption of basic dye using activated carbon prepared from oil palm shell: Batch and fixed bed studies. Desalination 2008, 225, 13–28. [Google Scholar] [CrossRef]
  19. Rashmi, S.; Madhu, G.; Kittur, A.; Suresh, R. Synthesis, characterization and application of zero valent iron nanoparticles for the removal of toxic metal hexavalent chromium from aqueous solution. Int. J. Curr. Eng. Technol. 2013, 1, 37–42. [Google Scholar]
  20. Yaacob, W.Z.W.; How, H.K. Synthesis and Characterization of Marine Clay-Supported Nano Zero Valent Iron. Am. J. Environ. Sci. 2015, 11, 115–124. [Google Scholar] [CrossRef] [Green Version]
  21. Roy, W.; Krapac, I.; Chou, S.; Griffin, R. Batch-Type Procedures for Estimating Soil Adsorption of Chemicals. EPA/530/SW- 87/006-F; United States Environmental Protection Agency: Washington, DC, USA, 1992. [Google Scholar]
  22. Shahid, M.; Farooqi, Z.H.; Begum, R.; Arif, M.; Irfan, A.; Azam, M. Extraction of cobalt ions from aqueous solution by microgels for in-situ fabrication of cobalt nanoparticles to degrade toxic dyes: A two fold-environmental application. Chem. Phys. Lett. 2020, 754, 137645. [Google Scholar] [CrossRef]
  23. Langmuir, I. The adsorption of gasses on plane surfaces of glass, mica and platinum. J. Am. Chem. Soc. 1918, 40, 1361–1382. [Google Scholar] [CrossRef] [Green Version]
  24. Garcí, E.R.; Medina, R.L.; Lozano, M.M.; Pérez, I.H.; Valero, M.J.; Franco, A.M.M. Adsorption of Azo-Dye Orange II from Aqueous Solutions Using a Metal-Organic Framework Material: Iron- Benzenetricarboxylate. Materials 2014, 12, 8037–8057. [Google Scholar] [CrossRef] [PubMed] [Green Version]
  25. Vadi, M.; Abbasi, M.; Zakeri, M.; Yazdi, B.J. Application of the Freundlich, Langmuir, Temkin and Harkins-Jura Adsorption Isotherms for Some Amino Acids and Amino Acids Complexation with Manganese Ion ( II ) on Carbon Nanotube. 2010 Int. Conf. Nanotechnol. Biosens. IPCBEE 2011, 2, 117–119. [Google Scholar]
  26. Yu, C.; Shao, J.C.; Cai, X.Q.; Yu, X.N. Research on preparation of nanoscale iron supported by bentonite and its remediation of lead ions. Dig. J. Nanomater. Biostructures 2018, 13, 31–38. [Google Scholar]
  27. Zarime, N.A.; Yaacob, W.Z.W.; Jamil, H. Degradation of anionic dye (acid orange II) by bentonite supported nano-zero valent iron. Asian J. Chem. 2019, 31. [Google Scholar] [CrossRef]
  28. Wang, X.W.W.; Zhou, M.; Mao, Q.; Yue, J. Novel NaY zeolite-supported nanoscale zero-valent iron as an efficient heterogeneous Fenton catalyst. Catal. Commun. 2010, 11, 937–941. [Google Scholar] [CrossRef]
  29. Chi, Z.; Wang, Z.; Liu, Y.; Yang, G. Preparation of organosolv lignin-stabilized nano zero-valent iron and its application as granular electrode in the tertiary treatment of pulp and paper wastewater. Chem. Eng. J. 2018, 331, 317–325. [Google Scholar] [CrossRef]
  30. Zarime, N.A.; Yaacob, W.Z.W.; Jamil, H. Removal of heavy metals using bentonite supported nano-zero valent iron particles. 2017 UKM FST Postgrad. Colloq. AIP Conf. Proc. Am. Inst. Phys. 2018, 1940, 020029-1–020029-7. [Google Scholar] [CrossRef]
  31. Gupta, V.K.; Nayak, A.; Agarwal, S.; Chaudhary, M.; Tyagi, I. Removal of Ni (II) ions from water using scrap tire. J. Mol. Liq. 2014, 190, 215–222. [Google Scholar] [CrossRef]
  32. Kakavandi, B.; Kalantary, R.R.; Farzadkia, M.; Mahvi, A.H.; Esrafili, A.; Azari, A.; Yari, A.R.; Javid, A.B. Enhanced chromium (VI) removal using activated carbon modified by zero valent iron and silver bimetallic nanoparticles. J. Environ. Health Sci. Eng. 2014, 12, 115. [Google Scholar] [CrossRef] [Green Version]
  33. Wan Zuhairi, W.Y.; Rahim, S.A. Sorption Parameters of Pb and Cu on Natural Clay Soils from Selangor, Malaysia. Sains Malaysiana 2007, 36, 149–157. [Google Scholar]
  34. Pourfadakari, S.; Mahvi, A.H. Kinetics and Equilibrium Studies for Removal of Reactive Red 198 From Aqueous Solutions Using Zero Valent Iron powder. Health Scope 2014, 3, 14883. [Google Scholar] [CrossRef] [Green Version]
  35. Alemayehu, E.; Lennartz, B. Virgin volcanic rocks: Kinetics and equilibrium studies for the adsorption of cadmium from water. J. Hazard. Mater. 2009, 169, 395–401. [Google Scholar] [CrossRef]
  36. Shaibu, S.E.; Adekola, F.A.; Adegoke, H.I.; Ayanda, O.S. A comparative study of the adsorption of methylene blue onto synthesized nanoscale zero-valent iron-bamboo and manganese-bamboo composites. Materials 2014, 7, 4493–4507. [Google Scholar] [CrossRef] [Green Version]
  37. Chikri, R.; Elhadiri, N.; Benchanaa, M.; El maguana, Y. Efficiency of Sawdust as Low-Cost Adsorbent for Dyes Removal. J. Chem. 2020, 2020, 1–17. [Google Scholar] [CrossRef]
  38. Arif, M.; Shahid, M.; Irfan, A.; Nisar, J.; Wang, X.; Batool, N.; Ali, M.; Farooqi, Z.H.; Begum, R. Extraction of copper ions from aqueous medium by microgel particles for in-situ fabrication of copper nanoparticles to degrade toxic dyes. Zeitschrift fur Phys. Chemie 2022, 236, 1219–1241. [Google Scholar] [CrossRef]
  39. Al-Degs, Y.S.; El-Barghouthi, M.I.; Issa, A.A.; Khraisheh, M.A.; Walker, G.M. Sorption of Zn(II), Pb(II), and Co(II) using natural sorbents: Equilibrium and kinetic studies. Water Res. 2006, 40, 2645–2658. [Google Scholar] [CrossRef]
  40. Pan, M.; Lin, X.; Xie, J.; Huang, X. Kinetic, equilibrium and thermodynamic studies for phosphate adsorption on aluminum hydroxide modified palygorskite nano-composites. RSC Adv. 2017, 7, 4492–4500. [Google Scholar] [CrossRef] [Green Version]
  41. Wang, L.; Zhang, J.; Zhao, R.; Li, Y.; Li, C.; Zhang, C. Adsorption of Pb(II) on activated carbon prepared from Polygonum orientale Linn.: Kinetics, isotherms, pH, and ionic strength studies. Bioresour. Technol. 2010, 101, 5808–5814. [Google Scholar] [CrossRef]
  42. Cheung, W.H.; Szeto, Y.S.; McKay, G. Intraparticle diffusion processes during acid dye adsorption onto chitosan. Bioresour. Technol. 2007, 98, 2897–2904. [Google Scholar] [CrossRef] [PubMed]
  43. Pholosi, A.; Naidoo, E.B.; Ofomaja, A.E. Intraparticle diffusion of Cr(VI) through biomass and magnetite coated biomass: A comparative kinetic and diffusion study. South African J. Chem. Eng. 2020, 32, 39–55. [Google Scholar] [CrossRef]
  44. Kerkez, D.V.; Tomašević, D.D.; Kozma, G.; Bečelić-Tomin, M.R.; Prica, M.D.; Rončević, S.D.; Kukovecz, A.; Dalmacija, B.D.; Kónya, Z. Three different clay-supported nanoscale zero-valent iron materials for industrial azo dye degradation: A comparative study. J. Taiwan Inst. Chem. Eng. 2014, 45, 2451–2461. [Google Scholar] [CrossRef]
  45. Gupta, V.K.; Gupta, M.; Sharma, S. Process Development for the Removal of Lead and Chromium from Aqueous Solutions using Red Mud, an Aluminium Industry Waste. Wat. Res. 2001, 35, 1125–1134. [Google Scholar] [CrossRef] [PubMed]
  46. Rahmani, A.R.; Samadi, M.T.; Shokoohi, R.; Nasab, H.Z. Monitoring of pH, Oxidation-Reduction Potential and Dissolved Oxygen to Improve the Performance of Dimethyl Phthalate Removal From Aqueous Solutions. Avicenna J. Environ. Health Eng. 2015. In Press. [Google Scholar] [CrossRef]
  47. Inglezakis, V.J.; Loizidou, M.M.; Grigoropoulou, H.P. Ion exchange studies on natural and modified zeolites and the concept of exchange site accessibility. J. Colloid Inteface Sci. 2004, 275, 570–576. [Google Scholar] [CrossRef]
  48. Malamis, S.; Katsou, E. A review on zinc and nickel adsorption on natural and modified zeolite, bentonite and vermiculite: Examination of process parameters, kinetics and isotherms. J. Hazard. Mater. 2013, 252–253, 428–461. [Google Scholar] [CrossRef]
  49. Park, D.; Yun, Y.S.; Park, J.M. The past, present, and future trends of biosorption. Biotechnol. Bioprocess Eng. 2010, 15, 86–102. [Google Scholar] [CrossRef]
  50. Arif, M.; Farooqi, Z.H.; Irfan, A.; Begum, R. Gold nanoparticles and polymer microgels: Last five years of their happy and successful marriage. J. Mol. Liq. 2021, 336, 116270. [Google Scholar] [CrossRef]
Figure 1. The molecular structure of methylene blue (MB) with molecular weight of 373.9 g/mol and a wavelength of 668 nm. Sourced by [18].
Processes 11 00788 g001
Figure 2. The FESEM images for (a) bentonite (magnification: 10,000×) and (b) B-nZVI (magnification: 10,000×).
Processes 11 00788 g002
Figure 3. FTIR spectra of bentonite and B-nZVI [30].
Processes 11 00788 g003
Figure 4. Dose effect on the amount of MB adsorbed by bentonite and B-nZVI.
Processes 11 00788 g004
Figure 5. Amount of MB adsorbed by bentonite and B-nZVI in concentration effect.
Processes 11 00788 g005
Figure 6. Amount of MB adsorbed by bentonite and B-nZVI in kinetic effect.
Processes 11 00788 g006
Figure 7. Internal diffusion model in kinetic effects for (a) Bentonite and (b) B-nZVI.
Processes 11 00788 g007
Figure 8. Amount of MB adsorbed by bentonite and B-nZVI in pH effect.
Processes 11 00788 g008
Figure 9. Amount of MB adsorbed by bentonite and B-nZVI in temperature effect.
Processes 11 00788 g009
Table 1. Brunauer–Emmett–Teller (BET) results for bentonite and B-nZVI.
SampleBET Surface Area (m²/g)Pore Volume (cm³/g)Pore Size (Å)
Bentonite (B)74.77550.099453.1595
B-nZVI5.64180.0226160.2891
Result are similar to [27].
Table 2. Cation exchange capacity (CEC) results.
SampleTestElement KElement MgElement CaElement NaCEC Value (meq/100 g)Average (meq/100 g)Standard Deviation% RSD
Bentonite (B)10.8124.5219.110.1844.6148.353.246.70
20.8726.0021.010.0447.91
30.6426.5025.230.1452.51
B-nZVI13.0322.905.920.0131.8530.811.033.33
22.8720.935.610.0129.41
33.2421.746.150.0231.16
RSD = Relative standard deviation.
Table 3. X-ray fluorescence spectrometer (XRF) results.
Element (%)Sample
BentoniteB-nZVI
SiO248.6517.36
Al2O315.445.27
Fe2O316.3934.14
Na2O1.9420.76
Cl0.620.1
Cr2O30.010.01
K2O0.190.08
TiO21.760.97
MgO2.790.88
CaO1.490.71
P2O50.150.07
SO30.170.01
ZrO20.020.01
MnO0.080.05
V2O50.060.03
ZnO0.020.01
CuO0.020.01
SrO0.020.01
NiO0.01-
LOI9.8519.75
Total (%)99.68100.23
Table 4. The adsorption value, Kd by using three isotherm models which are Linear, Langmuir and Freundlich equations.
SampleLinear EquationLangmuir EquationFreundlich Equation
Kd (L/g)R2KL (L/g)Am (mg/g)R2KF1/nR2
Bentonite (B)0.02190.88920.02060.68360.610520.19760.51590.3861
B-nZVI12.36100.274030,314.05360.15161.0000256.74383.32680.8111
Table 5. Reaction models and diffusion models for kinetic effects.
SampleContaminantsType of SolutionInitial Concentration, Co (mg/L)qe Experimental (mg/g)Pseudo-First-Order
Model
Pseudo-Second-Order ModelInterparticle
Diffusion Model
Intraparticle
Diffusion Model
K1 (1/min)qe Calculation (mg/g)R2K2 (1/min)qe Calculation (mg/g)R2Kf (m2 g−1 min L−1)R2Kd (mg g−1 min−0.5)CR2
BentoniteMBSingle501.65720.00070.35710.02190.41141.20380.99930.00020.62530.28860.32140.6026
B-nZVIMBSingle507.46670.00060.52720.06680.02046.99791.00000.86450.90002.38290.37870.9189
Disclaimer/Publisher’s Note: The statements, opinions and data contained in all publications are solely those of the individual author(s) and contributor(s) and not of MDPI and/or the editor(s). MDPI and/or the editor(s) disclaim responsibility for any injury to people or property resulting from any ideas, methods, instructions or products referred to in the content.