Article

Phenol Degradation Performance in Batch and Continuous Reactors with Immobilized Cells of Pseudomonas putida

Department of Safety, Health and Environmental Engineering, Central Taiwan University of Science and Technology, 666, Bu-zih Road, Bei-tun District, Taichung 406053, Taiwan
*
Author to whom correspondence should be addressed.
Processes 2023, 11(3), 739; https://doi.org/10.3390/pr11030739
Submission received: 1 February 2023 / Revised: 28 February 2023 / Accepted: 28 February 2023 / Published: 2 March 2023

Abstract

:
Phenol is a highly persistent environmental pollutant and is toxic to living organisms. The main objective of this study is to observe the phenol degradation performance by free and immobilized Pseudomonas putida (P. putida) in batch and continuous reactors, respectively. Batch experiments were evaluated to determine the maximum specific growth rate, saturation constant, inhibition constant, and cell yield. These kinetic parameters were used as the input values for the continuous-flow immobilized cells model. The immobilized cells model was validated by experimental results obtained from an immobilized cells continuous reactor. The model-predicted and experimental results showed good agreement for phenol effluent concentration in the continuous mode. In the steady-state condition, high phenol removal was achieved under various hydraulic retention times. The corresponding removal of phenol ranged from 93.3 to 95.9%, while the hydraulic retention times were maintained at 3.1–10.5 h. Furthermore, polyvinyl alcohol-immobilized cells with nanoscale particles were also prepared. The polyvinyl alcohol-immobilized P. putida cells with nanoscale Fe3O4 enhanced the ability of phenol degradation. The experimental results revealed that immobilized cells with nano-Fe3O4 had the highest phenol degradation performance at a low salinity of 1%. However, the advantage of the addition of nano-Fe3O4 was insignificant for phenol degradation at a higher salinity of 5%. The approaches of the batch and continuous column tests were practical in the treatment of actual phenol-containing wastewater.

1. Introduction

Phenols are contaminants found in industrial effluents from oil refineries, resin manufacturing, pesticides, pharmaceuticals, and coal conversion industries [1,2]. Many studies have reported that the phenols discharged from industrial effluents without appropriate treatment may result in adverse effects on aquatic animals and plants [3]. Phenolic compounds, such as phenol and chlorophenols, have a negative impact on environmental and human health because of their inherent toxicity, mutagenicity, and carcinogenicity [4]. Phenolic compounds are persistent in the ecological environment because of their bio-accumulation in organisms [5]. Conventional treatment methods for phenolic compound removal include chemical oxidation, ion-exchange, adsorption by activated carbon, and electrocoagulation. These physico-chemical methods have the inherent drawbacks of high treatment cost and the production of secondary toxic pollutants [6].
Biological removal methods are considered environmentally friendly, highly efficient, and low cost [7]. Biological treatment processes also produce less secondary waste and have lower operating costs than physicochemical methods [8,9]. In biological systems, the removal of phenols by Pseudomonas sp. has been reported to be effective. González et al. [10] used the completely stirred tank reactor and fluidized-bed reactor methods on entrapped cells of P. putida ATCC 17484 to degrade phenol. In their study, more than 90% phenol removal was reported as the influent phenol loading rate reached 4 g/L-d. Various types of wastewaters contain phenolic compounds with salinity. Salinity affects the osmotic pressure of cells and results in poor degradation ability.
The biodegradation of pollutants is commonly used by free cells in wastewater. Immobilized cells have advantages over free cells in treating actual industrial wastewater. For example, free cells have weak endurance to the shock loadings of wastewater. Furthermore, free cells are easily washed away in the continuous mode of bioreactors [11]. A bioreactor packed with immobilized cells shows a more stable living condition than that with free cells [12]. Alginate beads have excellent biocompatibility and high cell density in the microenvironment [7]. Alginate beads with entrapped cells have been successfully utilized to degrade ethylbenzene, 1,4-dioxane, atrazine, and dyes [13,14,15]. Thus, polyvinyl alcohol (PVA)–alginate was chosen as an immobilized carrier for the Pseudomonas putida (P. putida) cell culture in this study.
Nano-Fe3O4, a magnetic nanoparticle, was employed in the immobilized technique for removing contaminants. Wang et al. [16] reported that microbial cells entrapped by gellan gel with magnetic nano-Fe3O4 as an additive showed higher carbazole removal efficiency than non-magnetically immobilized and free cells. The Arthrobacter sp. immobilized by gellan gel with an addition of nano-Fe3O4 exhibited a high capacity for the biodegradation of contaminants in coking wastewater [17]. A Rhodococcus sp. strain was entrapped with nano-Fe3O4 for the biodegradation of p-nitrophenol [18]. Hou et al. [19] used the Rhodococcus rhodochrous strain entrapped by k-carrageenan to biodegrade 2-chlorophenol, 4-chlorophenol, and 2,3-dichloropheno1, as well as their mixture. An addition of 9 g/L nano-Fe3O4 enhanced the 2-CP removal compared with immobilized cells without nano-Fe3O4. However, phenol degradation by immobilized P. putida cells under saline conditions has never been reported.
In relation to the previous research, the main innovative factor in the current study is the inclusion of immobilized cells with nanoFe3O4, leading to an improvement in phenol kinetic degradation. In this study, the phenol degradation by free P. putida ATCC 17484 was evaluated to determine kinetic parameters as input values for the immobilized cells model solution. An immobilized cells kinetic model was developed and validated by running a continuous reactor with immobilized cells for phenol degradation. At the steady-state, the performance of the continuous reactor was investigated under various hydraulic retention times (HRTs). Moreover, phenol degradation using immobilized cells in the PVA–alginate with nano-scale Fe3O4 at different temperatures was evaluated. The phenol degradation performance by P. putida ATCC 17484 was also estimated and compared to free and immobilized cells with and without nano-Fe3O4 particles under different salinities.

2. Kinetic Model

2.1. Cell Growth in Batch Reactor

Batch experiments were conducted to determine the specific growth rate at the log-growth phase by employing the cell growth kinetic equation. The specific cell growth rate is defined as [20]
μ = 1 X d X d t
where μ is the specific cell growth rate (1/h) and X is the cell concentration (mg/L) at time t (h). The Haldane model was used for phenol inhibition kinetics to investigate the kinetic parameters. The Haldane kinetics are defined as [20]
μ = μ m S K S + S + S 2 / K I
where μm represents the highest specific cell growth rate (1/h), S represents the phenol concentration (mg/L), KS represents the saturation constant (mg/L), and KI represents the inhibition constant (mg/L).
Cell yield was defined as milligrams of cells produced by milligrams of phenol utilized, and is represented by [21]
Y = Δ X Δ S
where ΔX is the cells produced (mg/L) and ΔS is the amount of phenol utilization by the cells (mg/L).

2.2. Phenol Degradation by Immobilized Cells

We assume that the gel bead is spherical, the cells are distributed uniformly within the bead, and there is no diffusion phase between the outer medium and the bead. According to Fick’s law, the phenol degradation rate is represented by [22]
C e t = D e ρ e 2 C e r 2 + 2 r C e r k C e K S + C e + C e 2 / K I
where Ce is the phenol concentration in the bead, r is the radial coordinate within the bead, De is the effective diffusivity of phenol (cm2/d), ρe is the cell density in the bead (g/cm3), and k is the highest specific degradation rate of phenol (mg phenol/mg cell‒d).
The cell growth rate within the bead is described by
d X e d t = μ X e
where Xe is the cell concentration within the bead (mg/L). The phenol degradation rate in the liquid phase can be described by
d C b d t = Q V ε C b 0 C b k f a V s C b C s
where Cb is the phenol concentration in the liquid phase (mg/L), kf is the mass-transfer coefficient of phenol (cm/d), a is the specific surface area (1/cm), Vs is the volume of gel beads per unit bioreactor volume (dimensionless), and Cs is the phenol concentration at the interface of the bead and liquid phase (mg/L).

3. Materials and Methods

3.1. P. putida Cell Activation

The P. putida ATCC 17484 strain was activated by adding 0.5 mL Luria Bertani (LB) broth to the freeze-dried strain in the vial. The activated strain was added into a tube containing 2.5 mL LB broth and was cultivated for 24 h in a shaker to obtain viable P. putida cells as an inoculum. The inoculum of 0.9 mL mixed with glycerin of 0.1 mL was kept at −80 °C in a freezer for preservation. The stock inoculum inoculated on the LB agar plate was cultivated in an incubator at 30 °C for 18 h. The grown colonies were picked and then transferred into a 250 mL Erlenmeyer flask with 200 mL of growth medium. The P. putida cells were cultivated for 18 h at 30 °C in a shaking incubator at a speed of 150 rpm. The ingredients of the growth medium were [23]: beef extract (3000 mg/L), peptone (5000 mg/L), K2HPO4 (650 mg/L), KH2PO4 (190 mg/L), NaNO3 (500 mg/L), (NH4)2SO4 (500 mg/L), FeSO4•7H2O (5.56 mg/L), and MgSO4•7H2O (100 mg/L).

3.2. Nutrient Medium

A stock phenol solution of 1000 mg/L was diluted to prepare the required initial phenol concentration for the batch and continuous column experiments. The composition of the nutrient medium for the P. putida cells contained [24]: K2HPO4 (4.36 g/L), NaH2PO4•2H2O, (3.45 g/L), NH4Cl (1.0 g/L), MgSO4•7H2O (0.1 g/L), CoCl2•2H2O (0.001 g/L), CaCl2•2H2O (0.036 g/L), FeSO4•7H2O (0.00556 g/L), (NH4)Mo7O24•4H2O (0.0002 g/L), KH2PO4 (0.19 g/L), NaNO3 (0.5 g/L), (NH4)2SO4 (0.5 g/L), nutrient broth (4.0 g/L), and trace elements 10 mL. The composition of trace elements was MnSO4•H2O (0.5 g/L), CoCl2•6H2O (0.1 g/L), CaCl2 (0.1 g/L), ZnSO4•7H2O (0.1 g/L), CuSO4•5H2O (0.01 g/L), H3BO3 (0.01 g/L), Na2MoO4•2H2O (0.01 g/L), and AlK(SO4)2•12H2O (0.01 g/L). The nutrient medium was autoclaved at a temperature of 121 °C for 30 min to prevent contamination. The nutrient medium was added into a bioreactor to evaluate phenol biodegradation in the batch and continuous tests.

3.3. Preparation of Immobilized Cells

P. putida ATCC 17484 grown in nutrient medium was harvested during the stationary phase and then centrifuged at 5000 rpm for 10 min, washed twice, and then resuspended in distilled water to obtain a final dry weight of 0.64 g/L [25,26]. After a sterile solution of PVA (5%, w/v) and sodium alginate (1%, w/v) was prepared with deionized water, 15 mL the P. putida cell was added to the PVA–alginate solution to create a cell inoculation ratio of 15% under constant stirring. The cell mixture was added stepwise into cold, sterile saturated boric acid solution containing calcium chloride (0.2 M) using a sterilized syringe. The stirring rate of the solution and the height of the syringe were adjusted to obtain beads with average diameters of 4 mm. The beads with boric acid and calcium chloride solutions were placed into a 4 °C refrigerator for 2 h. Subsequently, the gel beads were washed with autoclaved deionized water and stored in the 4 °C refrigerator for further use. For PVA–alginate immobilized cells with Fe3O4 nanoparticles, the autoclaved nano-Fe3O4 (2%, w/v) was added to the PVA–alginate solution before the mixture was dropped into boric acid and calcium chloride solutions. Furthermore, PVA–alginate gel beads with nano-Fe3O4 without P. putida cells were also used for the control.

3.4. Batch Tests

Batch tests were performed to investigate the phenol degradation and cell growth for the determination of kinetic parameters (μm, KS, KI, and Y). The activated cells were added into the 250 mL nutrient medium in 500 mL flasks. The flasks were placed in a shaker bath at a speed of 120 rpm at 30 °C. Phenol degradation tests were conducted at several phenol concentrations of between 53 and 137 mg/L. The initial cell concentration was approximately 5.24 mg/L (0.016 OD). The ratio of the initial phenol concentration to cell concentration (S0/X0) ranged from 10.1 to 26.1 mg phenol/mg cell in the five batch tests. Samples of 2 mL were withdrawn between 4 and 16 h for measurement. Four batch experiments for phenol degradation by immobilized cells with nano-Fe3O4 at a temperature range of 20–40 °C were also conducted with an initial phenol concentration of 124 mg/L.

3.5. Column Tests

Figure 1 shows the schematic diagram of the continuous reactor with entrapped cells. The column reactor is circular with a water jacket for water circulation to maintain the operating temperature at 30 °C. The total volume of the reactor is 2.55 L with an operating volume of 1.568 L. The PVA–alginate bead with a diameter of 4 mm occupied 72% of the space of the working volume. An air pump was used to provide dissolved oxygen for the growth of immobilized cells at the bottom of the column reactor. A peristaltic pump was used to feed phenol into the column at a flow rate of 3.6‒12 L/d. The foam pad was placed at the bottom of the column body to support the PVA–alginate beads. The glass wool placed in the upper position was used to prevent the PVA–alginate beads from washing away [27].

3.6. Analytical Techniques

The P. putida cell concentrations in the batch experiments were analyzed with optical density (OD) measurements at 600 nm using a spectrophotometer (Thermo Scientific Genesys 20, Waltham, MA, USA). The samples obtained from the batch and continuous experiments were filtrated using a Millipore syringe filter (0.2 μm) before analysis. The HPLC system with a Symmetry® C18 column (5 μm particle size) included an autosampler (Waters 2707) and UV/Vis detector (Waters 2487). A mixture containing 50 mM potassium phosphate (70% volume) and acetonitrile (30% volume) was used as a mobile liquid phase at a velocity of 0.7 mL/min. The column temperature was controlled at 40 °C. The wavelength of the UV/Vis detector was set at 254 nm and the volume of the injection for each sample was 6 μL. The time of elution for phenol was approximately 5.69 min.

4. Results and Discussion

4.1. Phenol Degradation and Cell Growth in the Batch Mode

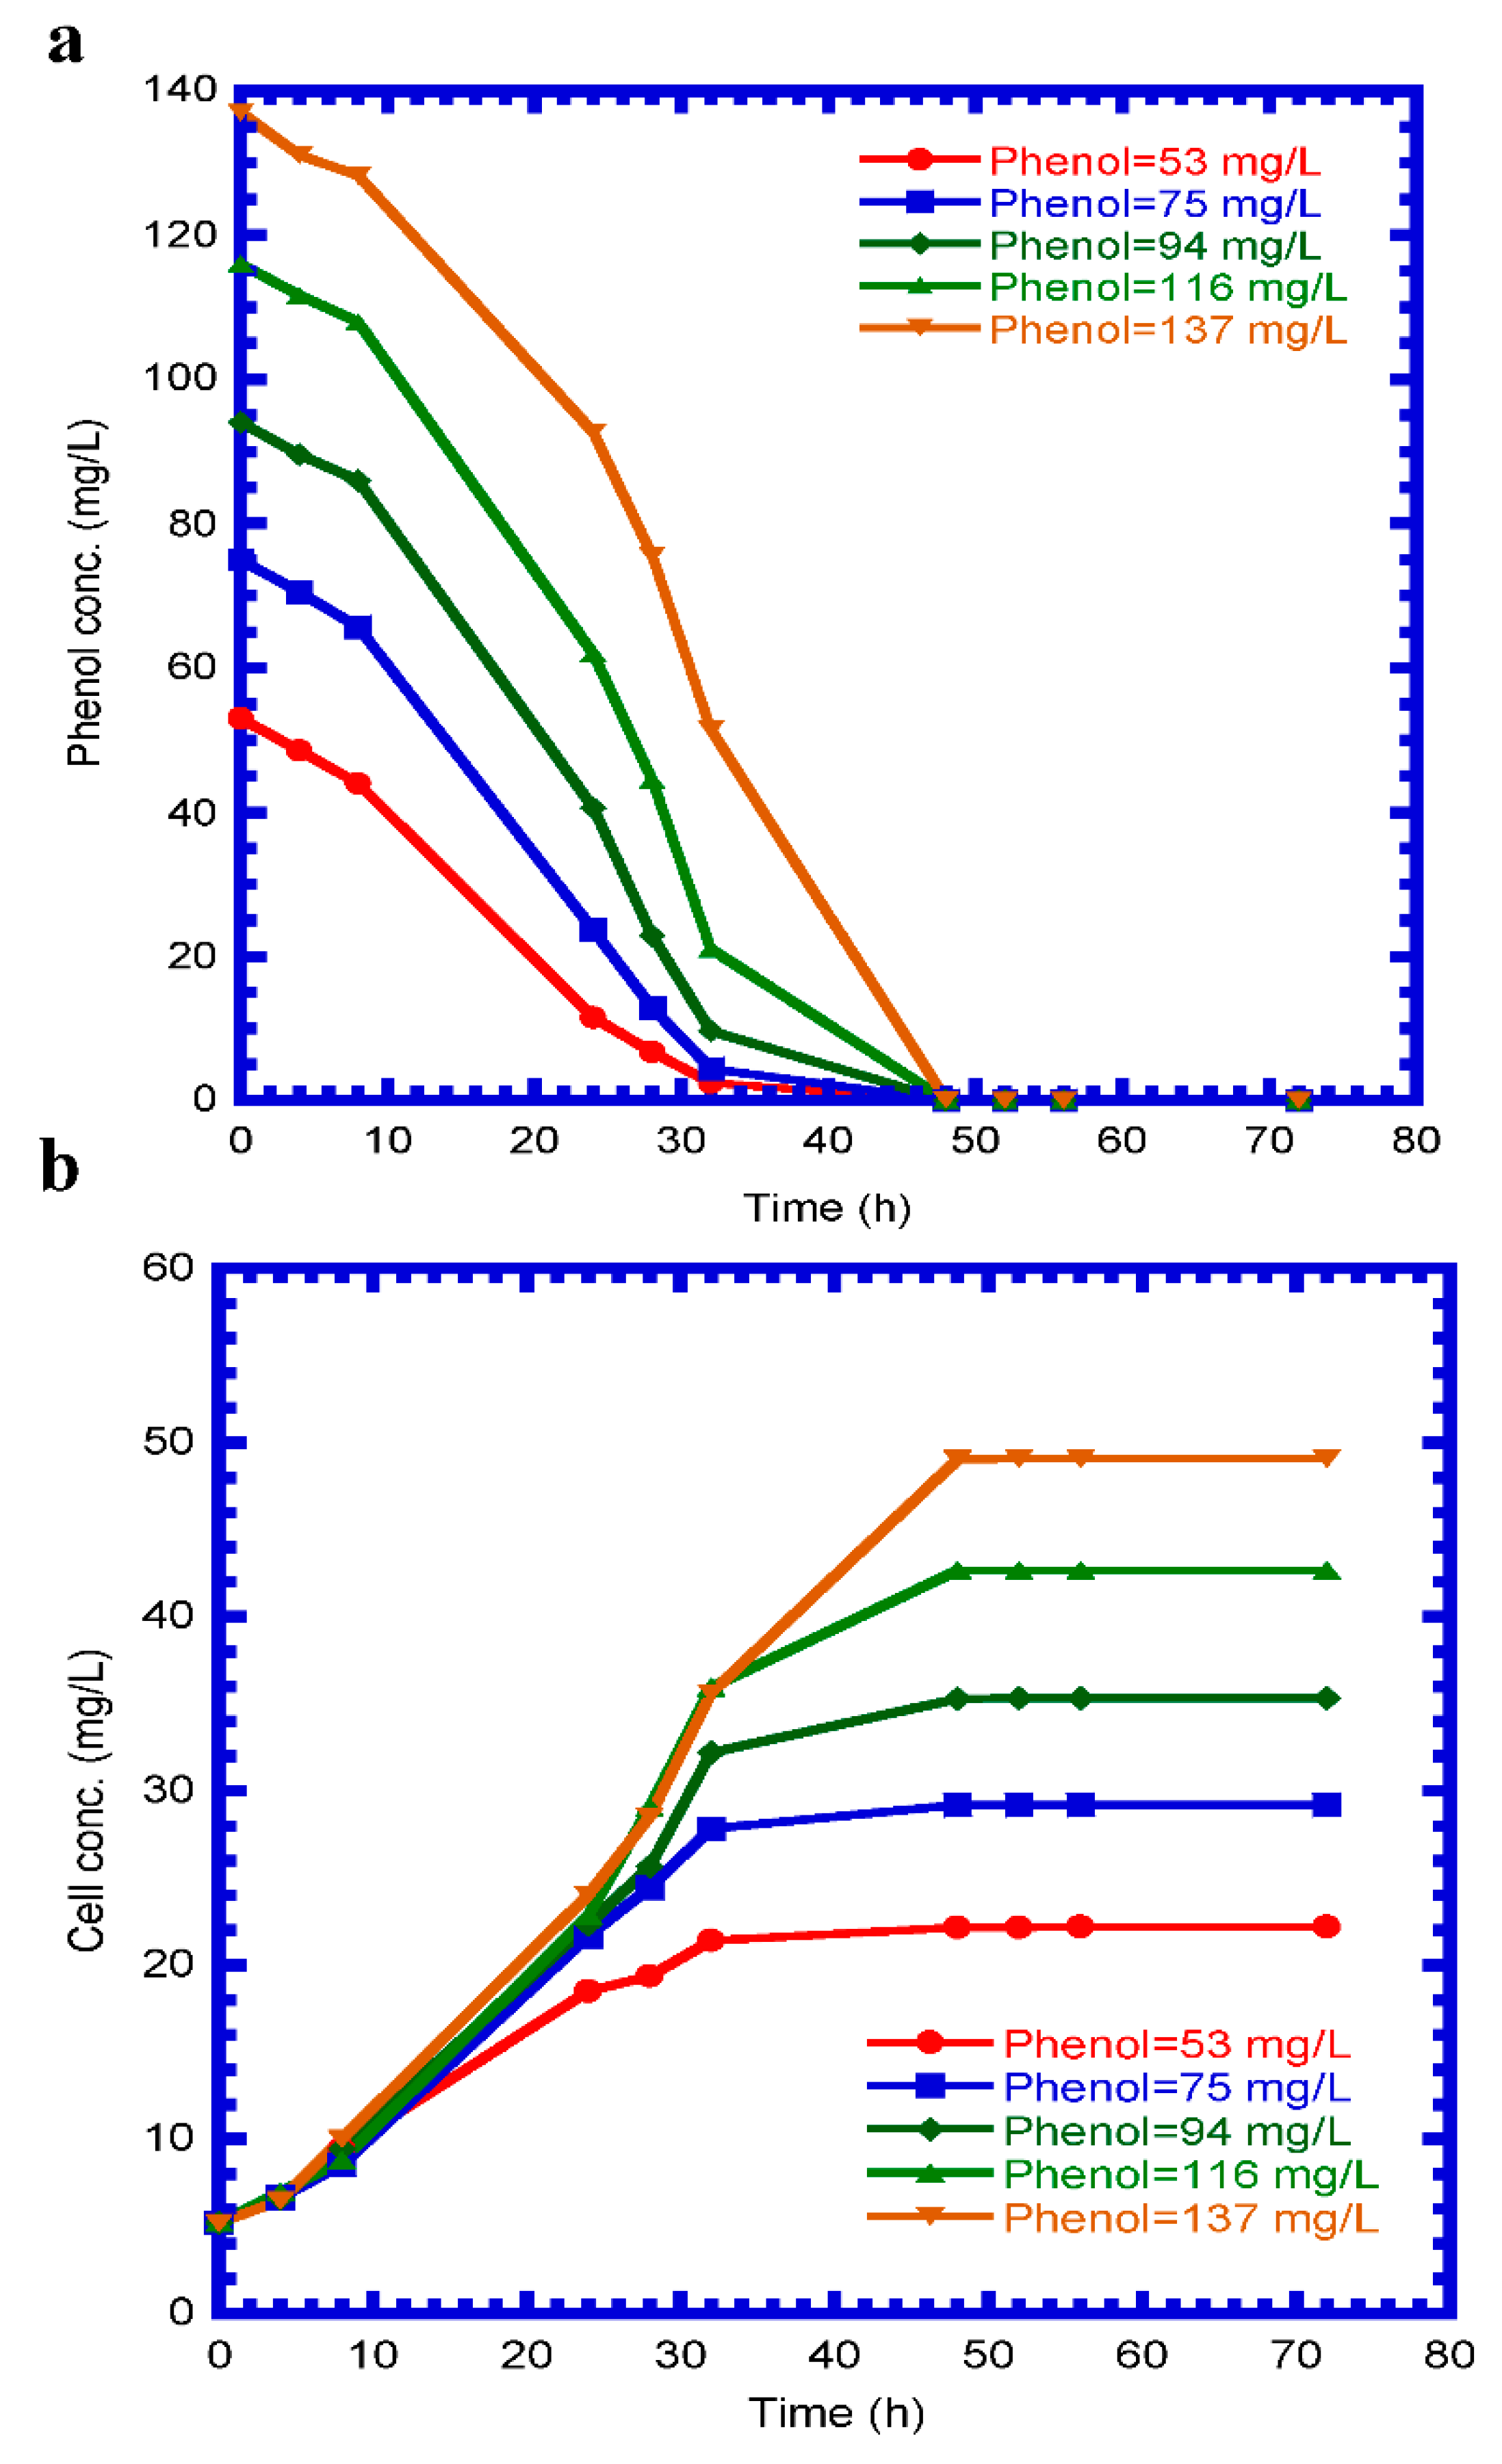
The time profiles of phenol degradation and cell growth in the batch experiments are illustrated in Figure 2. As can be observed in Figure 2a, the rate of phenol degradation after 10 h decreased more quickly than before 10 h in the individual phenol content. Throughout all of the batch experiments, the rate of phenol degradation remained approximately the same at the initial phenol concentration of 53‒137 mg/L. Complete removal of the phenol content was achieved after 52 h. The time course for the growth curves of the cells is presented in Figure 2b. No obvious lag phase was observed at the onset of the batch experiments. The growth curves can be divided into three phases including a log growth phase from 0 to 32 days, a linear growth phase from 32 to 48 days, and a stationary phase from 48 to 72 days. The cell contents ranged from 22.2 to 49.1 mg cell/L at various phenol contents from 53 to 137 mg/L at the stationary phase.

4.2. Determination of Kinetic Parameters

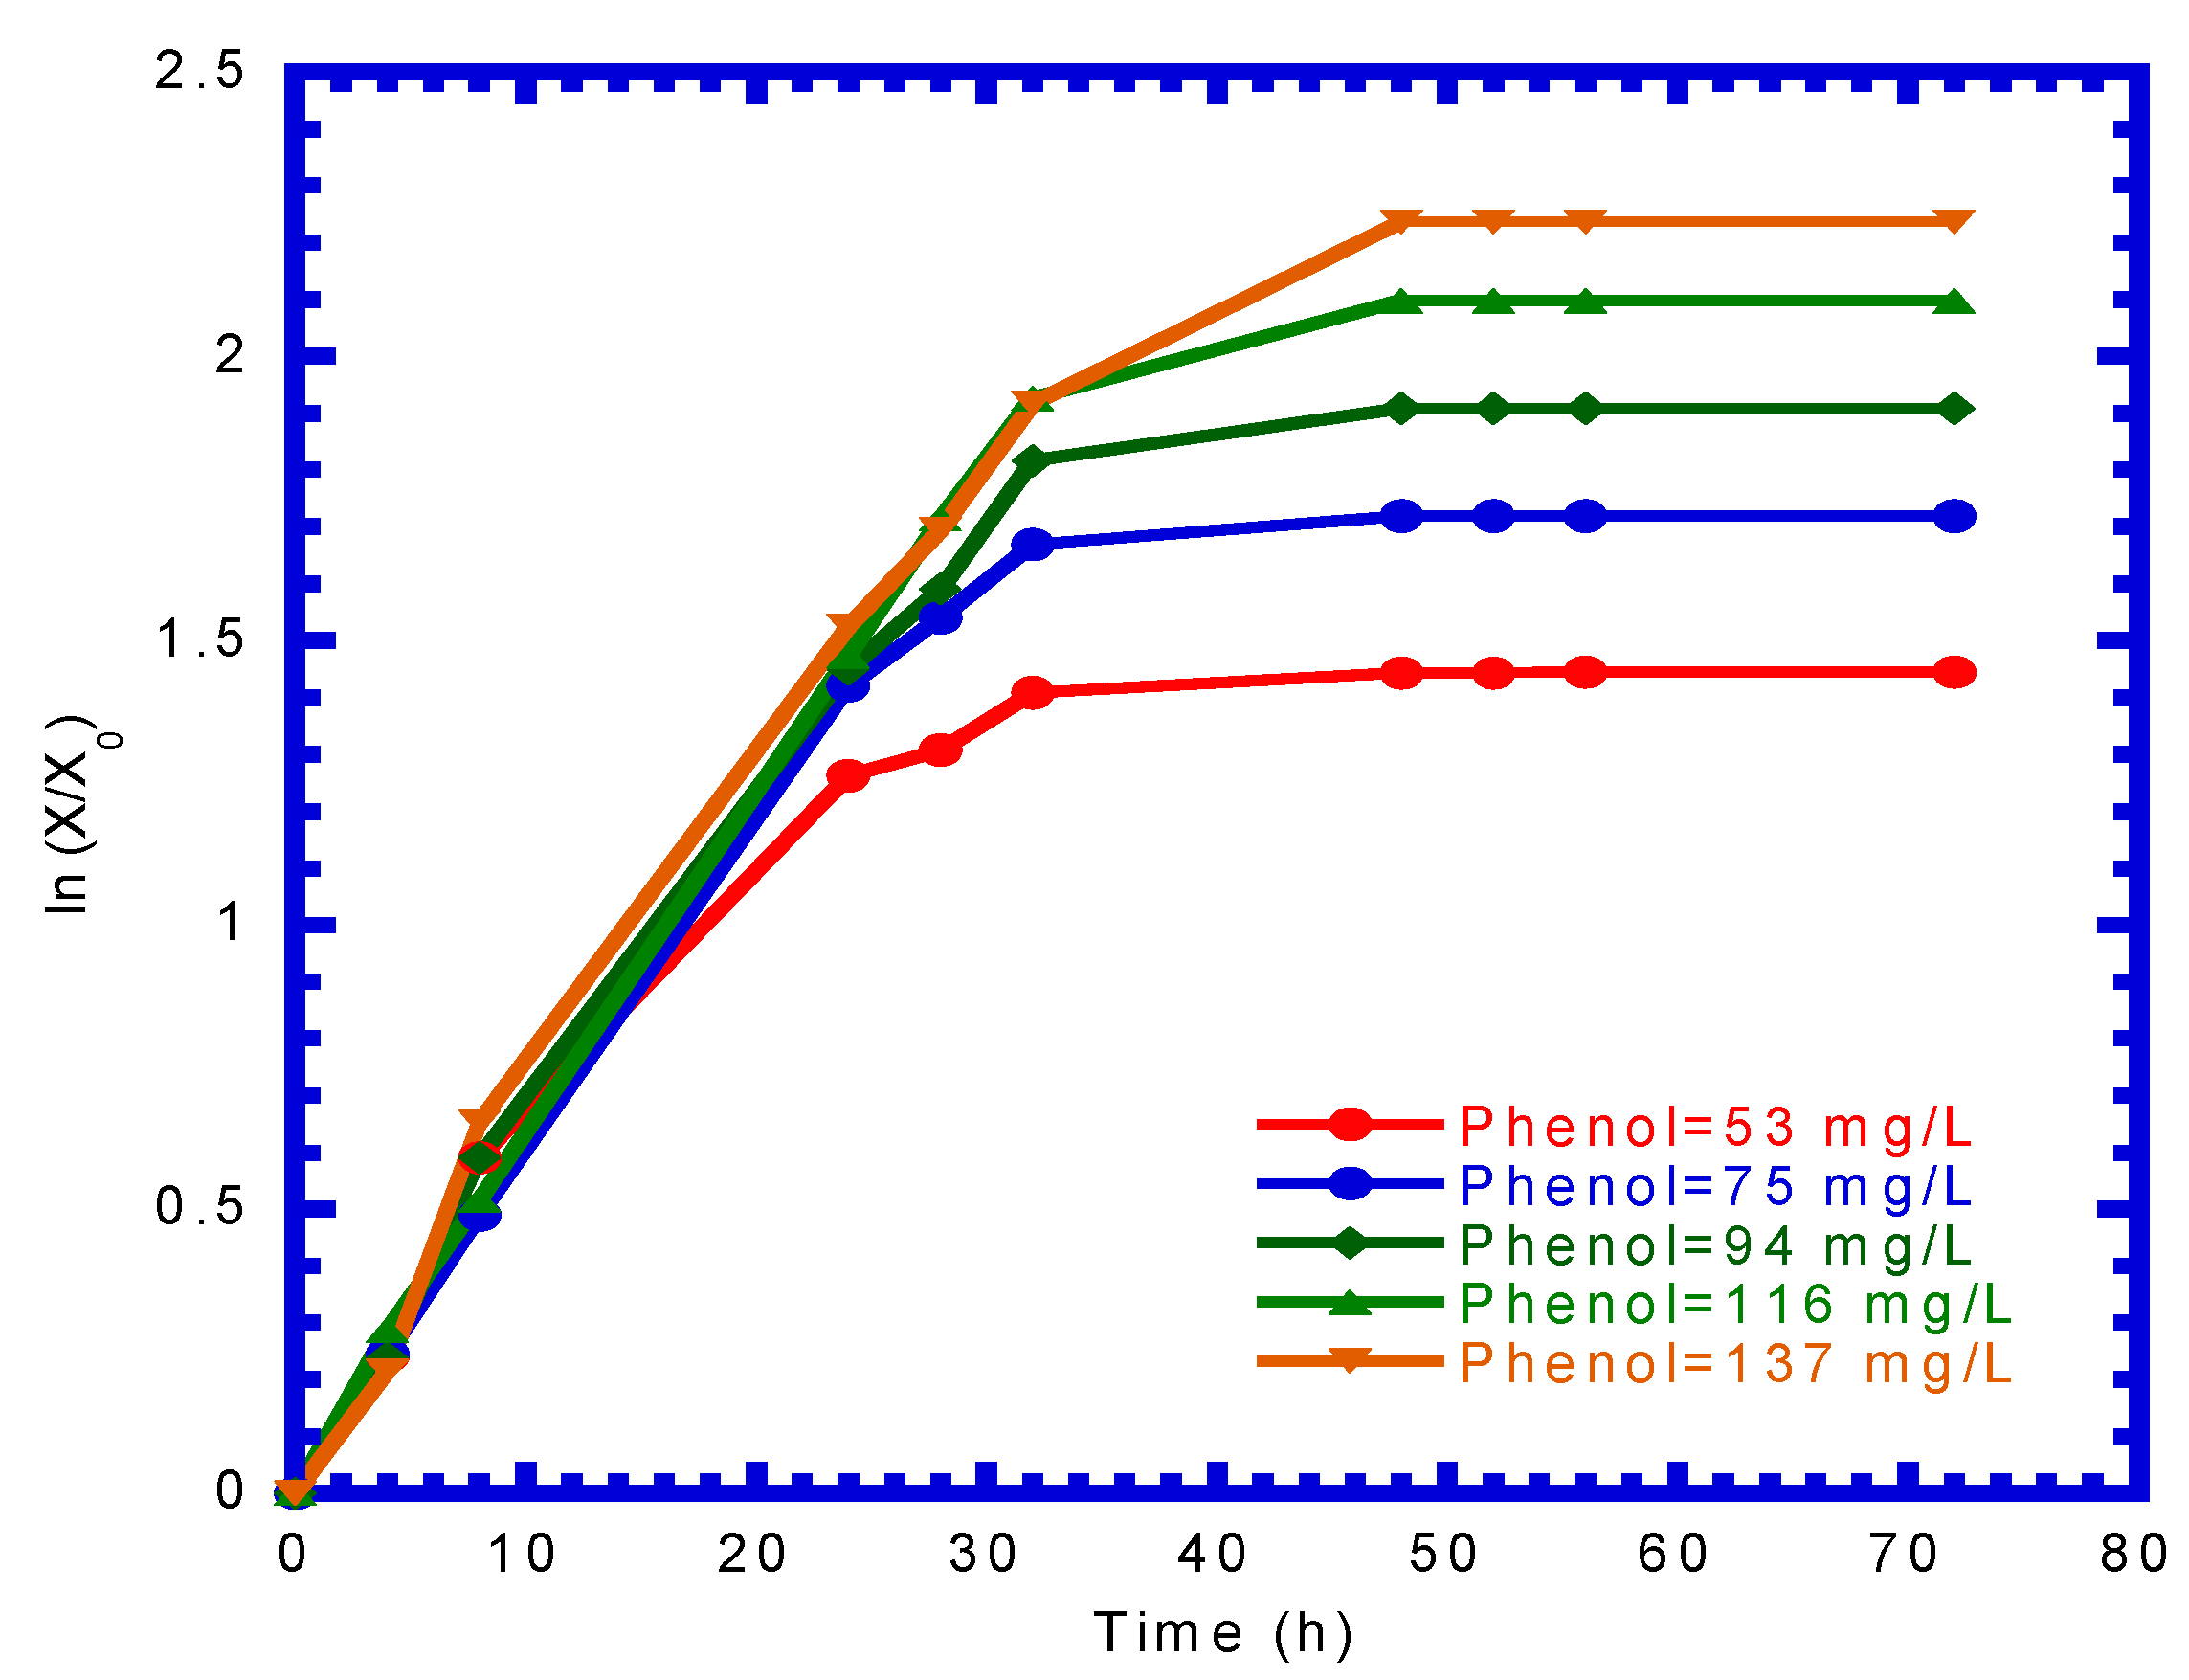
The variation of ln (X/X0) versus time is shown in Figure 3, which can be used to determine the individual specific cell growth rate (μ) at the log growth phase with an initial phenol concentration of 53‒117 mg/L. The values of μ obtained from each batch test were 0.044, 0.052, 0.057, 0.060, and 0.047 1/h, respectively. Figure 4 shows the comparison of the experimental data and Haldane modeling results to determine the kinetic constants of the cells. The best-fit value was 0.15 1/h for μm, 87.5 mg/L for KS, and 111.6 for KI, respectively, with an SSR of 9.90 × 10⁻⁵. Therefore, the Haldane kinetic model in the batch tests can be expressed as
μ = 0.15 S 87.5 + S + S 2 / 111.6
The kinetic constants of Haldane kinetics for phenol degradation by P. putida obtained from the literature and this study are listed in Table 1. The value we obtained for μm (0.15 1/h) was within the range of 0.051‒0.57 1/h reported in the literature. The KS value (87.5 mg/L) we obtained was much higher than those reported in the literature ranging from 1.1 to 36.33 mg/L, as different initial phenol concentrations, culture media, and operational conditions of temperature and pH were applied to their experiments. In contrast, the lower value of KI (111.6 mg/L) obtained in this study was mainly due to the lower initial phenol concentrations ranging from 53 to 137 mg/L, which fall near to the lower end of the literature ranging from 54.1 to 903 mg/L. The batch experiments to calculate the cell yield (Y) are plotted in Figure 5. The mean and standard deviation values of Y obtained from various batch tests was 0.316 ± 0.00732 mg cell/mg phenol.

4.3. Influence of Temperature on Phenol Utilization in Batch Mode

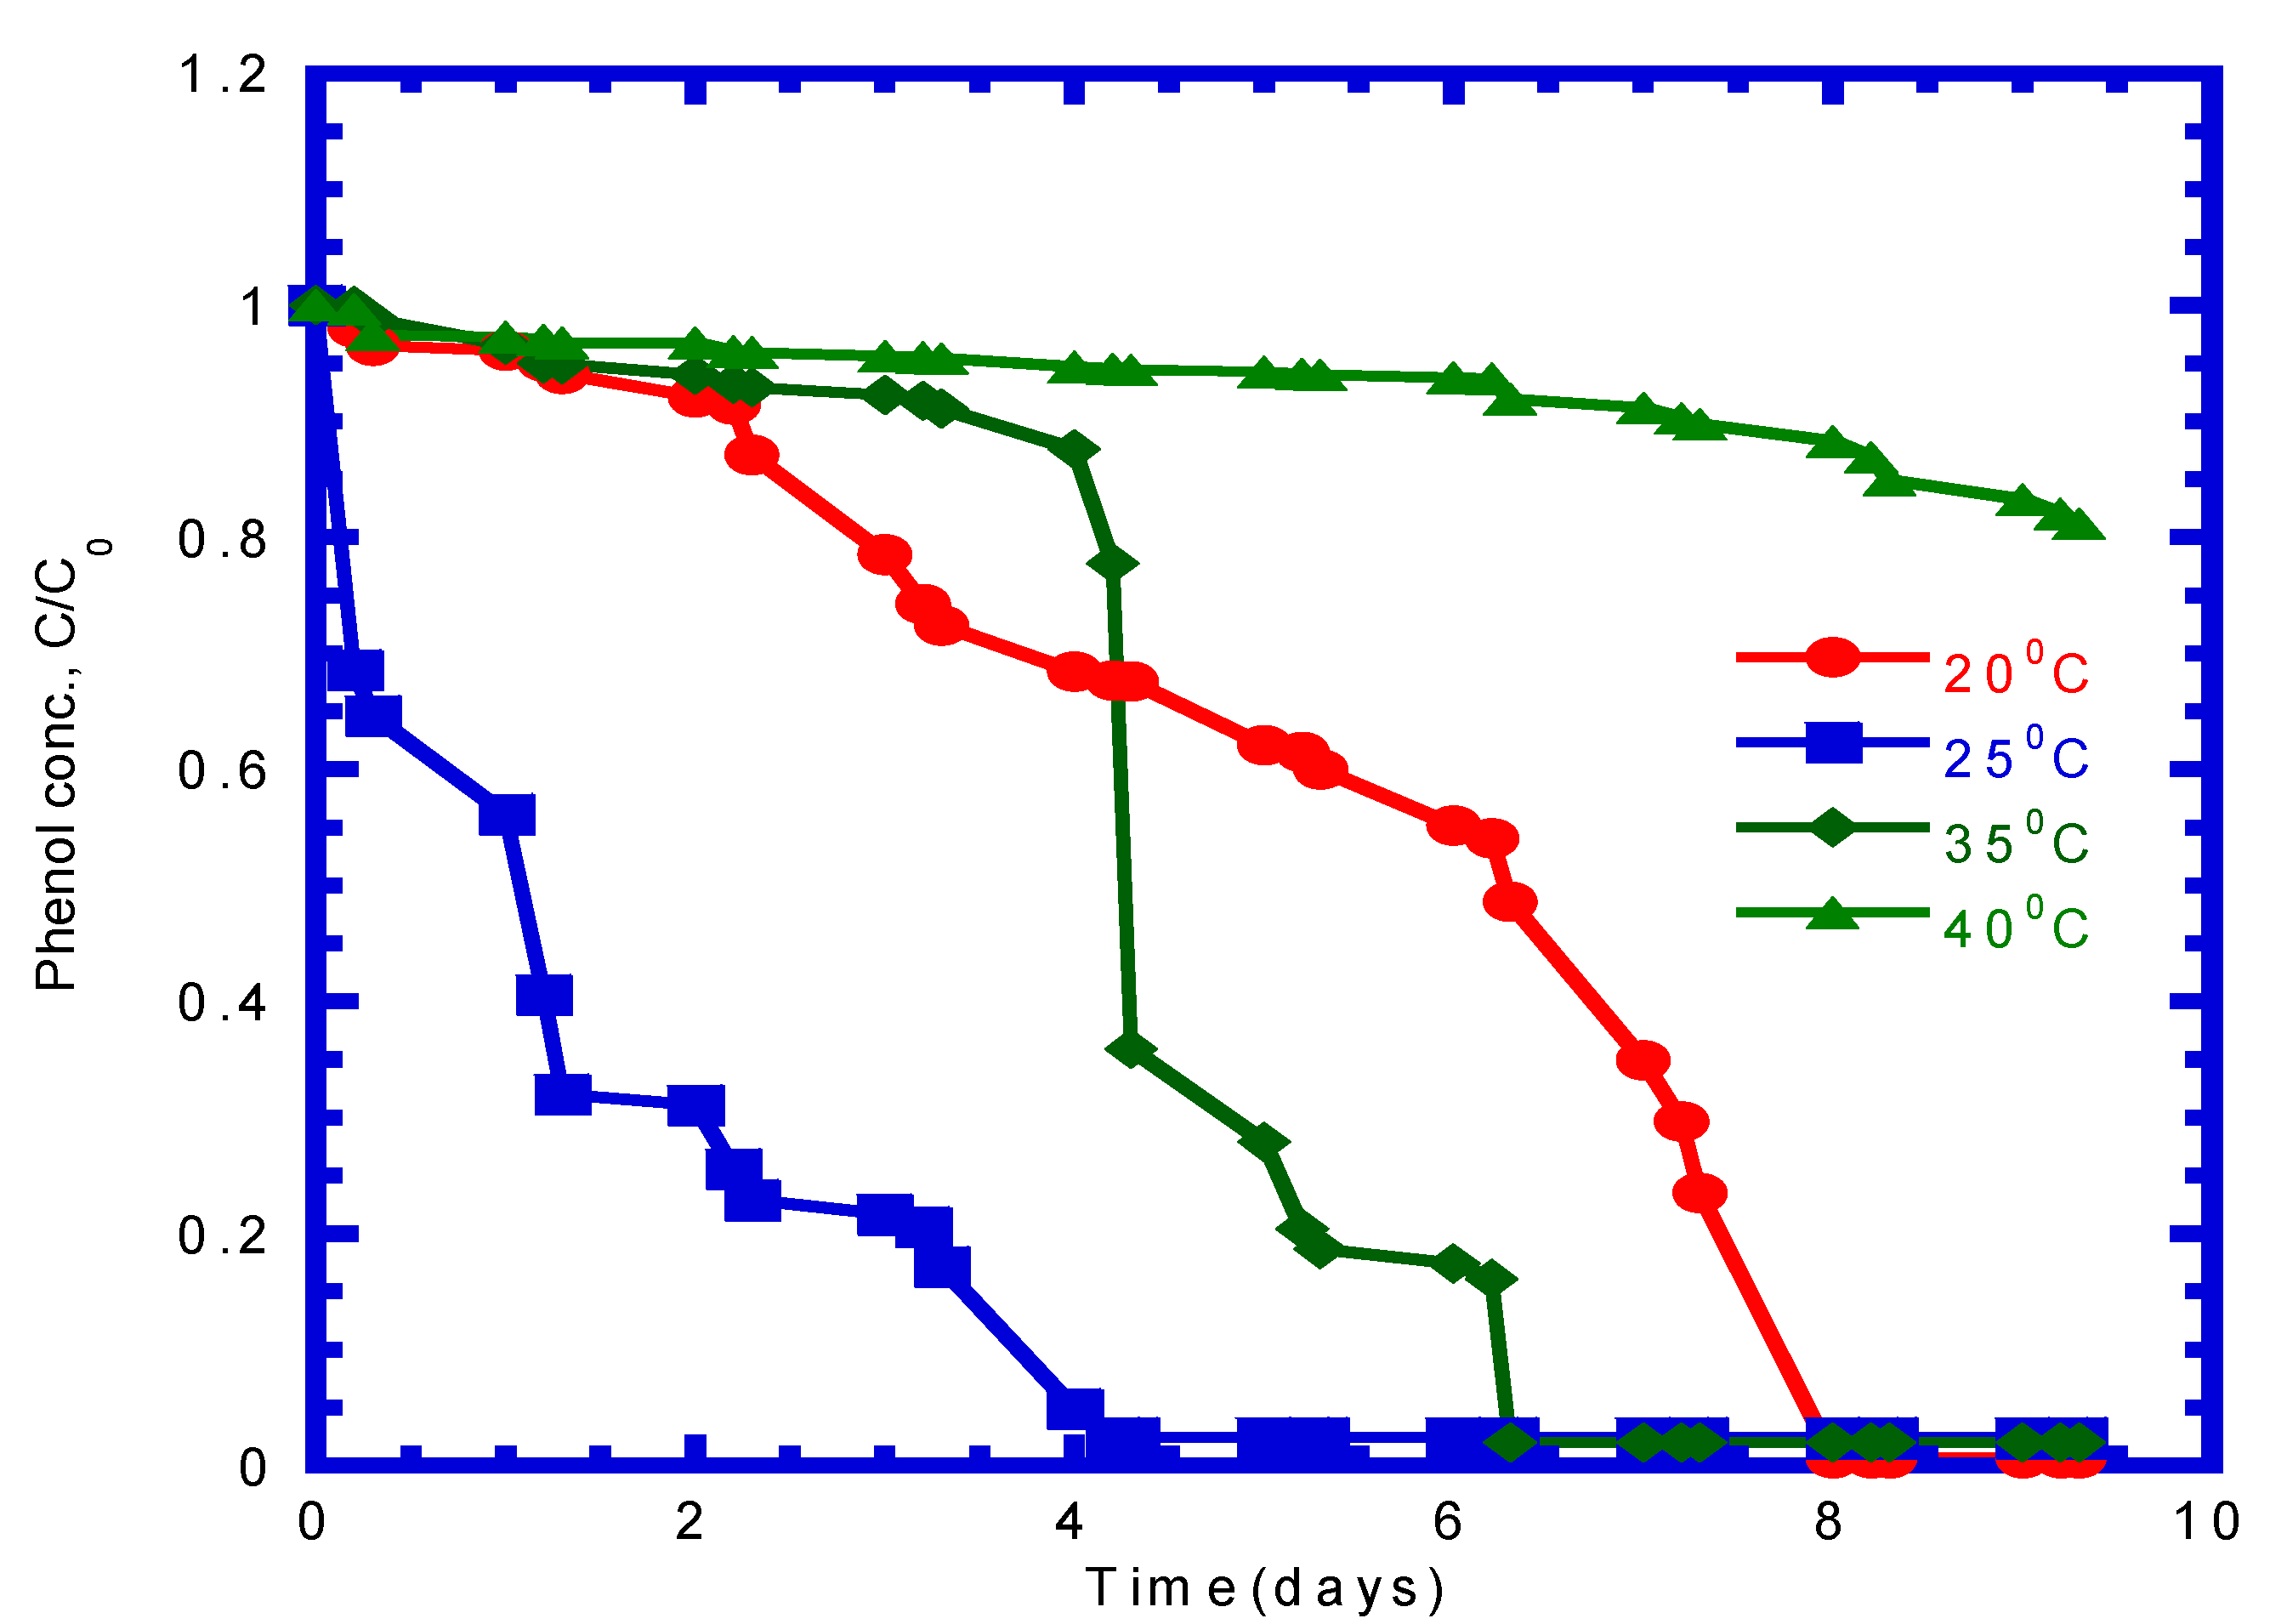
The influence of temperature on phenol utilization by the immobilized cells with 2 g nano-Fe3O4 with an initial phenol concentration of 336 mg/L is presented in Figure 6. An obvious lag phase was observed at 20, 35, and 40 °C. The phenol degradation rate at 25 °C is much higher than that at other temperatures prior to 4 days. However, at a cultivated temperature of 35 °C, the highest decreasing rate of phenol was found after 4 days. The time needed for the complete removal of phenol was 4.2, 6.3, and 8.0 days at 25, 35, and 20 °C, respectively. However, the phenol removal efficiency was approximately 18.8% at an operating time of 9.3 days at 40 °C. The fastest complete phenol removal was achieved at 25 °C.

4.4. Phenol Degradation by Free and Immobilized Cells in Batch Mode

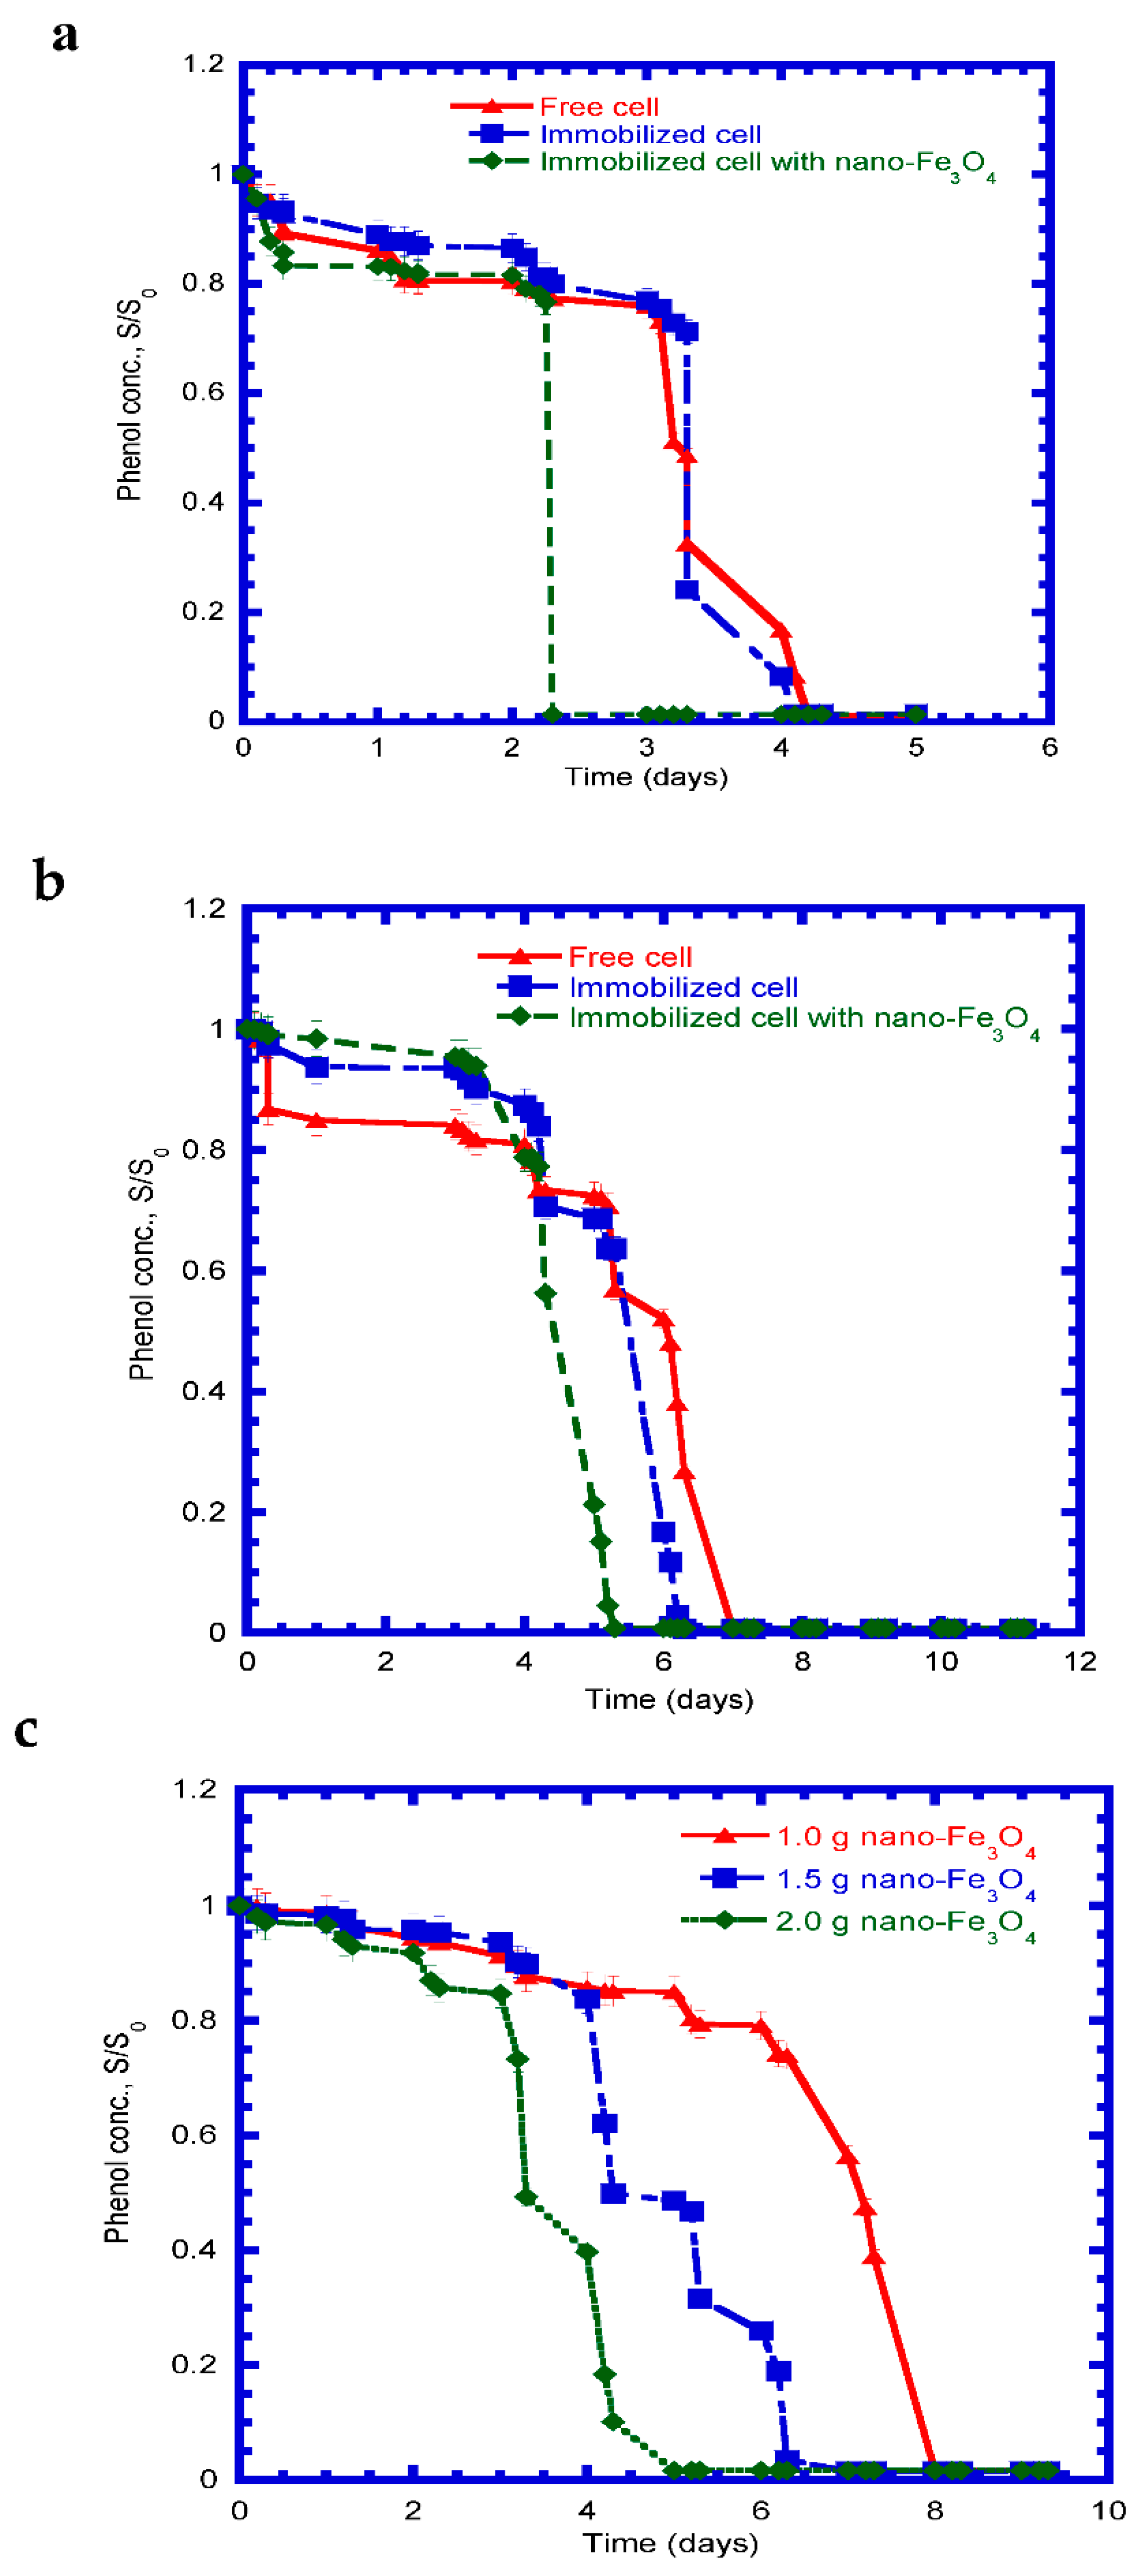
Phenol degradation by P. putida ATCC 17484 was investigated using both free and PVA–alginate-matrix-entrapped cells. As presented in Figure 7a, both strains had relatively high removal efficiencies after 4.2 days with approximately 199.6 mg/L initial phenol concentration. The time required for the almost complete degradation of phenol by the free cells, immobilized cells, and immobilized cells with nano-Fe3O4 was 4.2, 4.1, and 2.3 days, respectively. The removal of phenol within 2.3 days for the free cells, immobilized cells, and immobilized cells with nano-Fe3O4 was 22.7, 20.1, and 98.6%, respectively, indicating that P. putida cells entrapped in PVA–alginate with nano-Fe3O4 had the highest degradation performance. After a culture time of 5.3 days, the phenol was nearly completely degraded by the PVA–alginate magnetically immobilized cells, while only 43.1% of the initial phenol of 388.6 mg/L was removed by the free strains (Figure 7b).
Ke et al. [28] immobilized Bacillus sp. SAS19 on porous carbonaceous gels (CGs) for phenol degradation. The obtained results showed that the use of GCs for immobilizing Bacillus sp. SAS19 was capable of the complete degradation of 1800 mg/L phenol within 78 h. Their experimental results demonstrated that long-term utilization and recycling were more readily achieved for immobilized bacteria than for free bacteria. Previous studies showed that immobilized bacteria had better phenol degradation performance than free bacteria [28,29].
Table 1. Kinetic constants of Haldane kinetics for phenol biodegradation with P. putida.
CultureMaximum Initial Phenol Conc. (mg/L)μm (1/h)KS (mg/L)KI (mg/L)Temp (°C)/pHReference
P. putida DSM 50222-0.391.190330/6.6[30]
P. putida P 71-0.5718.599.425/6.8[31]
P. putida DSM 5481000.446.1954.126/6.9[32]
P. putida CCRC1 436510000.3313.966930/6.8[25]
P. putida F1 ATCC 7000075000.05118430.130/7.0[33]
P. putida MTCC 119410000.30536.33129.7929.9 ± 0.3/-[34]
P. putida 174841370.1587.5111.630/7.0This work
The phenol removal by immobilized cells with nanoscale Fe3O4 was much higher compared with the PVA–alginate immobilized cells. Figure 7c presents the effect of the amount of Fe3O4 nanoparticles on phenol degradation. The removal efficiencies of phenol at 4, 6, and 8 days for the immobilized cells with 1.0 g nano-Fe3O4 were 14.2, 20.9, and 98.4%, respectively. The time needed for almost complete phenol removal occurred at 8, 7, and 5 days as the dosage of nano-Fe3O4 increased from 1.0 g to 2.0 g. The increase in the nano-Fe3O4 dosage made the time required to complete the phenol removal shorter.
Jiang et al. [26] conducted the batch experiments to investigate the phenol removal rates by Debaryomyces strains immobilized in Ca–alginate beads with the addition of nano-Fe3O4 ranging from 1.0 g to 4.0 g. Their experimental results indicated that the phenol removal at 52 h was 92.3% with the addition of 1.0 g nano-Fe3O4. The increase in the nano-Fe3O4 dosage from 2.0 to 3.0 g did not lead to any noticeable improvement in the phenol removal. Complete phenol removal was achieved with the addition of 2–4 g nano-Fe3O4.

4.5. Phenol Degradation under Salinity in Batch Mode

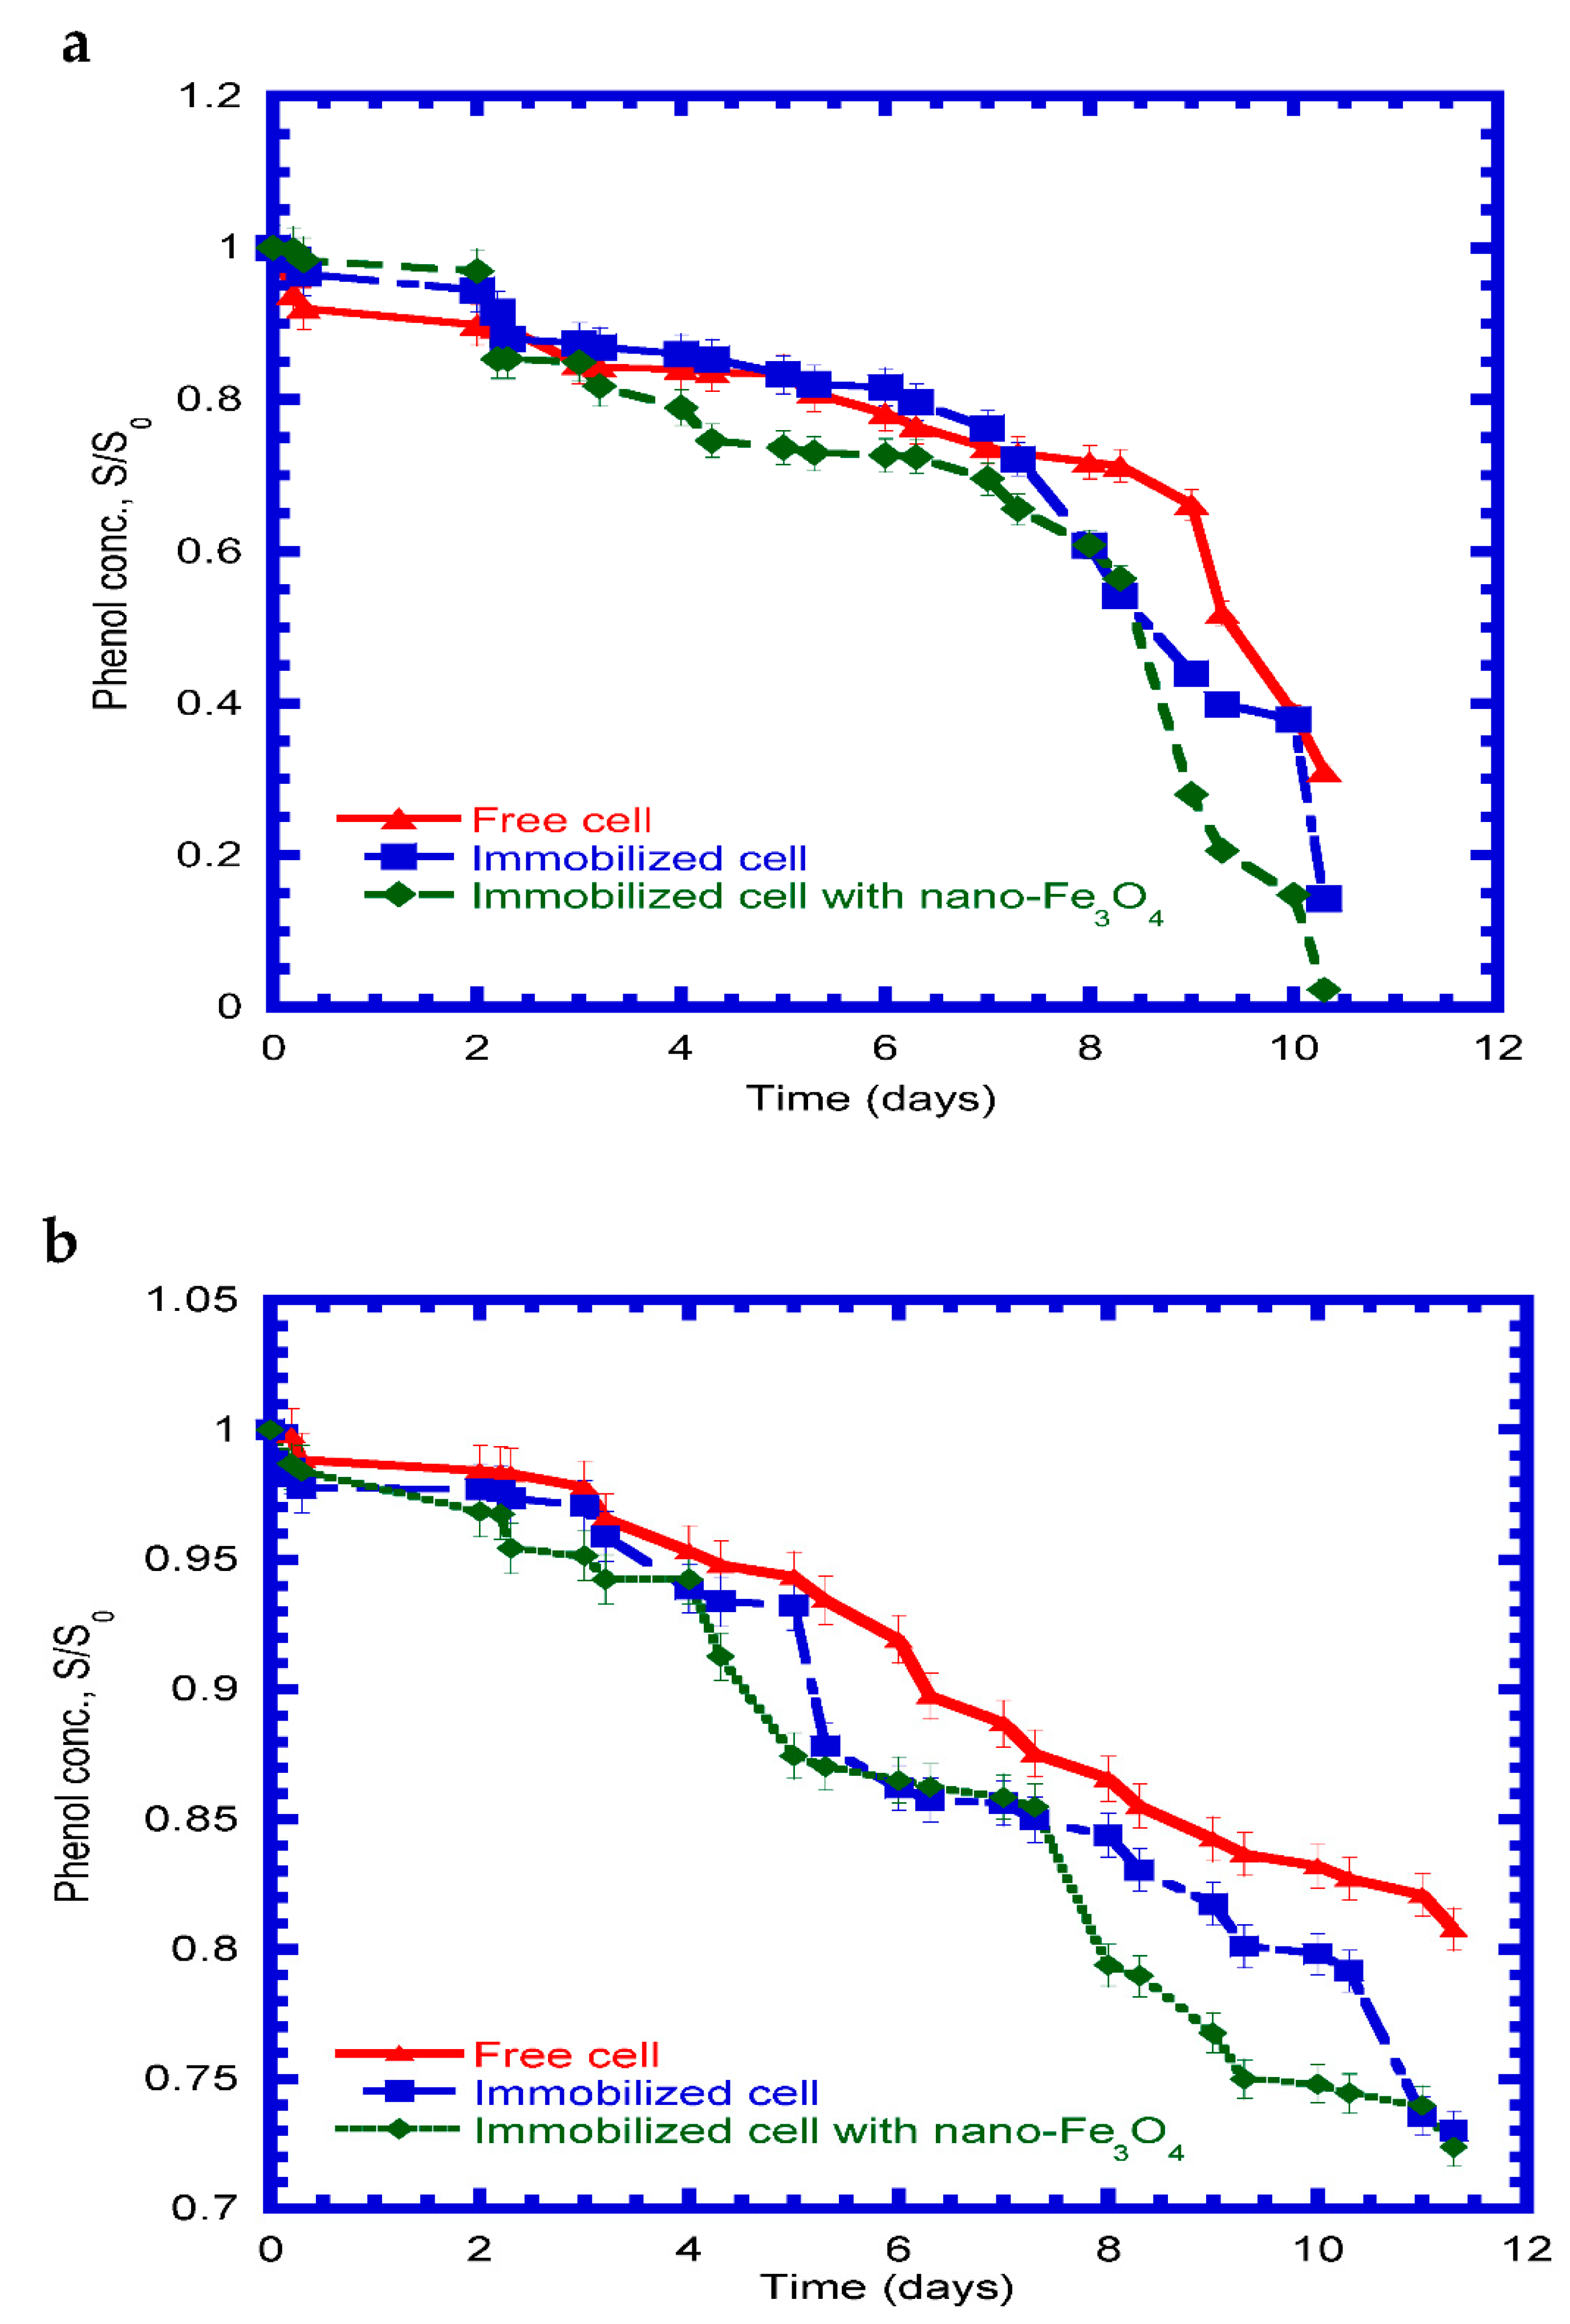
The removal efficiencies of phenol were examined under salinities of 1 and 5%. Figure 8a presents the phenol degradation curves by three kinds of cells at the low salinity of 1%. As shown in Figure 8a, the immobilized cells with and without nano-Fe3O4 exhibited better removal performance than the free cells. After a final cultivation time of 10.3 days, the phenol removal efficiencies of the free cells, PVA–alginate immobilized cells, and magnetically immobilized PVA-alginate cells were 69.0, 85.8, and 97.8%, respectively. Three kinds of cells for phenol degradation with a salinity of 5% in the media supplements are illustrated in Figure 8b. After a culture time of 11.3 days, the phenol degradation efficiency by free cells, entrapped cells, and entrapped cells with nanoscale Fe3O4 was 19.2, 27.0, and 27.6%, respectively. No significant difference was noted for phenol degradation removal between entrapped cells with and without nano-Fe3O4. Noticeably, the advantage of the addition of Fe3O4 nanoparticles was insignificant for phenol degradation under a salinity of 5%.

4.6. Phenol Degradation in Continuous Mode

The input parameters of the kinetic model of the continuous reactor with immobilized cells are listed in Table 2. The kinetics of the phenol utilization with immobilized cells in the continuous reactor was estimated by feeding in an initial phenol content of 137 mg/L. Figure 9a shows the variation of phenol degradation with time. The immobilized cells model was validated by experimental data in comparison with the model-predicted data as observed in Figure 9a. Three phases in phenol degradation were discussed. First, the dilute-in characteristics caused the phenol content to gradually elevate to approximately 120.4 mg/L (Cb/Cb0 = 0.879). Second, the phenol concentration gradually declined because the immobilized cells actively degraded the phenol during a transient time period. When the system achieved the steady-state condition during a period of 7–15 days, the average phenol concentration in effluent was nearly 8.11 mg/L (Cb/Cb0 = 0.0592). The phenol removal was approximately 94.1% during the steady-state condition.
The predicted time profile of immobilized cell growth is plotted in Figure 9b. The curve of the cell growth follows the lag phase, log-growth phase, and stable phase. Cell growth began at approximately 4 days. The cells grew rapidly between days 4 and 14 due to significant phenol consumption during this period. The maximum cell concentration obtained from the model prediction was 20.1 mg cell/L. Figure 9c shows that the flux of the phenol diffused into the beads varied with time. At the onset of the column test, the value of the flux was zero and the growth of the entrapped cells was insignificant. The flux of phenol diffused into the beads rapidly increased as the phenol utilization by the immobilized cells increased vigorously during the transient period of time between days 1 and 5. At a stable condition between 5 and 15 days, the predicted flux value remained approximately 0.046 mg/cm2‒d.
The influence of HRTs on phenol degradation in the continuous mode is shown in Figure 10. A continuous reactor packed with entrapped cells was conducted until stable performance was reached. In the stable condition, the flow rate was controlled to yield the various HRTs at 3.1, 5.2, 6.3, 7.8, and 10.5 h, respectively, under an initial phenol concentration of 137 mg/L. As noted in Figure 10, higher HRT removed more phenol due to sufficient HRT for effective cell growth to utilize phenol. The corresponding removal of the phenol ranged from 93.3 to 95.9%, while the HRTs were controlled at 3.1‒10.5 h.

5. Conclusions

Five batch experiments were run to obtain kinetic parameters (μm, KS, and KI). The μm and KI values fell within the range of that specified in the literature, except for KS. In the continuous mode, high phenol removal between 93.3 and 95.9% was obtained at various HRTs between 3.1 and 10.5 h. The experimental and immobilized cell modeling results attained from the continuous reactor had good agreement with each other. The immobilized P. putida cells had a better phenol degradation performance than that of the free cells. With the addition of nano-Fe3O4, the time required to achieve complete phenol removal was shorter. The immobilized cells with nano-Fe3O4 had the best phenol degradation performance at a salinity of 1%. In contrast, no significant phenol removal was observed for the free cells, immobilized cells, and immobilized cells with nano-Fe3O4 at a salinity of 5%. The approaches presented in this study were practical in actual phenol-containing wastewater treatment.

Author Contributions

Y.-H.L. conceived and designed the batch experiments, developed and solved the immobilized cells kinetic model, and analyzed the experimental results. Y.-J.G. conducted the batch and continuous reactor experiments and collected the samples for analysis. All authors have read and agreed to the published version of the manuscript.

Funding

This research was supported by a grant from the National Science and Technology Council of Taiwan under Contract No. MOST 110-2221-E-166-003.

Data Availability Statement

Not applicable.

Conflicts of Interest

The authors declare no conflict of interest.

References

  1. Zhao, J.; Li, Y.; Yu, Z.; Chen, X. Effects of 4-chlorophenol wastewater treatment on sludge acute toxicity, microbial diversity and functional genes expression in an activated sludge process. Bioresour. Technol. 2018, 265, 39–44. [Google Scholar] [CrossRef]
  2. Zhu, M.; Li, N.; Lu, Y.; Hu, Z.; Chen, S.; Zeng, R.J. The performance and microbial communities of an anaerobic membrane bioreactor for treating fluctuating 2-chlorophenol wastewater. Bioresour. Technol. 2020, 317, 124001. [Google Scholar] [CrossRef]
  3. Liu, Q.S.; Zheng, T.Z.; Wang, P.; Jiang, J.P.; Li, N. Adsorption isotherm, kinetic and mechanism studies of some substituted phenols on activated carbon fibers. Chem. Eng. J. 2010, 157, 348–356. [Google Scholar] [CrossRef]
  4. Arora, P.K.; Bae, H. Bacterial degradation of chlorophenols and their derivatives. Microb. Cell Factories 2014, 13, 31. [Google Scholar] [CrossRef] [Green Version]
  5. Kayan, I.; Oz, N.A.; Kantar, C. Coupling pyrite-Fenton process with aerobic biodegradation for the treatment of 2-chlorophenol. Water Air Soil Pollut. 2020, 231, 463. [Google Scholar] [CrossRef]
  6. Yang, M.; Huang, Y.; Cao, H.; Lin, Y.; Cheng, X.; Wang, X. A novel polymeric adsorbent by a self-doped manner: Synthesis, characterization, and adsorption performance to phenol from aqueous solution. Polym. Bull. 2016, 73, 2321–2341. [Google Scholar] [CrossRef]
  7. Xue, J.; Wu, Y.; Shi, K.; Xiao, X.; Gao, Y.; Li, L.; Qiao, Y. Study on the degradation performance and kinetics of immobilized cells in straw-alginate beads in marine environment. Bioresour. Technol. 2019, 280, 88–94. [Google Scholar] [CrossRef] [PubMed]
  8. Tong, K.; Zhang, Y.; Liu, G.; Ye, Z.; Chu, P.K. Treatment of heavy oil wastewater by a conventional activated sludge process coupled with an immobilized biological filter. Int. Biodeterior. Biodegrad. 2013, 84, 65–71. [Google Scholar] [CrossRef]
  9. Li, S.; Ma, B.; She, Z.; Guo, L.; Zhao, Y.; Jin, C.; Gao, M. Effect of norfloxacin on performance, microbial enzymatic activity and microbial community of a sequencing batch reactor. Environ. Technol. Innov. 2020, 18, 100726. [Google Scholar] [CrossRef]
  10. González, G.; Herrera, M.G.; García, M.T.; Peña, M.M. Biodegradation of phenol in a continuous process: Comparative study of stirred tank and fluidized-bed bioreactors. Bioresour. Technol. 2001, 76, 245–251. [Google Scholar] [CrossRef] [PubMed]
  11. Bergero, M.F.; Lucchesi, G.I. Immobilization of Pseudomonas putida A (ATCC 12633) cells: A promising tool for effective degradation of quaternary ammonium compounds in industrial effluents. Int. Biodeterior. Biodegrad. 2015, 100, 38–43. [Google Scholar] [CrossRef]
  12. Kureel, M.K.; Geed, S.R.; Giri, B.S.; Shukla, A.K.; Rai, B.N.; Singh, R.S. Removal of aqueous benzene in the immobilized batch and continuous packed bed bioreactor by isolated bacillus, sp. m1. Resour.-Effic. Technol. 2016, 2, S87–S95. [Google Scholar] [CrossRef]
  13. Parameswarappa, S.; Karigar, C.; Nagenahalli, M. Degradation of ethylbenzene by free and immobilized Pseudomonas fluorescens-cs2. Biodegradation 2008, 19, 137–144. [Google Scholar] [CrossRef] [PubMed] [Green Version]
  14. Stelting, S.; Burns, R.G.; Sunna, A.; Visnovsky, G.; Bunt, C.R. Immobilization of Pseudomonas sp. strain ADP: A stable inoculant for the bioremediation of atrazine. App. Clay Sci. 2012, 64, 90–93. [Google Scholar] [CrossRef]
  15. Isaka, K.; Udagawa, M.; Kimura, Y.; Sei, K.; Ike, M. Biological wastewater treatment of 1,4-dioxane using polyethylene glycol gel carriers entrapping Afipia sp. D1. J. Biosci. Bioeng. 2016, 121, 203–208. [Google Scholar] [CrossRef]
  16. Wang, X.; Gai, Z.; Yu, B.; Feng, J.; Xu, C.; Yuan, Y.; Lin, Z.; Xu, P. Degradation of carbazole by microbial cells immobilized in magnetic gellan gum gel beads. Appl. Environ. Microbiol. 2007, 73, 6421–6428. [Google Scholar] [CrossRef] [Green Version]
  17. Shi, S.; Qu, Y.; Ma, F.; Zhou, J. Bioremediation of coking wastewater containing carbazole, dibenzofuran and dibenzothiphene by immobilized naphthalene-cultivated Arthrobacter sp. W1 in magnetic gellan gum. Bioresour. Technol. 2014, 166, 79–86. [Google Scholar] [CrossRef]
  18. Leilei, Z.; Mingxin, H.; Suiyi, Z. Biodegradation of p-nitrophenol by immobilized Rhodococcus sp. strain Y-1. Chem. Biochem. Eng. Q. 2012, 26, 137–144. [Google Scholar]
  19. Hou, J.; Liu, F.; Wu, N.; Ju, J.; Yu, B. Efficient biodegradation of chlorophenols in aqueous phase by magnetically immobilized aniline-degrading Rhodococcus rhodochrous strain. J. Nanobiotechnol. 2016, 14, 5. [Google Scholar] [CrossRef] [Green Version]
  20. Bhunia, B.; Basak, B.; Bhattacharya, P.; Dey, A. Kinetic studies of alkaline protease from Bacillus licheniformis NCIM-2042. J. Microbiol. Biotechnol. 2012, 22, 1758–1766. [Google Scholar] [CrossRef]
  21. Liu, J.; Jia, X.; Wen, J.; Zhou, Z. Substrate interactions and kinetics study of phenolic compounds biodegradation by Pseudomonas sp. cbp 1-3. Biochem. Eng. J. 2012, 67, 156–166. [Google Scholar] [CrossRef]
  22. Massalha, N.; Shaviv, A.; Sabbah, I. Modeling the effect of immobilization of microorganisms on the rate of biodegradation of phenol under inhibitory conditions. Water Res. 2010, 44, 5252–5259. [Google Scholar] [CrossRef] [PubMed]
  23. Wang, S.J.; Loh, K.C. Modeling the role of metabolic intermediates in kinetics of phenol biodegradation. Enzyme Microb. Technol. 1999, 25, 177–184. [Google Scholar] [CrossRef]
  24. Juang, R.S.; Tsai, S.Y. Growth kinetics of Pseudomonas putida in the biodegradation of single and mixed phenol and sodium salicylate. Biochem. Eng. J. 2006, 31, 133–140. [Google Scholar] [CrossRef]
  25. Chung, T.P.; Tseng, H.Y.; Juang, R.S. Mass transfer effect and intermediate detection for phenol degradation in immobilized Pseudomonas putida systems. Process Biochem. 2003, 38, 1497–1507. [Google Scholar] [CrossRef]
  26. Jiang, Y.; Deng, T.; Shang, Y.; Yang, K.; Wang, H. Biodegradation of phenol by entrapped cell of Debaryomyces sp. with nano-Fe3O4 under hypersaline conditions. Int. Biodeterior. Biodegrad. 2017, 123, 37–45. [Google Scholar] [CrossRef]
  27. Kumar, S.S.; Kumar, M.S.; Siddavattam, D.; Karegoudar, T.B. Generation of continuous packed bed reactor with PVA-alginate blend immobilized Ochrobactrum sp. DGVK1 cells for effective removal of N,N-dimethylformamide from industrial effluents. J. Hazard. Mater. 2012, 199–200, 58–63. [Google Scholar] [CrossRef]
  28. Ke, Q.; Zhang, Y.; Wu, X.; Su, X.; Wang, Y.; Lin, H.; Mei, R.; Zhang, Y.; Hashmi, M.Z.; Chen, C.; et al. Sustainable Biodegradation of phenol by immobilized Bacillus sp. SAS19 with porous carbonaceous gels as carriers. J. Environ. Manag. 2018, 222, 185–189. [Google Scholar] [CrossRef]
  29. Huang, R.Y.; Tian, W.J.; Liu, Q.; Yu, H.B.; Jin, X.; Zhao, Y.G. Enhanced biodegradation of pyrene and indeno(1,2,3-cd)pyrene using immobilized in cinder beads in estuarine wetlands. Mar. Pollut. Bull. 2016, 102, 128–133. [Google Scholar] [CrossRef]
  30. Hutchinson, D.H.; Robinson, C.W. Kinetics of simultaneous batch degradation of cresol and phenol by Pseudomonas putida. Appl. Microbiol. Biotechnol. 1988, 25, 599–604. [Google Scholar] [CrossRef]
  31. Beyenal, H.S.; Tanyolac, S.A.; Salih, B. Diffusion coefficients of phenol and oxygen in a biofilm of Pseudomonas putida. AIChE J. 1997, 43, 243–250. [Google Scholar] [CrossRef]
  32. Monteiro, A.A.M.G.; Boaventura, R.A.R.; Rodrigues, A.E. Phenol biodegradation by Pseudomonas putida DSM 548 in a batch reactor. Biochem. Eng. J. 2000, 6, 45–49. [Google Scholar] [CrossRef] [PubMed]
  33. Abuhamed, T.; Bayrakter, E.; Mehmetoglu, T.; Mehmetoglu, U. Kinetics model for growth of Pseudomonas putida F1 during benzene, toluene and phenol biodegradation. Process Biochem. 2004, 39, 983–988. [Google Scholar] [CrossRef]
  34. Kumar, A.; Kumar, S.; Kumar, S. Biodegradation kinetics of phenol and catechol using Pseudomonas putida MTCC 1194. Biochem. Eng. J. 2005, 22, 151–159. [Google Scholar] [CrossRef]
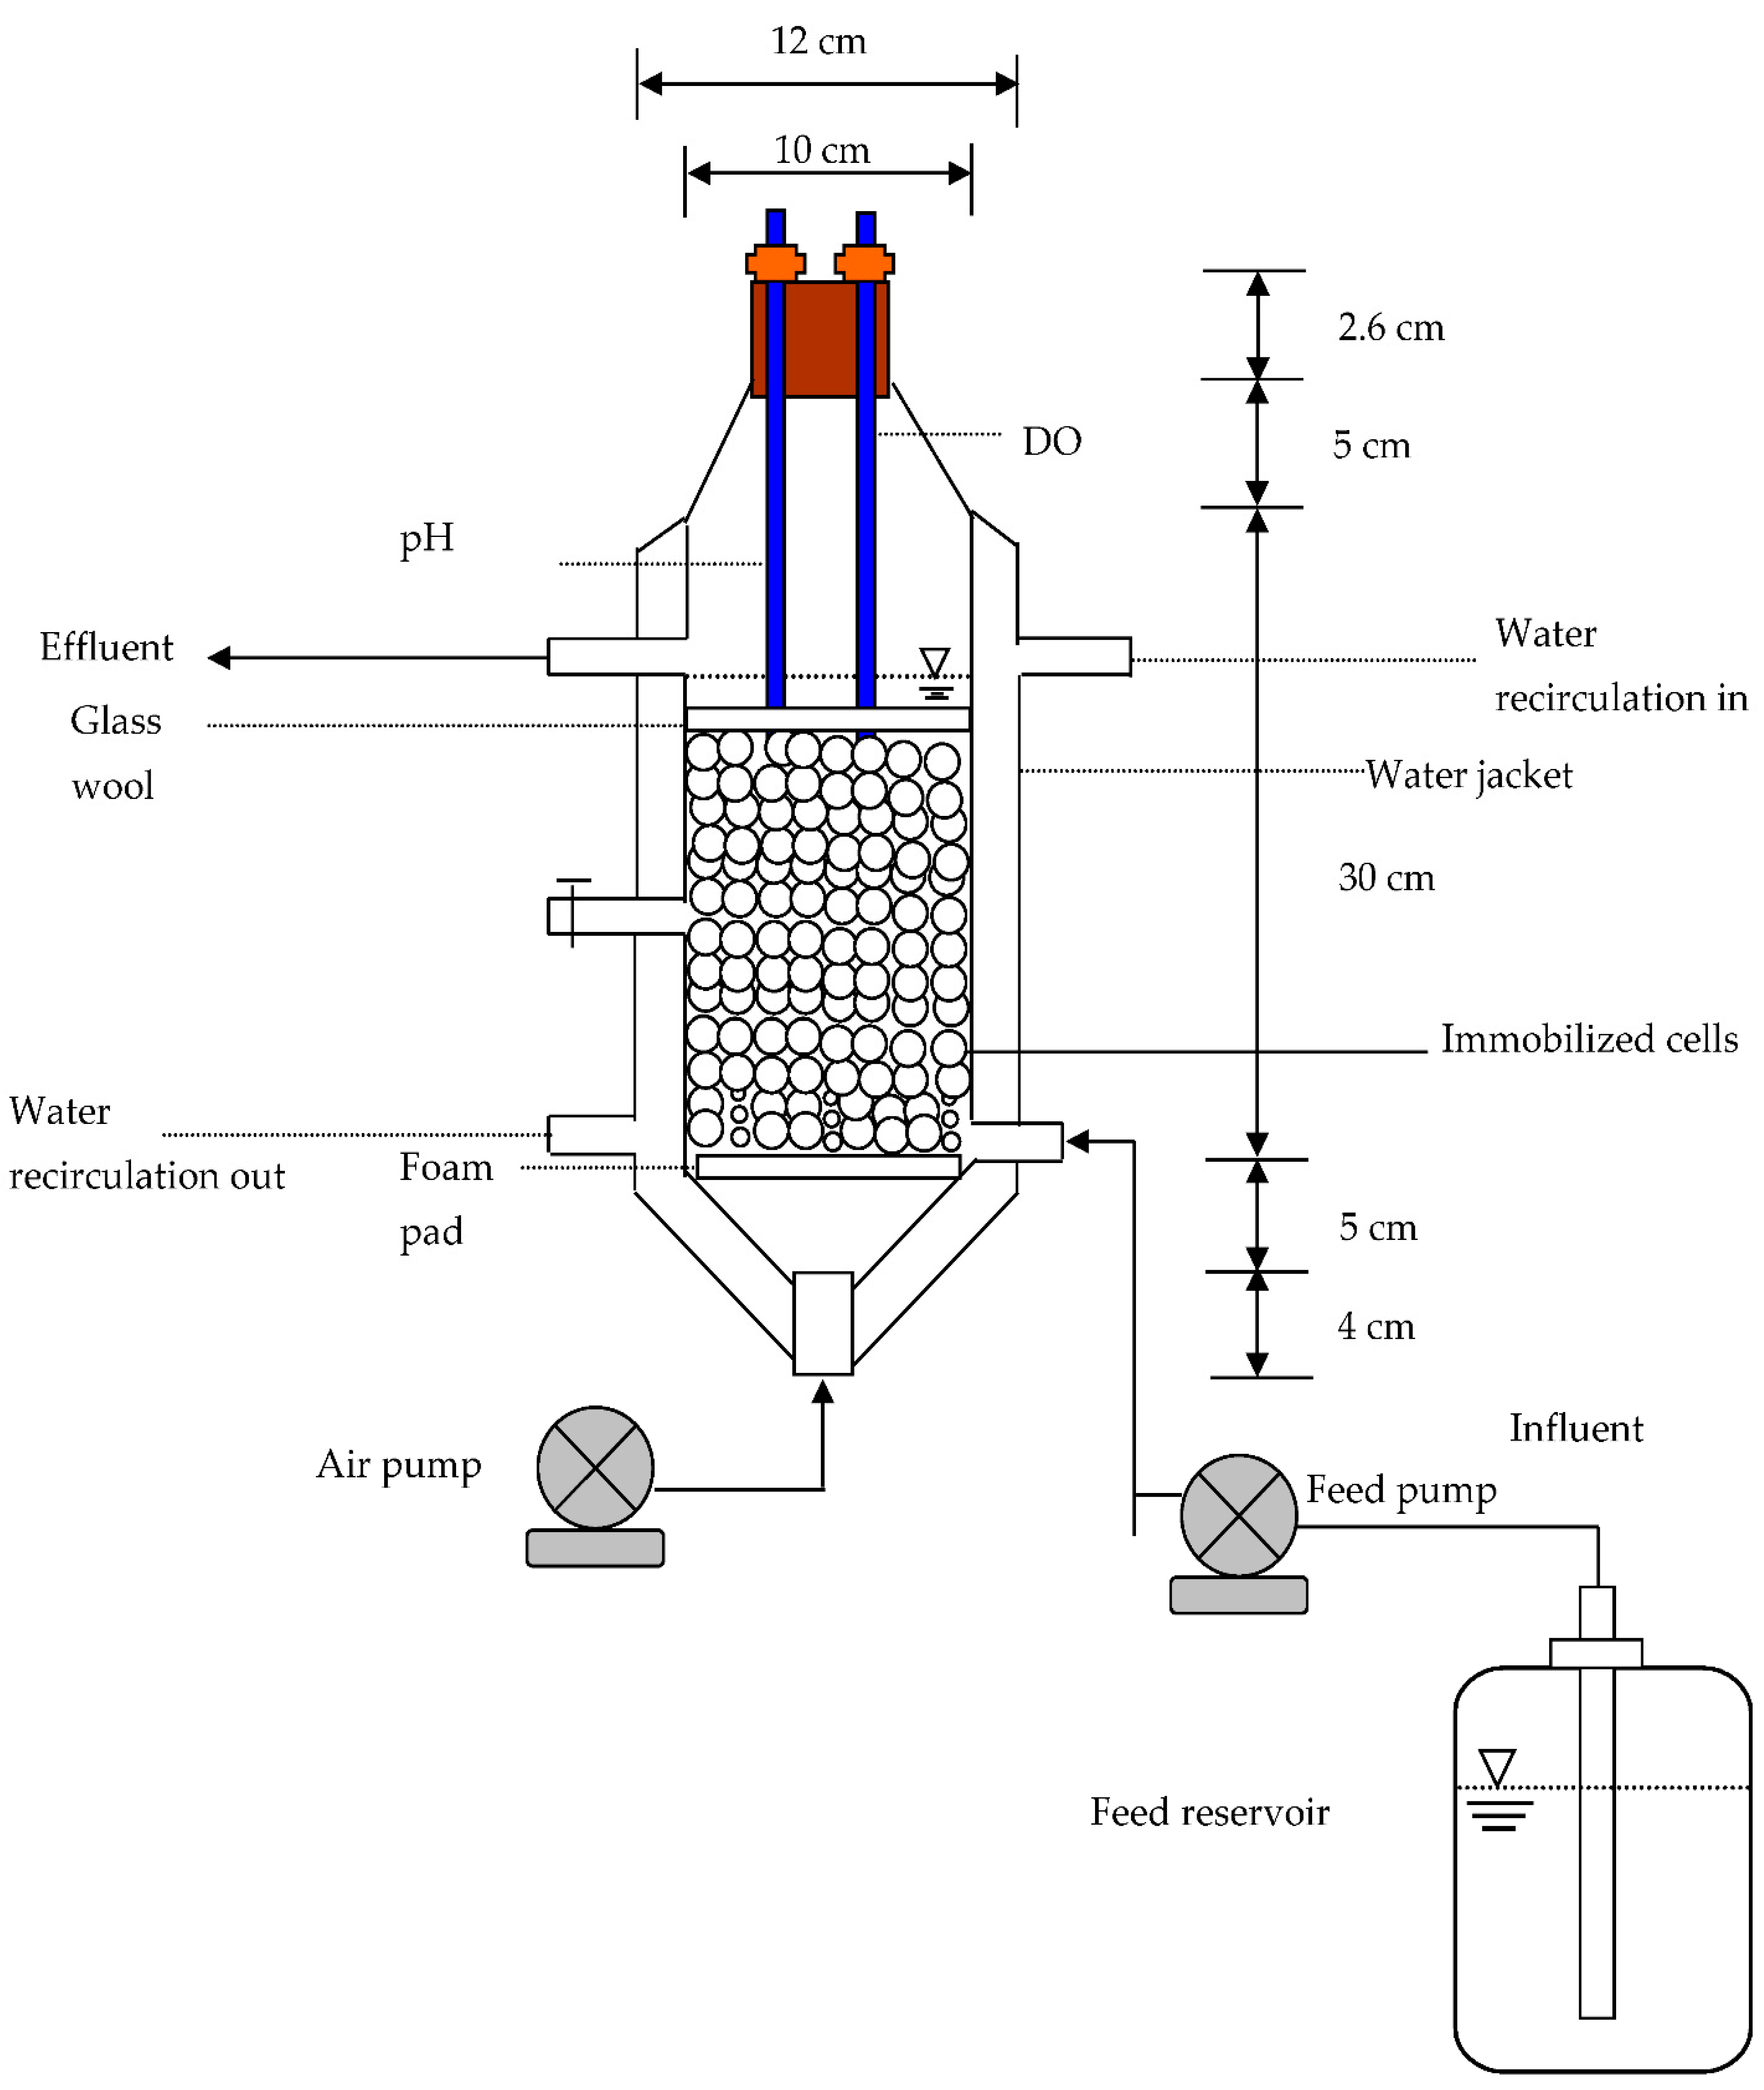
Figure 1. Schematic diagram of immobilized cells reactor setup.
Processes 11 00739 g001
Figure 2. Time profile of different parameters: (a) phenol degradation, (b) cell growth.
Processes 11 00739 g002
Figure 3. Cell growth rate to estimate the specific growth rate at different initial phenol concentrations.
Processes 11 00739 g003
Figure 4. Comparison of experimental and modeling data to estimate the maximum specific growth rate (μm), saturation constant (KS), and inhibition constant (KI). μm = 0.15 1/h, KS = 87.5 mg/L, and KI = 111.6 mg/L.
Processes 11 00739 g004
Figure 5. Batch experiments to calculate the cell yield at different initial phenol concentrations of 53–137 mg/L.
Processes 11 00739 g005
Figure 6. Influence of temperature on phenol utilization by immobilized cells with nano-Fe3O4 in the batch reactor. Initial phenol concentration was 336 mg/L.
Processes 11 00739 g006
Figure 7. Phenol degradation by Pseudomonas putida in free cells, immobilized cells, and immobilized cells with nano-Fe3O4 in the batch reactors: (a) initial phenol concentration is 199.6 mg/L, (b) initial phenol concentration is 388.6 mg/L, and (c) initial phenol concentration of different dosages of nano-Fe3O4.
Processes 11 00739 g007
Figure 8. Phenol degradation by Pseudomonas putida in free cells, immobilized cells, and immobilized cells with nano-Fe3O4 in the batch reactors: (a) initial phenol concentration is 189.4 mg/L with 1% salinity and 2 g nano-Fe3O4, and (b) initial phenol concentration is 189.2 mg/L with 5% salinity and 2 g nano-Fe3O4.
Processes 11 00739 g008
Figure 9. Model-predicted and experimental results in the continuous reactor: (a) phenol concentration, (b) cell growth, and (c) flux into bead.
Processes 11 00739 g009
Figure 10. Influence of hydraulic retention times on phenol removal in the continuous reactor.
Processes 11 00739 g010
Table 2. Input parameters to kinetic model of continuous reactor with immobilized cells.
Kinetic ParametersValue
Maximum specific degradation rate, k (mg cell/mg phenol‒d)11.39
Saturation constant, KS (mg/L)87.5
Cell yield, Y (mg cell/mg phenol)0.316
Effective diffusivity of phenol, De (cm2/d)0.965
Mass transfer coefficient, kf (cm/d)92.52
Total surface area of beads, At (cm2)2.053 × 10⁴
Porosity, ε (dimensionless)0.72
Influent phenol concentration, Sb0 (mg/L)137
Influent flow rate, Q (L/d)7.2
Working volume, V (L)1.568
Initial cell concentration in the bead, Xe0 (mg/L)5.24
Inhibition constant, KI (mg/L)111.6
Disclaimer/Publisher’s Note: The statements, opinions and data contained in all publications are solely those of the individual author(s) and contributor(s) and not of MDPI and/or the editor(s). MDPI and/or the editor(s) disclaim responsibility for any injury to people or property resulting from any ideas, methods, instructions or products referred to in the content.