Article

A Study on the Corrosion Behaviour of Laser Textured Pure Aluminium in Saltwater

by
Juan Ignacio Ahuir-Torres
1,*,
Hiren Ramniklal Kotadia
2,
Tahsin Tecelli Öpoz
1 and
Martin Charles Sharp
1
1
General Engineering Research Institute, Faculty of Engineering and Technology, Liverpool John Moores University, Byrom Street, Liverpool L3 3AF, UK
2
Faculty of Engineering and Technology, School of Engineering, Liverpool John Moores University, Byrom Street, Liverpool L3 3AF, UK
*
Author to whom correspondence should be addressed.
Processes 2023, 11(3), 721; https://doi.org/10.3390/pr11030721
Submission received: 31 January 2023 / Revised: 16 February 2023 / Accepted: 23 February 2023 / Published: 28 February 2023
(This article belongs to the Section Chemical Processes and Systems)

Abstract

:
Commercially pure aluminium is employed in several industrial applications. On some applications, the surface of this material needs to be functionalised. Laser surface texturing is a powerful tool to functionalise aluminium and aluminium alloy surfaces. However, the corrosion resistance of the laser textured aluminium alloy can be modified, and this has rarely been investigated in the literature. Consequently, the corrosion resistance of the laser textured commercially pure aluminium in saltwater was evaluated using several electrochemical techniques: asymmetric electrochemical noise, potentiodynamic polarisation curve and electrochemical impedance spectroscopy. Although the non-laser surface textured samples possessed higher kinetic corrosion resistance in the first hours of immersion, the corrosion mechanism (process group of the corrosion) was found to be more unstable than the laser textured specimens. The oxidised layer of the textured samples was also nobler than the native passive film.

1. Introduction

Commercially pure (CP) aluminium is used in various industries, such as chemical [1,2], printing [3], electronic, automotive and aerospace. This is because of its excellent properties, such as high corrosion resistance, low weight, high formability, excellent electrical conductivity, good thermal conductivity and being strain hardenable [1,2,4,5]. Some applications (e.g., printing plates, automotive and aerospace usage) need to have functionalised CP aluminium surfaces in which “functionalised” is defined as improving a feature of the material or providing a new property to the material. In some cases, functionalisation is used to improve the CP aluminium wear and friction resistance (automotive and aerospace [6]), while in other cases functionalisation is used to give new properties such as a specific topography, and wettability to water and oils, (e.g., printing plates [3]). Surface functionalisation can be carried out with various methods, such as mechanical machining [6], chemical [7], laser [8,9,10], electrochemical, [11] and ion beam [12] surface texturing. Laser surface texturing stands out as a powerful tool to conduct the functionalisation of the surface because of its good properties, such as being environmentally friendly, easily automated, high reproducibility, excellent accuracy and moderate cost [13].
Differing results have been reported on the effect of laser surface texturing on aluminium alloy corrosion resistance. Corrosion resistance is a vitally important issue for aluminium alloys, as good corrosion resistance is one of their main properties. Boinovich et al. [14] studied the influence of laser surface texturing on the corrosion resistance of an aluminium-magnesium alloy in saltwater. The laser parameters were a 50 ns pulse length, 1064 nm wavelength, 20 kHz pulse repetition rate, and 0.95 mJ pulse energy. The samples were textured using a parallel line-scanning mode at 50 mm/s of scan velocity and 100 μm distance between the scan lines. The researchers observed that the corrosion resistance of the samples was increased by the laser surface texturing due to the generation of a superhydrophobic surface, good passive film formation and the chemisorption of fluorooxysilane. It was noted that the good corrosion resistance of the laser textured samples was produced due to the combination of the laser process with a chemical product. The high hydrophobicity sample reduced the ion access to passive layer, resulting in the corrosion resistance increment. However, this hydrophobicity was lost after 10 days due to the generation of micropitting. Ahuir-Torres et al. [8] investigated the corrosion resistance of 2024-T3 aluminium alloy textured with 10 ps pulses at a wavelength of 1064 nm in 0.06 M NaCl. Several types of textures (dimple, grooves and concentric rings) and various texture densities (from 5% to 70%) were generated on the aluminium alloy surface using from 0.1 to 1 J/cm2 of energy fluence, a scanning velocity of 24 mm/s and a 5–10 kHz pulse frequency rate. They determined that the laser surface texturing with a picosecond pulsed laser had a low influence on the corrosion resistance of the aluminium alloy. This was due to the low thickness of the oxidised layer of the picosecond pulsed laser textured surfaces. The research group commented that the oxidised layer thickness generated with the laser process was proportional to the molten material depth created during the process. The molten layer was also proportional to the pulse length (10 ps), being, in this case, lower than the native passive film thickness of the aluminium alloy. The corrosion mechanism of the samples was defined by the diffusion of the electrolytes. Misyura et al. [15] studied the laser surface texturing influence on the corrosion resistance of an AlMg6 alloy. A nanosecond pulsed fibre laser operating at 1064 nm wavelength was employed to texture the aluminium alloy surfaces. The textures were created using a pulse energy of 1 mJ, a focused laser beam diameter of 60 μm, and a pulsed frequency rate of 20 kHz. The type of texture was a dimple pattern. The laser textured samples had higher corrosion resistance than the original surfaces because the laser oxidised layer was thicker than the native passive film. In this case, the pulse length of the laser was sufficiently long to produce an oxidised layer thicker than native passive film.
Although the corrosion resistances of laser surface textured aluminium alloys have been investigated in the literature, analysis of the corrosion behaviour for laser surface textured CP aluminium has not been reported. Thus, the present paper is a study about the laser surface texturing influence on the corrosion resistance of CP aluminium. The texturing of the surface was carried out with a nanosecond pulsed infrared laser. The corrosion behaviour was evaluated in 0.6 M NaCl solution using electrochemical noise, potentiodynamic polarisation curves and electrochemical impedance spectroscopy.

2. Experimental Setup

2.1. Materials

CP aluminium was derived from 1050 aluminium alloy (chemical composition in Table 1 [16]) and samples were prepared from a 0.4 mm thick VELA IT3 lithographic printing plate. Laser texturing was conducted on the non-printing side of the sheet material.

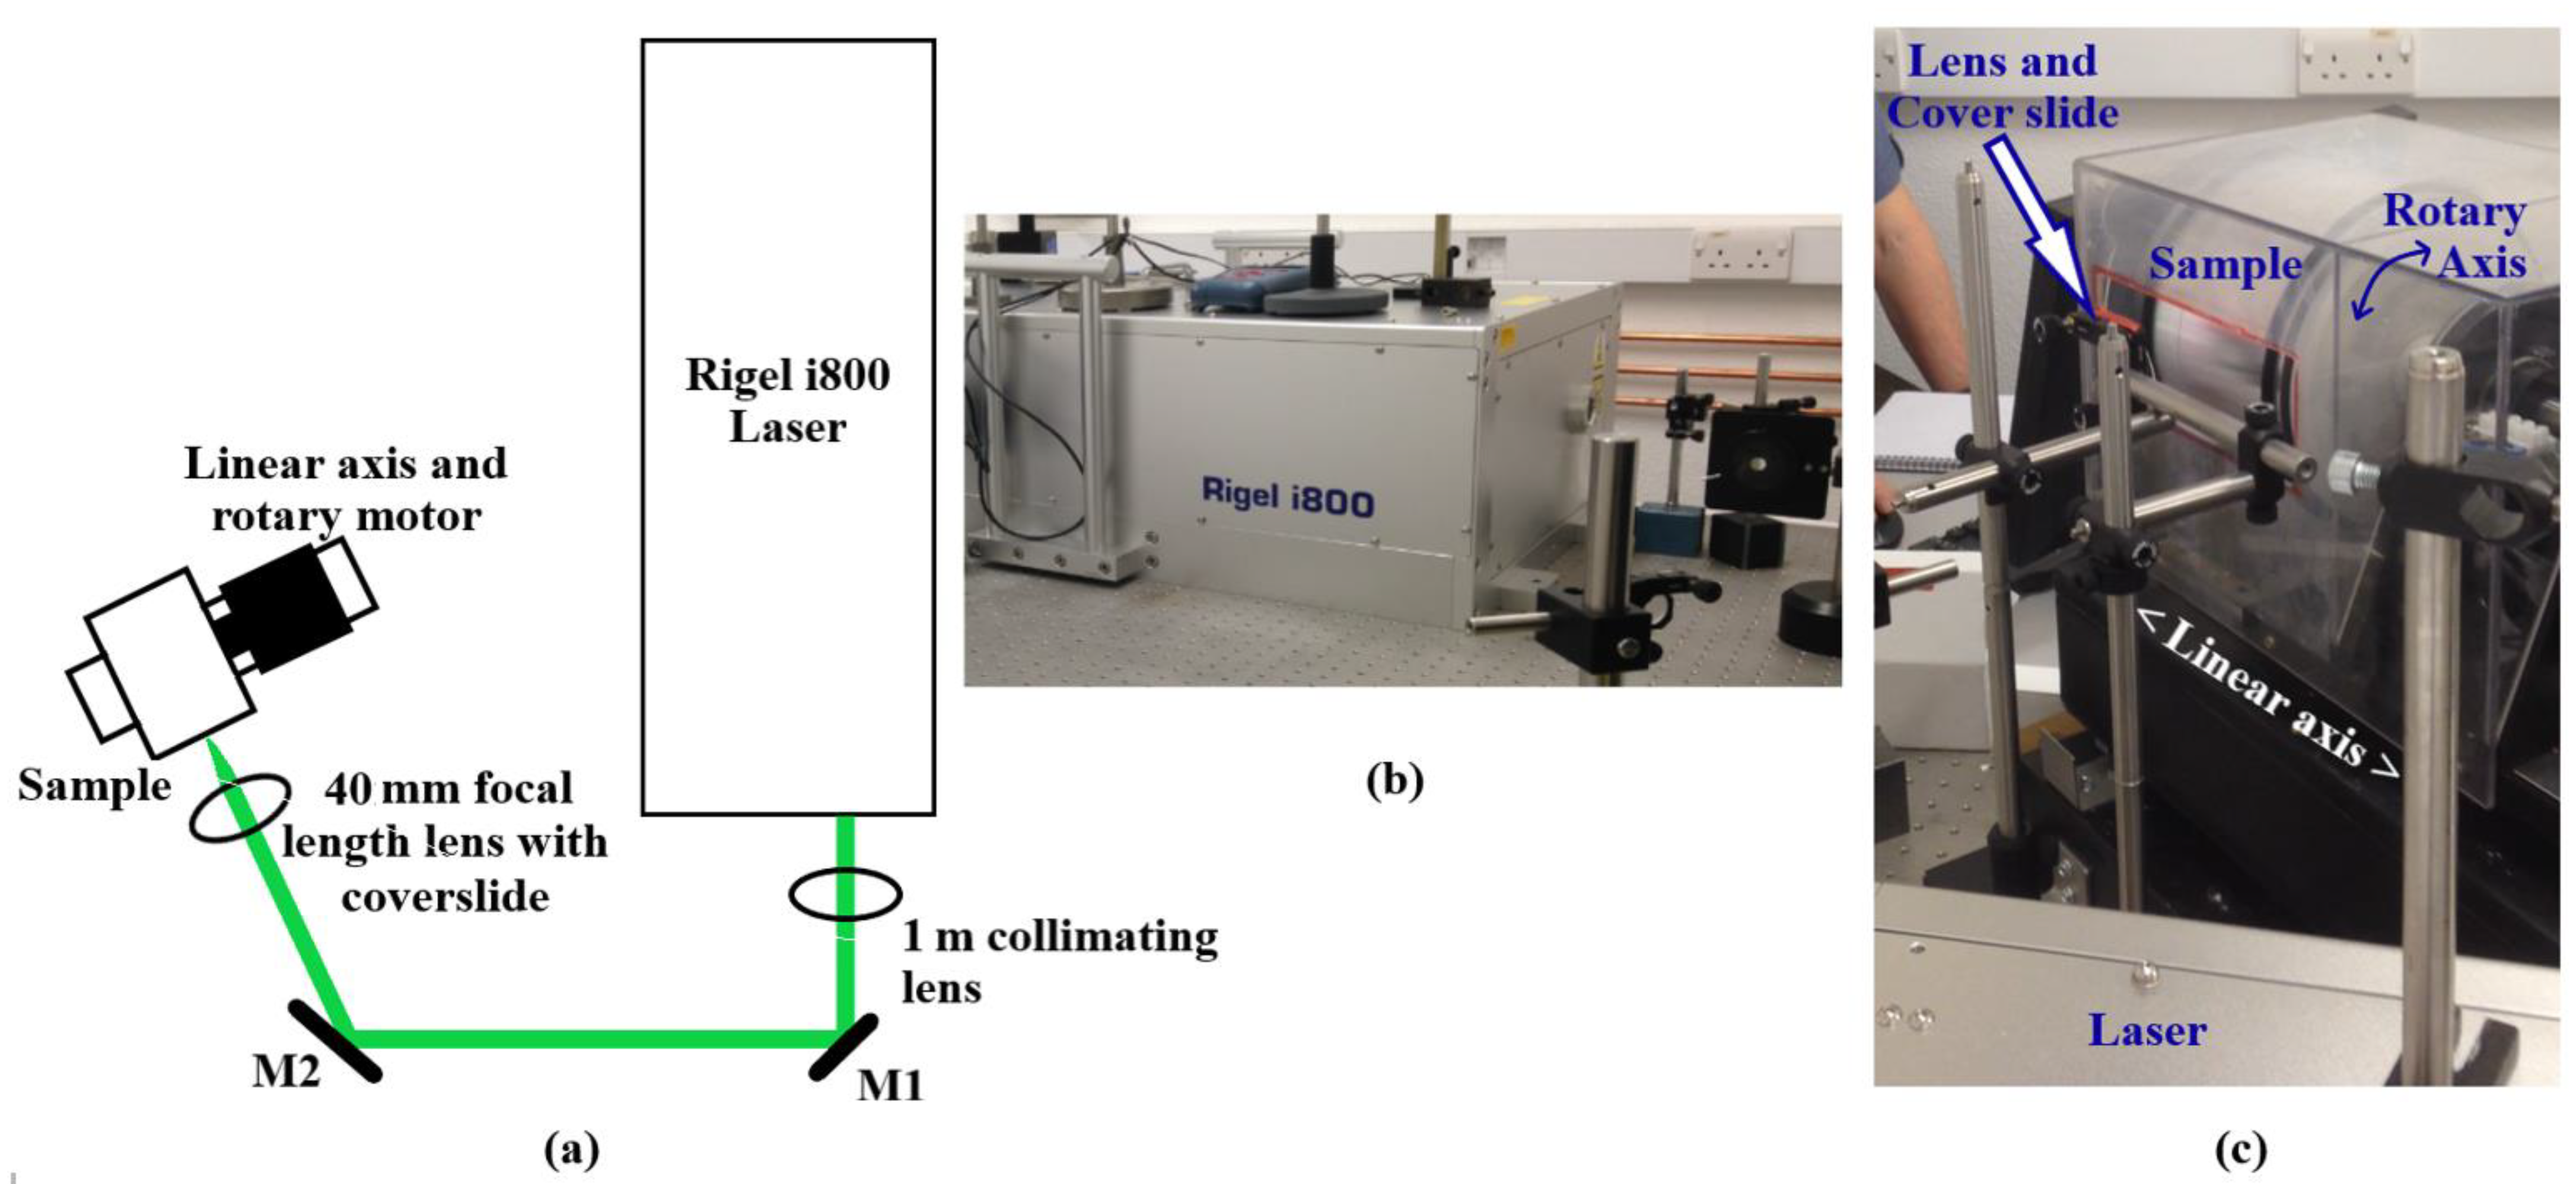
2.2. Laser Parameters

The sample material chosen for this corrosion study was laser textured using an approach developed in another research project investigating the generation of hydrophobic surfaces [17]. The samples were textured using an 800 W nanosecond pulsed Diode Pumped Solid State (DPSS) laser (Powerlase Photonics Ltd. Crawley, UK. Model Rigel i800). This laser had a wavelength of 1064 nm, and a maximum average output power of 800 W. The output power of the laser was controlled by an internal optical attenuator, so the output beam optical characteristics were not affected by the output power delivered by the laser.
A 1 m focal length lens was used to collimate the laser beam after it left the laser head (Figure 1b). Two mirrors directed the laser beam into a 40 mm focal length double convex lens, and then onto the sample material (Figure 1a). Due to the high average power of the laser, high traverse rates were required to laser texture the samples. To achieve the necessary speeds, the samples were mounted on a 170 mm diameter rotating cylinder (Figure 1c). The rotating cylinder was mounted on a linear axis, so the static focused beam was tracked as a spiral across the surface of the sample simulating a parallel hatch texture pattern. A perpendicular linear axis allowed precise setting of the focal point relative to the surface. The linear axes/rotary axis combination was of bespoke construction with a digital controller.
The parameters employed for the laser texturing of the sample used for the corrosion analysis are given in Table 2. No atmospheric control was used during texturing or subsequent storage of the samples.
After 25 days the sample was heated for 85 min at 60 °C. Following this, its water contact angle was found to be 152°. A high coverage rate of 0.43 m2/min was achieved as a result of the available average laser power at relatively high pulse energy applied over a large spot size, and represents a coverage rate that is adequate for a number of industrial applications.

2.3. Electrochemical Analyses

The samples were cleaned before the electrochemical analyses by cleaning with commercial detergent and fresh water soaking, rinsing with distilled water, cleaning with isopropanol and drying with a drier. Areas of the samples (0.3 cm2) were exposed to an aggressive environment. These areas were limited with holed tape that was shielded using epoxy resin. The aggressive environment was a solution of sodium chloride in water with 0.6 M (Mol/L) of concentration at 298 K. Merck was the provider of the chemical compounds.
The electrochemical trials were carried out with a potentio/galvanostat (Interface1010E) provided by Gamry Instruments Inc (Warminster, PA. USA). The potentio/galvanostat was controlled with Gamry Framework Version 7.8.4 software designed by Gamry Instruments Inc (Warminster, PA. USA), and the data were evaluated with Gamry Echem Analyst software. A three-electrode cell was used to conduct the electrochemical analyses. The cell was comprised of a reference, counter and working electrode. The reference electrode was 3 M KCl silver/silver chloride (Ag/AgCl 3 M KCl) with a double junction that was supplied by EDT Direct Ion Ltd (Dover, UK). The counter electrode was a platinum wire of 0.7 mm diameter that was provided by Cooksongold (Heimerle + Meule Group) (Birmingham, UK). The working electrodes were the samples.
The electrochemical analyses were passive (open circuit potential and zero resistance ammeter), perturbative of direct current (potentiodynamic polarisation curve) and of alternating current (electrochemical impedance spectroscopy). Open Circuit Potential (OCP) and Zero Resistance Ammeter (ZRA) were conducted with an asymmetric system in which a counter electrode was used. The total time of testing was 2 h, and the acquisition time was 0.05 s. Combined assessment of both techniques is usually called electrochemical noise, and the employment of the asymmetric system means that these analyses are defined as Asymmetric Electrochemical Noise (AEN) [18]. Potentiodynamic Polarisation Curves (PPC) were carried out with an initial potential as the potential at open circuit of −−0.3 V, a voltage scan of 0.167 mV/s, a current density limit of 0.01 A/cm2 and a final potential of 2 V vs. a reference electrode. Electrochemical Impedance Spectroscopy (EIS) was conducted at 5 mV root mean square of potential amplitude, frequency ranges from 0.01 Hz to 100,000 Hz and 10 points per decades (ten measurements for each order of frequency magnitude). The equivalent circuit method was utilised to assess the EIS data. Gamry Echem Analyst software was used to develop the equivalent circuit method. All individual tests were repeated a minimum of three times, to confirm validation of the data.

3. Results

Electrochemical Assessments

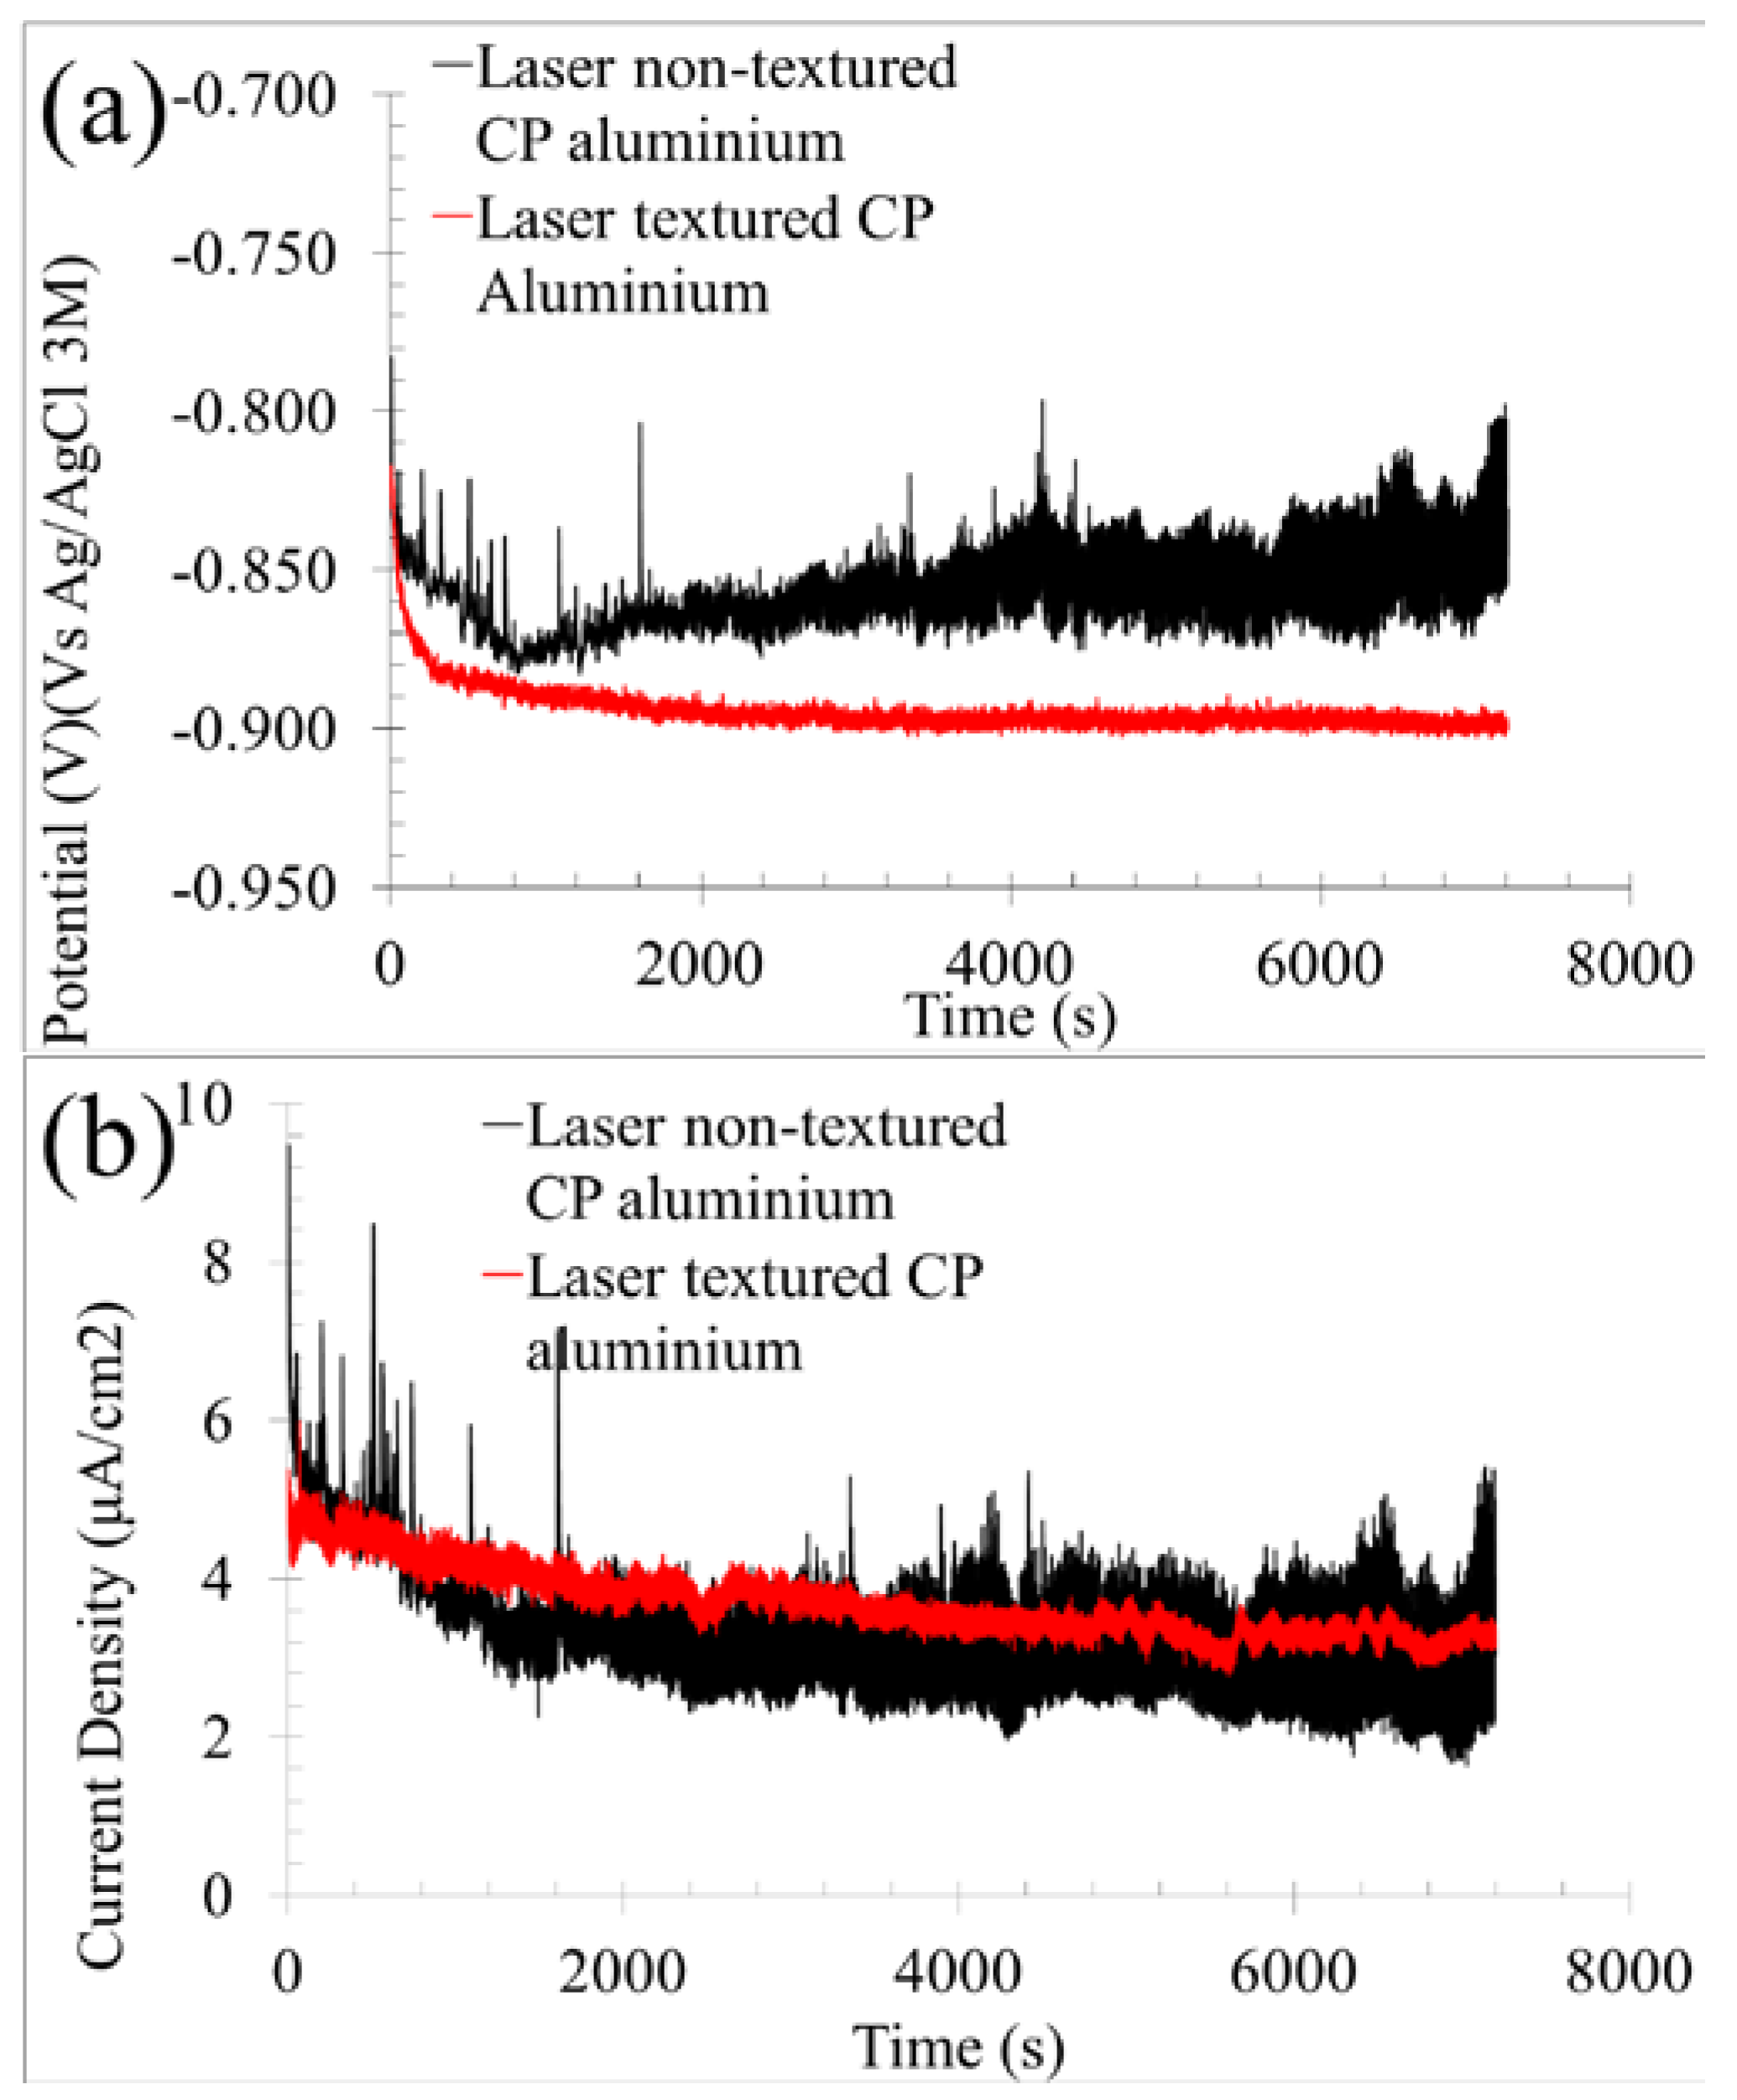
3.1.1. Open Circuit Potential and Zero Resistance Ammeter (Electrochemical Noise), Passive Corrosion Testing

Figure 2 shows the potential (Figure 2a) and current density (Figure 2b) evolution over the time of the samples. Both potential and current density fluctuated with time in both samples. This indicates the generation of metastable pitting for two hours of immersions in 0.6 M NaCl solution. Chloride ions can react with the oxidised aluminium layer or a passive film, easing its dissolution in water. The amplitude of the fluctuation was wider for the non-textured samples than the laser textured aluminium. This shows that the pitting of the non-textured samples was deeper and wider than the textured aluminium [19,20]. The oxidised layers of the textured samples were more homogeneous than the native oxidised layer. Iron-rich intermetallics (Al3Fe and Al6Fe) are the cause of the huge pitting on pure aluminium alloys because these intermetallics have cathodic/anodic effect on aluminium matrix [20,21,22], which are absent in the textured samples. The evolution of potential and current density (outputs) over time were different for the non-textured aluminium compared to the laser textured samples. Both AEN outputs reduced with increasing time for the non-textured samples at ≤900 s. Passive film generation on commercial pure aluminium decreases the potential and current density [23]. The potential increased over time while the current density remained constant with time between 900 s and 1600 s. The growth of the passive film is characterised by potential increase with constant current density [24]. After this point, both outputs of the non-textured samples remained constant with time. This indicates that the passive film was stable after this point [22]. For the textured aluminium, both potential and current density declined with increasing time for all testing times. Reduction of the outputs over time causes the continuous oxidation of the samples [25]. The different corrosion behaviour of the samples showed that the textured aluminium was continuously oxidized, while the non-textured samples generated a stable passive film. The potential was higher for the non-textured aluminium than the textured samples. This indicates that the textured oxidised layer is less noble than the native oxidised layer.
The results of the OCP and ZRA were employed to obtain AEN factors that allowed the analysis of the corrosion process for first two hours of immersion. Asymmetric system electrochemical noise corrosion rate (C.R.AEN) was calculated using Equations (1) [23] and (2) [26].
I R . M . S = i = 1 N I i 2 N
C . R . A E N = I R . M . S . × M F × n × ρ
where, Ii is current density per measurement i, N is measurement number, IR.M.S. is the current density root mean square, M is the aluminium molarity (27 g/mol), F is Faraday’s constant (96,500 C/mol×electron), n is electron number (3) and ρ is aluminium density (2700 kg/m3). The non-textured sample C.R.AEN was lower than that for textured aluminium (see Table 2). The reduction reactions were faster for textured samples than non-textured samples. Note that the corrosion rates were obtained with an asymmetric system corresponding to the cathodic processes (reduction reaction) [18]. The cathodic area of the textured surface was larger than the non-textured pure aluminium surface. The oxidised textured surface and iron-rich intermetallic particles [20,21,22] are cathodic areas where the elements (e.g., oxygen and water) are reduced. In the case of the iron intermetallics, their particle sizes are of the order of a few micrometres in size [20,21,22] while for the laser oxidised textures, surface areas are millimetres in size. Larger cathodic areas encourage the reduction reactions [27].
The localised index (L.I.) was estimated using Equation (3) [23].
L . I = σ I I R . M . S
where σI is the standard deviation of the current density. L.I showed that corrosion in both samples was controlled by mixed processes (diffusion and activation). The control of corrosion is defined by L.I values, i.e., 0.001–0.01 general corrosion, 0.01–0.1 mixed and 0.1–1.0 localised [23,28].
Equation (4) [29] was used to calculate the asymmetric system electrochemical noise resistance (RAEN).
R A E N = σ E σ I
where σE is the standard deviation of the potential. The RAEN of the non-textured samples was lower than for that of the textured samples. This confirms that the reduction reactions of the aluminium were promoted by laser surface texturing. These values can be found in Table 3.

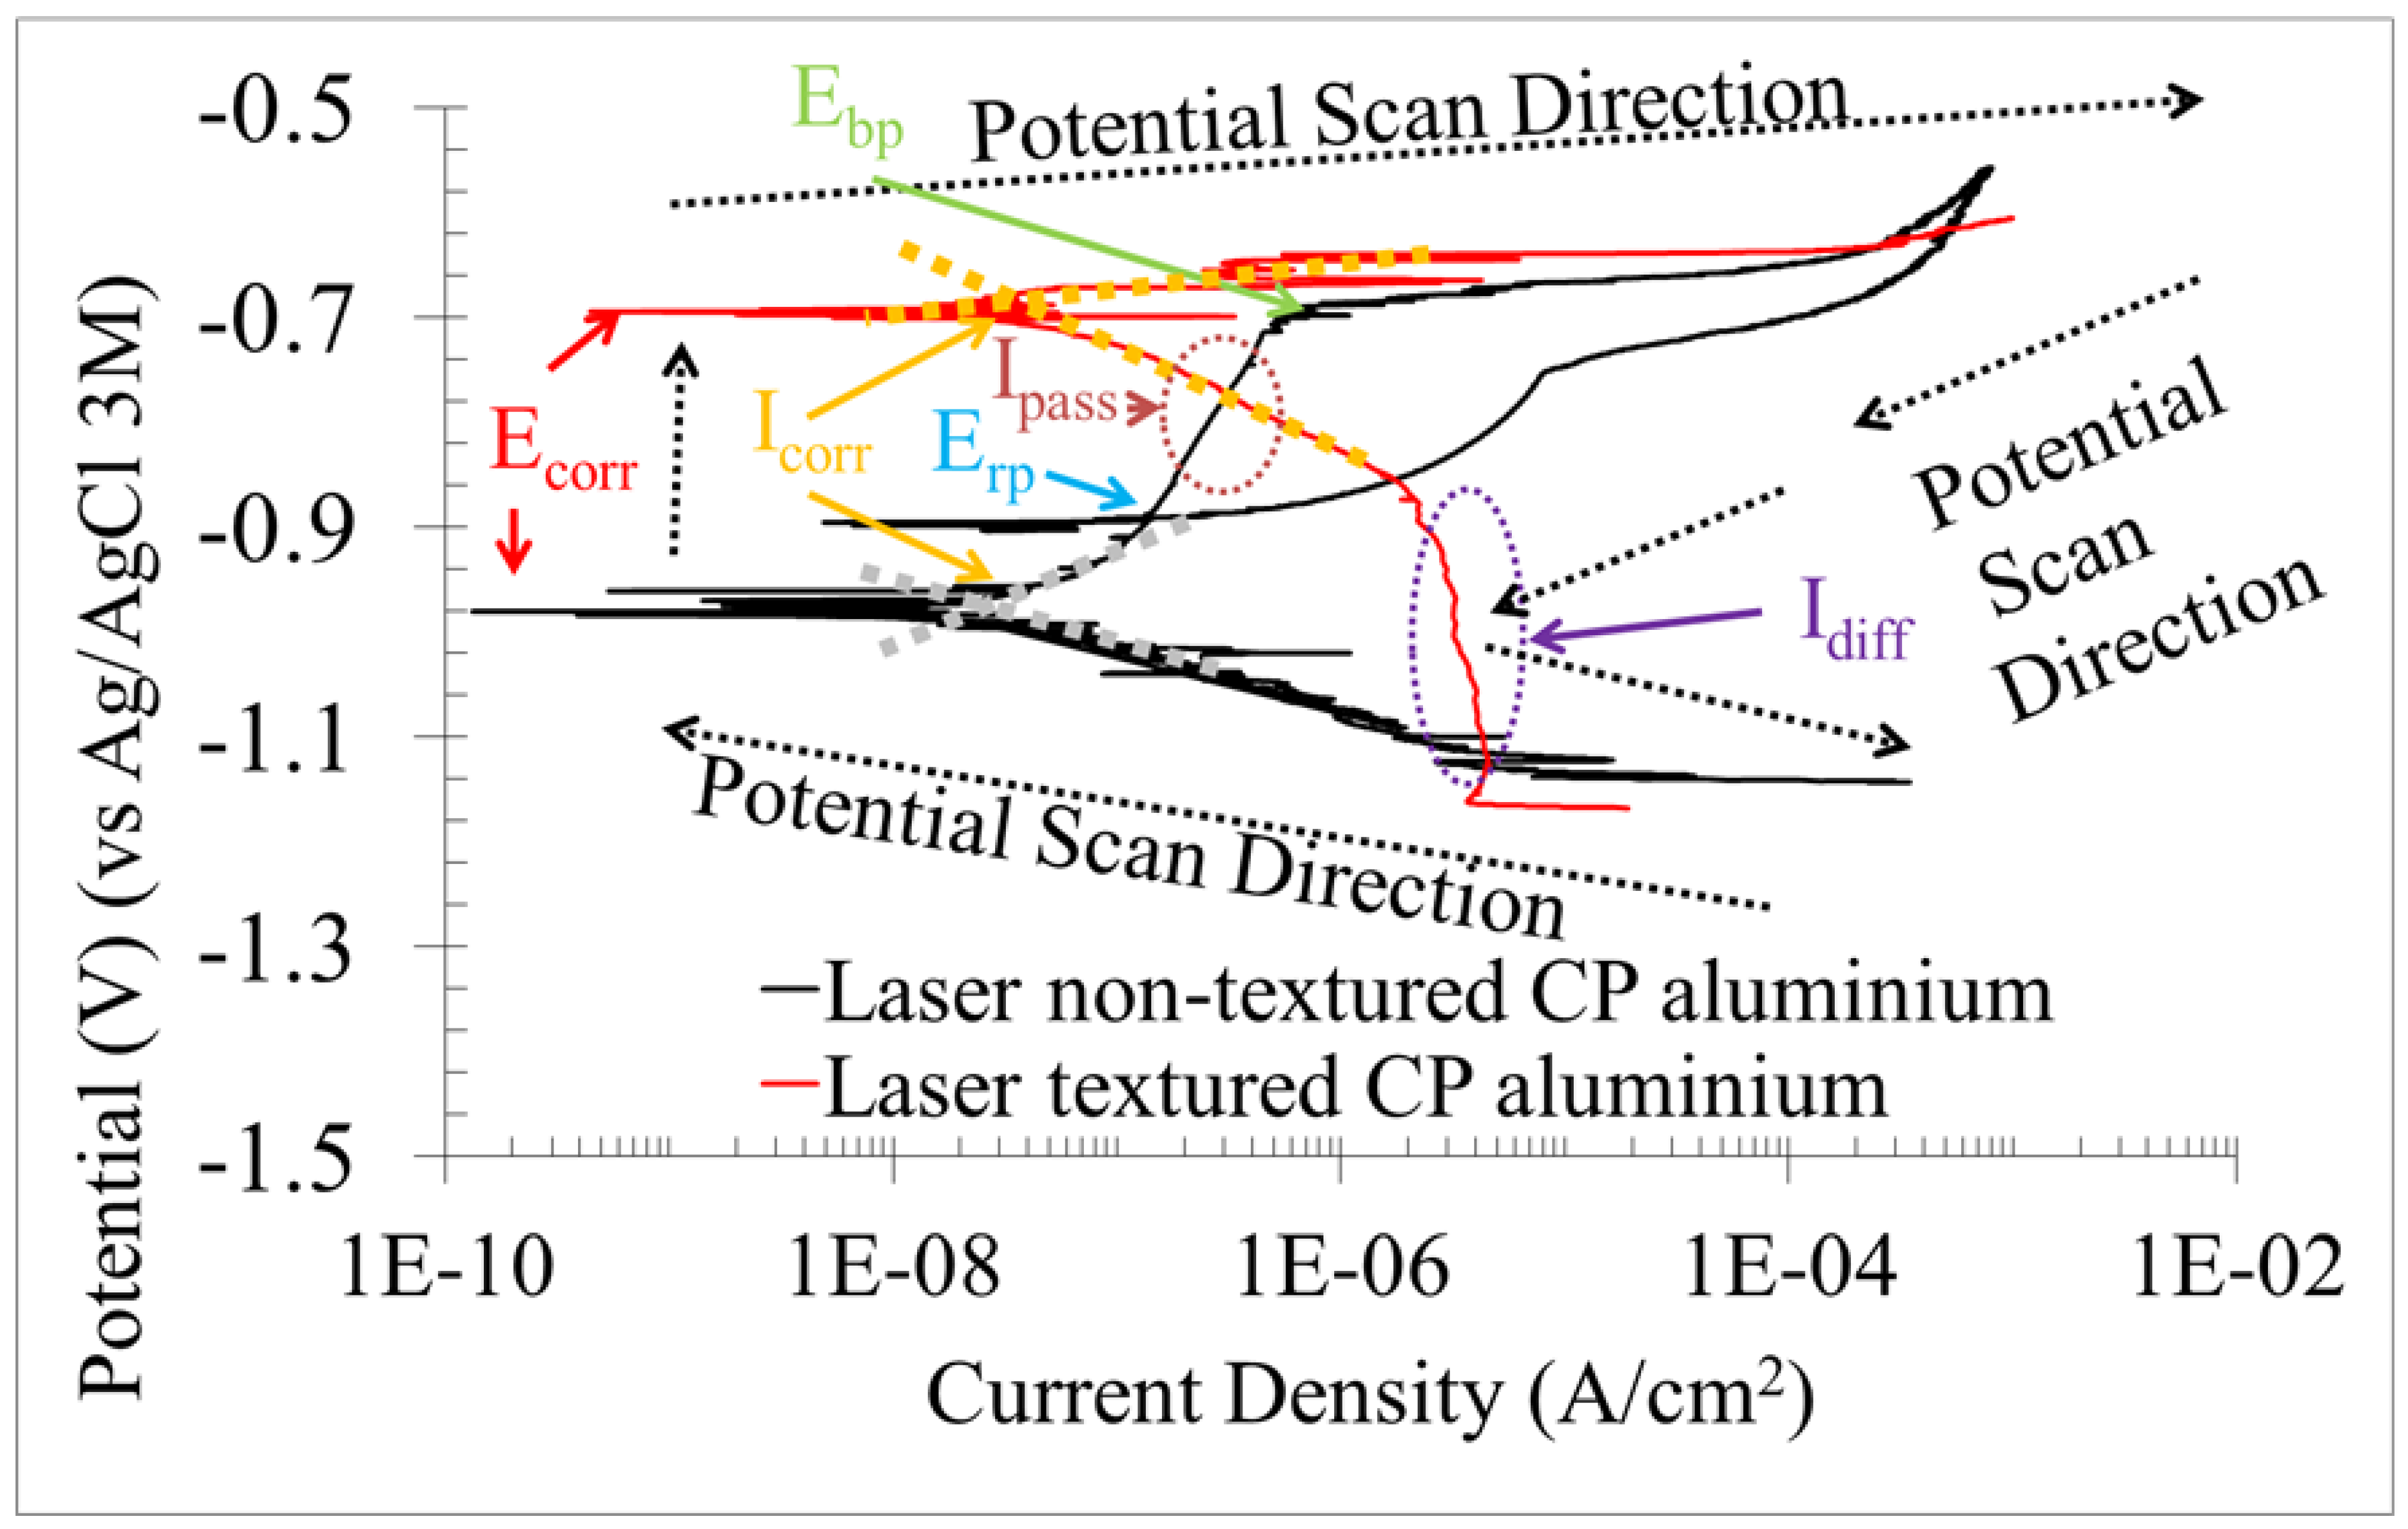
3.1.2. Potentiodynamic Polarisation Curve (PPC), Active Corrosion Testing of Direct Current

The PPC were different according to the textured or non-textured samples, as can be seen in Figure 3. Both samples possessed a horizontal curve in the cathodic branch at low potential (≈−1.1 V). Part of the supplied potential is used to evolve the water to hydroxide and hydrogen [30,31].
For non-textured samples, the cathodic branch was controlled by the activation reaction as indicated by the inclined curve [14]. With respect to the anodic branch, the curve was vertical up to ≈−0.698 V, showing the presence of the passive film [32,33,34]. The curve then levelled to near horizontal at −0.698 V, indicating the breaking down of the passive film [14]. Both branches had current density fluctuations with the increase of the potential. These fluctuations were observed throughout the cathodic branch, while for the anodic branch these were only present close to the potential of the breaking passive film for the non-textured specimens. The dissolution of the iron-rich particles with anodic effect on the aluminium matrix produces these fluctuations for the cathodic branch [20,21,22]. This process was also observed in AEN testing, confirming these results. The anodic fluctuations are generated by the metastable pitting that announces the breaking of the passive film (anodic branch) [32,34]. The inflection point potential of the return curve was higher than the corrosion potential, showing the capacity to spontaneously recover the passive film [32].
Considering now the results of the textured samples, the cathodic branch indicated diffusion control from −1.14 V to −0.86 V, due to the near verticality of the curve [31]. From −0.86 V to −0.690 V, the curve was more inclined, which indicates that cathodic reaction control is active at these potentials. This shows that the cathodic reaction possesses mixed control (diffusion and activation). The anodic branch was near horizontal, indicating activation control of the oxidation reactions [31]. The passive film was absent for the textured sample PPC due to the breaking passive film potential being similar to the corrosion potential [8]. The return curve was absent for textured samples because of this similarity of breaking passive film potential and corrosion potential and, therefore, the re-passivation of the sample was impossible.
PPC dissimilar behaviour of the samples is caused by the oxidised layer and intermetallic particle refining (Al3Fe and Al6Fe) produced by the laser surface texturing. The laser oxidised layer reduces the diffusion processes as a result of the rough topography. Surfaces with relief (peaks and valleys) hinder the oxygen and water access to cathodic areas [14]. This produces diffusion control of the cathodic branch for the laser surface textured samples. In the case of the non-textured CP aluminium, the flat surface reduces the diffusion impedances due to topography, producing mixed control of the cathodic branch. The imperfections of the laser oxidised layer increase the chemical activity of the surface, causing the reduction of its protective capacities and the activation control of the anodic branch. In respect of the non-textured CP aluminium, passive control occurs due to the absence of imperfection and the high chemical inactivity of the aluminium passive film. Intermetallic surface refining (reducing intermetallic size) reduces the cathodic/anodic effect on the aluminium matrix [20,21,22], eliminating metastable pitting close to breaking passive film potential for the laser surface textured samples. This is due to the rapid melting of the material followed by rapid cooling, re-dissolving these intermetallics in the aluminium matrix. This reduces the size of these intermetallics.
Relevant corrosion factors of the samples obtained using PPC are summarised in Table 4. The corrosion potential (Ecorr) of the textured samples was higher than that for non-textured commercial pure aluminium. It was also slightly higher than the breaking passive film potential (Epb) of the non-textured samples, meaning that the laser textured oxide layer is slightly nobler than native passive film.
The corrosion current density (Icorr) of the non-textured samples was lower than the textured aluminium Icorr. These current densities were estimated by the intersection of the Tafel lines [33,35]. The different corrosion rates of the samples were determined by the different corrosion processes. The near vertical curve in the cathodic branch of the textured samples indicates a diffusion process (diffusion current density) defining the corrosion rate of this sample. In the case of the non-textured specimens, the passive process (passive current density) defines the corrosion rate as indicated by the near vertical curve of the anodic branch. The diffusion current density (Idiff) was greater than the passive film current density (Ipass). This indicates the kinetic corrosion resistance of the textured samples was lower than non-textured samples. This is due to the imperfections (cracks) of the laser oxidised layer [14]. It is noted that Idiff was absent for the non-textured CP aluminium because of the mixed control of the cathodic branch. The absence of Ipass for the laser textured samples is due to activation control of the anodic branch. The corrosion rates of these density currents were calculated using Equation (2), but the IR.M.S were replaced by Icorr, Idiff and Ipass, respectively.
Polarisation resistance (Rp) was calculated using Equation (5) [30].
R p = β a × β c 2.303 × I c o r r × ( β a + β c )
where βa and βc are the anodic and cathodic slope, respectively. These slopes were estimated using the Tafel lines [33,35]. Non-textured samples had higher Rp values than textured aluminium. This verifies that the non-textured samples had a higher kinetic corrosion resistance. In both cases, Rp was different than RAEN, being the resistance from AEN results. RAEN was lower than Rp for the non-textured samples and higher than RP in the case of the textured samples. This is because RAEN is related to the cathodic reaction of the corrosion while Rp relates to the equilibrium point of the reactions. Thus, the cathodic reactions are faster than chemical reactions in equilibrium for the non-textured samples. In the case of the textured specimens, the cathodic reaction was slower than the other reactions because of the diffusion impedances.

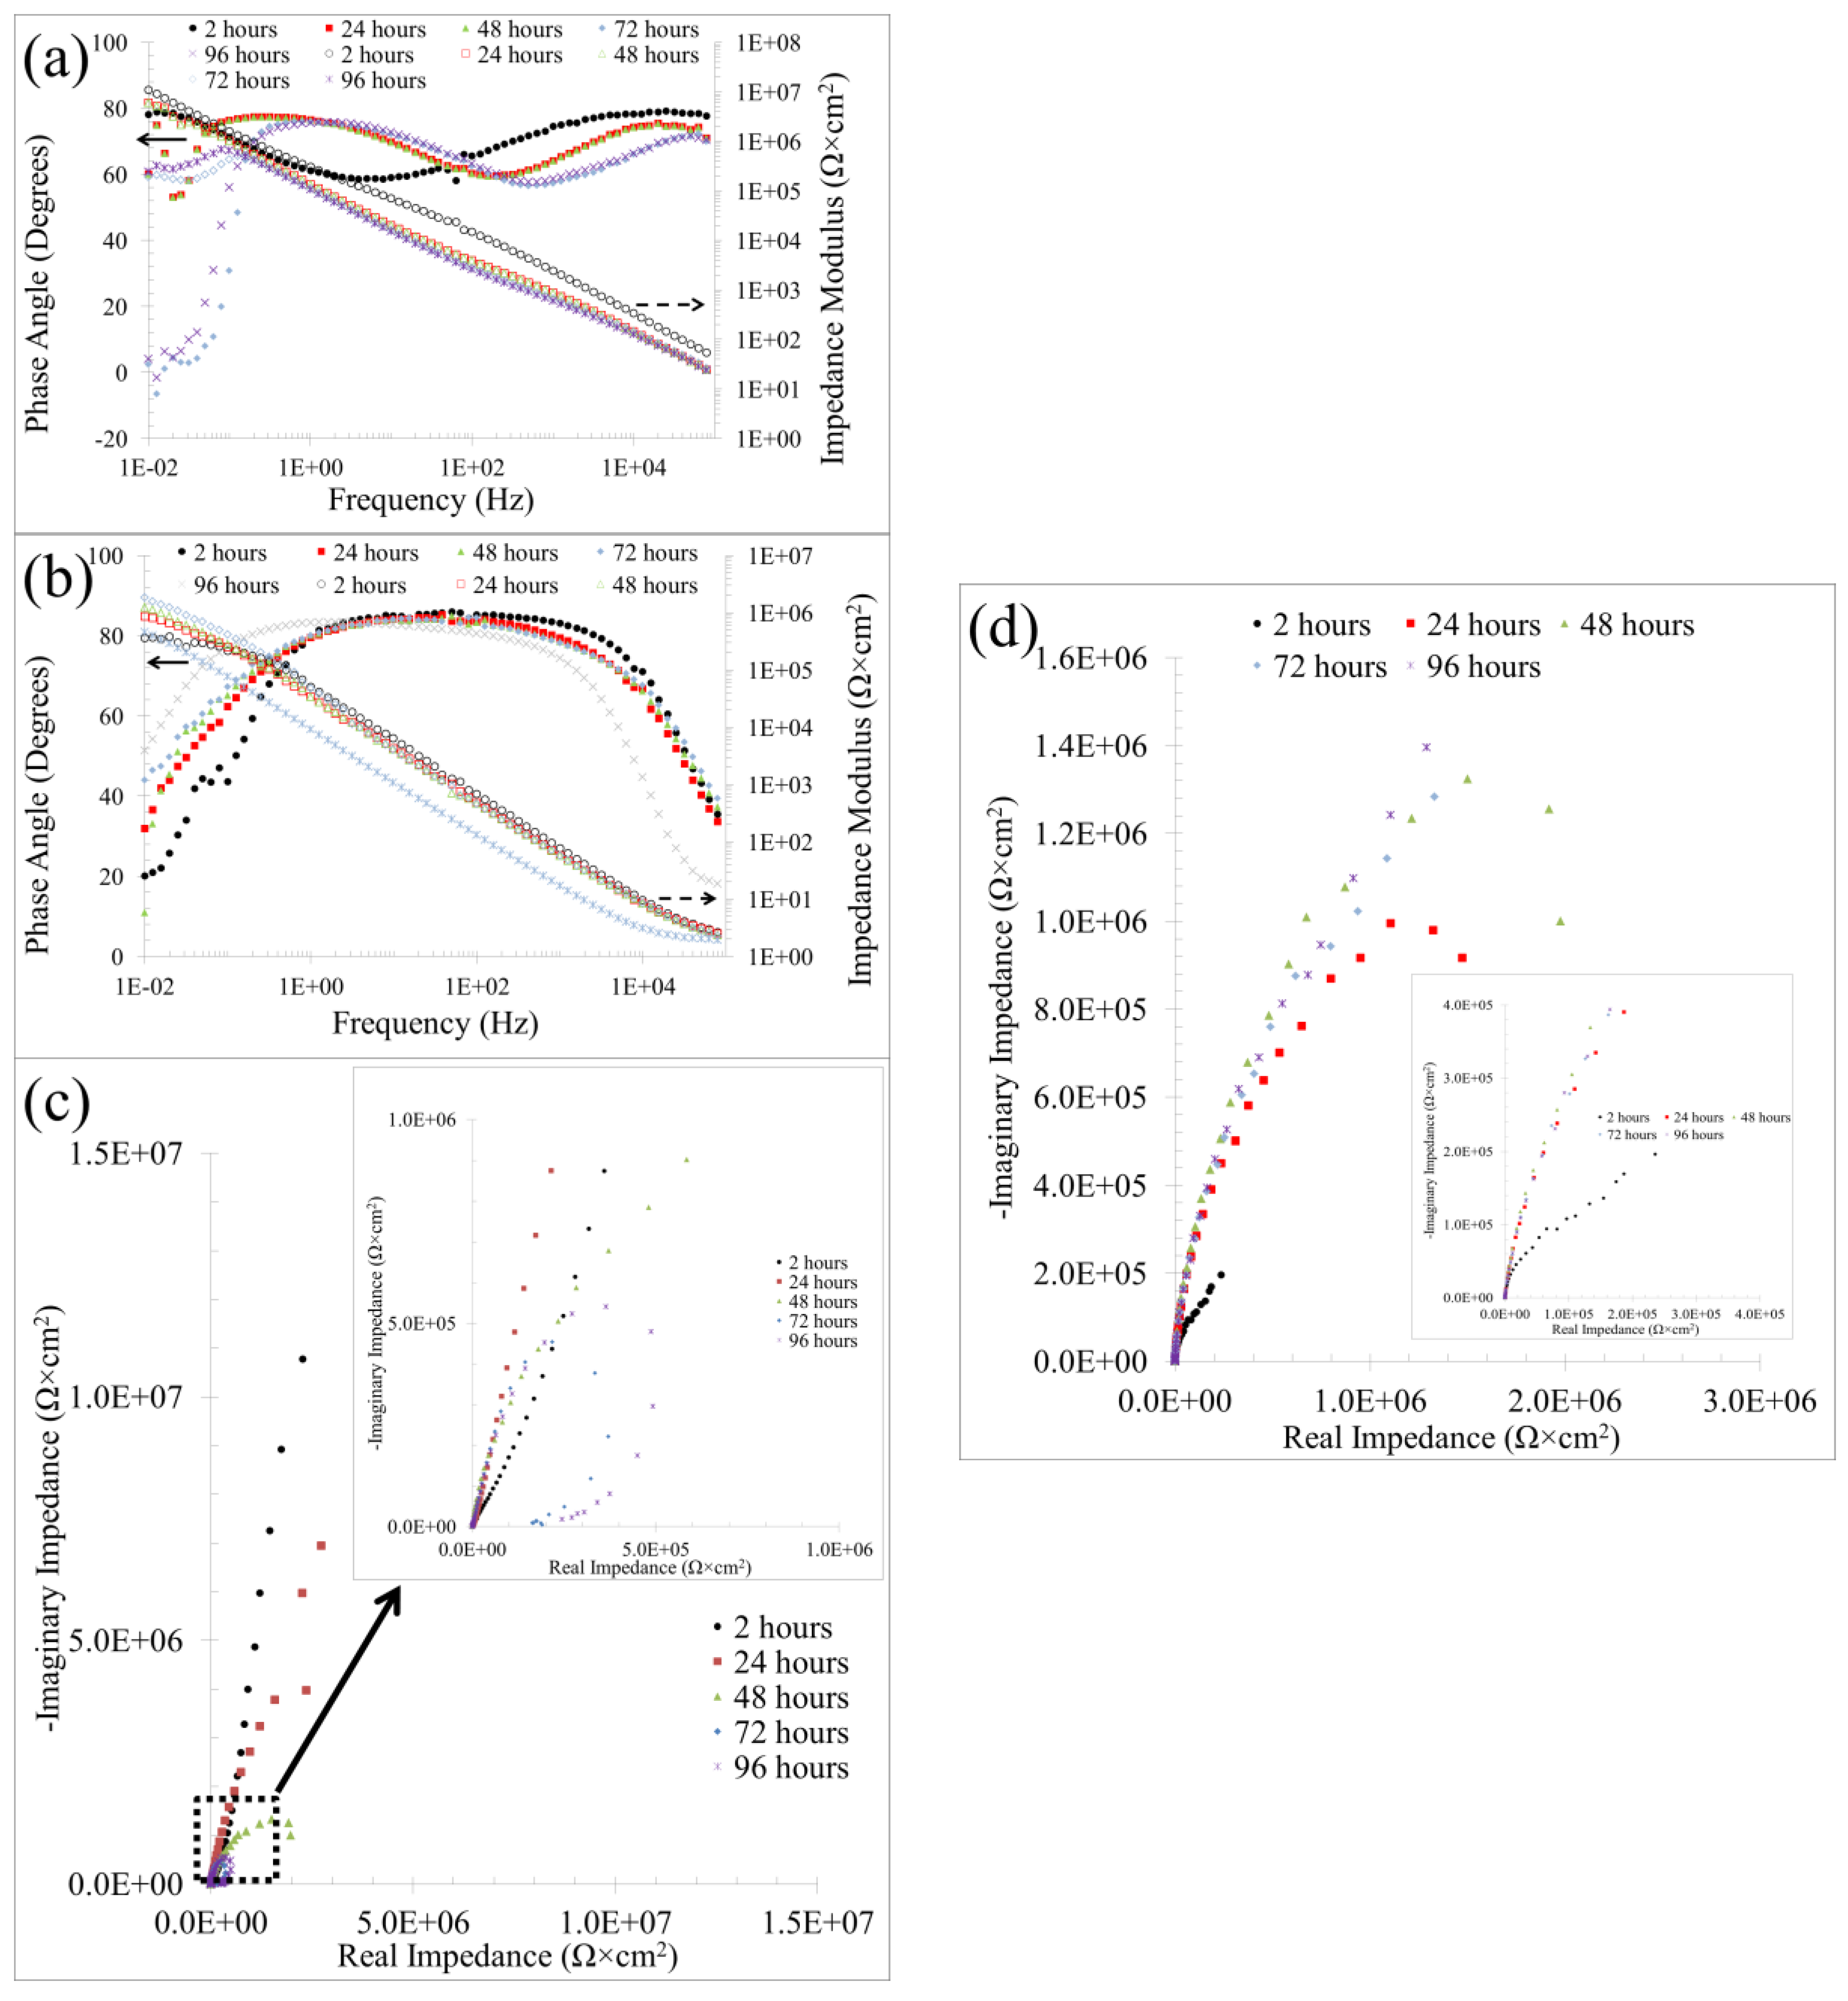
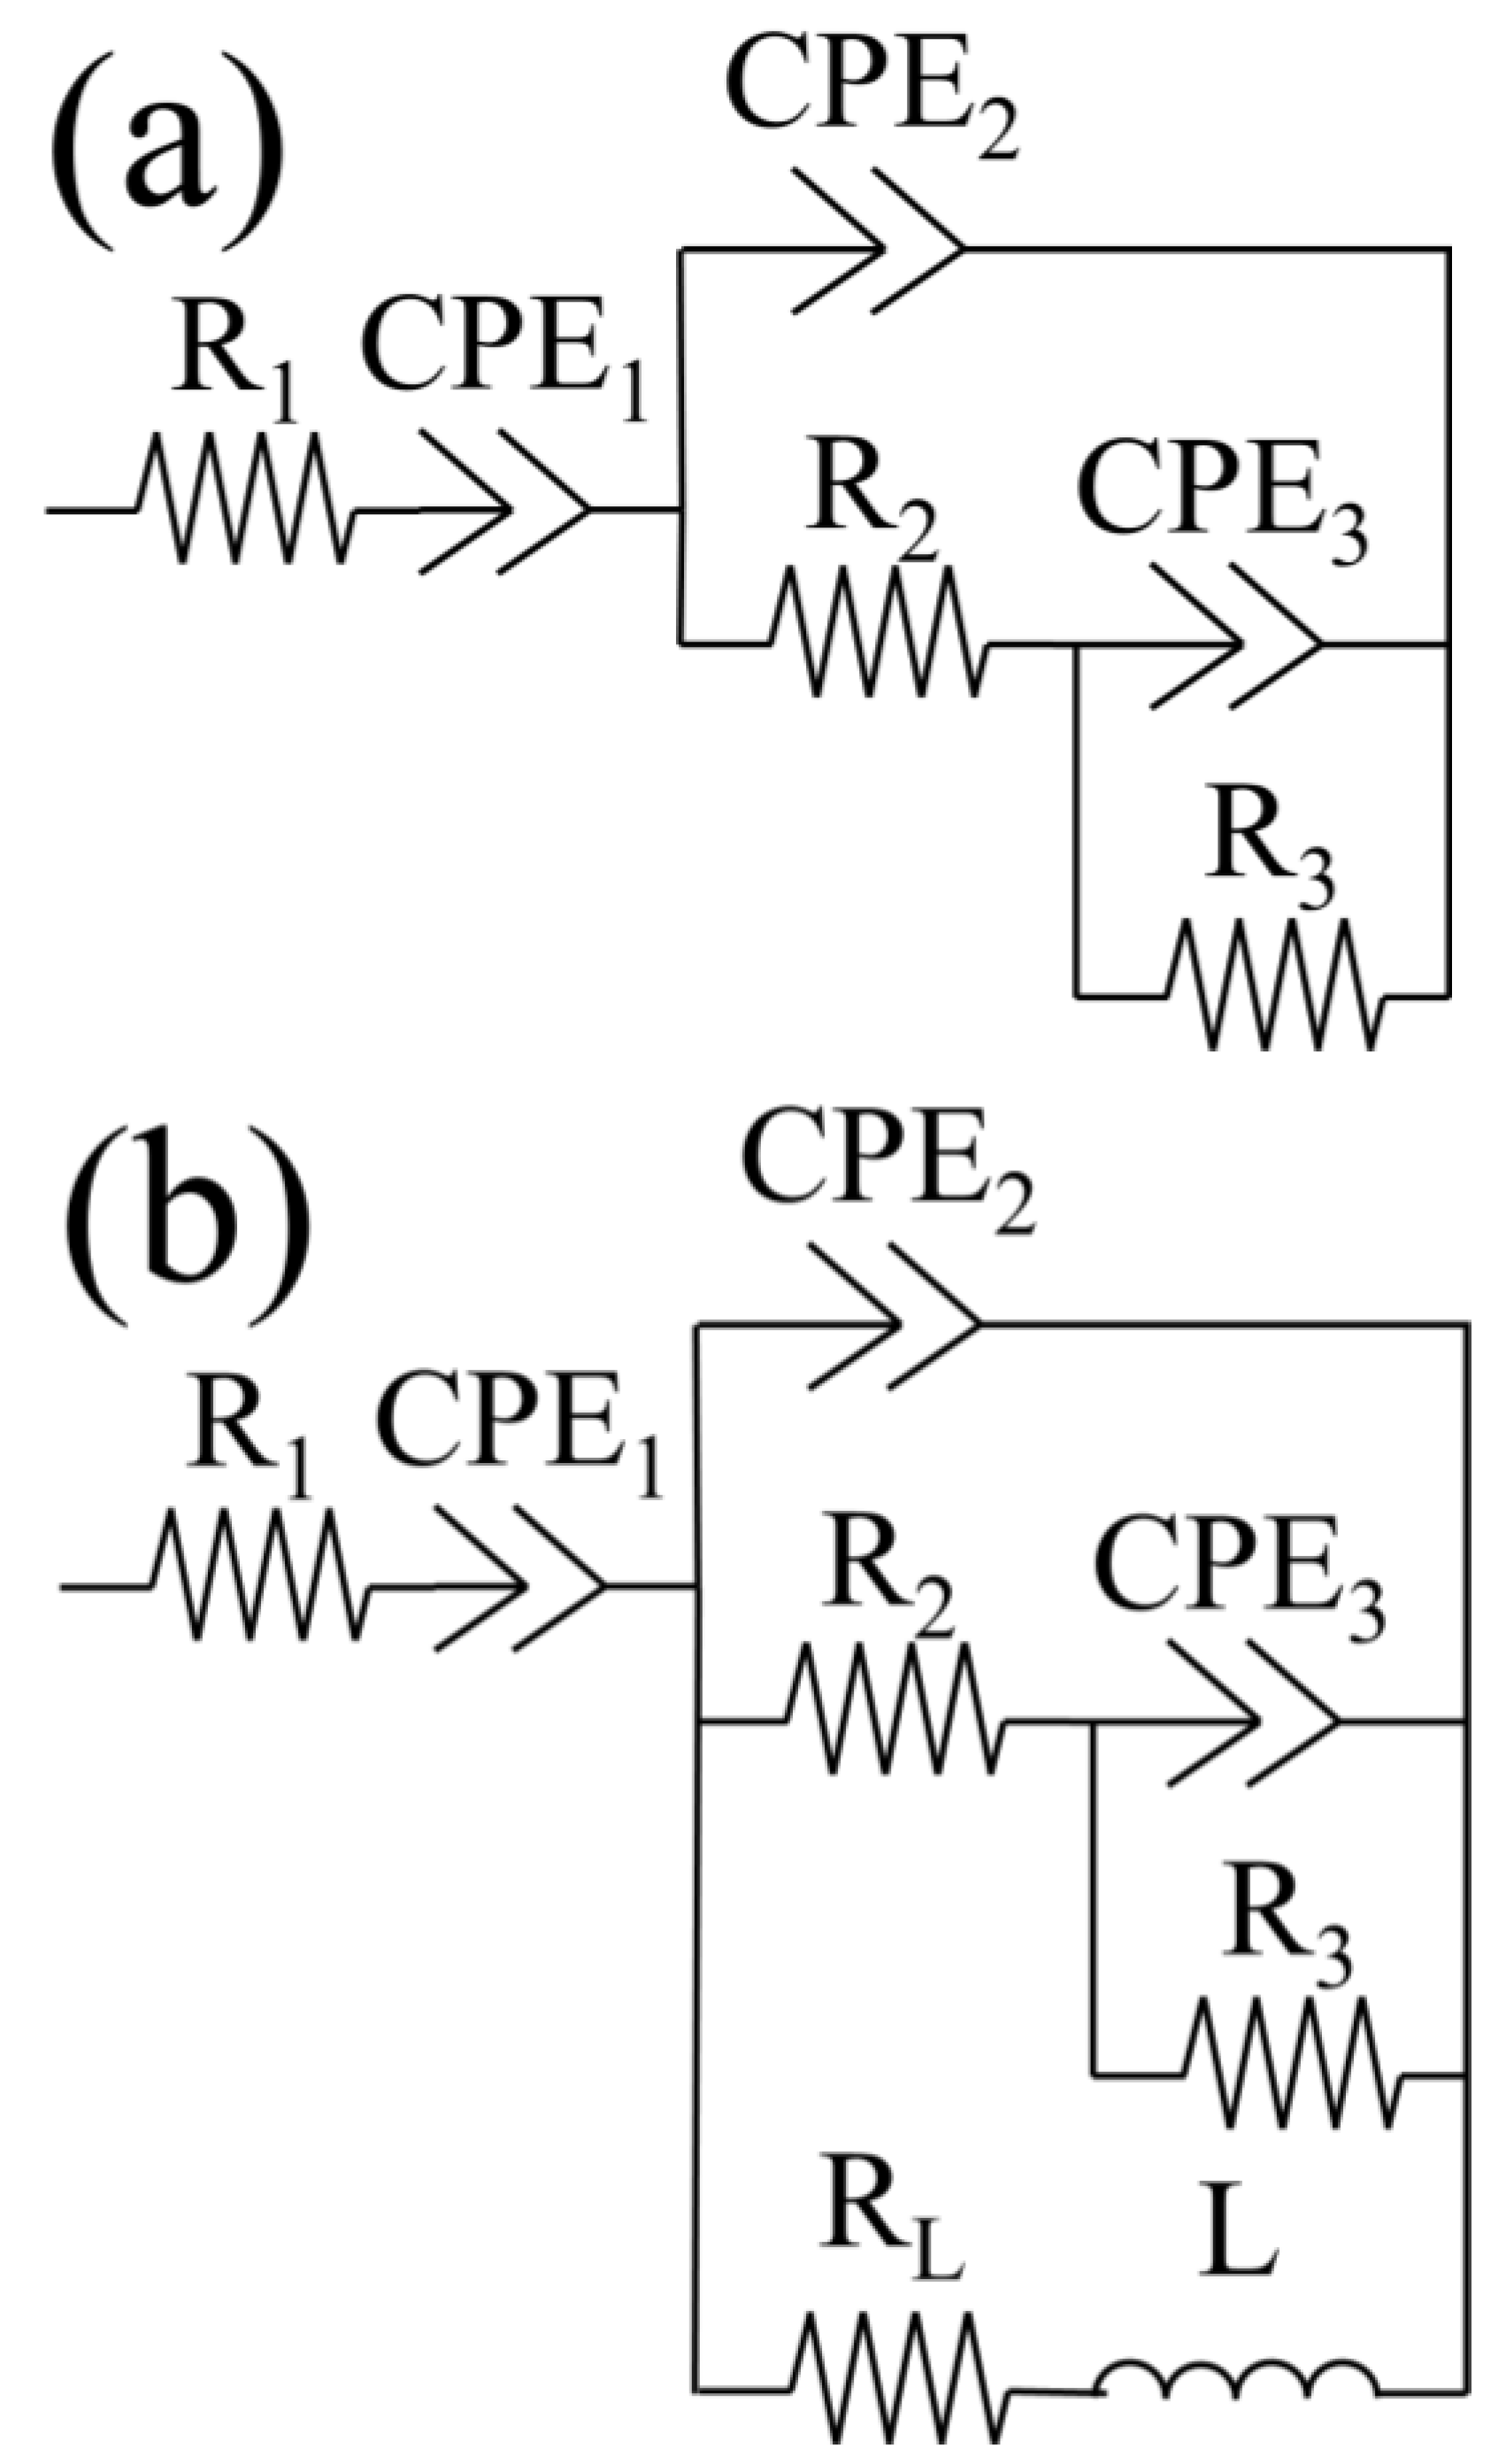
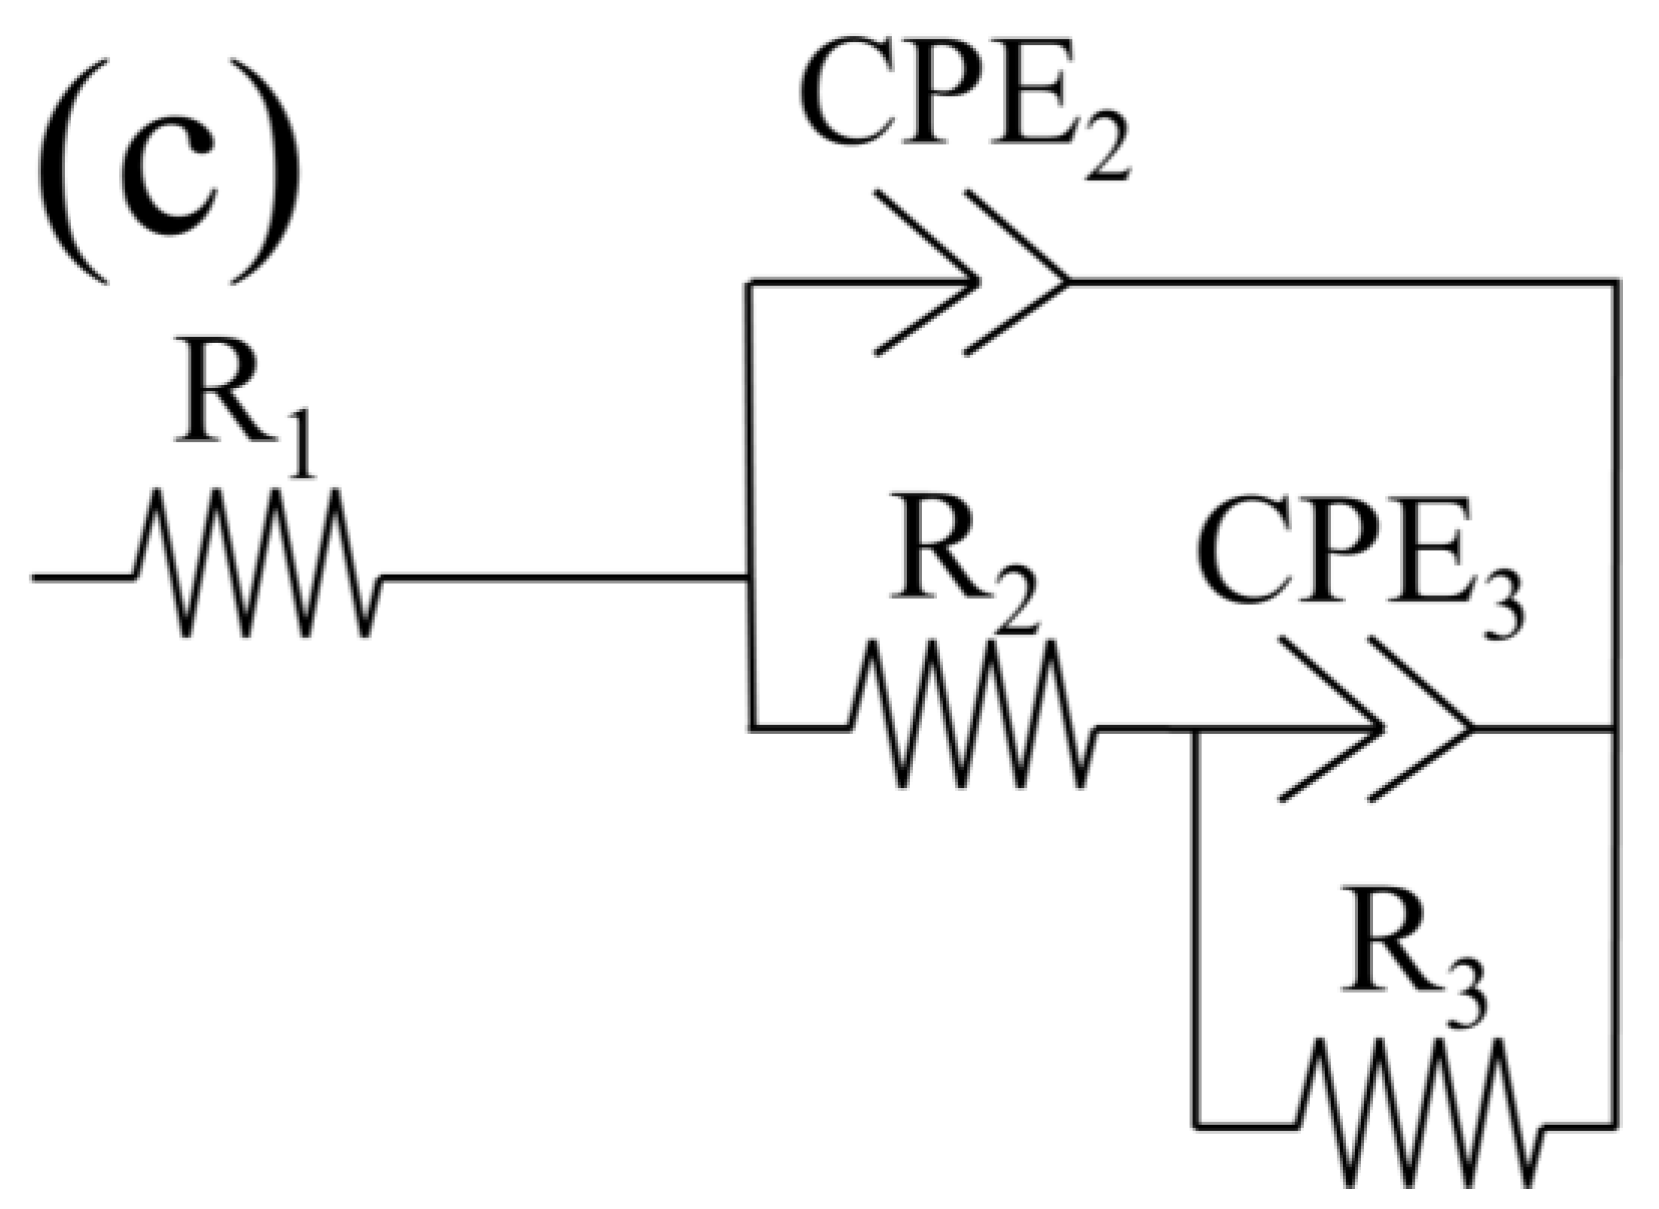
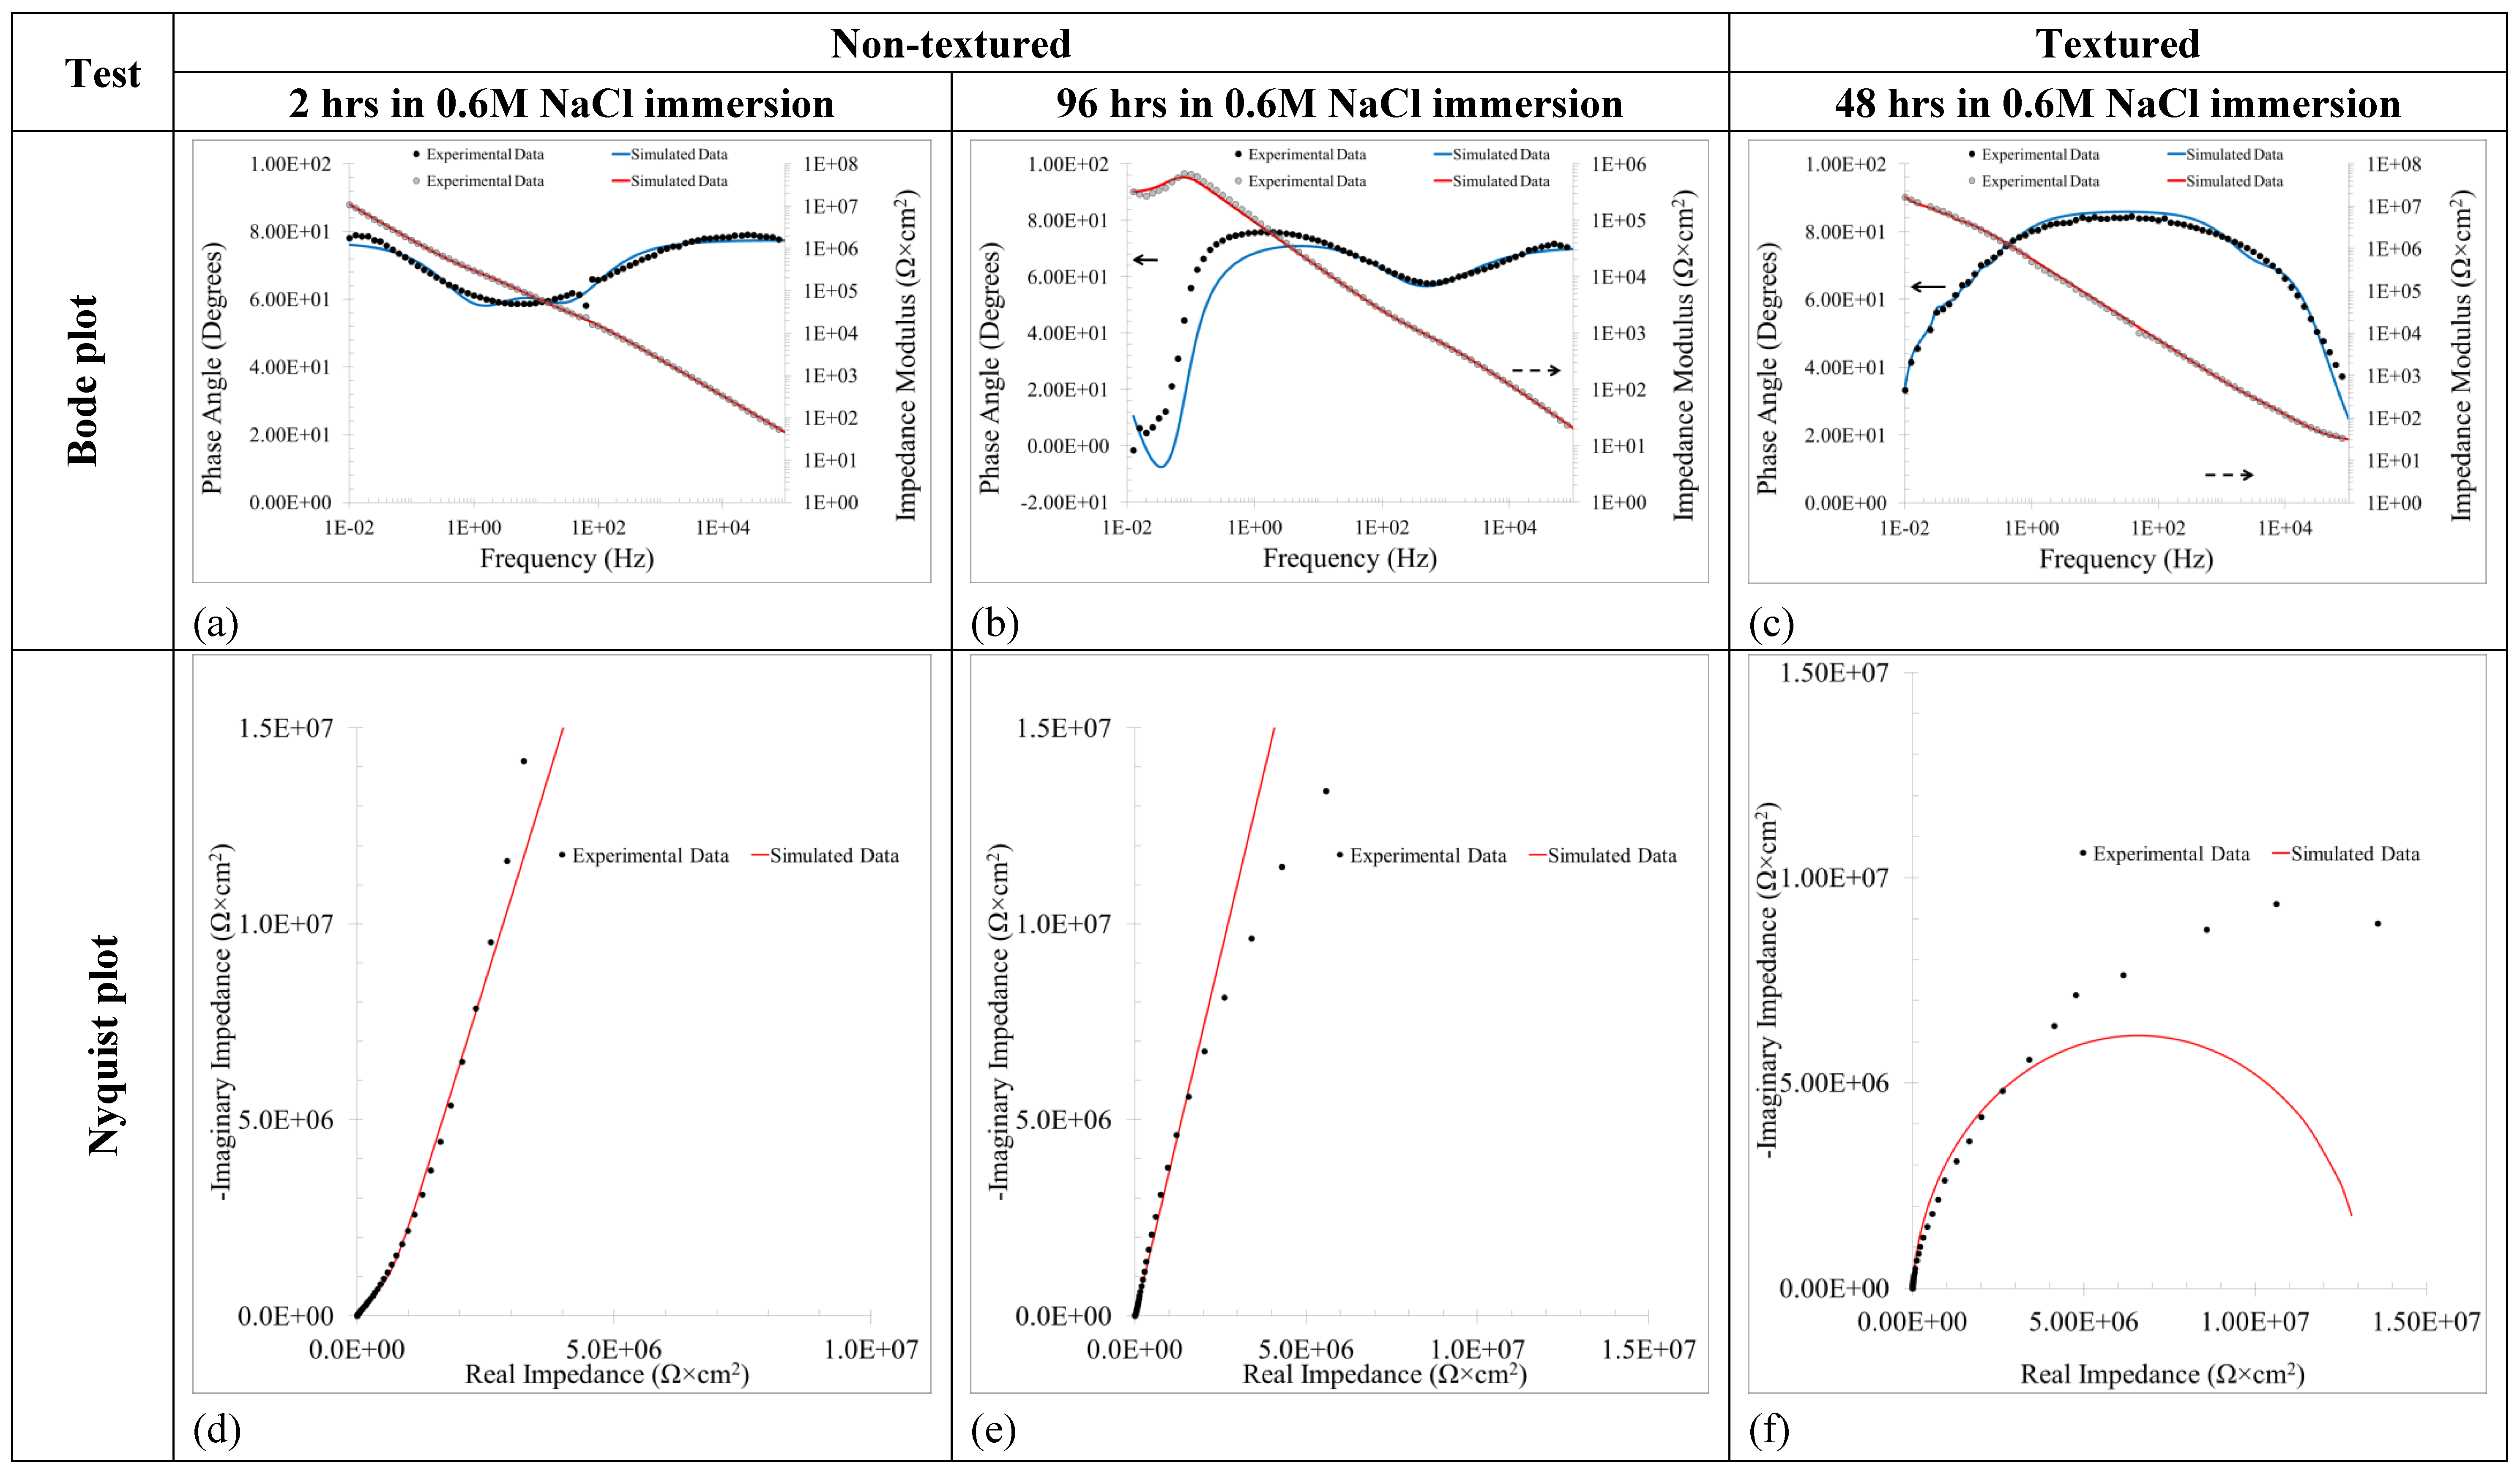
3.1.3. Electrochemical Impedance Spectroscopy (EIS), Active Corrosion Testing of Alternating Current

EIS results indicated that the corrosion mechanisms of the non-textured and textured samples were different, as shown in Figure 4.
The corrosion mechanism of the non-textured pure aluminium (Figure 4a,c) changed at 48 h of immersion in 0.6 M NaCl. This indicated the instability of the corrosion system over the time. The equivalent circuit for the corrosion mechanisms (Figure 5a) at ≤24 h was formed of three time constants. A resistance (R1) and constant phase element (CPE1) were the equivalent circuit elements that represented the first time constant. This time constant was associated with the semicircle at low real impedance in the Nyquist plots, and the peak (phase angle plots) and slope (impedance modulus plots) of the Bode plots at high frequency range (from 103 to 105 Hz). Both equivalent circuit elements were in series between them. The second time constant was the flat peak (phase angle plots) and inclined curve (impedance modulus plots) at low frequency range (10−2–102 Hz) for the Bode plots and the semicircle at high real impedance for the Nyquist plots. This showed that the equivalent circuit elements of this time constant were a resistance (R2) and a constant element phase (CPE2) in parallel with each other. The elements of this time constant were in parallel with each other and in series with the previous time constant elements. The last time constant was represented with the same equivalent circuit elements as the previous time constant (CPE3 and R3). The same elements of the Bode and Nyquist plots of the previous time constant formed this time constant, with overlapping between both time constants. CPE3 was also in parallel with R3 and was in series with R2.
The corrosion mechanism at prolonged immersion time (at ≥48 h) was comprised of four time constants, (Figure 5b). The first three time constants were similar to the previous corrosion mechanism, and the signals in the Bode and Nyquist plots, and equivalent circuit elements, were also similar. The fourth time constant was related to the inclined curves with negative slope at low frequency range (10−2–10−1 Hz) for Bode plots and the negative loop of the Nyquist plots. This time constant was formed of a resistance (RL) and an inductance (L), which is characteristic of a dramatic reduction in the imaginary impedance [36]. Both elements were in series with each other and in parallel with the equivalent circuit elements of the third and fourth time constants.
The corrosion mechanism of the textured sample (Figure 4b,d) was constant over time, indicating the high stability of the corrosion process. This mechanism was formed of three time constants (Figure 5c). A resistance was the first time constant (R1) that was found at high frequencies (104–105 Hz) in the impedance modulus Bode plots as a horizontal curve. The second time constant was from 101 to 103 Hz in the Bode and Nyquist plot. This element was the beginning of the flat peak for the phase angle plot, while this was first inclined curve of the modulus impedance plot. The semicircle at low real impedance was the constant time in the Nyquist plots. Thus, the equivalent circuit elements of this time constant were a resistance (R2) and constant element phase (CPE2) in parallel with each other and in series with R1. The third time contact was similar to the second time constant, but these were observed at low frequencies (10−2–101 Hz). The flat peak of the phase angle plots indicated that the second and third time constants overlapped. R1, therefore, was in series with third time constant element phase (CPE3), while the resistance of third time constant (R3) was in parallel with CPE3.
Proposed equivalent circuits according to the analysis of the experimental EIS data can be seen in Figure 5. The experimental data and simulated data from the equivalent circuits are shown in Figure 6. The good Χ2 value (10−4–10−2) confirms that the data calculated using the equivalent circuits were valid.
The data obtained for the equivalent circuit method is listed in Table 5. According to the simulated values, the equivalent circuit elements were identified for each corrosion process of the corrosion mechanisms. Varying elements of the equivalent circuits represented similar corrosion processes for both samples. R2, CPE2 and n2 corresponded at the same processes for all samples, these being the passive film processes, and therefore these elements were named Rf, CPEf and nf (as in Table 5). R3, CPE3 and n3 were other common elements for all samples and these represented the charge transference resistance (Rct) and double layer capacitance (CPEdl and ndl) [37]. R1 and CPE1 of the non-textured pure aluminium samples had the same corrosion process, being associated with the activation-passivation processes of the metallic material (Ra-p and CPEa-p). This is because of the partial passivation of the surface [38]. In the case of textured pure aluminium sample R1, this represented the environment resistance (Rs). RL and L, which were found only for the non-textured pure aluminium at ≥48 h of immersion, represented adsorption-desorption of the water and protons on the aluminium surface [30,31]. These elements were thus named as Rad-de and Lad-de.
The values of some of these equivalent circuit elements evolved over time, and in different ways, according to the sample type.
With respect to the non-textured samples, Ra-p and CPEa-p increased with time, indicting the surface passivation was increased. Rf decreased with time at ≤48 h, while this increased over the time at ≥72 h. The decrease of Rf was due to the pitting generation, whilst re-passivation caused the increase in Rf. This confirms that the passive film can spontaneously recover by itself, as mentioned in the potentiodynamic polarisation curves analyses section. CPEf presented the opposite evolution over time compared to Rf, validating the passive film behaviour. The passive film thickness, d, is proportional to CPEf, as can be observed in the next Equation (6) [30].
d = ε A l O × ε 0 C P E f × ( 2 × π × f f ) n f 1
where, εo is the permittivity of free space (8.854 × 10⁻¹⁴ F/cm [39]), ff is the frequency of the phase angle for passivation elements and εAlO is the dielectric constant of alumina (8.5 [39]).
nf decreased with time at values around 0.8, indicating that the passive film has pores [37] because of the high affinity of the aluminium passive film for chloride ions [40,41]. Rct, CPEdl and ndl were approximately constant with time, showing the bare, pure aluminium was free of the aggressive environment effect. Note that the ndl was around 0.8, showing the bare material surface had roughness [37]. The presence of Rad-de and Lad-de in the equivalent circuit at ≥48 h indicated that adsorption-desorption processes of chloride ions, water and oxygen occur at 48 h of immersion [30,31]. The localised dissolution of the passive film caused by the chloride ions generated cracks and pores on this film. These imperfections are zones where the adsorption-desorption process of these elements occurs at a slow velocity. Rad-de and Lad-de increased with time, showing that adsorption-desorption are slower. The accumulation of the harsh elements (e.g., water, chloride ions and oxygen) on the surfaces of cracks and pores hinder the process of adsorption-desorption [30,31].
Regarding the laser textured sample corrosion mechanism, the element values of the equivalent circuits were constant over time. This indicates that the corrosion mechanism of the textured pure aluminium is stable over time. Rct was the only element that changed over time. The reduction of this value with time shows a diminishing of the sample corrosion resistance.

4. Discussion

The corrosion behaviour of the pure aluminium changed following the laser surface texturing process due to chemical and topographic modifications. The oxidised layer generated with the laser processing was more stable than the native passive film. This was observed in the low fluctuation amplitude of the metastable pitting (AEN analyses), higher Ecorr (PPC assessments) and the stable corrosion mechanism over time (EIS evaluations) of the textured samples. The laser process refines the iron-rich intermetallics, producing a reduction of the metastable pitting activity and ennoblement of the samples. These intermetallics have a cathodic/anodic effect on the aluminium matrix that destabilises the native passive film of the commercial pure aluminium in an aggressive environment. This cathodic effect is proportional to the size of the intermetallics. The laser surface texturing refines and oxidises the Al3Fe and Al6Fe, causing the reduction or removal of the detaching process of the intermetallics [20,21,22]. This eliminates the evolution of the system over the time.
The commercial pure aluminium specimens possessed higher kinetic corrosion resistance than textured samples. Lower RAEN and higher IR.M.S. (AEN assessments), faster C.R.corr (PPC evaluations) and lower Rf (EIS analyses) of the textured samples indicated this lower kinetic corrosion resistance. Laser processing produces a thermal stress on the pure aluminium samples, generating cracks. These imperfections reduce the kinetic corrosion resistance of the laser processed passive film. These defects hinder the possibility of recovering the passive film by itself. The equal value of Ecorr with Epass indicates that repassivation is impossible [8].
The textured samples showed a cathodic branch with diffusion control, while the non-textured specimens had a cathodic branch controlled by activation (PPC analyses). The high roughness of the textured surfaces hinders the access to oxygen and water to the cathodic areas, slowing the mass transference process (diffusion) due to this impedance [31].

5. Conclusions

The conclusions of the present study are that the laser processing modified the corrosion behaviour of the pure aluminium. Metastable pitting was lower after the laser processing owing to the refinement and oxidation of the iron-rich intermetallics. The corrosion rate of the native passive film was lower than the laser oxidised layer because of these cracks. Textured samples were nobler than non-textured specimens because of the elimination of the intermetallics. The native passive film could recover owing to the absence of the cracks. The corrosion mechanism of the textured samples was more stable than the non-textured samples as a result of the refinement of the intermetallics during processing that avoids or reduces the intermetallic detaching process. The corrosion resistance of the non-textured pure aluminium, however, was higher than in the textured samples because of the good qualities of the native passive film.
Although the non-textured pure aluminium presented better corrosion resistance than the textured samples, this corrosion resistance evolved over the time. This indicates that the corrosion resistance of the pure aluminium without laser processing can be damaged and become lower than textured sample corrosion resistance, which is stable over time. This can be advantage for applications that require a stable corrosion mechanism.

Author Contributions

All authors (J.I.A.-T., H.R.K., T.T.Ö. and M.C.S.) contributed to the study conception and design. The generation of samples were carried out by M.C.S. and the corrosion assessment were conducted by J.I.A.-T. The analysis and discussion of the results were developed by J.I.A.-T. The first draft of the manuscript was written by J.I.A.-T., and all authors (J.I.A.-T., H.R.K., T.T.Ö. and M.C.S.) commented on, and developed, subsequent versions of the manuscript. All authors have read and agreed to the published version of the manuscript.

Funding

The authors declare that no funds, grants, or other support were received during the preparation of this manuscript.

Institutional Review Board Statement

Not applicable.

Informed Consent Statement

Not applicable.

Data Availability Statement

The datasets generated during and/or analysed during the current study are available in the manuscript.

Conflicts of Interest

The authors declare no conflict of interest.

References

  1. Davis, J.R. Aluminum and Aluminum Alloys: ASM International; ASM International: Novelty, OH, USA, 1993. [Google Scholar]
  2. Aamir, M.; Giasin, K.; Tolouei-Rad, M.; Vafadar, A. A review: Drilling performance and hole quality of aluminium alloys for aerospace applications. J. Mater. Res. Technol. 2020, 9, 12484–12500. [Google Scholar] [CrossRef]
  3. Mariglis, M. The Influence of Inter-anneal and Cold Rolling Processes on Key Lithographic Sheet Properties. Ph.D Thesis, The University of Manchester, Manchester, UK, 2012. [Google Scholar]
  4. Sverdlin, A. Properties of pure aluminum. In Handbook of Aluminum; Totten, G.E., MacKenzie, D.S., Eds.; CRC Press: Boca Raton, FL, USA, 2003; Volume 1, pp. 33–59. [Google Scholar]
  5. Alam, T.; Ansari, A.H. Review on Aluminium and Its Alloys for automotive applications. Int. J. Adv. Technol. Eng. Sci. 2017, 5, 278–294. [Google Scholar]
  6. Nurul, M.; Syahrullail, S. Surface texturing and alternative lubricant: Tribological study of tapered die sliding contact surface in cold extrusion process. Tribol. Trans. 2017, 60, 176–186. [Google Scholar] [CrossRef]
  7. Khaskhoussi, A.; Calabrese, L.; Patané, S.; Proverbio, E. Effect of Chemical Surface Texturing on the Superhydrophobic Behavior of Micro–Nano-Roughened AA6082 Surfaces. Materials 2021, 14, 7161. [Google Scholar] [CrossRef] [PubMed]
  8. Ahuir-Torres, J.I.; Arenas, M.; Perrie, W.; Dearden, G.; De Damborenea, J. Surface texturing of aluminium alloy AA2024-T3 by picosecond laser: Effect on wettability and corrosion properties. Surf. Coat. Technol. 2017, 321, 279–291. [Google Scholar] [CrossRef]
  9. Ansari, I.A.; Watkins, K.G.; Sharp, M.C.; Hutchinson, R.; Potts, R. Modification of Aluminium Surface Using Picosecond Laser for Printing Applications. MRS Online Proc. Libr. 2009, 1230, 714. [Google Scholar] [CrossRef]
  10. Ansari, I.; Watkins, K.; Sharp, M.; Hutchinson, R.; Potts, R.; Clowes, J. Modification of anodised aluminium surfaces using a picosecond fibre laser for printing applications. J. Nanosci. Nanotechnol. 2012, 12, 4946–4950. [Google Scholar] [CrossRef] [PubMed]
  11. Kumar, A.; Alok, A.; Das, M. Surface texturing by electrochemical micromachining: A review. In IOP Conference Series: Materials Science and Engineering; IOP Publishing: Bristol, UK, 2020. [Google Scholar]
  12. Renk, T.J.; Provencio, P.P.; Shlapakovski, A.; Petrov, A.; Yatsui, K.; Jiang, W.; Suematsu, H. Materials modification using intense ion beams. Proc. IEEE 2004, 92, 1057–1081. [Google Scholar] [CrossRef]
  13. Vishnoi, M.; Kumar, P.; Murtaza, Q. Surface texturing techniques to enhance tribological performance: A review. Surf. Interfaces 2021, 27, 101463. [Google Scholar] [CrossRef]
  14. Boinovich, L.B.; Emelyanenko, A.M.; Modestov, A.D.; Domantovsky, A.G.; Emelyanenko, K.A. Synergistic effect of superhydrophobicity and oxidized layers on corrosion resistance of aluminum alloy surface textured by nanosecond laser treatment. ACS Appl. Mater. Interfaces 2015, 7, 19500–19508. [Google Scholar] [CrossRef]
  15. Misyura, S.; Feoktistov, D.; Morozov, V.; Orlova, E.; Kuznetsov, G.; Islamova, A. Effect of heat treatment on corrosion of laser-textured aluminum alloy surfaces. J. Mater. Sci. 2021, 56, 12845–12863. [Google Scholar] [CrossRef]
  16. Alvi, M.H.; Cheong, S.W.; Weiland, H.; Rollett, A.D. Recrystallization and texture development in hot rolled 1050 aluminum. In Materials Science Forum; Trans Tech Publications: Zurich, Switzerland, 2004. [Google Scholar]
  17. Sharp, M.C.; Rosowski, A.P.; French, P.W. Nanosecond laser texturing of aluminium for control of wettability. In Industrial Laser Applications Symposium (ILAS 2015); SPIE: Bellingham, WA, USA, 2015; Volume 9657, pp. 129–135. [Google Scholar]
  18. Xia, D.-H.; Song, S.; Behnamian, Y.; Hu, W.; Cheng, Y.F.; Luo, J.-L.; Huet, F. Electrochemical noise applied in corrosion science: Theoretical and mathematical models towards quantitative analysis. J. Electrochem. Soc. 2020, 167, 081507. [Google Scholar] [CrossRef]
  19. Meng, G.; Wei, L.; Zhang, T.; Shao, Y.; Wang, F.; Dong, C.; Li, X. Effect of microcrystallization on pitting corrosion of pure aluminium. Corros. Sci. 2009, 51, 2151–2157. [Google Scholar] [CrossRef]
  20. Smialowska, Z.S. Pitting corrosion of aluminum. Corros. Sci. 1999, 41, 1743–1767. [Google Scholar] [CrossRef]
  21. Speckert, L.; Burstein, G. Combined anodic/cathodic transient currents within nucleating pits on Al–Fe alloy surfaces. Corros. Sci. 2011, 53, 534–539. [Google Scholar] [CrossRef]
  22. Kakinuma, H.; Muto, I.; Oya, Y.; Momii, T.; Sugawara, Y.; Hara, N. Morphological Change and Open-circuit Potential of Single Metastable Pit on AA1050 Aluminum in NaCl Solution. J. Electrochem. Soc. 2021, 168, 021504. [Google Scholar] [CrossRef]
  23. García-Ochoa, E.; González-Sánchez, J.; Corvo, F.; Usagawa, Z.; Dzib-Pérez, L.; Castañeda, A. Application of electrochemical noise to evaluate outdoor atmospheric corrosion of copper after relatively short exposure periods. J. Appl. Electrochem. 2008, 38, 1363–1368. [Google Scholar] [CrossRef]
  24. Delijić, K.; Markoli, B.; Naglič, I. The influence of the chemical composition on the corrosion performances of some Al-Fe-Si, Al-Mg-Si and Al-Mg-Mn type of alloys. Metall. Mater. Eng. 2014, 20, 217–234. [Google Scholar] [CrossRef]
  25. Šeruga, M.; Hasenay, D. Electrochemical and surface properties of aluminium in citric acid solutions. J. Appl. Electrochem. 2001, 31, 961–967. [Google Scholar] [CrossRef]
  26. Mansfeld, F.; Sun, Z. Localization index obtained from electrochemical noise analysis. Corrosion 1999, 55, 915–918. [Google Scholar] [CrossRef]
  27. Song, G.; Johannesson, B.; Hapugoda, S.; StJohn, D. Galvanic corrosion of magnesium alloy AZ91D in contact with an aluminium alloy, steel and zinc. Corros. Sci. 2004, 46, 955–977. [Google Scholar] [CrossRef]
  28. Urzua, R.; Siqueiros, J.; Morales, L.; Rosales, I.; Uruchurtu, J. On-line corrosion monitoring of 70 Cu 30 Ni alloy in a LiBr solution under absorption heat pump flow conditions. Port. Electrochim. Acta 2009, 27, 127–142. [Google Scholar] [CrossRef]
  29. Cottis, R.A. Electrochemical noise for corrosion monitoring. Tech. Corros. Monit. 2021, 2, 99–122. [Google Scholar] [CrossRef]
  30. Kelly, R.G.; Scully, J.R.; Shoesmith, D.; Buchheit, R.G. Electrochemical Techniques in Corrosion Science and Engineering; CRC Press: Boca Raton, FL, USA, 2002. [Google Scholar]
  31. Seong-Jong, K.; Seok-Ki, J.; Min-Su, H.; Jae-Cheul, P.; Jeong, J.-Y.; Chong, S.-O. Mechanical and electrochemical characteristics in sea water of 5052-O aluminum alloy for ship. Trans. Nonferrous Met. Soc. China 2013, 23, 636–641. [Google Scholar]
  32. Anantharaj, S.; Noda, S.; Driess, M.; Menezes, P.W. The pitfalls of using potentiodynamic polarization curves for tafel analysis in electrocatalytic water splitting. ACS Energy Lett. 2021, 6, 1607–1611. [Google Scholar] [CrossRef]
  33. Zhang, X.; Jiang, Z.H.; Yao, Z.P.; Song, Y.; Wu, Z.D. Effects of scan rate on the potentiodynamic polarization curve obtained to determine the Tafel slopes and corrosion current density. Corros. Sci. 2009, 51, 581–587. [Google Scholar] [CrossRef]
  34. Kruger, J.; Revie, R.W. Passivity. In Uhlig’s Corrosion Handbook, 3rd ed; ECS-The Electrochemical Society: Ontario, CA, USA, 2011; pp. 151–155. [Google Scholar]
  35. Kakaei, K.; Esrafili, M.D.; Ehsani, A. Graphene and anticorrosive properties. In Interface Science and Technology; Elsevier: Amsterdam, The Netherlands, 2019; pp. 303–337. [Google Scholar]
  36. Cesiulis, H.; Tsyntsaru, N.; Ramanavicius, A.; Ragoisha, G. The study of thin films by electrochemical impedance spectroscopy. In Nanostructures and Thin Films for Multifunctional Applications; Springer: Berlin/Heidelberg, Germany, 2016; pp. 3–42. [Google Scholar]
  37. Shi, Y.; Pan, Q.; Li, M.; Huang, X.; Li, B. Effect of Sc and Zr additions on corrosion behaviour of Al–Zn–Mg–Cu alloys. J. Alloy. Compd. 2014, 612, 42–50. [Google Scholar] [CrossRef]
  38. Fernandes, J.; Ferreira, M.; Rangel, C. Electrochemical impedance studies on pure aluminium in carbonate solution. J. Appl. Electrochem. 1990, 20, 874–876. [Google Scholar] [CrossRef]
  39. Oh, H.-J.; Jang, K.-W.; Chi, C.-S. Impedance characteristics of oxide layers on aluminium. Bull. Korean Chem. Soc. 1999, 20, 1340–1344. [Google Scholar]
  40. Tiwari, S.; Balasubramaniam, R.; Gupta, M. Corrosion behavior of SiC reinforced magnesium composites. Corros. Sci. 2007, 49, 711–725. [Google Scholar] [CrossRef]
  41. Tighiouaret, S.; Hanna, A.; Azzeddine, H.; Rabahi, L.; Dakhouche, A.; Brisset, F.; Helbert, A.L.; Baudin, T.; Bradai, D. On the evolution of microstructure, texture and corrosion behavior of a hot-rolled and annealed AZ31 alloy. Mater. Chem. Phys. 2021, 267, 124598. [Google Scholar] [CrossRef]
Figure 1. Laser Texturing Set up: (a) Schematic of high-speed laser texturing setup; (b) output (image) from Rigal i800 laser; (c) high speed rotary axis.
Processes 11 00721 g001
Figure 2. (a) AEN results of the non-textured and textured aluminium in 0.6 M NaCl immersion for 2 h, OCP (potential evolution over the time); (b) ZRA (current density evolution with the time).
Processes 11 00721 g002
Figure 3. Sample PPC at 2 h immersion in 0.6 M NaCl.
Processes 11 00721 g003
Figure 4. (a,b) Bode and (c,d) Nyquist plots of the (a,c) non-textured and (b,d), textured samples at all immersion times in 0.6 M NaCl.
Processes 11 00721 g004
Figure 5. Equivalent circuits of the corrosion mechanisms of the (a,b) non-textured commercial pure aluminium at (a) 2 h and 24 h immersion and, (b) 48 h, 72 h and 96 h immersion and, (c) textured commercial pure aluminium at all immersion times in 0.6 M NaCl.
Processes 11 00721 g005aProcesses 11 00721 g005b
Figure 6. Experimental and simulated Bode and Nyquist plots of the non-textured and textured samples.
Processes 11 00721 g006
Table 1. Chemical composition in %mass of 1050 aluminium alloy [16].
ElementSiFeCuMnMgZnTiAl
Mass (%)0.0800.3100.0030.0360.0040.0090.00899.54
Table 2. Laser texturing parameters use for the CP aluminium texturing experiments.
Nr.ParameterValueUnits
1Average Power800W
2Pulse Repetition Rate10,000Hz
3Pulse Energy (calculated from 1 and 2)80mJ
4Pulse Length60ns
5Beam Diameter at Lens21mm
6Focal length40mm
7Defocus4mm
8Estimated spot size at sample (from 5, 6, 7)2.1mm
9Rotary Speed of 170 mm cylinder963rpm
10Tangential speed (“scan speed”)8.6m/s
11Linear translation speed0.81m/min
12Hatch spacing (calculated from 9, 11)0.84mm
13Coverage rate (calculated from 10, 11, 12)0.43m2/min
Table 3. AEN factors of the non-textured and textured samples in 0.6 M NaCl for 2 h.
SampleσE (mV)σI (μA/cm2)IR.M.S (μA/cm2)C.R.AEN (μm/Year)L.I.RAEN (kΩ × cm2)
Non-textured11.3400.3313.19434.3140.0934.221
Textured7.6760.46612.281131.9540.0416.481
Table 4. PPC factors of the non-textured and textured samples in 0.6 M NaCl.
FactorNon-Textured AluminiumTextured Aluminium
Ecorr (V)−0.988−0.695
Icorr (nA/cm2)47.085338.101
C.R.corr (μm/year)0.5063.633
βc (mV/decade)−0.035−0.012
βa (mV/decade)0.1500.001
Rp (kΩ*cm2)4210.941
Ipass (μA/cm2)0.110-
C.R.pass (μm/year)1.182-
Idiff (A/cm2)-3.673
C.R.diff (μm/year)-39.463
Epb (V)−0.698-
Erp (V)−0.896-
Table 5. Summary of the equivalent circuit element values according to the samples and immersion time.
Non-Textured Samples
Time (h)Ra-p (μΩ)CPEa-p (μS × sn/cm2)nlRf (kΩ × cm2)CPEf (μS × sn/cm2)nfRct (kΩ × cm2)CPEdl (μS × sn/cm2)ndlRad-de (kΩ × cm2)Lad-de (kH × cm2)X2 (10−3)
20.0650.950.85146.00.7470.8515.800.480.87--1.62
24136.01.380.834.1361.01.008.461.330.81--1.52
481752.01.530.842.00.8320.950.781.960.82123.00.232.16
722924.088.50.6883.22.6820.790.411.670.81225.0225.05.07
961056.0116.01.001076.02.3700.810.572.930.76428.02034.03.40
Textured Samples
Time (h)Rs (Ω × cm2)Rf (Ω × cm2)CPEf (μS × sn/cm2)nfRct (kΩ × cm2)CPEdl (μS × sn/cm2)ndlX2 (10−3)
22.56611.21.530.9517500.900.921.58
242.59022.12.320.9458301.400.911.37
482.60596.02.520.946110.601.003.07
722.33175.52.190.955601.050.965.77
962.11764.02.240.956031.100.957.21
Disclaimer/Publisher’s Note: The statements, opinions and data contained in all publications are solely those of the individual author(s) and contributor(s) and not of MDPI and/or the editor(s). MDPI and/or the editor(s) disclaim responsibility for any injury to people or property resulting from any ideas, methods, instructions or products referred to in the content.

