Article

Procainamide Charge Transfer Complexes with Chloranilic Acid and 2,3-Dichloro-5,6-dicyano-1,4-benzoquinone: Experimental and Theoretical Study

by
A. F. M. Motiur Rahman
1,*,
Ahmed H. Bakheit
1,
Shofiur Rahman
2,
Gamal A. E. Mostafa
1,* and
Haitham Alrabiah
1
1
Department of Pharmaceutical Chemistry, College of Pharmacy, King Saud University, Riyadh 11451, Saudi Arabia
2
Biological and Environmental Sensing Research Unit, King Abdullah Institute of Nanotechnology, King Saud University, Riyadh 11451, Saudi Arabia
*
Authors to whom correspondence should be addressed.
Processes 2023, 11(3), 711; https://doi.org/10.3390/pr11030711
Submission received: 19 January 2023 / Revised: 8 February 2023 / Accepted: 26 February 2023 / Published: 27 February 2023

Abstract

:
The formation of charge transfer (CT) complexes between bioactive molecules and/or organic molecules is an important aspect in order to understand ‘molecule-receptor’ interactions. Here, we have synthesized two new CT complexes, procainamide-chloranilic acid (PA-ChA) and procainamide-2,3-dichloro-5,6-dicyano-1,4-benzoquinone (PA-DDQ), from electron donor procainamide (PA), electron acceptor chloranilic acid (ChA), and 2,3-dichloro-5,6-dicyano-1,4-benzoquinone (DDQ). The structures of these two CT complexes were elucidated/characterized using FTIR, NMR, and many other spectroscopic methods. A stability study of each complex was conducted for the first time using various spectroscopic parameters (e.g., formation constant, molar extinction coefficient, ionization potential oscillator strength, dipole moment, and standard free energy). The formation of CT complexes in solution was confirmed by spectrophotometric determination. The molecular composition of each complex was determined using the spectrophotometric titration method and gave a 1:1 (donor:acceptor) ratio. In addition, the formation constant was determined using the Benesi–Hildebrand equation. To understand the noncovalent interactions of the complexes, density functional theory (DFT) calculations were performed using the ωB97XD/6-311++G(2d,p) level of theory. The DFT-computed interaction energies (ΔIEs) and the Gibbs free energies (ΔGs) were in the same order as observed experimentally. The DFT-calculated results strongly support our experimental results.

1. Introduction

Procainamide, 4-amino-N-(2-(diethylamino)ethyl)benzamide (PA, Figure 1), is used to treat abnormal heart rhythms, namely Wolff–Parkinson–White syndrome (WPWS)-associated arrhythmias [1,2]. According to the Vaughan Williams classification, it is classified as a class IA agent with a sodium-channel-blocking effect [1,2].
Recently, extensive care has been given to the development of the formation of charge transfer (CT) complexes derived from an electron donor and an acceptor molecule. Due to the intriguing structures; physical and chemical properties; applications in different fields, especially optical materials [2,3]; drug–receptor interactions [4]; solar energy and surface chemistry [5]; field-effect transistors; light-emitting devices, lasers, and sensors and stimuli-responsive behavior [6]; organic semiconductor properties [7,8]; and various biological applications [9,10], the synthesis of CT complexes is of interest. CT complexes are formed with unique types of interactions, which are incorporated in the formation of π-π stacking of the aromatic complexes, hydrogen bonds, and/or electron transfer from a donor to an acceptor [5,11,12,13]. The reaction mechanism of electron transfer from the donor to the acceptor of the CT complexes was reported by Mullikan [14,15]. It should be noted that molecular acceptors can be used for the determination of drugs in dosage forms [16]. Nevertheless, the formation of the CT complexes is echo-friendly, inexpensive, simple, and easy compared to other techniques [17]. On the other hand, CT complexes are used to remove and utilize discarded drugs from the environment [18]. Here, we report the synthesis and characterization of two new CT complexes ‘procainamide-chloranilic acid’ (PA-ChA) and ‘procainamide-2,3-dichloro-5,6-dicyano-1,4-benzoquinone’ (PA-DDQ). The structures of the CT complexes were elucidated using UV, fluorescence, FTIR, and NMR spectrometry. Electronic properties and conductometry were evaluated. A spectroscopic study was carried out to determine the formation constant and stoichiometry of the CT complexes. In addition, different physicochemical properties of the CT complexes were assessed to determine their stability. Furthermore, electronic structures were examined by DFT calculations to determine the frontier molecular orbitals and the relocation of the electron density.

2. Experimental Section

2.1. General

All the chemicals were reagent grade. Procainamide (purity > 99.5) was purchased from Sigma-Aldrich (Darmstadt, Germany), and chloranilic acid and 2,3-dichloro-5,6-dicyano-1,4-benzoquinone were purchased from Merck (Darmstadt, Germany). Melting points were determined on a Barnstead electrothermal digital melting point apparatus, model IA9100, BIBBY scientific limited Stone (Staffordshire, UK). IR spectra were recorded on a Jasco FT/IR-6600 spectrometer (Tokyo, Japan) in KBr. NMR spectra were taken from 400 MHz premium shielded NMR spectroscopy in deuterated dimethyl sulfoxide (DMSO-d6) (Agilent Technologies, Santa Clara, CA, USA). UV-vis spectra were measured using a Genesis G10S UV-Vis spectrophotometer (Thermo Fisher Scientific, Pleasanton, CA, USA), using acetonitrile as the solvent. All the measurements were performed using various solvents and quartz cells with a path length of 1 cm. The UV-Vis spectra in the solution were measured over the range of 200–700 nm. The conductivities of procainamide and its CT complexes (PA-ChA and PA-DDQ) were measured on an Orion conductometer (Beverly, MA, USA).

2.2. Synthesis of CT Complexes PA-ChA and PA-DDQ

2.2.1. Preparation of PA-ChA Complex

A solution of PA (235 mg, 1 mmol) in 20 mL of methanol was added to a solution of ChA (209 mg, 1 mmol) in 20 mL of methanol. The reaction mixture was stirred for 3 h at 25 °C, filtered, washed with ice-cold acetonitrile (20 mL), and dried over anhydrous CaCl2. Purple solid (yield > 95%). Melting point, 193 °C. IR: ν (cm−1): 3523, 3440, 3270, 3151, 3002, 2715, 2670, 2600, 2529, 1637, 1576, 1530, 1500, 1436, 1381, 1344, 1288, 1173, 1124. 1030, 982, 875, 839, 777, 753, 653, and 571 cm−1. 1H-NMR (DMSO-d6, 400 MHz) δ: 9.10 (br, -NH), 8.32 (t, -NH), 7.59 (d, J = 8.8 Hz, 2H), 6.55 (d, J = 8.4 Hz, 2H), 3.54–3.50 (q, -N-CH2, 2H), 3.21–3.15 (m, 3 × -CH2, 6H), and 1.18 (t, J = 7.2 Hz, 2 × -CH3, 6H) ppm.

2.2.2. Preparation of PA-DDQ Complex

A solution of PA (235 mg, 1 mmol) in 20 mL of methanol was added to a solution of DDQ (227 mg, 1 mmol) in 20 mL of methanol. The reaction mixture was stirred for 3 h at 25 °C. The solid formation was filtered, washed with ice-cold acetonitrile (20 mL), and dried over anhydrous CaCl2. Brown solid (yield > 95%). Melting point, 287 °C. IR: ν (cm−1): 3430, 3248, 2987, 2944, 2581, 2471, 2217, 1653, 1610, 1562, 1507, 1482, 1407, 1320, 1246, 1178, 1145, 1018, 961, 892, 867, 757, 680, and 625 cm−1. 1H-NMR (DMSO-d6, 400 MHz) δ: 11.00 (s, -OH), 10.05 (brs,-NH), 9.56 (s, -OH), 8.90 (t,-NH), 8.88 (t,-NH), 7.98 (d, J = 8.8 Hz, 1H), 7.88 (d, J = 8.4 Hz, 1H), 7.44 (d, J = 8.8 Hz, 1H), 7.20 (d, J = 8.4 Hz, 1H), 3.64 (quint, -N-CH2, 2H), 3.25–3.16 (m, 3 × -CH2, 6H), and 1.22 (t, J = 6.8 Hz, 2 × -CH3, 6H) ppm.

2.3. Stoichiometry

Spectrophotometric titration measurements were carried out for the reactions of PA with both ChA and DDQ, where acetonitrile was used as a blank solvent at wavelengths of 515 and 490 nm, respectively. A 0.25, 0.50, 0.75, 1.00, 1.50, 2.0, 2.50, 3.00, 3.50, and 4.00 mL aliquot of a standard solution (1 × 10⁻³ M) of the appropriate acceptor in acetonitrile was added to 1.00 mL of 1 × 10⁻³ M PA (in acetonitrile), and the total volume of the mixture was 5 mL. The concentration of PA (CD) in the reaction mixture was maintained at 1 × 10⁻³ M, whereas the concentration of the acceptors (CA) changed over a wide range of concentrations (from 0.25 × 10⁻³ M to 4 × 10⁻³ M) to produce solutions with an acceptor molar ratio that varied from 1:4 to 4:1. The stoichiometry of the CT complexes was obtained from the determination of the conventional spectrophotometric titration method.

2.4. Formation Constant

The formation constant of the investigated CT complexes was determined using the modified Benesi–Hildebrand method [19] using the following Equation (1):
[Ao]/A = 1/ƐAD + 1/Kc· Ɛ × 1/Do
where ‘[Ao]’ is the molar concentration of the acceptor ChA or DDQ, ‘Do’ is the molar concentration of the donor (PA); ‘A’ is the absorbance of the formed CT complexes at λ max; ‘Ɛ’ is the molar absorptivity of the complexes; and ‘Kc’ is the association constant of the complexes (L mol−1).

2.5. Spectroscopic Physical Parameters

2.5.1. Oscillator Strength (f) Transition Dipole Moment (−µe)

Oscillator strength and transition dipole moment were measured using Equations (2) and (3), respectively.
f = 4.32 × 10 9 [ ε max   Δ v 1 2 ]
µ = 0.0958   [ ε max Δ v 1 2 v ¯ max ] 1 / 2

2.5.2. Ionization Potential (IP)

Ionization potential (IP) values were recorded using the following equation [20].
I P   ( eV ) = 5.76 + 1.53 × 10 4   v CT

2.5.3. Energy of the CT Complexes (ECT)

The energies of the CT complexes (ECT) (eV) were calculated using Equation (5).
ECT = hvCT = 1243.667/λCT

2.5.4. Resonance Energy (RN)

The resonance energy (RN) of the CT complexes was estimated according to Equation (6) presented by Briegleb and Czekalla [21].
εmax = 7.7 × 10⁻⁴/[hv CT/RN] − 3.5]

2.5.5. Dissociation Energy (W) (eV)

Further evidence of the nature of CT interactions of the synthesized CT complexes was calculated according to Equation (7).
W = I P   E A E CT  

2.5.6. Gibbs Free Energy Change (ΔG°)

Finally, the nature of the interaction of CT complexes was examined using Gibbs free energy calculation as shown in ΔG° Equation (8).
ΔG° = −RT ln KCT

2.6. DFT Calculations

Single-point density functional theory (DFT) calculations were performed using the long-range corrected hybrid functional ωB97XD in conjunction with the 6-311++G(2d,p) basis set. All the DFT calculations were performed using Gaussian 16, Revision C.01 [22] in the gas phase first, and then the optimized structures were further calculated in the acetonitrile solvent system using the polarized continuum model (PCM). A vibrational analysis was carried out for each optimized molecule to ensure that they were in a vibrational energy minimum and had no imaginary frequencies (Supplementary Materials).

3. Results and Discussion

3.1. Synthesis of CT Complexes PA-ChA and PA-DDQ

The interaction of PA (donor) with ChA/DDQ (as π acceptors) in methanol produced colored CT complexes with high molar absorptivity. The synthesis of CT complexes was straightforward as explained in Scheme 1. Electron donor PA in methanol was simply added to the acceptor molecules (ChA/DDQ) to form colored CT complexes (Scheme 1).

3.2. Electronic Absorption Spectra

CT complexes were characterized using the spectrophotometric method. As shown in Figure 2, the absorption intensity of the CT complexes was related to the formation of the radical anion. PA showed peaks at 206 (n→σ* for C-N), 264 (n→π* for C=O), and 299 (n→π* for C=O) nm at the concentration of 8 × 10⁻⁵ M; ChA at 230 (n→π* for C=O), 282 (n→π* for C=O), and 431 (n→π* for C=O) nm; and DDQ at 249 (n→π* for C=O) and 380 (n→π* for C≡N) nm at the concentration of 1 × 10⁻⁴ M. Absorption maxima for PA-ChA were found at 246 (n→π* for C=O), 316 (n→π* for C=O), and 525 (n→π* for the visible region) nm and those for PA-DDQ were found at 246 (n→π* for C=O), 306 (n→π* for C=O), 458 (n→π* for the visible region), 543 (n→π* for the visible region), and 590 (n→π* for the visible region) nm at the concentration of 4 × 10⁻⁴ M (Figure 2). Acetonitrile was used as solvent blank for all measurements. The resulting color was stable for more than five hours, indicating the high stability of these complexes. The band gaps of the formed complex were calculated from the formula Eg (eV) = hυ = hc/λae (nm) (2) where “h” is Planck’s constant, c is the velocity of light, and λ is the wavelength. The energy gaps were 2.41 and 2.53 eV for PA-ChA and PA-DDQ complexes, respectively.

3.3. Molecular Composition of the PA Complexes

The stoichiometry of the investigated complexes was monitored and determined spectrophotometrically using spectrophotometric titration (Figure 3). As shown in Figure 4, PA reacts with CHA/DDQ in a 1:1 ratio.

3.4. Formation Constant

Upon plotting the values [A]/A against l/[Do], a straight line was obtained (Figure 4). The molar absorptivity and formation constant in acetonitrile were found to be 0.6 × 10³ L mol−1 cm−1 and 1 × 10³ L mol−1cm−1 for the PA-CHA complex and 14 × 103 and 0.1 × 10³ L mol−1 for the DDQ complex, respectively. Those values indicate the stability of the CT complexes. The formation constant values show that the stability of the PA-ChA complex is higher than that of the PA-DDQ complex.

3.5. Spectroscopic Physical Parameters

3.5.1. Oscillator Strength (f) Transition Dipole Moment (Debye)

As shown in Table 1, relatively high ‘ f ’ values of 0.212 and 0.31 indicate the strong interactions between PA and ChA/DDQ, and therefore, the CT complexes PA-ChA and PA-DDQ have high stability. In addition, the transition dipole moment was recorded as very high (4.82 and 5.62 Debye for PA-ChA and PA-DDQ, respectively), supporting the formation of strong bonded CT complexes between the donor (PA) and acceptors (ChA/DDQ).

3.5.2. Ionization Potential (IP)

Ionization potential (IP) values were recorded at 18.2 eV and 16.6 eV for PA-ChA and PA-DDQ complexes, respectively (Equation (4)). A low Ip value of PA (8.7 eV) [23] compared to the CT complexes indicated its better stability [20]. Therefore, the formation of CT complexes is preferable while PA is reacting with ChA and DDQ.

3.5.3. Energy of the CT Complexes (ECT)

As presented in Table 1, the values of the energy (ECT) of the CT complexes were found to be 2.41 and 2.53 eV for PA-ChA and PA-DDQ, respectively (Equation (5)). These very low ECT values of the CT complexes indicate that the PA-ChA and PA-DDQ complexes’ stability is very high.

3.5.4. Resonance Energy (RN)

The resonance energies (RN) of the CT complexes were found to be 1.2 and 1.11 eV for PA-ChA and PA-DDQ, respectively (Table 1). The lower resonance energies of the CT complexes indicates their higher stability.

3.5.5. Dissociation Energy (W)

Further evidence of the nature of CT interactions of the synthesized CT complexes was found through calculations using Equation (7). The dissociation energy (W) values were found at 14.69 and 12.18 eV for PA-ChA and PA-DDQ, respectively (Table 1). These values indicated that the synthesized complexes have strong CT interactions and, therefore, high stability.

3.5.6. Gibbs Free Energy Change (ΔG°)

As listed in Table 1, the higher negative values suggest that the CT complexes formed between PA and the acceptors are exergonic. Generally, the values of ΔG° become more negative as the value of KCT increases, where the CT interaction between the donor and acceptors becomes strong. Thus, the complex composition is subject to a lower degree of freedom, and the values of ΔG° become higher negative values. The negative value of ΔG° pointed out that the interaction between the donor (PA) and the acceptors (ChA and DDQ) is spontaneous. Their values are −18 and −11 kJmol−1 for PA-ChA and PA-DDQ, respectively.

3.6. Spectroscopy

3.6.1. Infrared (IR) Spectra

IR Spectra of PA-ChA Complex

From the comparison of the FTIR spectra of PA, ChA, and the PA-ChA complex (Figure 5), a characteristic C-Cl band at 571 cm−1 for ChA and 572 cm−1 for PA-ChA was observed, which confirms the complex formation. Furthermore, a red shift of 1664 cm−1 for ChA was observed at 1530 cm−1 for PA-ChA [24]. Other important peaks are summarized in Table 2 [25,26]. It should be noted that the vibrational bands for O-H, C-H, aromatic C=O, and C-O for ChA to PA-ChA have been shifted from 3560 to 3523, 3235 to 3151, 1664 to 1637, and 1207 to 1173, respectively.

IR Spectra of PA-DDQ Complex

As shown in Figure 6, from the comparison of the IR spectra of PA, DDQ, and the PA-DDQ complex, a characteristic C≡N band at 2233 cm−1 for DDQ and 2216 cm−1 for the PA-DDQ complex was observed, which confirms the complex formation [25,26]. Similarly, a red shift of 1674 cm−1 for DDQ was observed at 1481 cm−1 for DDQ-ChA [24,27]. Other important peaks are summarized in Table 3.

3.6.2. NMR Spectra

NMR Spectra of PA-ChA Complex

From the comparison of the proton NMR (1H-NMR) spectra of procainamide (PA) and the PA-Chloranilic acid (PA-ChA) complex (Figure 7), the formation of the PA-ChA complex is confirmed. Aromatic protons in positions 2 and 6 of the PA-ChA complex slightly (0.13 ppm) shifted downfield from 6.52 to 6.65 ppm, and another two aromatic protons in positions 3 and 5 slightly (0.01 ppm) shifted upfield from 7.59 to 7.60 ppm.
On the other hand, as shown in Figure 8, -CH2 protons adjacent to -CONH in the aliphatic region were upfield-shifted (0.04 ppm) from 3.56 to 3.52 ppm, -CH2 protons adjacent to tertiary amine were downfield-shifted (0.06 ppm), and methyl protons (-CH3) were also upfield-shifted (0.02 ppm) (Figure 8). In addition to this, -NH2 peaks were upfield-shifted from 10.29 to 9.10 ppm. These changes in chemical shifts might be due to changes in the structural configuration of the complex formation.

NMR Spectra of PA-DDQ Complex

In the case of the PA-DDQ complex, the chemical shifts of aromatic protons were dramatically downfield-shifted and split into four different chemical shifts. As shown in Figure 9, aromatic protons of PA were given the chemical shifts at 7.60 ppm as a doublet for the protons in positions 3 and 5 and 6.52 ppm as a doublet for the protons in positions 2 and 6; on the other hand, aromatic protons of the PA-DDQ complex were given the chemicals shifts at 7.98, 7.88, 7.45, and 7.20 ppm for the protons in positions 3, 5, 2, and 6, respectively. It should be noted that the protons in positions 3 and 5 were downfield-shifted to 0.38 and 0.28 ppm, and the protons in positions 2 and 6 were downfield-shifted to 0.92 and 0.88 ppm, respectively.
On the other hand, in the aliphatic region, there is little change in chemical shifts, similar to the PA-ChA complex. As shown in Figure 10, -CH2 protons adjacent to -CONH in the aliphatic region were downfield-shifted (0.08 ppm) from 3.56 to 3.64 ppm, -CH2 protons adjacent to tertiary amine were downfield-shifted (0.09 ppm), and in the case of methyl protons (-CH3), they were also downfield-shifted (0.02 ppm). Interestingly, -NH2/-OH peaks were given in 11.01, 10.05, 9.56, 9.00, and 8.89 ppm. These changes in chemical shifts are obviously due to changes in the structural configuration of the complex formation.

3.7. DFT/TD-DFT Calculations

3.7.1. Optimized Geometrical Structures

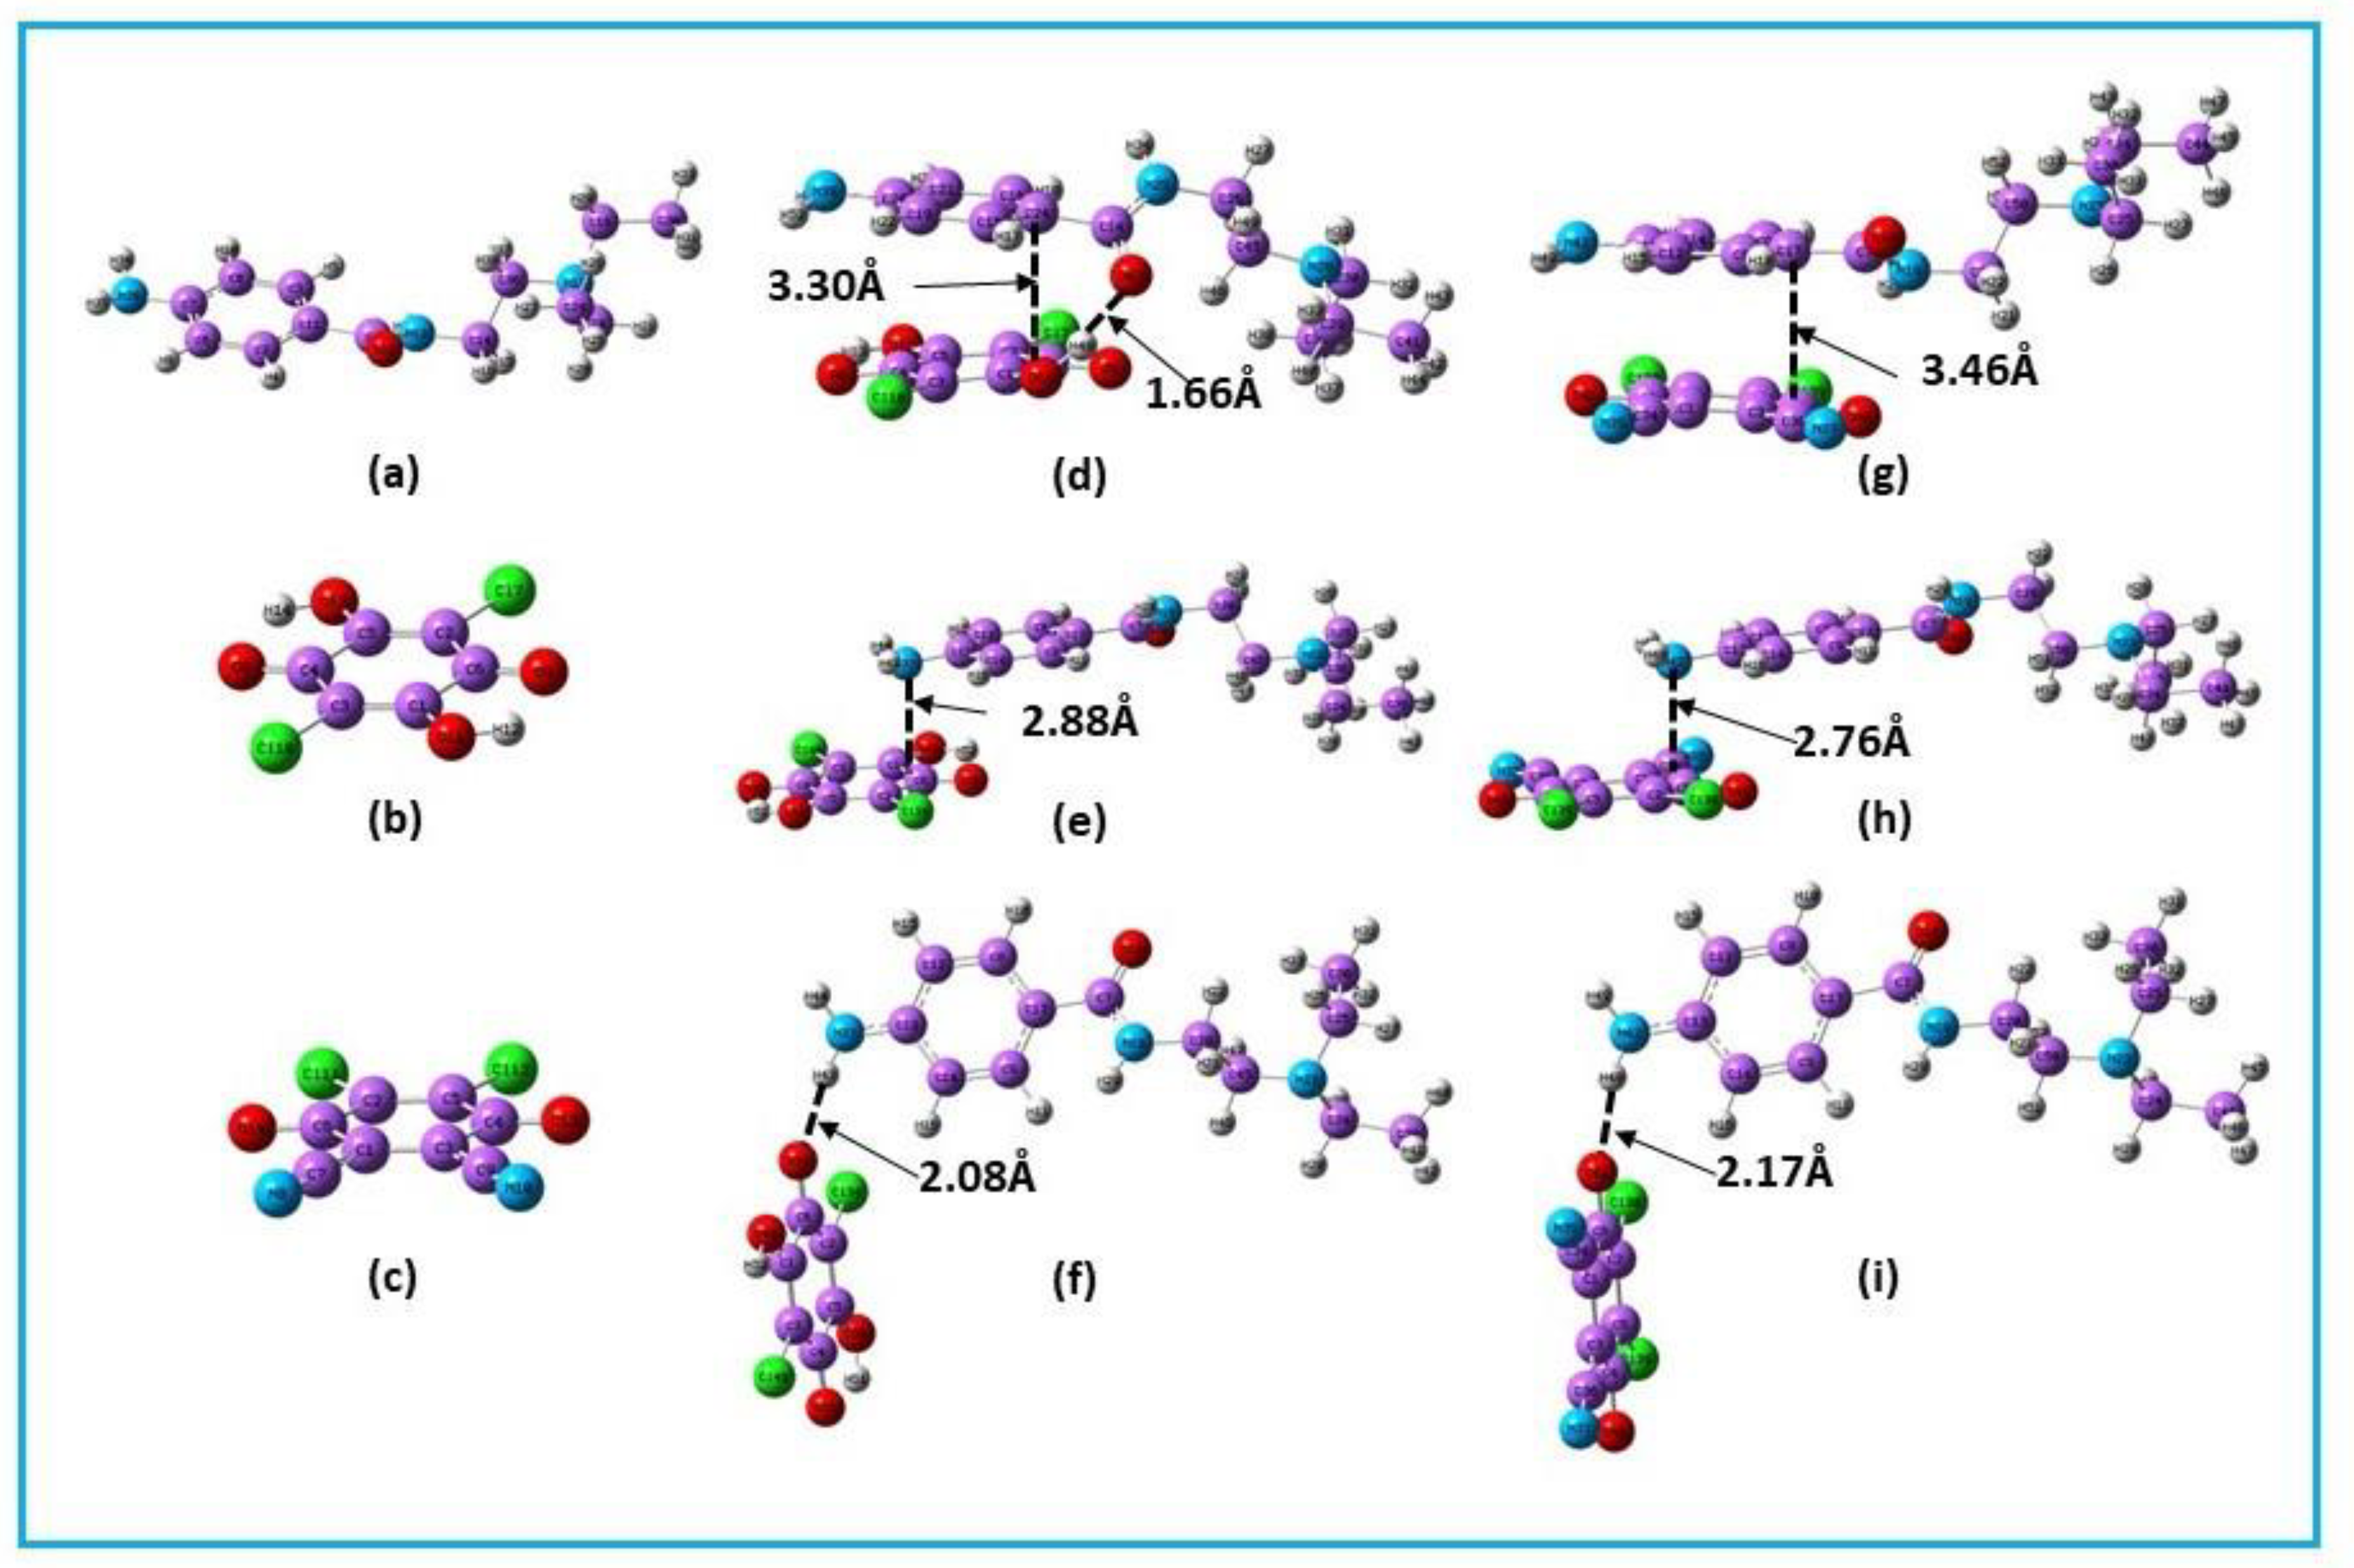
The DFT interaction energy (ΔIE) values were calculated by using Equations (9) and (10) in the acetonitrile solvent system for the hypothetical modeled complexes (Figure 11, and the calculated values are summarized in Table 4.
ΔIEint = E[PA]⊃[DDQ] – (E[PA] + E[DDQ])
ΔIE = E[PA]⊃[ChA] – (E[PA] + E[ChA])
where E[PA]⊃[DDQ] and E[PA]⊃[ChA] represent the electronic energy of the optimized structures of PA-DDQ and PA-ChA complexes, respectively, and E[PA], E[ChA], and E[ChA] represent the optimized energy of free PA, ChA, and DDQ, respectively.
On the other hand, the Gibbs interaction energy (ΔGint) values were obtained by using Equations (11) and (12) in the acetonitrile solvent system.
ΔGint = E[PA]⊃[DDQ] – (G[PA] + G[DDQ])
ΔGint = G[PA]⊃[ChA] – (G[PA] + G[ChA])
where G[PA]⊃[DDQ] and G[PA]⊃[ChA] represent the Gibbs free energy of the optimized molecular complex of PA with DDQ and ChA, respectively, and G[PA] and G[ChA] represent the Gibbs free energy of the optimized free PA and ChA, respectively.
The calculated ΔIE and ΔG values are represented in the following order: face-to-face I fashion > face-to-face II fashion > edge-to-edge fashion. Negative ΔIE and ΔG values correlate with favorable interactions. These results strongly suggest that the π−π* interactions between the two aromatic rings and the hydrogen bond play an important role in the interaction of the PA with ChA and DDQ, in agreement with the findings of others and also strongly supporting the results of our experimental free energies changes (ΔG) ([PA]⊃[ChA] = −4.3 × 10³ and [PA]⊃[DDQ] = −4.08 × 10³ kJ mol−1). The face-to-face I fashion of the PA-ChA and PA-DDQ complexes are thus considered to be stable structures based on the experimental and theoretical findings.

3.7.2. HOMO–LUMO Analysis

The structures were drawn in GaussView 6.0.16 program. The highest occupied molecular orbitals (HOMOs) in which electrons are located and the lowest unoccupied molecular orbitals (LUMOs) were calculated based on the most stable geometry of the complexes. The HOMO of a chemical species is therefore nucleophilic or electron-donating, and the LUMO is electrophilic or electron-accepting. According to Koopmans’ theorem [28], the energy of the HOMO (EHOMO), which is indicative of nucleophilic components, is correlated with the ionization potential’s negative value (IP = −EHOMO).
The energy of the LUMO (ELUMO) is related to the electron affinity’s negative value (EA = −ELUMO) and is a measure of the susceptibility of the molecule or species toward the reaction with nucleophiles. A large HOMO-LUMO gap signifies that the chemical species is extremely stable and has low reactivity. The HOMO-LUMO energy values shown in Table 5 can be used to calculate a number of other significant and valuable quantum chemical properties. These include global hardness (η), global softness (S), electrophilicity index (ω), electronegativity (χ), and chemical potential (μ), all of which give a measure of chemical reactivity. The hardness value (η) is a qualitative indication of its low polarizability and can be computed using Equation (13):
η = [ E LUMO   E HOMO 2 ] = [ IP   EA 2 ]
On the other hand, “soft” molecules are highly polarizable, have modest HOMO-LUMO energy gaps, and can be calculated by using Equation (14):
S = [ 2 E LUMO     E HOMO ] = [ 2 IP EA ] = 1 η

Electronegativity

The ability to attract electrons is a characteristic of a chemical’s electronegativity (χ) and determines how chemically reactive it is, which can be computed using Equation (15):
χ = [ E LUMO   E HOMO 2 ] = [ IP + EA 2 ]

Chemical Potential

The chemical potential (μ) is the ability for an electron to be taken out of a molecule, and it can be determined using Equation (16):
μ = [ E HOMO   E LUMO 2 ] = [ IP +   EA 2 ]

Electrophilicity Index

The electrophilicity index (ω) measures the strength of the electron flow between a donor and an acceptor in a substance’s electron acceptors. The mathematical expression for ω is as follows in Equation (17).
ω = χ 2 2 η = [ ( E HOMO E LUMO 2 ) 2 ( E LUMO   E HOMO ) ] = [ ( IP   + EA 2 ) 2 IP   EA ]  
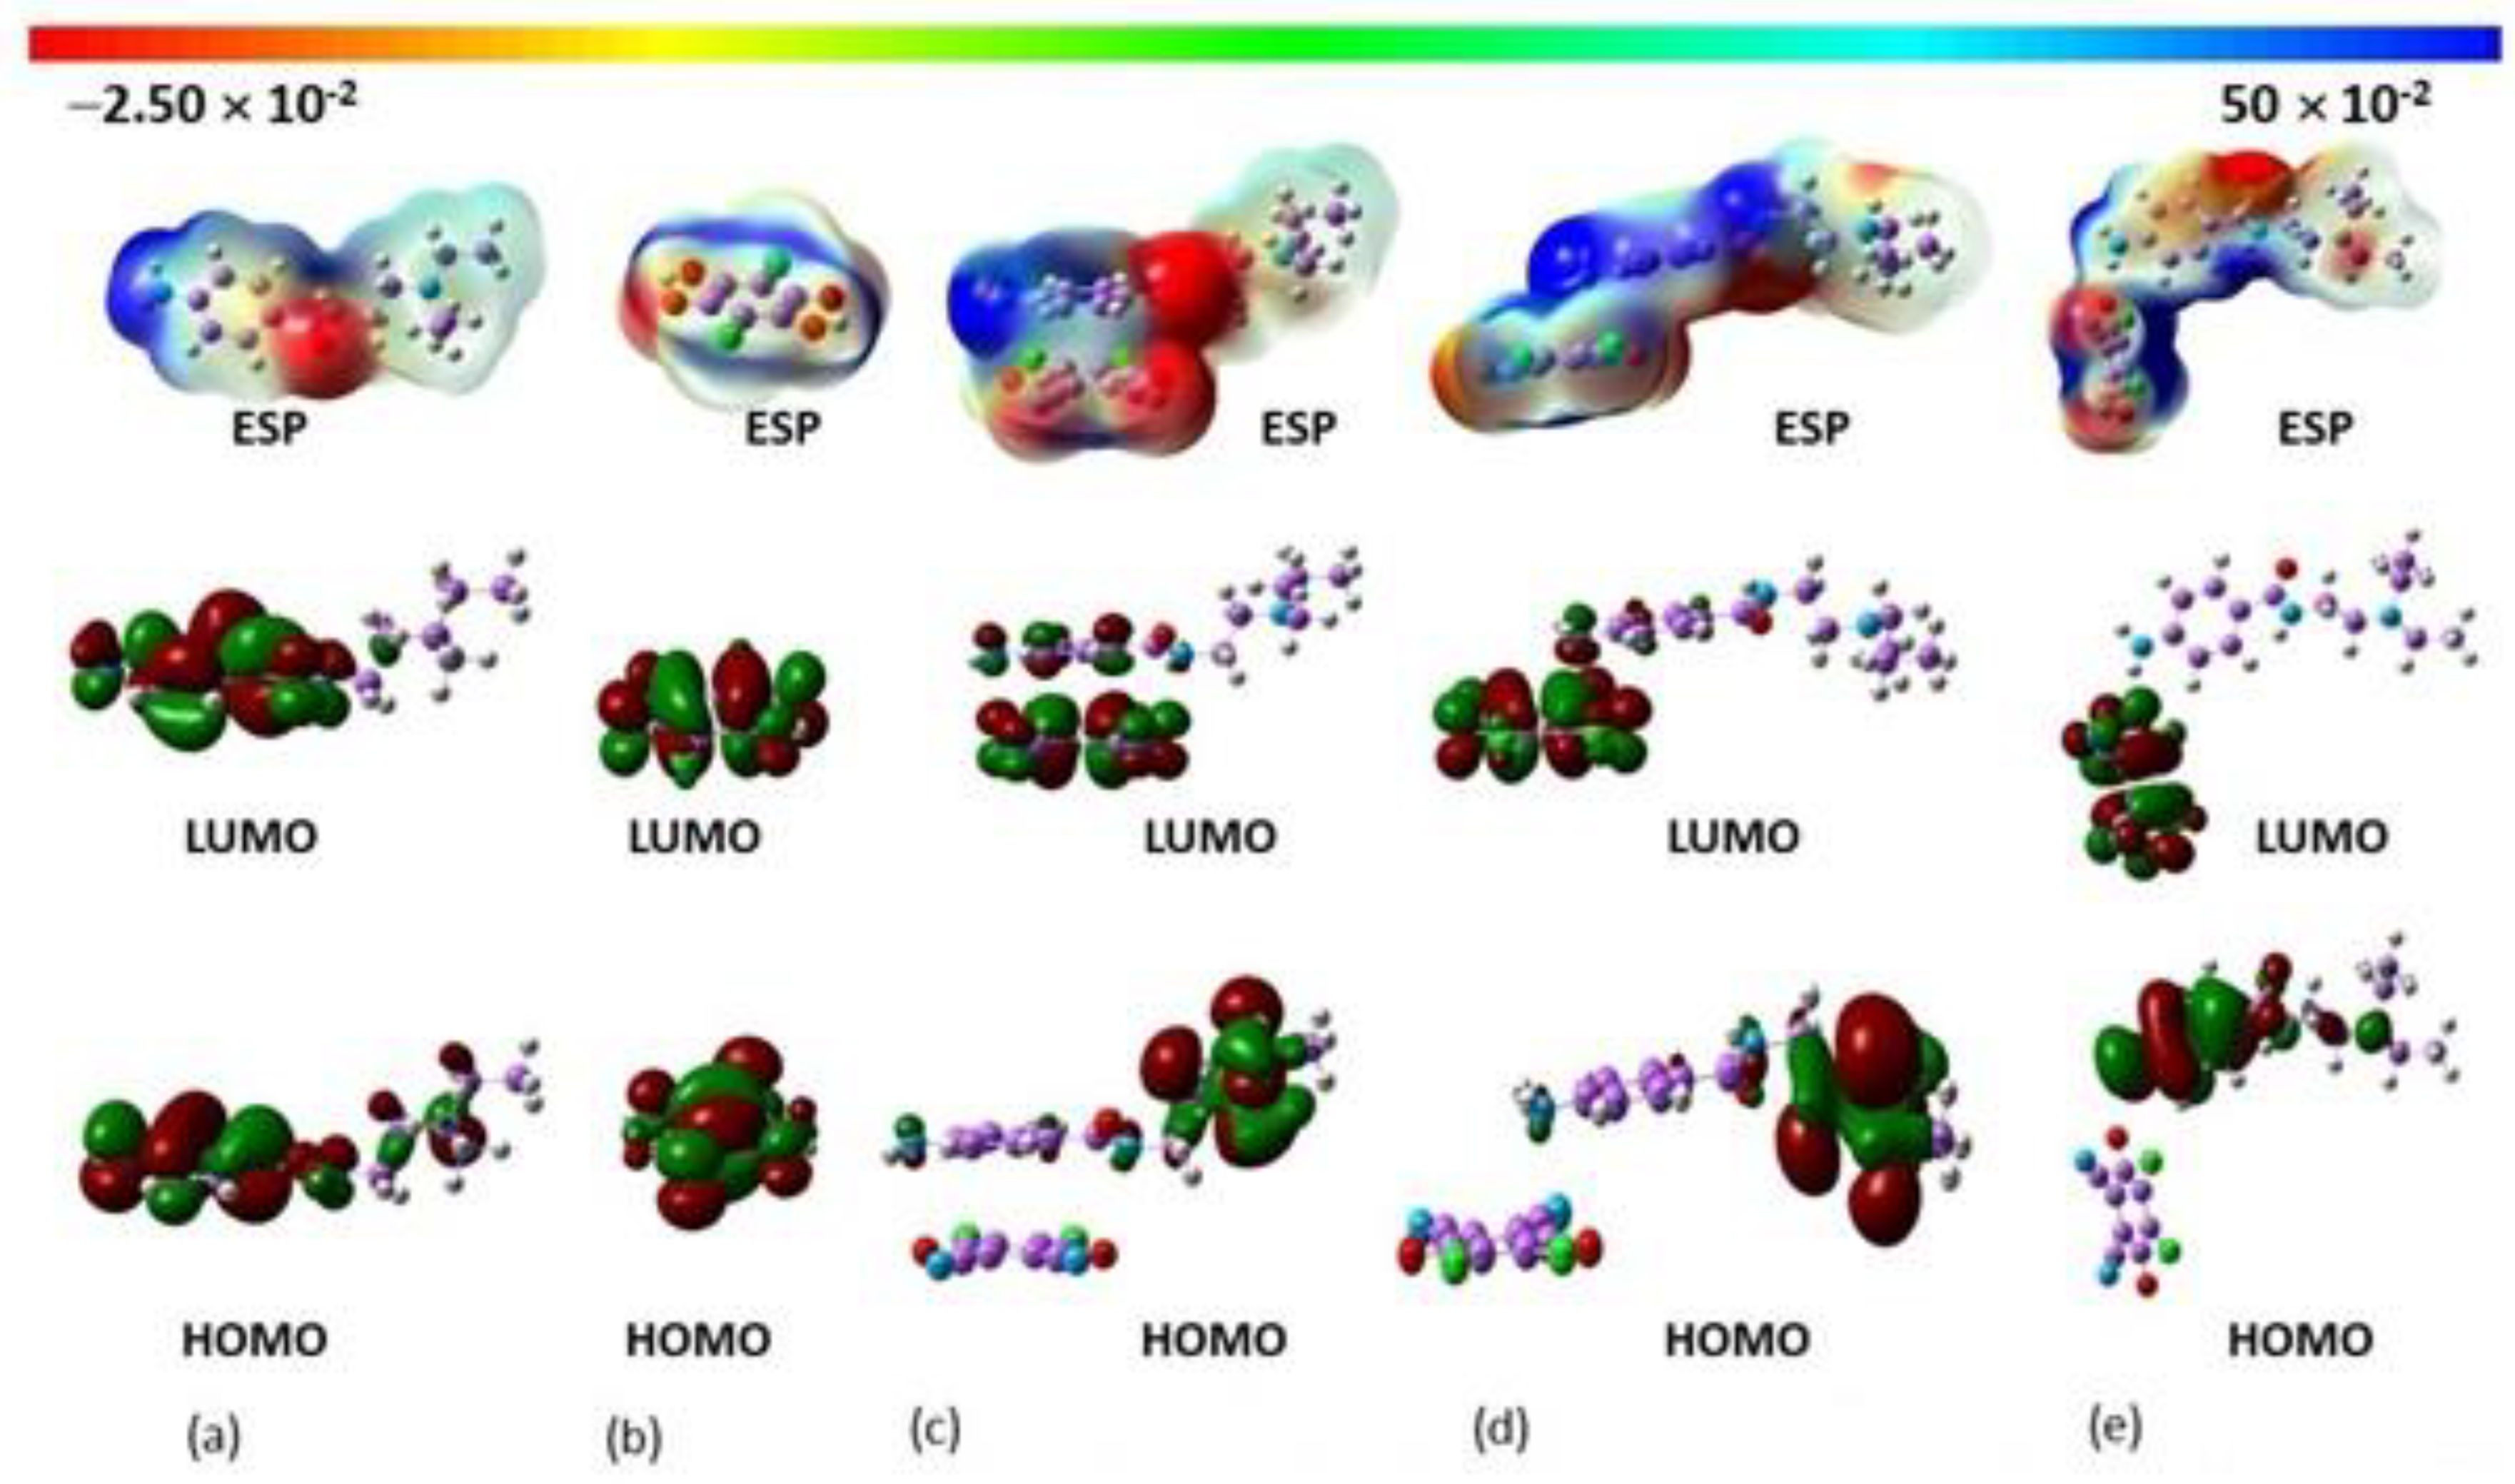
The molecular electrostatic surface potentials [29] of PA, ChA, DDQ, and PA complexes with ChA and DDQ are shown in Figure 12 and Figure 13. The relative polarities and reactive sites of the species-negative ESP are shown in red, and the order of increasing electrostatic potential (i.e., highest negative value) is red > orange > yellow > green > blue. The carbonyl oxygen (-C=O) atom of PA, which is illustrated in red in Figure 12 and Figure 13, has a high electron density and is the preferred site for electrophilic attack and interaction with the nucleophilic partly positive charged hydrogen atoms (blue color). The yellow color indicates the slightly rich electron regions, and the green reflects more neutral zones. The HOMO and LUMO properties and the quantum chemical properties of PA, ChA, DDQ, and PA complexes with ChA and DDQ are summarized in Table 5.
As shown in Table 5, the electronegativity (χ) for ChA is 6.68 eV and for DDQ is 5.52 eV, which indicates that ChA and DDQ have the ability to form CT complexes with PA. In addition, the electrophilicity index (ω) of ChA is 6.37 eV and for DDQ is 6.11 eV, which also suggests the formation of CT complexes with PA. The stability between the PA-ChA and PA-DDQ complexes was measured using their HOMO-LUMO gaps (ΔEgap), and the face-to-face I fashion for PA⊃ChA complex was found to be 6.09 eV, while the Face-to-face II fashion for PA⊃DDQ complex was found to be 5.12 eV.

3.7.3. Theoretical Electronic Absorption Spectra

The predicted electronic spectra of the resultant complexes of PA with ChA and DDQ after being calculated using the first six single-point calculations in the acetonitrile solvent system at the TD-DFT/wB97XD/6-31+G(d,2p) basis set level of theory are shown in Figure 14. The spectra were plotted by applying a Gaussian broadening of 0.333 eV half-width at half height. The theoretical electronic absorption spectra of the donor (PA) and acceptors (ChA/DDQ) as well as synthesized CT complexes (PA-ChA/PA-DDQ) are shown in Figure 14. A strong absorption band at 250 nm was observed for PA, while weak absorption maxima for ChA or DDQ were observed at 291 and 276 nm, respectively. On the other hand, two broad bands at 426 nm (excitation energy of 2.91 eV and oscillator strength of 0.041) and 622 nm (excitation energy of 1.99 eV and oscillator strength of 0.142) were observed for the two new CT complexes PA-ChA and PA-DDQ, respectively, in the acetonitrile solvent system at 298 K.

4. Conclusions

Two new CT complexes (PA-ChA and PA-DDQ) have been synthesized from an electron donor PA and an electron acceptor ChA/DDQ using a simple, easy, and economically inexpensive synthetic method. The formation of the complexes was confirmed by various spectroscopic analysis techniques. The DFT-computed calculation strongly supports our experimental results.

Supplementary Materials

The following data are available online at https://www.mdpi.com/article/10.3390/pr11030711/s1, DFT/TD-DFT calculation files.

Author Contributions

Conceptualization, A.F.M.M.R. and G.A.E.M.; methodology, A.F.M.M.R. and G.A.E.M.; validation, A.F.M.M.R. and G.A.E.M.; formal analysis, A.F.M.M.R., S.R., A.H.B. and G.A.E.M.; investigation, A.F.M.M.R. and G.A.E.M.; resources; A.F.M.M.R., H.A. and G.A.E.M.; Software, S.R. and A.H.B.; data curation, A.F.M.M.R., S.R., A.H.B. and G.A.E.M.; writing—original draft preparation, A.F.M.M.R., S.R., A.H.B. and G.A.E.M.; writing—review and editing, A.F.M.M.R., S.R., A.H.B., H.A. and G.A.E.M.; supervision, A.F.M.M.R. and G.A.E.M.; project administration G.A.E.M.; funding acquisition, H.A. and G.A.E.M. All authors have read and agreed to the published version of the manuscript.

Funding

This research was funded by the Researchers Supporting Project, King Saud University, through grant No. RSP-2023R501.

Institutional Review Board Statement

Not applicable.

Informed Consent Statement

Not applicable.

Data Availability Statement

All the Supporting Data for DFT/TD-DFT calculation can be obtained upon request.

Acknowledgments

The authors extend their appreciation to the Researchers Supporting Project, King Saud University.

Conflicts of Interest

The authors clarify that this study has no competing interest.

References

  1. Mian, M.S.; El-Obeid, H.A.; Al-Badr, A.A. Procainamide Hydrochloride. In Analytical Profiles of Drug Substances and Excipients; Brittain, H.G., Ed.; Academic Press: Cambridge, MA, USA, 2001; Volume 28, pp. 251–332. [Google Scholar]
  2. Zamponi, G.W.; Sui, X.; Codding, P.W.; French, R.J. Dual actions of procainamide on batrachotoxin-activated sodium channels: Open channel block and prevention of inactivation. Biophys. J. 1993, 65, 2324–2334. [Google Scholar] [CrossRef] [Green Version]
  3. Shen, D.; Chen, W.-C.; Lo, M.-F.; Lee, C.-S. Charge-transfer complexes and their applications in optoelectronic devices. Mater. Today Energy 2021, 20, 100644. [Google Scholar] [CrossRef]
  4. Adam, A.M.A. Application of charge-transfer complexation for evaluation of the drug-receptor mechanism of interaction: Spectroscopic and structure morphological properties of procaine and pilocarpine complexes with chloranilic acid acceptor. Russ. J. Gen. Chem. 2014, 84, 1225–1236. [Google Scholar] [CrossRef]
  5. Adam, A.M.A. Nano-structured complexes of reserpine and quinidine drugs with chloranilic acid based on intermolecular H-bond: Spectral and surface morphology studies. Spectrochim. Acta A Mol. Biomol. Spectrosc. 2014, 127, 107–114. [Google Scholar] [CrossRef]
  6. Wang, W.; Luo, L.; Sheng, P.; Zhang, J.; Zhang, Q. Multifunctional Features of Organic Charge-Transfer Complexes: Advances and Perspectives. Chem. A Eur. J. 2021, 27, 464–490. [Google Scholar] [CrossRef]
  7. Zhu, L.; Yi, Y.; Fonari, A.; Corbin, N.S.; Coropceanu, V.; Brédas, J.-L. Electronic Properties of Mixed-Stack Organic Charge-Transfer Crystals. J. Phys. Chem. C 2014, 118, 14150–14156. [Google Scholar] [CrossRef]
  8. McGuire, M.A. Crystal and Magnetic Structures in Layered, Transition Metal Dihalides and Trihalides. Crystals 2017, 7, 121. [Google Scholar] [CrossRef] [Green Version]
  9. Khan, I.M.; Islam, M.; Shakya, S.; Alam, K.; Alam, N.; Shahid, M. Synthesis, characterization, antimicrobial and DNA binding properties of an organic charge transfer complex obtained from pyrazole and chloranilic acid. Bioorganic. Chem. 2020, 99, 103779. [Google Scholar] [CrossRef]
  10. Karmakar, A.; Bandyopadhyay, P.; Mandal, N. Synthesis, spectroscopic, theoretical and antimicrobial studies on molecular charge-transfer complex of 4-(2-thiazolylazo)resorcinol (TAR) with 3, 5-dinitrosalicylic acid, picric acid, and chloranilic acid. J. Mol. Liq. 2019, 299, 112217. [Google Scholar] [CrossRef]
  11. Singh, N.; Khan, I.M.; Ahmad, A.; Javed, S. Synthesis, crystallographic and spectrophotometric studies of charge transfer complex formed between 2,2′-bipyridine and 3,5-dinitrosalicylic acid. J. Mol. Liq. 2014, 191, 142–150. [Google Scholar] [CrossRef]
  12. Refat, M.S.; Saad, H.A.; Adam, A.M. Spectral, thermal and kinetic studies of charge-transfer complexes formed between the highly effective antibiotic drug metronidazole and two types of acceptors: σ- and π-acceptors. Spectrochim. Acta A Mol. Biomol. Spectrosc 2015, 141, 202–210. [Google Scholar] [CrossRef]
  13. Nampally, V.; Palnati, M.K.; Baindla, N.; Varukolu, M.; Gangadhari, S.; Tigulla, P. Charge Transfer Complex between O-Phenylenediamine and 2, 3-Dichloro-5, 6-Dicyano-1, 4-Benzoquinone: Synthesis, Spectrophotometric, Characterization, Computational Analysis, and its Biological Applications. ACS Omega 2022, 7, 16689–16704. [Google Scholar] [CrossRef] [PubMed]
  14. Mulliken, R.S. Structures of Complexes Formed by Halogen Molecules with Aromatic and with Oxygenated Solvents1. J. Am. Chem. Soc. 1950, 72, 600–608. [Google Scholar] [CrossRef]
  15. Mulliken, R.S. Molecular Compounds and their Spectra. III. The Interaction of Electron Donors and Acceptors. J. Phys. Chem. 1952, 56, 801–822. [Google Scholar] [CrossRef]
  16. Alanazi, A.; Abounassif, M.; Alrabiah, H.; Mostafa, G. Development of two charge transfer complex spectrophotometric methods for determination of tofisopam in tablet dosage form. Trop. J. Pharm. Res. 2016, 15, 995. [Google Scholar] [CrossRef] [Green Version]
  17. Refat, M.S.; El-Korashy, S.A.; El-Deen, I.M.; El-Sayed, S.M. Experimental and spectroscopic studies of charge transfer reaction between sulfasalazine antibiotic drug with different types of acceptors. Drug Test Anal. 2011, 3, 116–131. [Google Scholar] [CrossRef]
  18. Adam, A.M.A.; Refat, M.S.; Hegab, M.S.; Saad, H.A. Spectrophotometric and thermodynamic studies on the 1:1 charge transfer interaction of several clinically important drugs with tetracyanoethylene in solution-state: Part one. J. Mol. Liq. 2016, 224, 311–321. [Google Scholar] [CrossRef]
  19. Khan, I.M.; Shakya, S.; Islam, M.; Khan, S.; Najnin, H. Synthesis and spectrophotometric studies of CT complex between 1,2-dimethylimidazole and picric acid in different polar solvents: Exploring antimicrobial activities and molecular (DNA) docking. Phys. Chem. Liq. 2021, 59, 753–769. [Google Scholar] [CrossRef]
  20. Aloisi, G.G.; Pignataro, S. Molecular complexes of substituted thiophens with σ and π acceptors. Charge transfer spectra and ionization potentials of the donors. J. Chem. Soc. Faraday Trans. 1 Phys. Chem. Condens. Phases 1973, 69, 534–539. [Google Scholar] [CrossRef]
  21. Briegleb, G.; Czekalla, J. Die Intensität von Elektronenüberführungsbanden in Elektronen-Donator-Akzeptor-Komplexen1. Z. Für Phys. Chem. 1960, 24, 37–54. [Google Scholar] [CrossRef]
  22. Frisch, M.J.; Trucks, G.W.; Schlegel, H.B.; Scuseria, G.E.; Robb, M.A.; Cheeseman, J.R.; Scalmani, G.; Barone, V.; Mennucci, B.; Petersson, G.A.; et al. Gaussian 16, Revision C.01; Gaussian, Inc.: Wallingford, CT, USA, 2019. [Google Scholar]
  23. Siraki, A.G.; Deterding, L.J.; Bonini, M.G.; Jiang, J.; Ehrenshaft, M.; Tomer, K.B.; Mason, R.P. Procainamide, but not N-Acetylprocainamide, Induces Protein Free Radical Formation on Myeloperoxidase: A Potential Mechanism of Agranulocytosis. Chem. Res. Toxicol. 2008, 21, 1143–1153. [Google Scholar] [CrossRef] [PubMed] [Green Version]
  24. Ranzieri, P.; Masino, M.; Girlando, A. Charge-Sensitive Vibrations in p-Chloranil:  The Strange Case of the CC Antisymmetric Stretching. J. Phys. Chem. B 2007, 111, 12844–12848. [Google Scholar] [CrossRef] [PubMed]
  25. IR Spectroscopy Tutorial: Alkyl Halides. Available online: https://orgchemboulder.com/Spectroscopy/irtutor/alkhalidesir.shtml (accessed on 17 October 2022).
  26. IR Spectrum Table & Chart. 2022. Available online: https://www.sigmaaldrich.com/SA/en/technical-documents/technical-article/analytical-chemistry/photometry-and-reflectometry/ir-spectrum-table (accessed on 17 October 2022).
  27. Fukui, K.-i.; Yonezawa, T.; Shingu, H. A Molecular Orbital Theory of Reactivity in Aromatic Hydrocarbons. J. Chem. Phys. 1952, 20, 722–725. [Google Scholar] [CrossRef]
  28. Luo, J.; Xue, Z.Q.; Liu, W.M.; Wu, J.L.; Yang, Z.Q. Koopmans’ Theorem for Large Molecular Systems within Density Functional Theory. J. Phys. Chem. A 2006, 110, 12005–12009. [Google Scholar] [CrossRef] [PubMed]
  29. Murray, J.S.; Politzer, P. The electrostatic potential: An overview. WIREs Comput. Mol. Sci. 2011, 1, 153–163. [Google Scholar] [CrossRef]
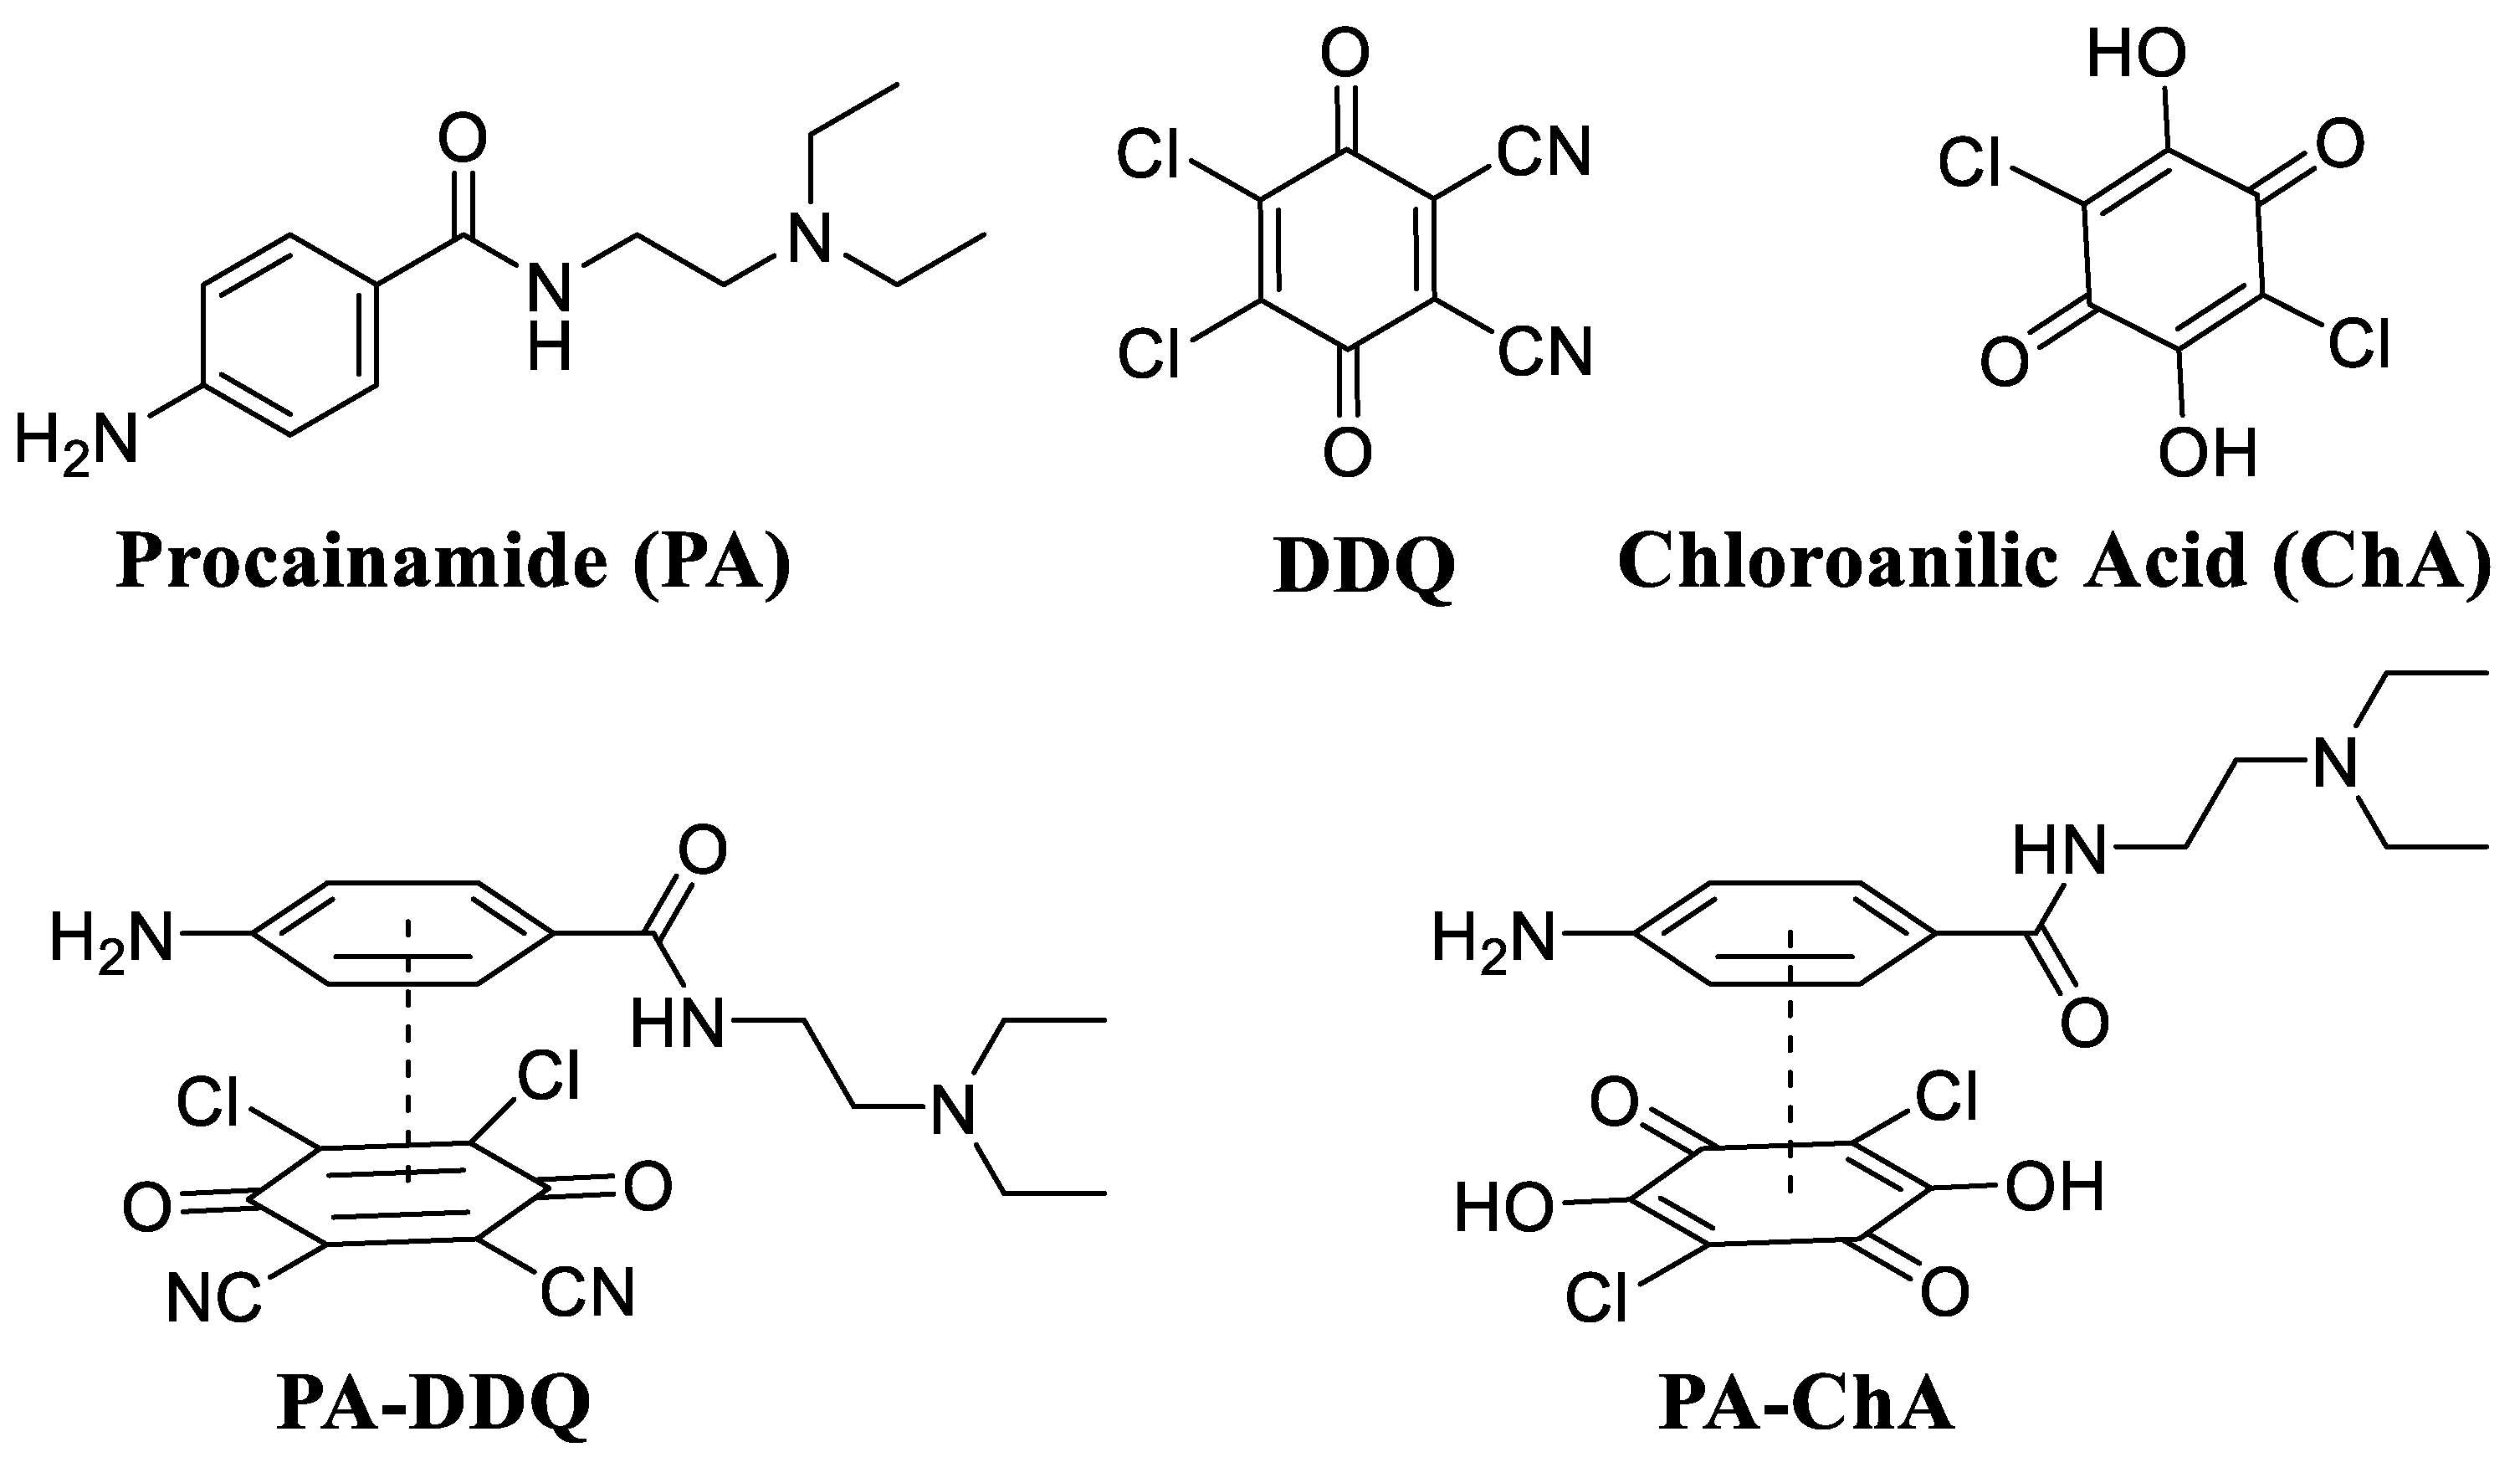
Figure 1. Chemical structures of procainamide and its complexes.
Processes 11 00711 g001
Scheme 1. Synthesis of CT complexes PA-ChA and PA-DDQ.
Processes 11 00711 sch001
Figure 2. Absorption curve of CT complex: (A) absorption maximum of PA, ChA, and DDQ; (B) absorption maximum of PA-ChA and PA-DDQ complexes; and (C) expanded spectra shown at 400–650 nm for PA-ChA and PA-DDQ complexes (all spectra were taken in acetonitrile).
Processes 11 00711 g002
Figure 3. Spectrophotometric titration curves of A PA-ChA and B PA-DDQ CT complexes in acetonitrile at the detectable peaks (donor and acceptor, 1 × 10⁻³ M).
Processes 11 00711 g003
Figure 4. The 1:1 Benesi–Hildebrand plot of procainamide CT complexes at detectable peaks: (A) for PA-ChA and (B) PA-DDQ.
Processes 11 00711 g004
Figure 5. Comparison of IR spectra of procainamide (PA), chloranilic acid (ChA), and PA-ChA complex: (A) whole spectra; (B) showing the characteristic C-Cl band of ChA and PA-ChA complex.
Processes 11 00711 g005
Figure 6. Comparison of IR spectra of PA, DDQ, and PA-DDQ complex: (A) whole spectra; (B) showing the characteristic -C≡N band of DDQ and PA-DDQ complex.
Processes 11 00711 g006
Figure 7. Comparison of proton-NMR (1H-NMR) spectra of Procainamide and Procainamide-ChA complex: (A) aromatic region of Procainamide-ChA complex; (B) aromatic region of Procainamide (PA).
Processes 11 00711 g007
Figure 8. Comparison of proton-NMR (1H-NMR) spectra of PA and PA-ChA complex: (A) aliphatic region of PA-ChA complex; (B) aliphatic region of PA.
Processes 11 00711 g008
Figure 9. Comparison of proton-NMR (1H-NMR) spectra of PA and PA-DDQ complex. (A) aromatic region of PA-DDQ complex; (B) aromatic region of PA.
Processes 11 00711 g009
Figure 10. Comparison of proton-NMR (1H-NMR) spectra of PA and PA-DDQ complex. (A) Aliphatic region of PA-DDQ complex; (B) aliphatic region of PA.
Processes 11 00711 g010
Figure 11. Optimized structures of PA, ChA, DDQ, and their complexes: (a) PA; (b) ChA; (c) DDQ; (d) face-to-face I fashion complex of PA with ChA; (e) face-to-face II fashion complex of PA complex with ChA; (f) edge-to-edge fashion complex of PA with ChA; (g) face-to-face I fashion complex of PA with DDQ; (h) face-to-face II fashion complex of PA complex with DDQ; and (i) edge-to-edge fashion complex of PA with DDQ at the ωB97XD/6-311++G(2d,p) level of theory in acetonitrile solvent system. Close nonbonded contact distances are highlighted in Å.
Processes 11 00711 g011
Figure 12. Molecular electrostatic potential (MEP) maps of HOMO and LUMO structures of PA, ChA, and their 1:1 complex: (a) PA; (b) ChA; (c) face-to-face I fashion complex of PA with ChA; (d) face-to-face II fashion complex of PA complex with ChA; and (e) edge-to-edge fashion complex of PA with ChA at the ωB97XD/6-311++G(2d,p) level of theory in acetonitrile solvent system.
Processes 11 00711 g012
Figure 13. Molecular electrostatic potential (MEP) maps of HOMO and LUMO structures of PA, DDQ, and their 1:1 complex: (a) PA; (b) DDQ; (c) face-to-face I fashion complex of PA with DDQ; (d) face-to-face II fashion complex of PA complex with DDQ; and (e) edge-to-edge fashion complex of PA with DDQ at the ωB97XD/6-311++G(2d,p) level of theory in acetonitrile solvent system.
Processes 11 00711 g013
Figure 14. DFT calculated UV-Vis spectra of PA, ChA, DDQ, and their complexes: (A) PA; (B) ChA; (C) DDQ; (D) face-to-face I fashion complex of PA with ChA; and (E) face-to-face I fashion complex of PA complex with DDQ at the ωB97XD/6-311++G(2d,p) level of theory in acetonitrile solvent system.
Processes 11 00711 g014
Table 1. Spectroscopic characteristics of procainamide CT complexes.
Parameters PA-ChAPA-DDQ
Wavelength, nm515490
Molar absorptivity (ε), L mol−1 cm−10.6 × 1031 × 103
Formation constant K = L mol−1 1.4 × 1030.1 × 103
Oscillator strength (f)0.2120.31
Transition dipole moment (Debye)4.825.65
Ionization potential: IP (eV)18.216.61
Energy: hv (eV)2.412.53
Resonance energy: RN (eV)1.21.11
Dissociation energy: W(eV)14.6912.18
Gibbs free energy: ΔG (kJ mol−1)−18 kJ mol−1−11 kJ mol−1
Table 2. IR spectral bands of PA, ChA, and their complex (PA-ChA).
PAChAPA-ChA ComplexPossible Assignments
340235603523ν(O-H)
3440ν(N-H)
3320 3270ν(CONH)
321532353151ν(C-H) (aromatic)
2938 3002
2576 2715ν(+N-H)
2670
2600
2465 2529ν(+N-H)
163716641637ν(C=O)
159916311576
1542 1530ν(C=C) (aromatic ring)
1512 1500
1467 1436ν(C-H) (alkanes)
139213691381ν(C-C) (alkanes)
1323 1344ν(C-C), ν(C-N) (alkanes)
129512641288ν(C-N) (alkanes)
118512071173ν(C-O)
1145 1124ν(C-H) (bending)
1027 1030ν(NH)
964983982ν(C-H) (bending)
839854875
806 839
768752777
702690753ν(N-H)
652 653ν(C-N-C)
572571ν(C-Cl)
Table 3. IR spectral bands of PA, DDQ, and their complex (PA-DDQ).
ProcainamideDDQPA-DDQ ComplexPossible Assignments
340234303430ν(N-H)
3320 3248ν(O-H)
3215 2987ν(C-H) (aromatic)
2938 2944ν(O-H)
2576 2581ν(+N-H)
2465 2471ν(+N-H)
22322217ν(CN)
163716741653ν(CO)
1599 1610ν(N-H)
154215541562ν(C=C) (aromatic ring)
1512 1507
1467 1482
1392 1407
1323 1320ν(C-C), ν(C-O) (alkanes)
129512691246ν(C-N) (alkanes)
118511731178ν(C-O) (alkanes)
1145 1145ν(C-N) (alkanes)
1027 1018ν(NH)
964 961ν(C-H) (alkanes)
840897892
806801867
768 757ν(N-H)
702722680ν(C-N-C)
652 625
Table 4. DFT-calculated electronic binding interaction energies (ΔIE kJ/mole) and ΔG (kJ/mole) for the PA complex with ChA and DDQ compounds at the ωB97XD/6-311++G(d,2p) level of theory in acetonitrile solvent.
Complexation ModeInteraction Energy ΔIE (kJ mol−1)Gibbs Interaction Energy
ΔG (kJ mol−1)
Face-to-face I fashion for PA⊃ChA−64.21−7.70
Face-to-face II fashion for PA⊃ChA−56.9018.05
Edge-to-edge fashion for PA⊃ChA−30.0839.89
Face-to-face I fashion for PA⊃DDQ−61.40−3.03
Face-to-face II fashion for PA⊃DDQ−55.9014.74
Edge-to-edge fashion for PA⊃DDQ−30.5532.36
Table 5. HOMO-LUMO gap (ΔEgap), ionization potential (IP), electron affinity (EA), electronegativity (χ), chemical potential (μ), hardness (η), softness (S), electrophilicity index (ω), dipole moments (dm), and polarizability (α) of the PA, ChA, DDQ, and their complexes at the ωB97XD/6−311++G(d,2p) level of theory in acetonitrile solvent.
EHOMO
(eV)
ELUMO
(eV)
ΔEgap
(eV)
IP
(eV)
EA
(eV)
χ
(eV)
μ
(eV)
η
(eV)
S
(eV)
ω
(eV)
dm
(Debye)
Polarizability
(α)
PA−7.97−0.817.167.970.814.39−4.393.580.282.705.58248.81
ChA−10.18−3.187.0010.183.186.68−6.683.500.296.370.01151.11
DDQ−8.02−3.034.998.023.035.52−5.522.500.406.1110.27463.23
Face-to-face I fashion for PA⊃ChA complex−8.04−1.956.098.041.954.99−4.993.040.334.106.58408.18
Face-to-face II fashion for PA⊃ChA complex−8.05−2.016.048.052.015.03−5.033.020.334.185.75418.10
Edge-to-edge fashion for PA⊃ChA complex−7.86−2.215.657.862.215.03−5.032.830.354.4810.13403.93
Face-to-face I fashion for PA⊃DDQ complex−8.08−3.065.028.083.065.57−5.572.510.406.1810.56467.96
Face-to-face II fashion for PA⊃DDQ complex−8.08−2.965.128.082.965.52−5.522.560.395.9410.35465.30
Edge-to-edge fashion for PA⊃DDQ complex−7.91−3.264.667.913.265.59−5.592.330.436.706.05431.41
Disclaimer/Publisher’s Note: The statements, opinions and data contained in all publications are solely those of the individual author(s) and contributor(s) and not of MDPI and/or the editor(s). MDPI and/or the editor(s) disclaim responsibility for any injury to people or property resulting from any ideas, methods, instructions or products referred to in the content.