Article

Approach towards a Quality Assurance System for Wire and Arc Additive Manufacturing

Institute for Machine Tools and Industrial Management, Department of Mechanical Engineering, TUM School of Engineering and Design, Technical University of Munich, Boltzmannstrasse 15, 85748 Garching, Germany
*
Author to whom correspondence should be addressed.
Processes 2023, 11(2), 612; https://doi.org/10.3390/pr11020612
Submission received: 1 February 2023 / Revised: 14 February 2023 / Accepted: 15 February 2023 / Published: 17 February 2023
(This article belongs to the Special Issue Manufacturing and Processing of Alloys)

Abstract

:
Wire and Arc Additive Manufacturing (WAAM) of Ti-6Al-4V is becoming increasingly important in the aerospace industry for the production of large parts. Due to the high welding requirements of the material, high quality demands are placed on the process. To meet these high demands, quality assurance measures are applied to maintain mechanical and geometrical part properties. First, the interlayer temperatures that are applied influence the final geometry. The part must meet geometric accuracies in order to be machined after the WAAM process. Second, Ti-6Al-4V materials have a high affinity to absorb oxygen from the environment at elevated temperatures. This oxygen uptake results in a discoloration of the surface and an embrittlement of the material. Therefore, a defined and monitored oxygen content in the build chamber is crucial. This work presents an approach to determine limitations for the interlayer temperature of the part and the oxygen content in the build chamber. The influence of a temperature deviating from the set interlayer temperature on the layer width was analyzed. By varying the interlayer temperature, the layer width varied by up to 3 mm. It was shown that different restrictions for the oxygen content in the build chamber apply depending on the part size.

1. Introduction

The increasing use of difficult-to-machine materials in the aerospace industry results in challenges in the manufacturing of structural parts [1]. Currently, large-volume structural parts are machined from solids, resulting in low material utilization rates and significant tooling costs [2]. Additive Manufacturing (AM) processes are becoming increasingly important as they offer a great potential for reducing manufacturing costs by producing near-net-shaped parts. Wire and Arc Additive Manufacturing (WAAM), one of the AM processes standardized by the DIN EN ISO 52900, is characterized by high build-up rates, a low-cost feedstock, and the scalability of the process to any size of the build chamber [2]. Geometrical complex parts can be defined by the constructive solid geometry (CSG) method [3]. The CSG method helps to reduce the complexity of parts by defining smaller and different-sized volume primitives. These volume primitives must be manufactured first to generate the fundamental process understanding and achieve high-quality parts [4]. However, the high quality requirements posed in aerospace have made the transition to the industrial production process challenging [2].
The heat source in WAAM is an electric arc, making a temperature management during the thermal-based process highly important. Weld seams are deposited layer-by-layer using a solid wire as feedstock material, resulting in three-dimensional parts. The WAAM part must reach geometrical accuracies in order to be properly machined consecutively to the final shape [5].
Titanium alloys have a high affinity to absorb oxygen at high temperatures [6] resulting in surface discolorations [7]. Thus, this grade of discoloration is an indicator of the degree of the oxygen contamination [7]. Discolorations of the titanium material resulting from the welding process are inadmissible in the aerospace industry (DIN 29595).
In this work, the high demands placed on the process and the part are addressed by applying and analyzing two quality assurance measures: monitoring and controlling the interlayer temperature of the part and the oxygen content in the build chamber.
Martina et al. [8] observed that the heat input during the WAAM process influences the wall width and the layer height using Ti-6Al-4V material. The correlation between increasing part heights resulting in decreasing temperature gradients between the melt pool and the part was shown by Zhao et al. [9]. Yang et al. [10] captured the interlayer temperature in higher layers when welding steel walls. The temperature gradient increased with higher dwell times between the welding of the individual layers. The authors stated that the geometric part quality increased when holding the dwell time within a defined range. Da Silva et al. [11] demonstrated an active cooling system to mitigate the heat accumulation in the part during WAAM. Manufactured walls showed a more uniform geometry by controlling the heat balance of parts made of aluminum. Wang et al. [12] used Inconel 625 as feedstock material and observed that the size of the melt pool increased in higher layers. The influence of the interlayer temperature on the width and height of a single weld bead on the substrate plate was analyzed by Wang et al. [13] using steel material. Baier et al. [14] investigated the correlation between different dwell times and interlayer temperatures, influencing the geometric properties of the part made of Ti-6Al-4V. Short dwell times resulted in increased interlayer temperatures, while deviating interlayer temperatures led to geometric deviations of the part. A moderate and constant interlayer temperature of 300 °C resulted in a stable process without severe spattering. Furthermore, the part geometry was more uniform with an interlayer temperature of 300 °C.
Besides the negative effects of the interlayer temperatures on the part accuracy, discoloration by oxidation can occur. The oxygen absorption of titanium alloys at higher temperatures increases the hardness, but it significantly reduces the ductility of the material [15]. Thus the oxygen uptake could lead to surface cracks [15]. The color sequences of Ti-6Al-4V range from silver (no discoloration) to the following colors with an increasing oxygen contamination: light straw, dark straw, purple, blue, gray, and white [7,16]. Caballero et al. [17] investigated the effect of oxidation of Ti-6Al-4V material during the WAAM process. The temperature of the part and the time during which the temperature of the part was held significantly influenced the oxidation. They found that an oxygen content of 40 ppm in the build chamber in combination with a short dwell time between the layers during manufacturing and a small part size led to a strong discoloration of the part. The influence of varying interlayer temperatures on the discoloration was analyzed by Wu et al. [18]. Artaza et al. [19] kept the oxygen content in the build chamber under the value of 100 ppm. They showed that higher interlayer temperatures result in more severe discolorations. When Elmer and Gibbs [20] manufactured parts without a sufficient inert gas atmosphere, the formation of spatters increased. Bermingham et al. [21] and Ding et al. [22] described that the quality of the wire as feedstock material has an additional effect on the oxygen uptake of the part.
The presented state of research shows that the interlayer temperature is an important process parameter in WAAM that needs further investigation. It is yet unknown how varying interlayer temperatures within a part influence the geometry of individual layers. Furthermore, it can be concluded that studies were conducted regarding the cause-effect relationship between the process parameters and the discoloration of Ti-6Al-4V material in WAAM. However, the influence of different oxygen contents in the build chamber on the discoloration of different-sized parts has not yet been part of investigations.
To qualify and certify WAAM for aerospace applications, a comprehensive understanding of the process parameters, their limitations, and their effects on the part quality is necessary. The implementation of a suitable quality assurance system is, therefore, crucial. This work presents an approach for determining the influence of deviating interlayer temperatures on the layer width of a wall. First, a sensitivity analysis of the interlayer temperature with its influence on the layer width of a wall is shown. An experimental pre-study was performed, which helped to plan the sensitivity analysis and the statistically designed experiment. Second, different wall sizes were manufactured with varying oxygen contents in the build chamber. Finally, the dependencies between the oxygen content, the part size and the resulting discoloration were determined and discussed.

2. Methodology

2.1. Sensitivity Analysis of the Interlayer Temperature

The following investigations served as an extension of previous studies found in the literature. Interlayer temperatures influence the geometric properties of the part [8,13,14]. Therefore, deviating interlayer temperatures within a part result in varying widths of individual layers. This correlation is crucial for the manufacturing process regarding geometric part properties and production times, since unexpected pauses (e.g., caused by maintenance and the exchange of worn-out parts in the WAAM machine) can cause the interlayer temperatures to deviate.
In this work, two experimental investigations were conducted. The first investigation was an experimental pre-study. This pre-study aimed to qualitatively determine the influence of increasing interlayer temperatures on the geometrical accuracy. Therefore, parts were manufactured with parameters leading to a short dwell time. The resulting walls were compared to the shape of walls manufactured with a constant interlayer temperature.
The results from the experimental pre-study served as the input for the sensitivity analysis. An experimental plan was elaborated to quantitatively analyze the influences of decreasing and increasing interlayer temperatures on individual layer widths.

2.1.1. Experimental Pre-Study

Two different welding strategies were applied to manufacture the walls. The first strategy was defined as a process triggered by the dwell time. A constant dwell time of t dwell = 50   s was set between each layer before welding the subsequent layer. This value of t dwell was chosen as it was shown in the literature that short dwell times lead to a deviating overall part geometry [14]. The second strategy was defined as a process triggered by the interlayer temperature. An interlayer temperature of T Interlayer = 300   ° C was set as the trigger temperature. The value of T Interlayer was applied, as Baier et al. [14] showed that this value leads to a uniform total part geometry. After depositing a layer, the interlayer temperature of the part was measured. When the layer (layer n) had cooled down to an interlayer temperature of 300 °C, the next layer (layer n + 1) was welded subsequently (see Figure 1).
The manufactured walls were cut in half in the x-z plane, allowing the comparison of the shape of the walls qualitatively. The results from the experimental pre-study helped to define the interlayer temperatures in the experimental plan for performing the sensitivity study.

2.1.2. Experimental Plan

The influence of deviating interlayer temperatures T Interlayer on the layer width w layer within the wall can be determined by varying the interlayer temperature in individual layers.
The first three layers were welded with an interlayer temperature of 300 °C. The fourth layer (layer n+1) was deposited with the following interlayer temperatures: 25 °C, 75 °C, 150 °C, 225 °C, 300 °C, 375 °C, 450 °C, 525 °C, and 600 °C. The subsequent three layers were welded with an interlayer temperature of 300 °C. In total, nine different walls were manufactured with three executions each.
The manufactured walls were measured by a 3D digitizer (Comet L3D 2M from Steinbichler, Neubeuern, Germany) to analyze the influence of varying interlayer temperatures on the measured layer widths w layer , meas . The Standard Tessellation Language files were imported in a Computer Aided Design software (Fusion 360 from Autodesk Inc., San Francisco, CA, USA). The digitized wall was cut in the x-z plane in the center of the wall along the y direction (see Figure 2). The width of the fourth layer (layer n + 1) was determined at the maximum distance between the outer contours of the layer (see Figure 2). The measured layer widths were finally correlated with the systematically set interlayer temperatures using a regression analysis.

2.2. Determining Limitations for the Oxygen Content

The influences of the oxygen content in the build chamber and of different part sizes on the discoloration of the surface of the part were investigated.
In this work, three different wall sizes were manufactured with three executions each. Different heights were generated by varying the number of layers: 4, 8, and 12 layers. A constant interlayer temperature of 300 °C was applied to every layer, resulting in walls with a width of approx. 15 mm. The welding enclosure was filled with an inert gas, reducing the oxygen content in the process zone. The first layer was welded after the upper limit of the oxygen content was reached. The three different oxygen limits were 25 ppm, 50 ppm, and 100 ppm. The process gas flow was controlled manually at the machine for the individual parts to avoid an oxygen content exceeding the oxygen limits.
The discoloration is linked to the exposure time of the surface to the oxygen content at elevated temperatures [17]. This exposure time was also determined by capturing the time of manufacturing.
To analyze the discoloration, the wall surfaces were initially inspected visually. Pictures were taken of all walls to compare the degrees of discoloration. Second, these pictures were analyzed quantitatively by comparing the histograms of the red, green, and blue (RGB) values of every picture using a numeric computing software (MATLAB from The MathWorks, Inc., Natick, MA, USA). RGB values reflect the color metric of an image and range from 0 to 255. The RGB values 0, 0, 0 describe the color black [23]. Vice versa, the RGB values 255, 255, 255 describe the color white [23]. Figure 3 shows an exemplary histogram of the RGB values of a WAAM-manufactured wall. Additionally, the median was determined and plotted for each RGB value. The median indicates the 50th percentile [24]. Surface plots of the medians were created subsequently to analyze all manufactured walls and enable an interpretation of the correlation between the RGB values and the discolorations.

3. Materials and Experimental Setup

Figure 4 shows the experimental setup used in this study. The welding power source (CMT Advanced 4000 R from Fronius International GmbH, Wels, Austria) was connected to a welding torch. An industrial robot (KR15/2 from Kuka AG, Augsburg, Germany) moved the welding torch. A thermographic camera (VarioCAM® hr head from InfraTec GmbH, Dresden, Germany) was used for the measurement of the interlayer temperature. A welding enclosure (from Huntingdon Fusion Techniques HFT, Burry Port, United Kingdom) was filled with Argon 4.6 (from Linde AG, Pullach, Germany) as the shielding gas. The oxygen concentration was measured in the center of the welding enclosure by an oxygen measuring device (SGM7 oxygen sensor from ZIROX Sensoren und Elektronik GmbH, Greifswald, Germany). A protective window (from Edmund Optics GmbH, Mainz, Germany) was mounted in the welding enclosure to protect the thermographic camera. The solid metallic welding wire (diameter of 1.2 mm) and the substrate plate were made of Ti-6Al-4V (from EWG–E. Wagener GmbH, Heimsheim, Germany) certified by AMS 4954 and ASTM B265. An overview of the welding parameters is shown in Table A1 in the Appendix A.
An online quality assurance system (OQAS) was built up and implemented at the WAAM machine. The OQAS was embedded with a programming language software (LabVIEW from National Instruments Corp, Austin, TX, USA) and had five principal functions: data acquisition, data transfer, data logging, data controlling, and data visualization. The architecture of the system is depicted in Figure A1 in the Appendix A. The data from the welding power source, the industrial robot, the thermographic camera, and the oxygen sensor were collected, processed, and visualized for the operator. The OQAS enabled the defining of threshold values, for instance, for the oxygen content in the build chamber and the interlayer temperature. Therefore, the values for the interlayer temperature and the oxygen content could be set and visualized for the operator for the experimental plans. The operator could thereby intervene in the process in the case of deviated values. The data sets were saved in a documentation file enabling the analysis presented in the chapter on the methodology.

4. Results

4.1. Sensitivity Analysis of the Interlayer Temperature

4.1.1. Experimental Pre-Study

A qualitative comparison was conducted between a process triggered by the dwell time and a process triggered by the interlayer temperature. The cross-sections of the two manufactured walls, which were cut in half in the x-z plane (see Figure 1), are shown in Figure 5.
A process triggered by the dwell time resulted in a V-shaped wall, while a process triggered by the temperature resulted in an I-shaped wall. The process triggered by the interlayer temperature showed no varying layer widths in the wall cross-sections (see Figure 5b). An interlayer temperature of 300 °C resulted in a constant layer width of the wall. The interlayer temperatures during the process triggered by the dwell time could not be held constant until the fourth layer, resulting in a varying layer width in the cross-section (see Figure 5a). The interlayer temperature rose due to the heat accumulation in the part, which could be explained by the decreasing heat transfer from the part into the substrate plate at increasing part heights. The interlayer temperature could only be held constant from the fifth layer on, resulting in an I-shaped wall profile. Wu et al. [25] also explained the geometrical deviations between the first few layers and the higher layers with the changing heat transfer. The heat is conducted mainly into the substrate plate in the first few layers. For higher parts, the heat transfer increasingly takes place in the part itself and from there to the ambient air. Baier et al. [14] showed that varying dwell times set during the manufacturing of a wall led to different interlayer temperatures. This influence led to varying effective total widths of the wall. The findings in this work refer to individual layers and align with the findings on the effective total wall widths. Walls showing a V-shape in the first few layers were also observed in studies dedicated to active cooling applications by Kozamernik et al. [26] using steel and Vázquez et al. [27] using titanium material. Da Silva et al. [11] and Yang et al. [10] controlled the temperature of the part during the process and observed a more uniform geometry of the part. This finding aligned with the presented results on a layer level.

4.1.2. Experimental Plan

The quantitative influence of the interlayer temperature on the layer width was conducted with the help of an experimental plan. The model of the regression curve can be described by
w layer , meas = 5.042 · 10 8 · T Interlayer 3 + 5.268 · 10 5 · T Interlayer 2 0.008455 · T Interlayer + 14.32
The regression analysis resulted in a value of 0.89 for the coefficient of determination R 2 . Figure 6 shows the measured individual layer width as a function of the interlayer temperature. The 95% confidence interval depicts the range in which 95% of the values lie [28].
The lowest interlayer temperature of 25 °C resulted in smaller layer widths than the highest interlayer temperature of 600 °C. These two temperature values led to a difference in the layer width of approx. 3.00 mm. The polynomial regression curve showed that the layer width converged to approx. 14.00 mm and 17.20 mm for interlayer temperatures below 200 °C and above 500 °C, respectively. Between 200 °C and 450 °C, the regression curve describes a nearly linear correlation for w layer , meas from 14.30 mm to 16.60 mm by 0.01 mm/K. At an interlayer temperature of 300 °C, the layer width was approx. 15.10 mm. Higher temperatures significantly influenced the layer width more than lower temperatures. At 25 °C, the layer width decreased from 15.10 mm (at T Interlayer = 300 °C) to approx. 14.00 mm. This resulted in an offset of the layer widths of 1.10 mm. At an interlayer temperature of 600 °C, the layer width increased from 15.10 mm (at T Interlayer = 300 °C) to approx. 17.20 mm, resulting in an offset of the layer widths of 2.10 mm. Furthermore, the 95% confidence interval increased at higher temperature regions compared to lower temperatures.
The influence of higher interlayer temperatures leading to wider parts was also observed by Ríos et al. [29]. The presented results indicate that this effect can be transferred to single layers in a quantitative way. Wang et al. [12] observed larger weld pools when welding in higher layers using Inconel 625 material. A heat accumulation resulted in higher layers, leading to larger weld pools at increasing interlayer temperatures [14]. This observation aligned with the findings of Zhao et al. [9], who stated that increasing heights resulted from low temperature gradients during the process. In this work, the layer width increased with increasing interlayer temperatures because the weld pool enlarged as soon the interlayer temperature was higher than the interlayer temperature of the previously deposited layer. The weld pool size decreased when the interlayer temperature was lower than the interlayer temperature of the previously deposited layer. Lower interlayer temperatures resulted in smaller weld pools. The surface tension of the weld pool restricts the dimensions of the layer widths. Therefore, the lower and upper limitation values are approx. 14.00 mm and 17.20 mm.
In conclusion, three separate scenarios result when different interlayer temperatures are applied during the deposition of individual layers on top of each other. Figure 7 depicts the three scenarios.

4.2. Determining Limitations for the Oxygen Content

The results from the visual inspection of the discoloration of the surfaces of the parts are shown in Figure 8. The matrix consists of the manufactured parts with varying oxygen contents in the horizontal direction (columns of the matrix) and the varying numbers of layers in the vertical direction (rows of the matrix). It could be shown that the part size or exposure time of the surface and the oxygen content in the build chamber influenced the discoloration of the wall surface.
The results showed that different restrictions for the oxygen content in the build chamber apply depending on the part size. No discolorations of the surfaces for different part sizes were observed at an oxygen content of 25 ppm. An oxygen content of 100 ppm led to a discoloration of all wall surfaces regardless of the part size. The part consisting of 4 layers manufactured with 100 ppm showed a light straw-colored surface. The parts with 8 and 12 layers manufactured at 100 ppm exhibited an intense discoloration from a light straw color to dark blue. At an oxygen content of 50 ppm, the parts manufactured with 4 and 8 layers had no discolored surfaces. The part with 12 layers and 100 ppm, however, exhibited an intense surface discoloration. A stronger discoloration was found in the center of the surfaces compared to the free ends of the part. This was attributed to the low heat conductivity of the Ti-6Al-4V material. During the manufacturing process, a heat accumulation occurred in the part. Due to the affinity of the material to absorb more oxygen at elevated temperatures [30], the center of the surface discolored stronger than the free ends of the part. This finding was consistent with the observations by Wu et al. [18]. They stated that higher part temperatures result in stronger discolorations. The total time of manufacturing increased with the increasing number of layers. Therefore, the exposure time of the part to the atmosphere increased with a higher number of layers. In combination with the heat accumulation, the part temperature increased, resulting in longer exposure times to the atmosphere.
The results of the quantitative analysis of the discolorations are illustrated using surface plots of the RGB values obtained by following the procedure described in Section 2.2. The normalized medians of the RGB values are plotted separately over the number of layers and the oxygen content (see Figure 9).
All three figures (Figure 9a–c) show the same trend: The medians of all three RGB values were higher at an oxygen content of 25 ppm compared to other oxygen contents. Furthermore, all medians of the RGB values were higher at 25 ppm, independent of the number of layers. For example, the normalized median of the red values was 0.98 for 12 layers and 25 ppm. Comparing this value of 0.98 to the normalized median values of 0.68 in Figure 9a for 8 layers and 100 ppm led to a difference of 0.3 for both median values. The normalized median of the blue values was 0.32 for 4 layers and 100 ppm (Figure 9c). The surface plots indicated that all discolored walls resulted in lower normalized median RGB values. It is necessary to consider all three surface plots in order to decide whether a surface discoloration is present. Considering only one of the surface plots would lead to a misinterpretation since a colored picture consists of all three RGB values. The RGB analysis revealed a good agreement with the visual inspection. This was demonstrated by two examples: A nearly constant development of the median of the RGB values was found by comparing an oxygen content of 25 ppm with a varying number of layers (see Figure 9). This can be equated with no discoloration of the surface of the part and thus with no oxidation. In contrast, when a number of 4 layers and an increasing oxygen content are compared, decreasing median values of all RGB values were observed. This is equivalent to an image getting darker (see Section 2.2). Hence, the presented RGB analysis was found to be a suitable method to quantitatively compare the manufactured walls regarding their oxidation. The medians of the RGB values are normalized and independent of the image size. Due to the normalization, it can be assumed that this analysis can be applied to smaller and larger parts than the parts investigated in this work. The increasing values of the oxygen content in the build chamber led to the discoloration of the surfaces. This observation is consistent with Zhou et al. [31] and Martina et al. [8]. A longer exposure time at elevated temperatures of Ti-6Al-4V material in the atmosphere was also investigated by Zabler [32]. They observed an increased discoloration with longer exposure times, which could also be seen in the presented results. Caballero et al. [17] found that the correlation between the part temperature and the exposure time influences the degree of the discoloration of the surfaces. They changed the process parameters and dwell times to generate different part temperatures (process triggered by the dwell time). In this work, the process was triggered by the interlayer temperature, but the same assumption can be made that the exposure time significantly influences the discoloration. A possible approach to reduce the discoloration could be implementing a cooling system. The successful implementation of such a cooling system was shown by Da Silva et al. [11] for the manufacturing of aluminum parts. It can be assumed that the cooling of the parts made of Ti-6Al-4V material could reduce the degree of the discoloration. Cooling the part during the process will be more important when manufacturing larger parts.

5. Conclusions

High quality demands are placed on the WAAM process for application in the aerospace sector. Using Ti-6Al-4V material in CMT-based WAAM requires a fundamental understanding of the process parameters. The interlayer temperature influences the geometry of the deposited layer. The oxygen content in the build chamber influences the oxidation and, therefore, the discoloration of the surface of the part. This paper presents an approach to determine suitable limitations for the interlayer temperature and the oxygen content in the build chamber. The main findings in this work can be concluded as follows:
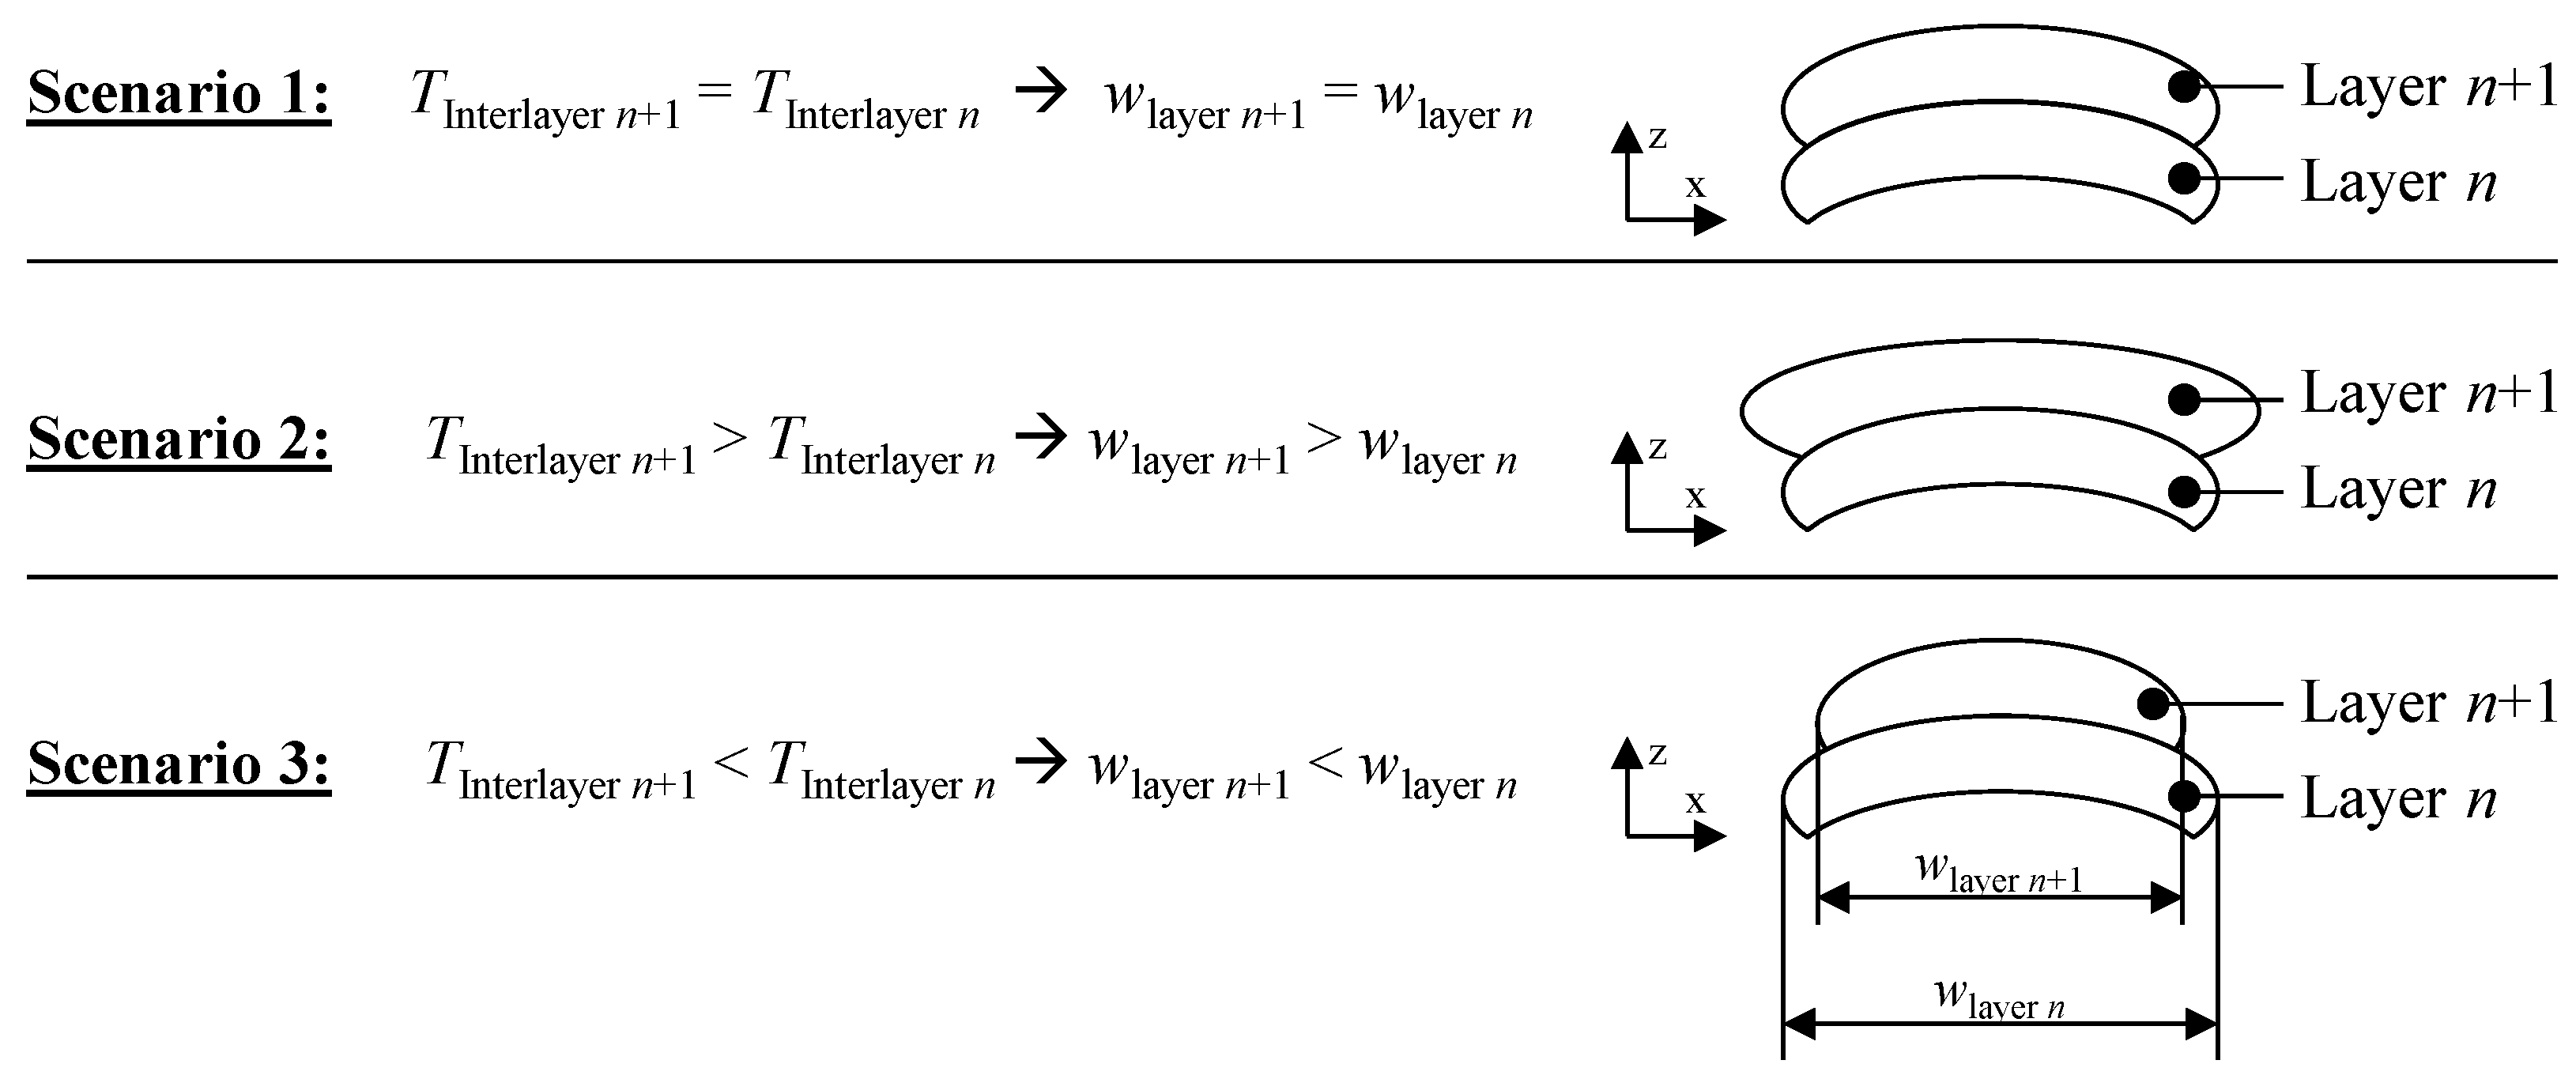
  • Different layer widths within a part can be achieved by varying the interlayer temperature systematically. Walls with a width of approx. 15.10 mm, manufactured at an interlayer temperature of 300 °C, could be varied by up to approx. 3 mm by applying interlayer temperatures between 25 °C and 600 °C.
  • Layer widths are more strongly influenced by applying higher interlayer temperatures compared to lower interlayer temperatures. The wall width manufactured at an interlayer temperature of 300 °C was decreased by up to 1.10 mm when applying an interlayer temperature of 25 °C. In comparison, an interlayer temperature of 600 °C resulted in 2.10 mm wider walls.
  • When applying an interlayer temperature of 300 °C and varying the subsequent interlayer temperature between 200 °C and 450 °C, the layer width can be modified by 0.01 mm/K when using Ti-6Al-4V material in WAAM.
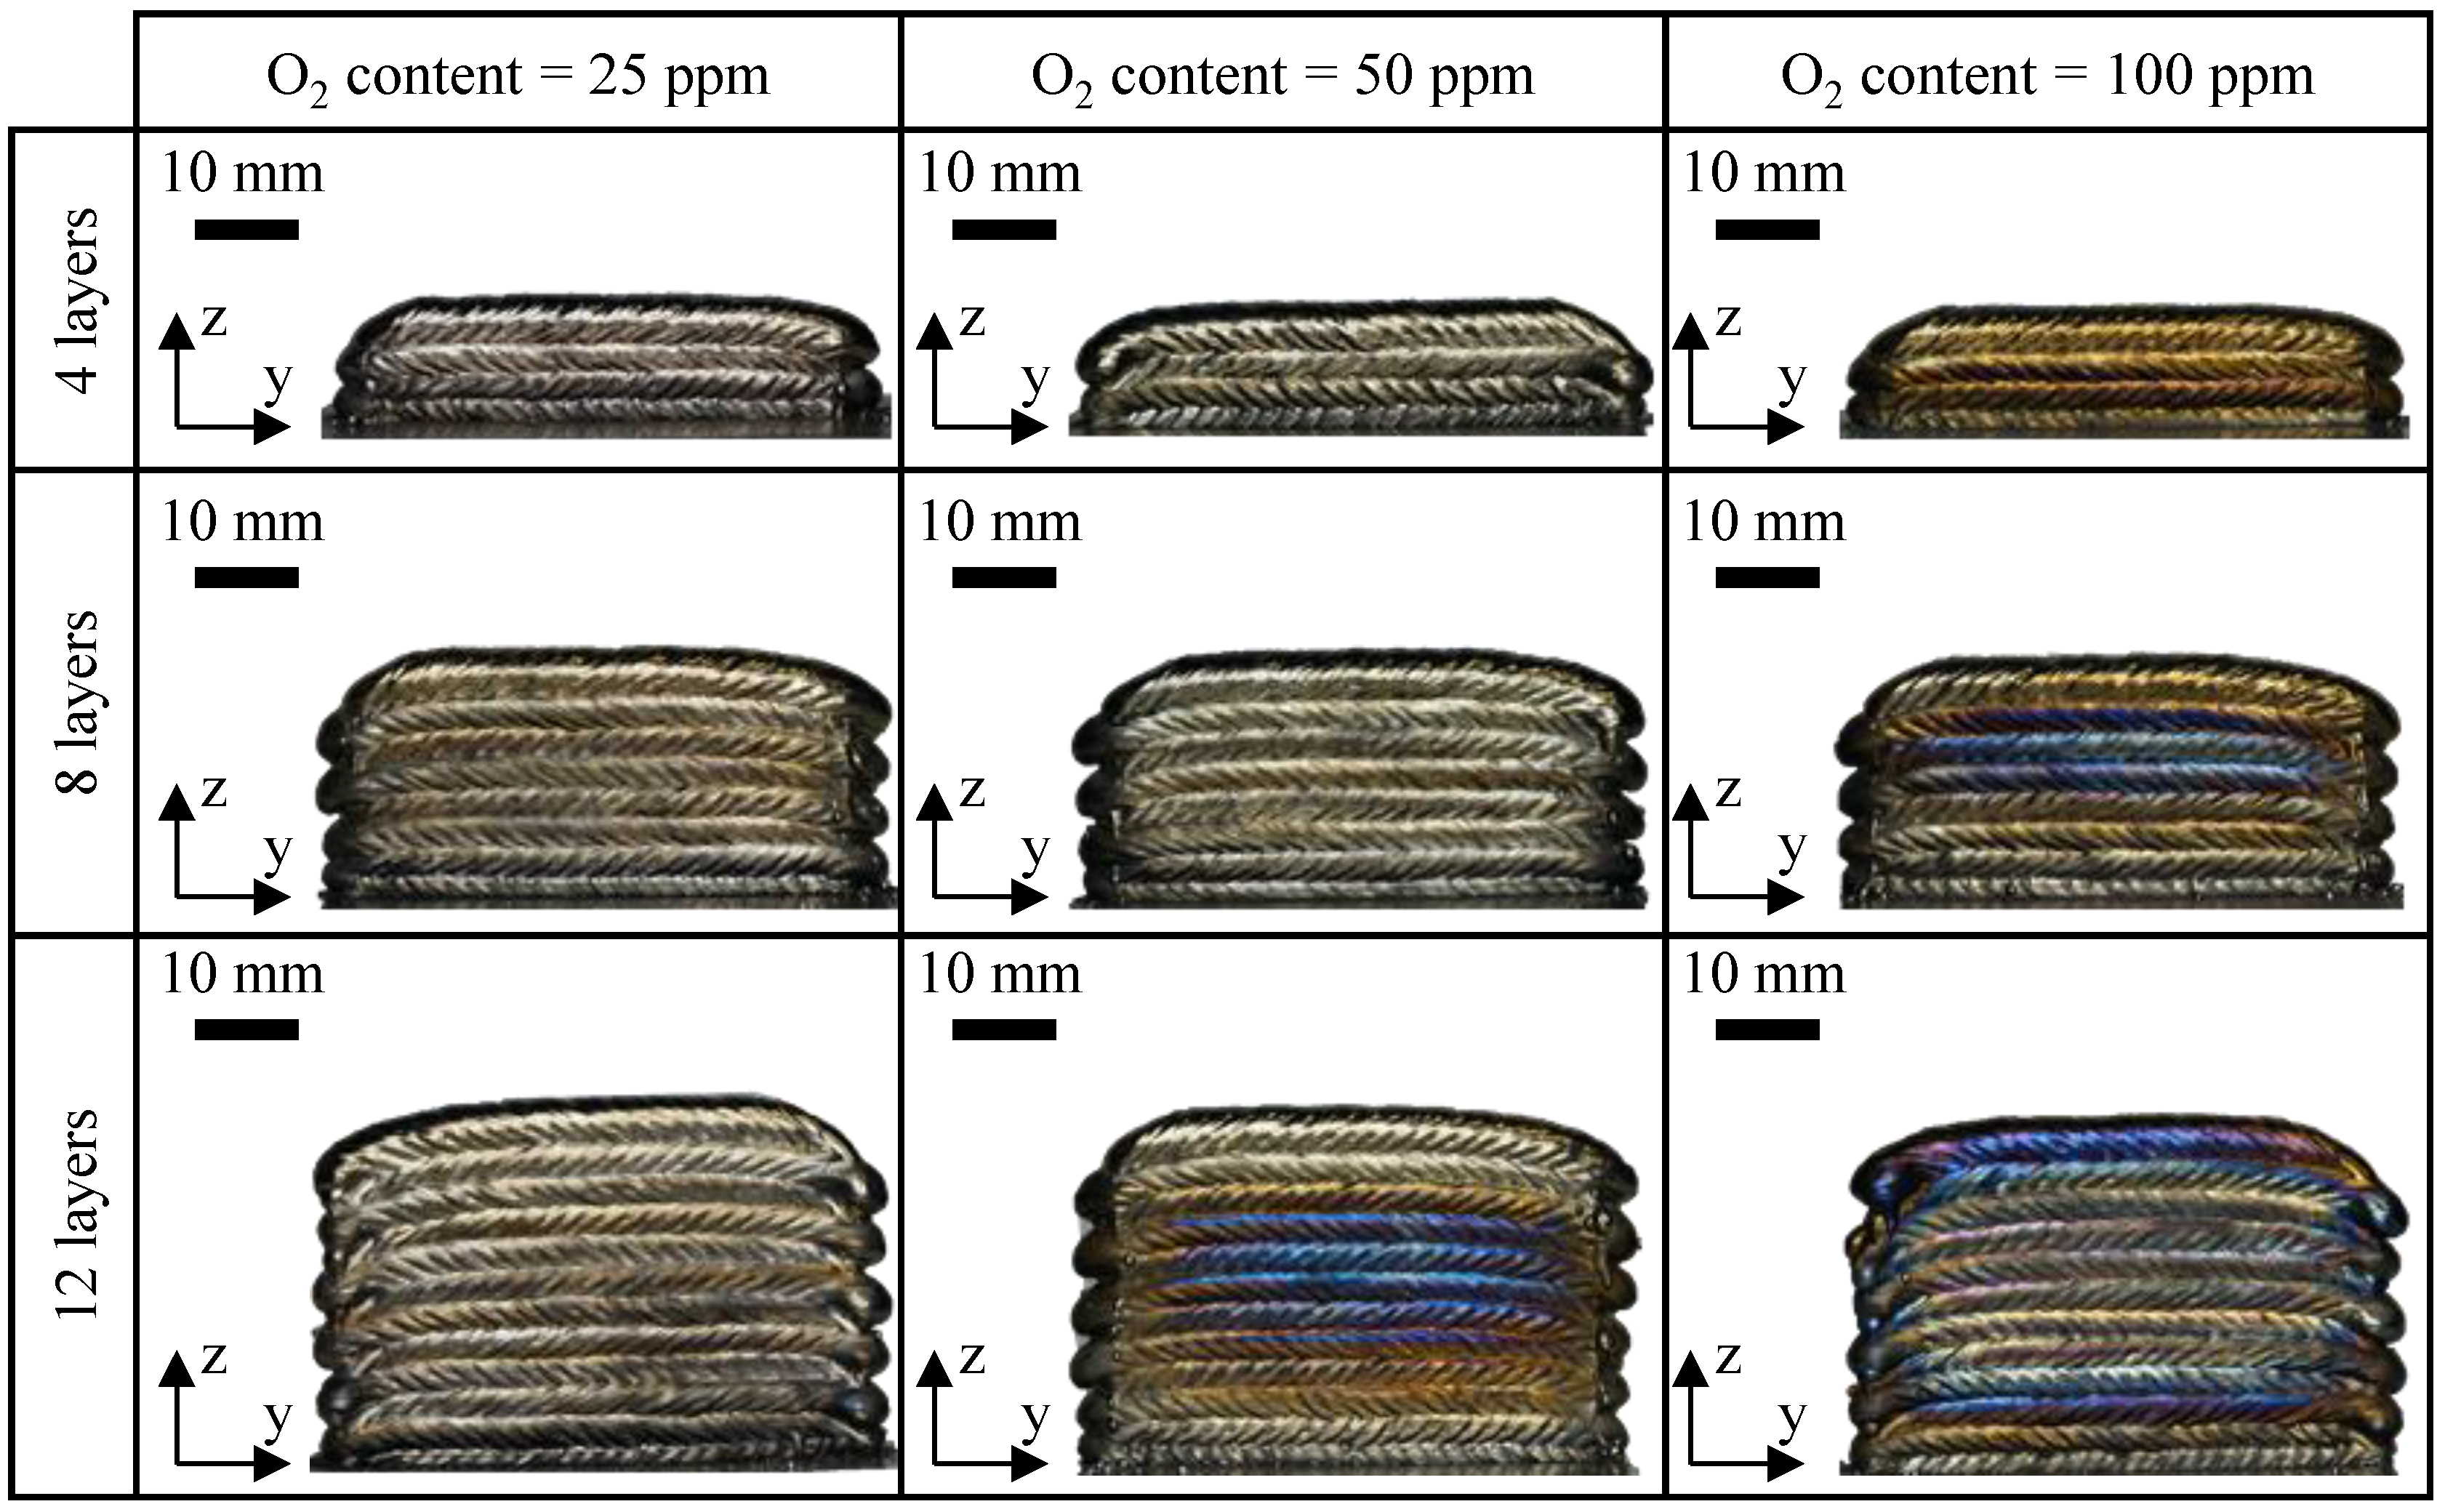
  • Different restrictions for the oxygen content in the build chamber apply depending on the part size or the exposure time of the surface to the atmosphere. An oxygen content of 25 ppm led to no surface discoloration of the different-sized parts. The surface discolorations increased with higher oxygen contents and larger part sizes.
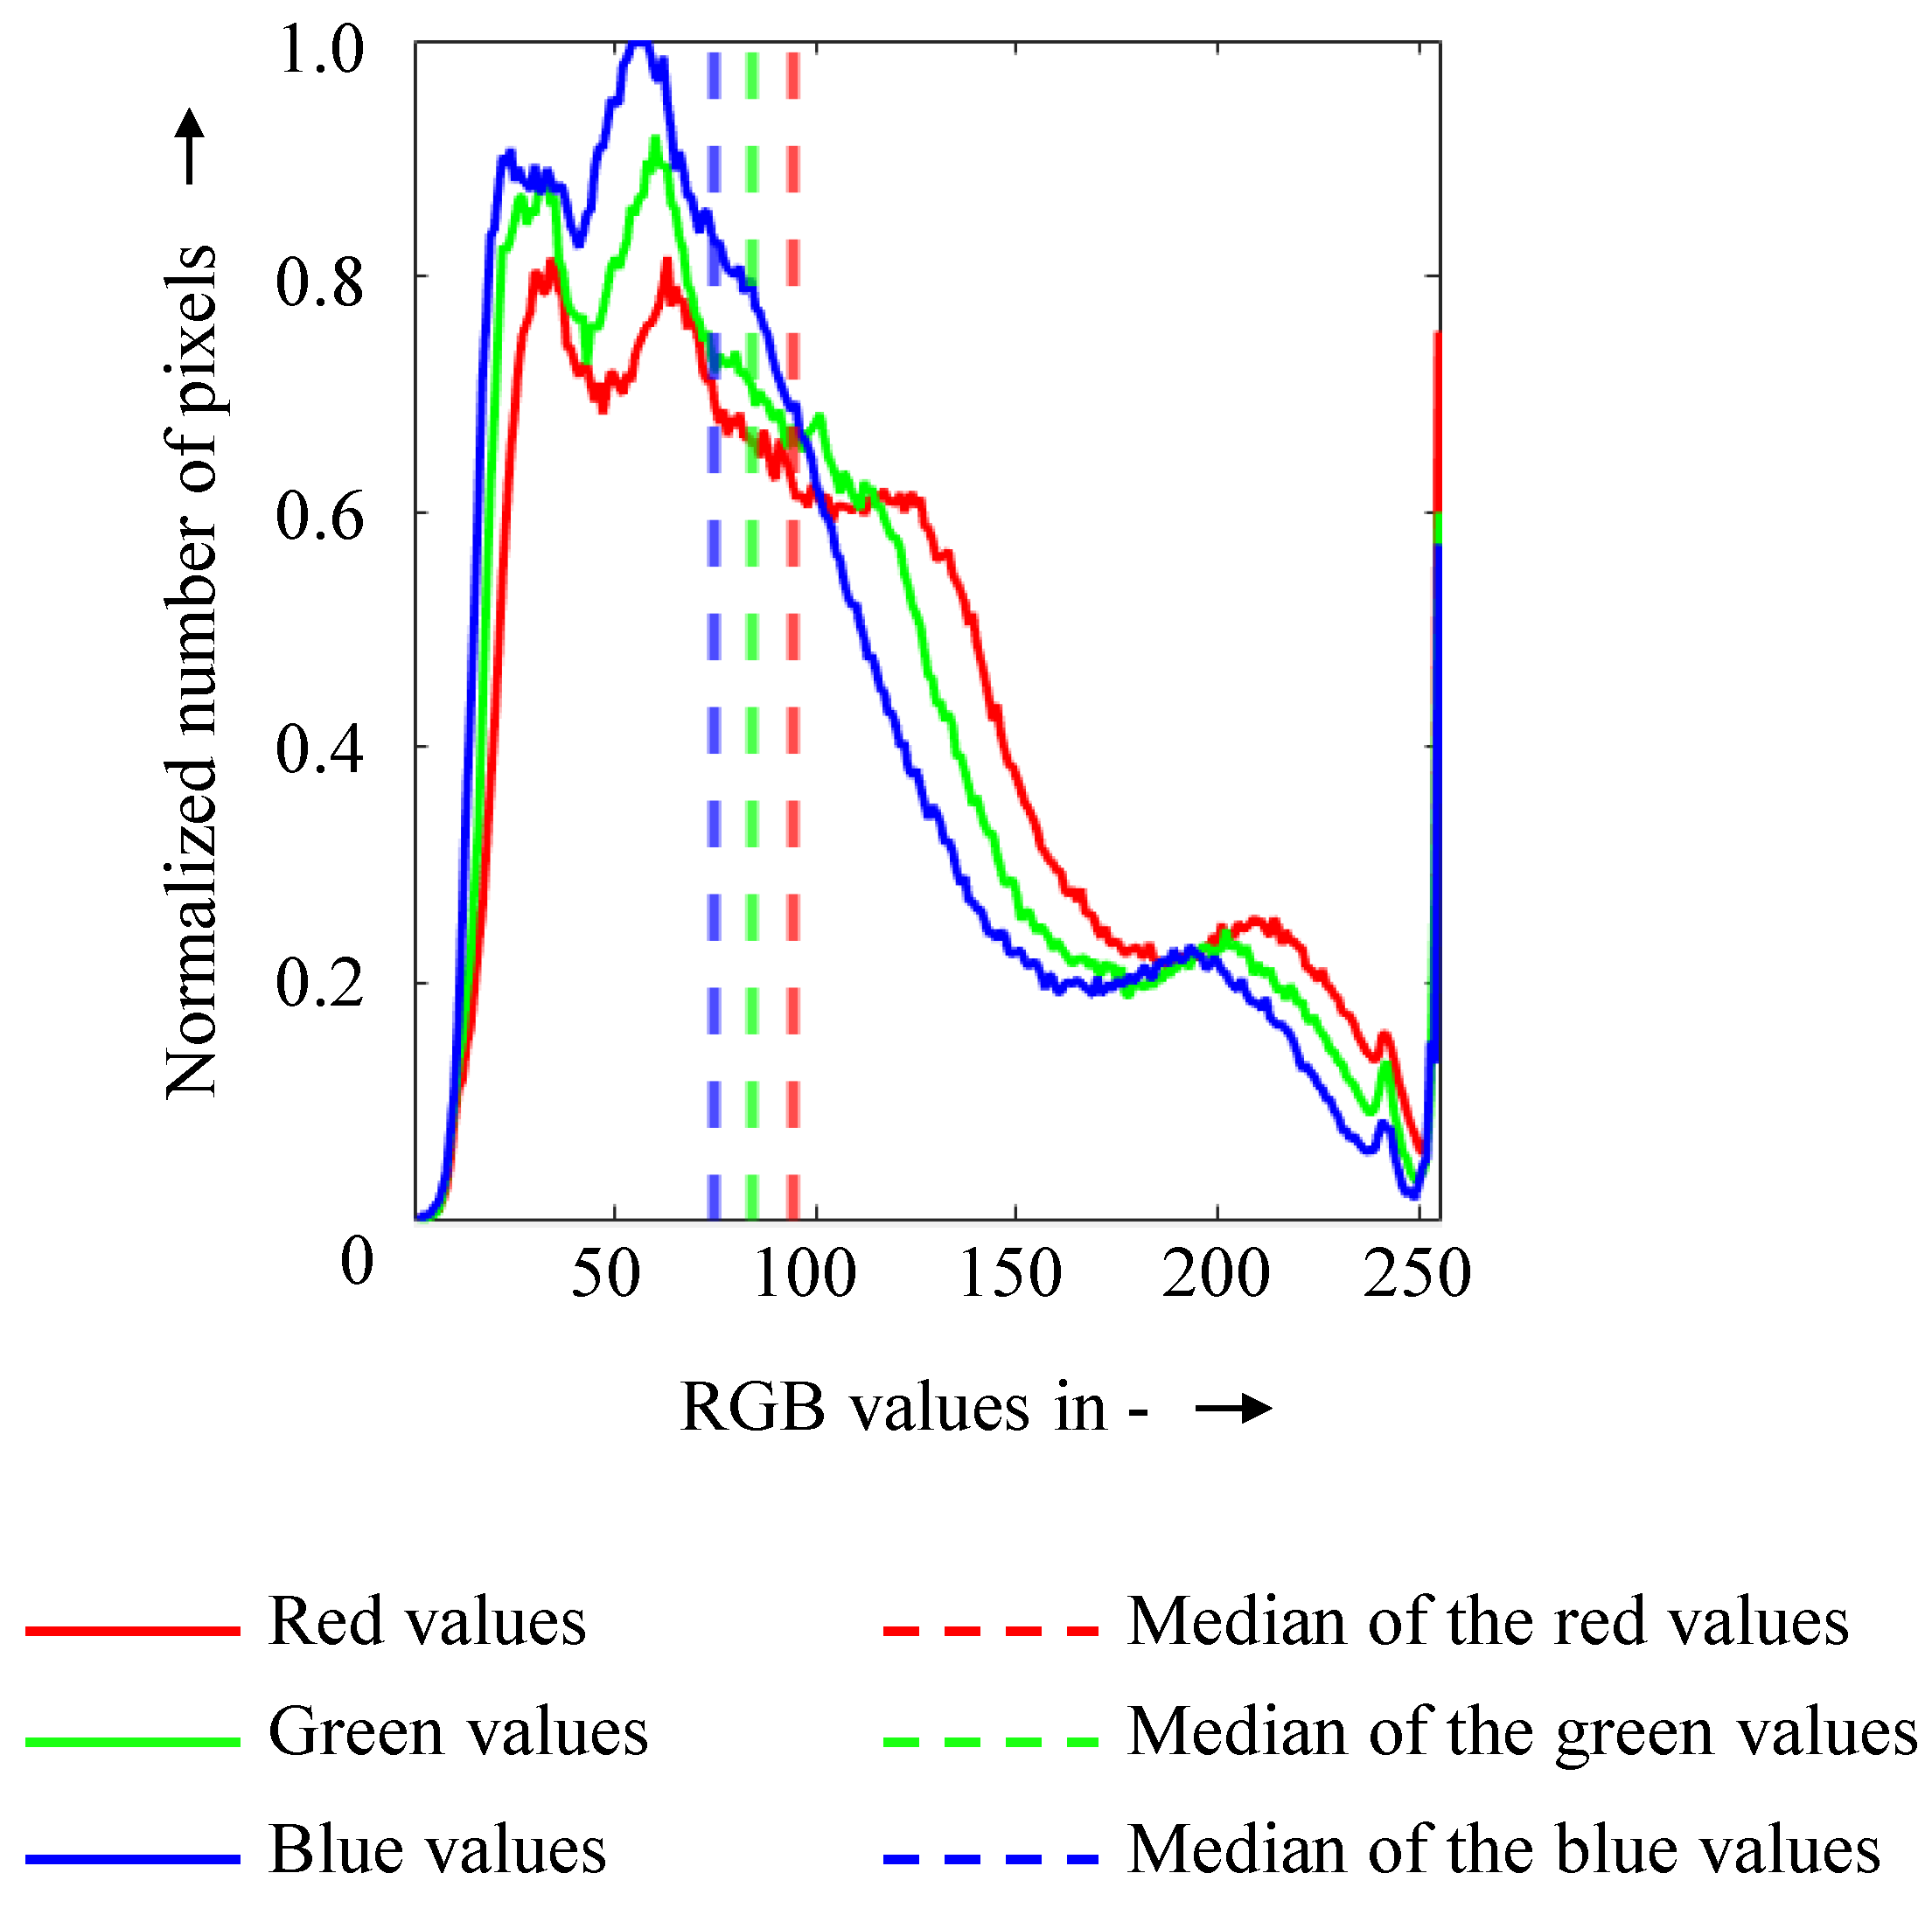
  • The presented method for analyzing the RGB values using surface plots of the median values enables a first classification of whether a part surface is discolored.
The implementation of limitations for the interlayer temperature and oxygen content was realized by the OQAS. The OQAS can be used in further investigations on the manufactured part quality. Here, other sensors can be implemented to enlarge the field constrained by the limitations. For instance, a humidity sensor could be connected and experiments on the influence of the humidity in the welding enclosure on the part surface quality could be conducted. A higher number of layers is needed to manufacture larger parts, meaning that more pronounced temperature gradients appear within an individual layer. In addition to the correlation between the oxygen contents, the part sizes and the mechanical properties investigations on larger parts will also be part of future research activities.

Author Contributions

Conceptualization, D.B.; methodology, D.B.; validation, D.B.; formal analysis, D.B.; investigation, D.B. and T.W.; data curation, D.B. and T.W.; writing—original draft preparation, D.B.; writing—review and editing, D.B., S.B. and M.F.Z.; visualization, D.B.; supervision, M.F.Z.; project administration, D.B. and M.F.Z.; funding acquisition, M.F.Z. All authors have read and agreed to the published version of the manuscript.

Funding

The authors would like to express their gratitude to the German Federal Ministry of Economic Affairs and Climate Action for its funding of the research activities. The content in this paper was achieved within the scope of the research project “QuSAM” (grant reference 20Q2121E).

Institutional Review Board Statement

Not applicable.

Informed Consent Statement

Not applicable.

Data Availability Statement

Not applicable.

Conflicts of Interest

The authors declare no conflict of interest.

Appendix A

Table A1. Overview of the process parameters.
ParameterSymbolValue and Unit
Welding currentI148 A
Welding voltageU16.1 V
Wire feed speed of the electrode v WFS 8 m/min
Travel speed of the welding torch v TS 800 mm/min
Arc length correction factor k l −14%
Dynamic control factor k d 3.7
Displacement in the z direction between each layerz6.1 mm
Distance of the contact tip to the substrate plates15 mm
Figure A1. System architecture of the OQAS for computing the data.
Processes 11 00612 g0a1

References

  1. Yusuf, S.M.; Cutler, S.; Gao, N. Review: The Impact of Metal Additive Manufacturing on the Aerospace Industry. Metals 2019, 9, 1286. [Google Scholar] [CrossRef] [Green Version]
  2. Williams, S.W.; Martina, F.; Addison, A.C.; Ding, J.; Pardal, G.; Colegrove, P. Wire + Arc Additive Manufacturing. Mater. Sci. Technol. 2016, 32, 641–647. [Google Scholar] [CrossRef] [Green Version]
  3. Aguilera, A.; Ayala, D. Orthogonal polyhedra as geometric bounds in constructive solid geometry. In Proceedings of the Fourth ACM Symposium on Solid Modeling and Applications-SMA ’97, Atlanta, GA, USA, 14–16 May 1997; Hoffmann, C., Bronsvoort, W., Allen, G., Pratt, M., Rosen, D., Eds.; ACM Press: New York, NY, USA, 1997; pp. 56–67. [Google Scholar]
  4. Baier, D.; Bachmann, A.; Zaeh, M.F. Towards Wire and Arc Additive Manufacturing of High-Quality Parts. Procedia CIRP 2020, 95, 54–59. [Google Scholar] [CrossRef]
  5. Fuchs, C.; Baier, D.; Semm, T.; Zaeh, M.F. Determining the machining allowance for WAAM parts. Prod. Eng. Res. Devel. 2020, 14, 629–637. [Google Scholar] [CrossRef]
  6. Al-Bermani, S.S.; Blackmore, M.L.; Zhang, W.; Todd, I. The Origin of Microstructural Diversity, Texture, and Mechanical Properties in Electron Beam Melted Ti-6Al-4V. MMTA 2010, 41, 3422–3434. [Google Scholar] [CrossRef]
  7. American Welding Society. Guide for the Fusion Welding of Titanium and Titanium Alloys, 2nd ed.; Reproduced by World Engineering Xchange (WEX) with the Permission of AWS under Royalty Agreement; American Welding Society: Miami, FL, USA, 2014; ISBN 978-0-87171-848-8. [Google Scholar]
  8. Martina, F.; Mehnen, J.; Williams, S.W.; Colegrove, P.; Wang, F. Investigation of the benefits of plasma deposition for the additive layer manufacture of Ti–6Al–4V. J. Mater. Process. Technol. 2012, 212, 1377–1386. [Google Scholar] [CrossRef] [Green Version]
  9. Zhao, H.; Zhang, G.; Yin, Z.; Wu, L. A 3D dynamic analysis of thermal behavior during single-pass multi-layer weld-based rapid prototyping. J. Mater. Process. Technol. 2011, 211, 488–495. [Google Scholar] [CrossRef]
  10. Yang, D.; Wang, G.; Zhang, G. Thermal analysis for single-pass multi-layer GMAW based additive manufacturing using infrared thermography. J. Mater. Process. Technol. 2017, 244, 215–224. [Google Scholar] [CrossRef]
  11. Da Silva, L.J.; Souza, D.M.; de Araújo, D.B.; Reis, R.P.; Scotti, A. Concept and validation of an active cooling technique to mitigate heat accumulation in WAAM. Int. J. Adv. Manuf. Technol. 2020, 107, 2513–2523. [Google Scholar] [CrossRef]
  12. Wang, J.F.; Sun, Q.J.; Wang, H.; Liu, J.P.; Feng, J.C. Effect of location on microstructure and mechanical properties of additive layer manufactured Inconel 625 using gas tungsten arc welding. Mater. Sci. Eng. A 2016, 676, 395–405. [Google Scholar] [CrossRef]
  13. Wang, Z.; Zimmer-Chevret, S.; Léonard, F.; Abba, G. Prediction of bead geometry with consideration of interlayer temperature effect for CMT-based wire-arc additive manufacturing. Weld World 2021, 65, 2255–2266. [Google Scholar] [CrossRef]
  14. Baier, D.; Wolf, F.; Weckenmann, T.; Lehmann, M.; Zaeh, M.F. Thermal process monitoring and control for a near-net-shape Wire and Arc Additive Manufacturing. Prod. Eng. Res. Devel. 2022, 16, 811–822. [Google Scholar] [CrossRef]
  15. Leyens, C.; Peters, M.; Weinem, D.; Kaysser, W.A. Influence of long-term annealing on tensile properties and fracture of near-α titanium alloy Ti-6Al-2.75Sn-4Zr-0.4Mo-0.45Si. MMTA 1996, 27, 1709–1717. [Google Scholar] [CrossRef]
  16. Li, X.; Xie, J.; Zhou, Y. Effects of oxygen contamination in the argon shielding gas in laser welding of commercially pure titanium thin sheet. J. Mater. Sci. 2005, 40, 3437–3443. [Google Scholar] [CrossRef]
  17. Caballero, A.; Ding, J.; Bandari, Y.; Williams, S. Oxidation of Ti-6Al-4V During Wire and Arc Additive Manufacture. 3D Print. Addit. Manuf. 2019, 6, 91–98. [Google Scholar] [CrossRef]
  18. Wu, B.; Pan, Z.; Ding, D.; Cuiuri, D.; Li, H.; Fei, Z. The effects of forced interpass cooling on the material properties of wire arc additively manufactured Ti6Al4V alloy. J. Mater. Process. Technol. 2018, 258, 97–105. [Google Scholar] [CrossRef] [Green Version]
  19. Artaza, T.; Suárez, A.; Veiga, F.; Braceras, I.; Tabernero, I.; Larrañaga, O.; Lamikiz, A. Wire arc additive manufacturing Ti6Al4V aeronautical parts using plasma arc welding: Analysis of heat-treatment processes in different atmospheres. J. Mater. Res. Technol. 2020, 9, 15454–15466. [Google Scholar] [CrossRef]
  20. Elmer, J.W.; Gibbs, G. The effect of atmosphere on the composition of wire arc additive manufactured metal components. Sci. Technol. Weld. Join. 2019, 24, 367–374. [Google Scholar] [CrossRef]
  21. Bermingham, M.J.; Thomson-Larkins, J.; St John, D.H.; Dargusch, M.S. Sensitivity of Ti-6Al-4V components to oxidation during out of chamber Wire + Arc Additive Manufacturing. J. Mater. Process. Technol. 2018, 258, 29–37. [Google Scholar] [CrossRef] [Green Version]
  22. Ding, J.; Colegrove, P.; Martina, F.; Williams, S.; Wiktorowicz, R.; Palt, M.R. Development of a laminar flow local shielding device for wire + arc additive manufacture. J. Mater. Process. Technol. 2015, 226, 99–105. [Google Scholar] [CrossRef]
  23. Westland, S.; Cheung, V. RGB Systems. In Handbook of Visual Display Technology; Chen, J., Cranton, W., Fihn, M., Eds.; Springer Berlin Heidelberg: Berlin/Heidelberg, Germany, 2016; pp. 1–6. ISBN 978-3-642-35947-7. [Google Scholar]
  24. Gravetter, F.J.; Wallnau, L.B. Statistics for the Behavioral Sciences, 7th ed.; Thomson Wadsworth: Belmont, CA, USA, 2007; ISBN 0495095214. [Google Scholar]
  25. Wu, B.; Ding, D.; Pan, Z.; Cuiuri, D.; Li, H.; Han, J.; Fei, Z. Effects of heat accumulation on the arc characteristics and metal transfer behavior in Wire Arc Additive Manufacturing of Ti6Al4V. J. Mater. Process. Technol. 2017, 250, 304–312. [Google Scholar] [CrossRef]
  26. Kozamernik, N.; Bračun, D.; Klobčar, D. WAAM system with interpass temperature control and forced cooling for near-net-shape printing of small metal components. Int. J. Adv. Manuf. Technol. 2020, 110, 1955–1968. [Google Scholar] [CrossRef]
  27. Vázquez, L.; Rodríguez, N.; Rodríguez, I.; Alberdi, E.; Álvarez, P. Influence of interpass cooling conditions on microstructure and tensile properties of Ti-6Al-4V parts manufactured by WAAM. Weld World 2020, 4828, 1. [Google Scholar] [CrossRef]
  28. Cox, D.R.; Hinkley, D.V. Theoretical Statistics, 2nd ed.; Reprint; Chapman & Hall: London, UK, 1997; ISBN 9780412161605. [Google Scholar]
  29. Ríos, S.; Colegrove, P.A.; Martina, F.; Williams, S.W. Analytical process model for wire + arc additive manufacturing. Addit. Manuf. 2018, 21, 651–657. [Google Scholar] [CrossRef]
  30. Li, L.; Yu, K.; Zhang, K.; Liu, Y. Study of Ti–6Al–4V alloy spectral emissivity characteristics during thermal oxidation process. Int. J. Heat. Mass. Transf. 2016, 101, 699–706. [Google Scholar] [CrossRef]
  31. Zhou, S.; Zhang, J.; Wang, J.; Yang, G.; Wu, K.; Qin, L. Effect of Oxygen Levels in Tent Shielding Atmosphere on Microstructural and Mechanical Properties of Ti-6Al-4V Fabricated by Wire Arc Additive Manufacturing. J. Mater. Eng. Perform. 2022, 31, 5269–5278. [Google Scholar] [CrossRef]
  32. Zabler, S. Interstitial Oxygen diffusion hardening—A practical route for the surface protection of titanium. Mater. Charact. 2011, 62, 1205–1213. [Google Scholar] [CrossRef]
Figure 1. Schematic representation of a manufactured wall.
Processes 11 00612 g001
Figure 2. Example of a digitally cut wall with individual layers indicated by blue dashed lines.
Processes 11 00612 g002
Figure 3. Exemplary histogram of the normalized number of pixels over the RGB values for a manufactured wall.
Processes 11 00612 g003
Figure 4. Experimental setup (reproduced from [14], under CC BY 4.0).
Processes 11 00612 g004
Figure 5. Cross-sections of walls manufactured with (a) a constant dwell time of 50 s and (b) a constant interlayer temperature of 300 °C; the dashed lines in color indicate the outer contours of the wall.
Processes 11 00612 g005
Figure 6. Correlation between measured layer widths and interlayer temperatures.
Processes 11 00612 g006
Figure 7. Description of the three scenarios of the temperature deviation affecting the layer widths.
Processes 11 00612 g007
Figure 8. Matrix showing pictures of manufactured walls with different sizes (rows) and with different oxygen contents in the build chamber (columns).
Processes 11 00612 g008
Figure 9. Normalized medians of the (a) red, (b) green, and (c) blue values plotted over the number of layers and the oxygen content of the manufactured walls.
Processes 11 00612 g009
Disclaimer/Publisher’s Note: The statements, opinions and data contained in all publications are solely those of the individual author(s) and contributor(s) and not of MDPI and/or the editor(s). MDPI and/or the editor(s) disclaim responsibility for any injury to people or property resulting from any ideas, methods, instructions or products referred to in the content.

