Article

Uniaxial Creep Test Analysis on Creep Characteristics of Fully Weathered Sandy Shale

1
College of Pipeline and Civil Engineering, China University of Petroleum, Qingdao 266580, China
2
Geotechnical and Structural Engineering Research Center, Shandong University, Ji’nan 250061, China
3
School of Transportation and Civil Engineering, Shandong Jiaotong University, Ji’nan 250357, China
4
Jiangxi Provincial Communications Investment Group Company Limited, Nanchang 330038, China
5
Department of Chemical and Biological Engineering, University of Sheffield, Sheffield S102TN, UK
*
Author to whom correspondence should be addressed.
Processes 2023, 11(2), 610; https://doi.org/10.3390/pr11020610
Submission received: 1 January 2023 / Revised: 10 February 2023 / Accepted: 10 February 2023 / Published: 17 February 2023
(This article belongs to the Special Issue Multiphase Flows and Particle Technology)

Abstract

:
The creep damage behavior of rocks is very important for evaluating the stability and safety of key rock engineering. Based on the Lianhua Tunnel Project in China, this paper aims to study the creep damage mechanics, the influencing factors and the creep constitutive models of sandy shale. In order to achieve these goals, a uniaxial compressive strength test and a creep test under different moisture contents and load levels were carried out. According to the test results, the creep parameters (elastic coefficients E1 and E2 and viscosity coefficients η1 and η2) of the Burgers Model were achieved, and the relationship between the creep parameters and moisture content, ω, was established accordingly (E1 = f(ω), E2 = f(ω), η1 = f(ω), η2 = f(ω)). A fully weathered sandy-shale creep constitutive model considering moisture content was finally obtained. Test results showed that creep deformation increases with any increase in load level or moisture content, and the influence of moisture content is more significant. For instance, creep deformation increased by 35% when the load increased by 50%, and creep deformation increased by 82% when the moisture content increased by 45%. In addition, the creep rate in the steady stage and the duration of the primary creep stage increased with any increase in moisture content or load level. The higher the moisture content, the greater the influence of creep deformation on the total deformation. The creep model of fully weathered sandy shale showed that the elastic coefficients (E1, E2) and the viscosity coefficients (η1, η2) are negatively correlated to moisture content; E1 is negatively correlated to load level; and E2, η1 and η2 are positively correlated to load level. Qualitative and quantitative analysis of fully weathered sandy shale can improve the existing research of creep properties and is expected to provide theoretical support for treatment of large deformation disasters in the fully weathered sandy-shale stratum.

1. Introduction

The creep damage behavior of rocks is very important for evaluating the stability and safety of key rock engineering such as underground tunnels, high slope stability, dam basements and nuclear-waste disposal [1,2,3,4,5]. Thus, the study of rock creep has become one of the key points in the field of infrastructural construction.
Based on infrastructures such as the Wanfu Coal Mine [6] in China; the Renhuling Tunnel Project [7] in China; large caverns in Japan [8]; and other projects in Italy [9], Iran [10], etc., studies of rock creep characteristics were carried out by scholars at home and abroad.
In the aspect of the influence of the rock creep effect, Zhu et al. [11] indicated that the rock creep effect can bring unpredictable delayed failure for tunnel lining; Wang et al. [12] pointed out that the rock creep effect affects the long-term stability and the failure mode of tunnel lining. In the aspect of influencing factors of creep effect, Zhu et al. [7] and Sun et al. [6] conducted research on tuff and sandstone, respectively, and discussed the laws of how moisture content affects creep behavior. Chen et al. [8] studied the creep behavior of light tuff stone, coarse sandstone and sandy mudstone under triaxial compression and discussed the influence of rock properties and axial stress on creep behavior. Li et al. [13] studied the creep behavior of host salt rock and the influence of long-term mechanical and thermal loads. In the aspect of the creep constitutive equation, Okubo et al. [14] obtained the complete creep curves and the constitutive equation of Akiyoshi marble, Tako sandstone, Sanjome andesite, Kawazu tuff and Inada granite under a uniaxial compression test. Maranini et al. [9] presented an experimental study on the creep behavior of porous chalk and implemented an elastic–plastic model using the experimental results. Wang et al. [15] established a modified Nishihara Rheological Model considering the effect of thermal–mechanical coupling. Gutierrez-Ch et al. [16] proposed new soil/rock creep models through analyzing the applicability of the discrete element method with rate process theory. Zohravi et al. [10] proposed a new constitutive model for the time-dependent behavior of rocks with consideration of damage parameter.
As mentioned, most of the above studies were aimed at tuff, sandstone, mudstone, marble, andesite, granite and other types of rocks. There is still a lack of research on the creep characteristics of fully weathered sandy shale. However, in practical engineering, the fully weathered sandy-shale stratum is often undercrossed by mountain tunnel construction projects in the southwest of China. The fully weathered sandy-shale stratum can be easily disintegrated via groundwater immersion and has the characteristics of poor erosion resistance, developed joint fissures and soft and broken rock mass, which all lead to an indispensable creep effect. Due to the creep effect, fully weathered sandy-shale status is prone to causing large deformation disasters and tunnel instability, resulting in casualties, mechanical losses and construction delays and seriously affecting the safety of tunnel construction [17]. Thus, it is urgent to study the creep effect of fully weathered sandy shale. In addition, many scholars have tried to explore a suitable rock creep constitutive model and have reached a series of achievements; however, there is no ideal creep constitutive model with wide applicability. Hence, there is still much work to be carried out on the theoretical research of rock creep constitutive models [1].
Therefore, based on the large deformation treatment engineering of fully weathered sandy shale in the Lianhua Tunnel of Pinglian Expressway in Jiangxi, China, this study carried out a uniaxial compressive strength experiment and a creep experiment to study creep mechanical behavior. On the basis of the Burgers model, the correlations between creep parameters and moisture content under different load levels were analyzed. The mathematical relationship between creep parameters and moisture content was established subsequently through means of data fitting and regression analysis. Finally, a creep model of fully weathered sandy shale, considering moisture content, was achieved. It is expected that these research findings can provide theoretical support for treatment of large deformation disasters in the fully weathered sandy-shale stratum.

2. Laboratory Experiments of Fully Weathered Sandy Shale

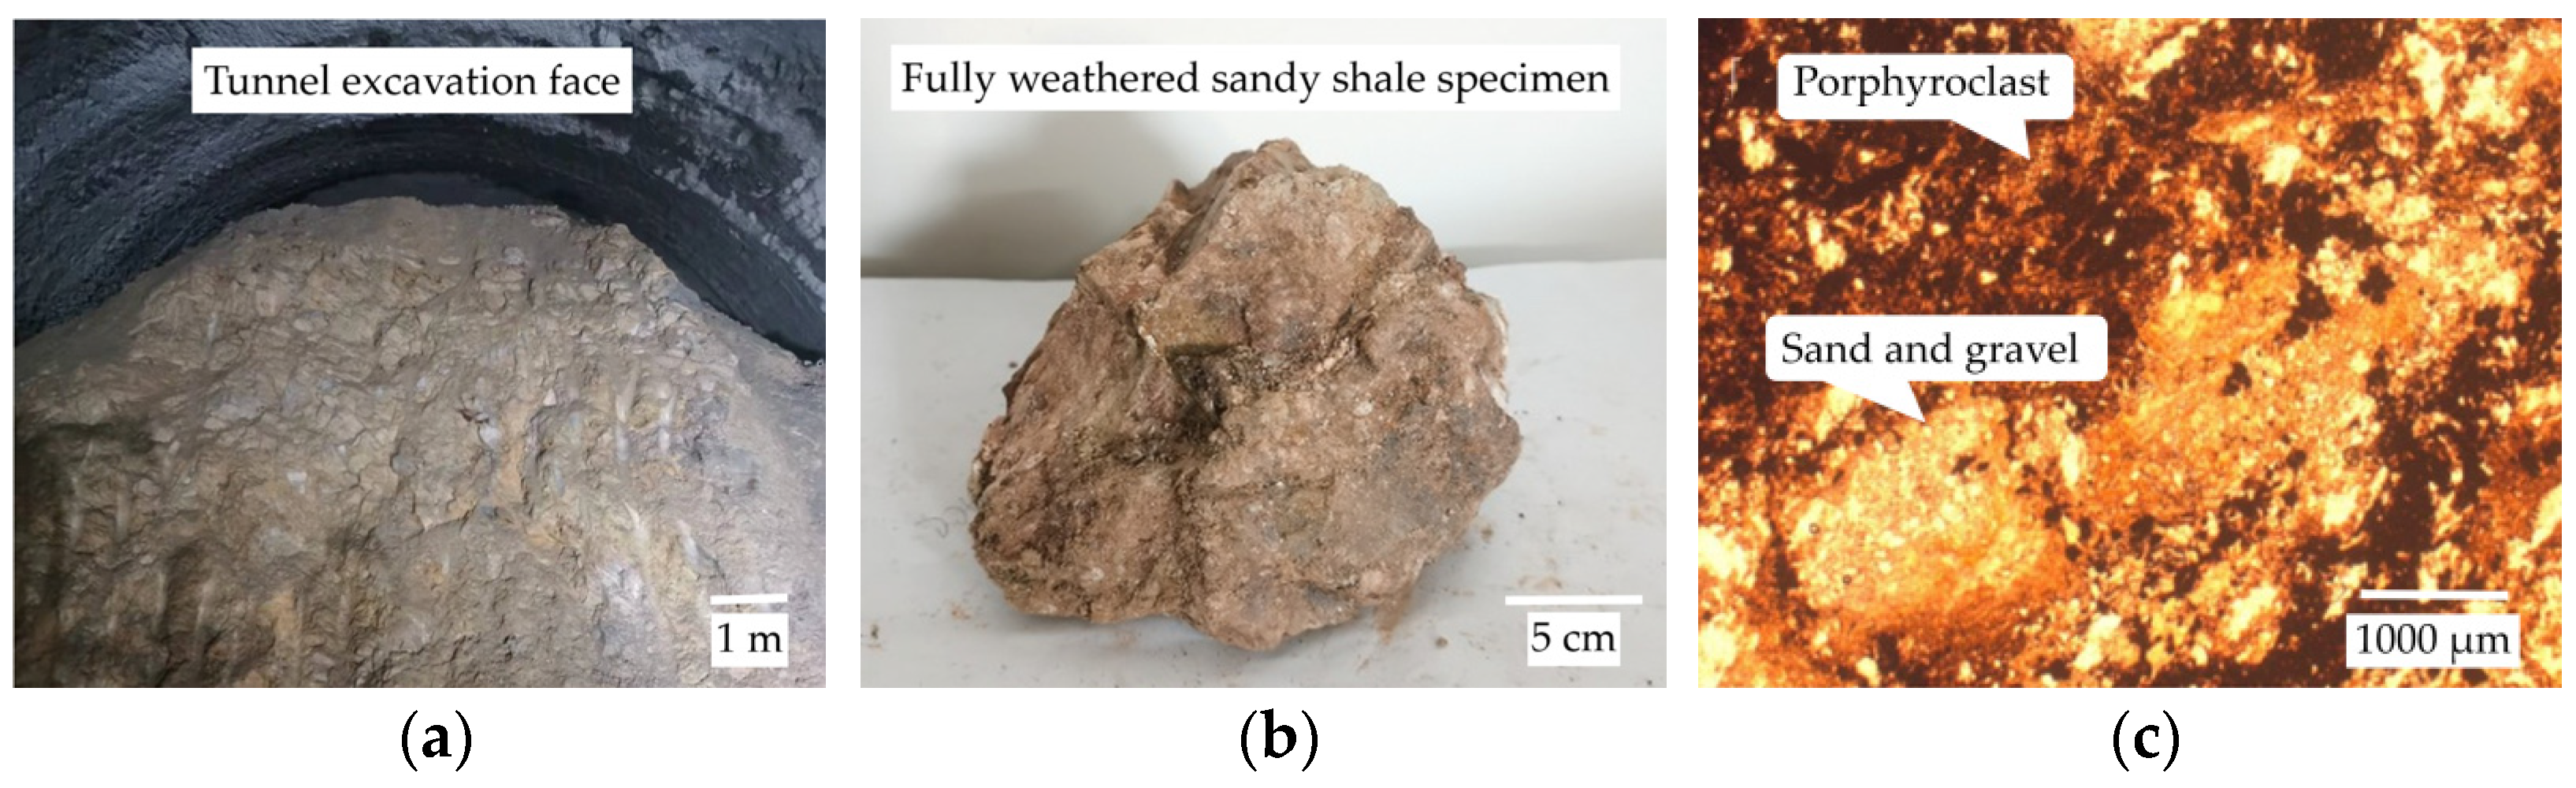
2.1. Experimental Material

Fully weathered sandy shale is widely developed in the Lianhua Tunnel Project of Pinglian Expressway, Jiangxi, China. In practical engineering, when tunnel construction passes through this stratum, the surrounding rock, which is rich in water and weak and broken, is likely to be seriously destroyed and deformed. Large deformation disasters in the Lianhua Tunnel occur occasionally during the tunnel excavation. In order to study creep characteristics, fully weathered sandy-shale specimens were taken from where large deformation occurred in the Lianhua Tunnel Project. Images of fully weathered sandy shale in situ, in the lab and under a polarizing microscope (Nikon ECLIPSE-E200) are shown in Figure 1.

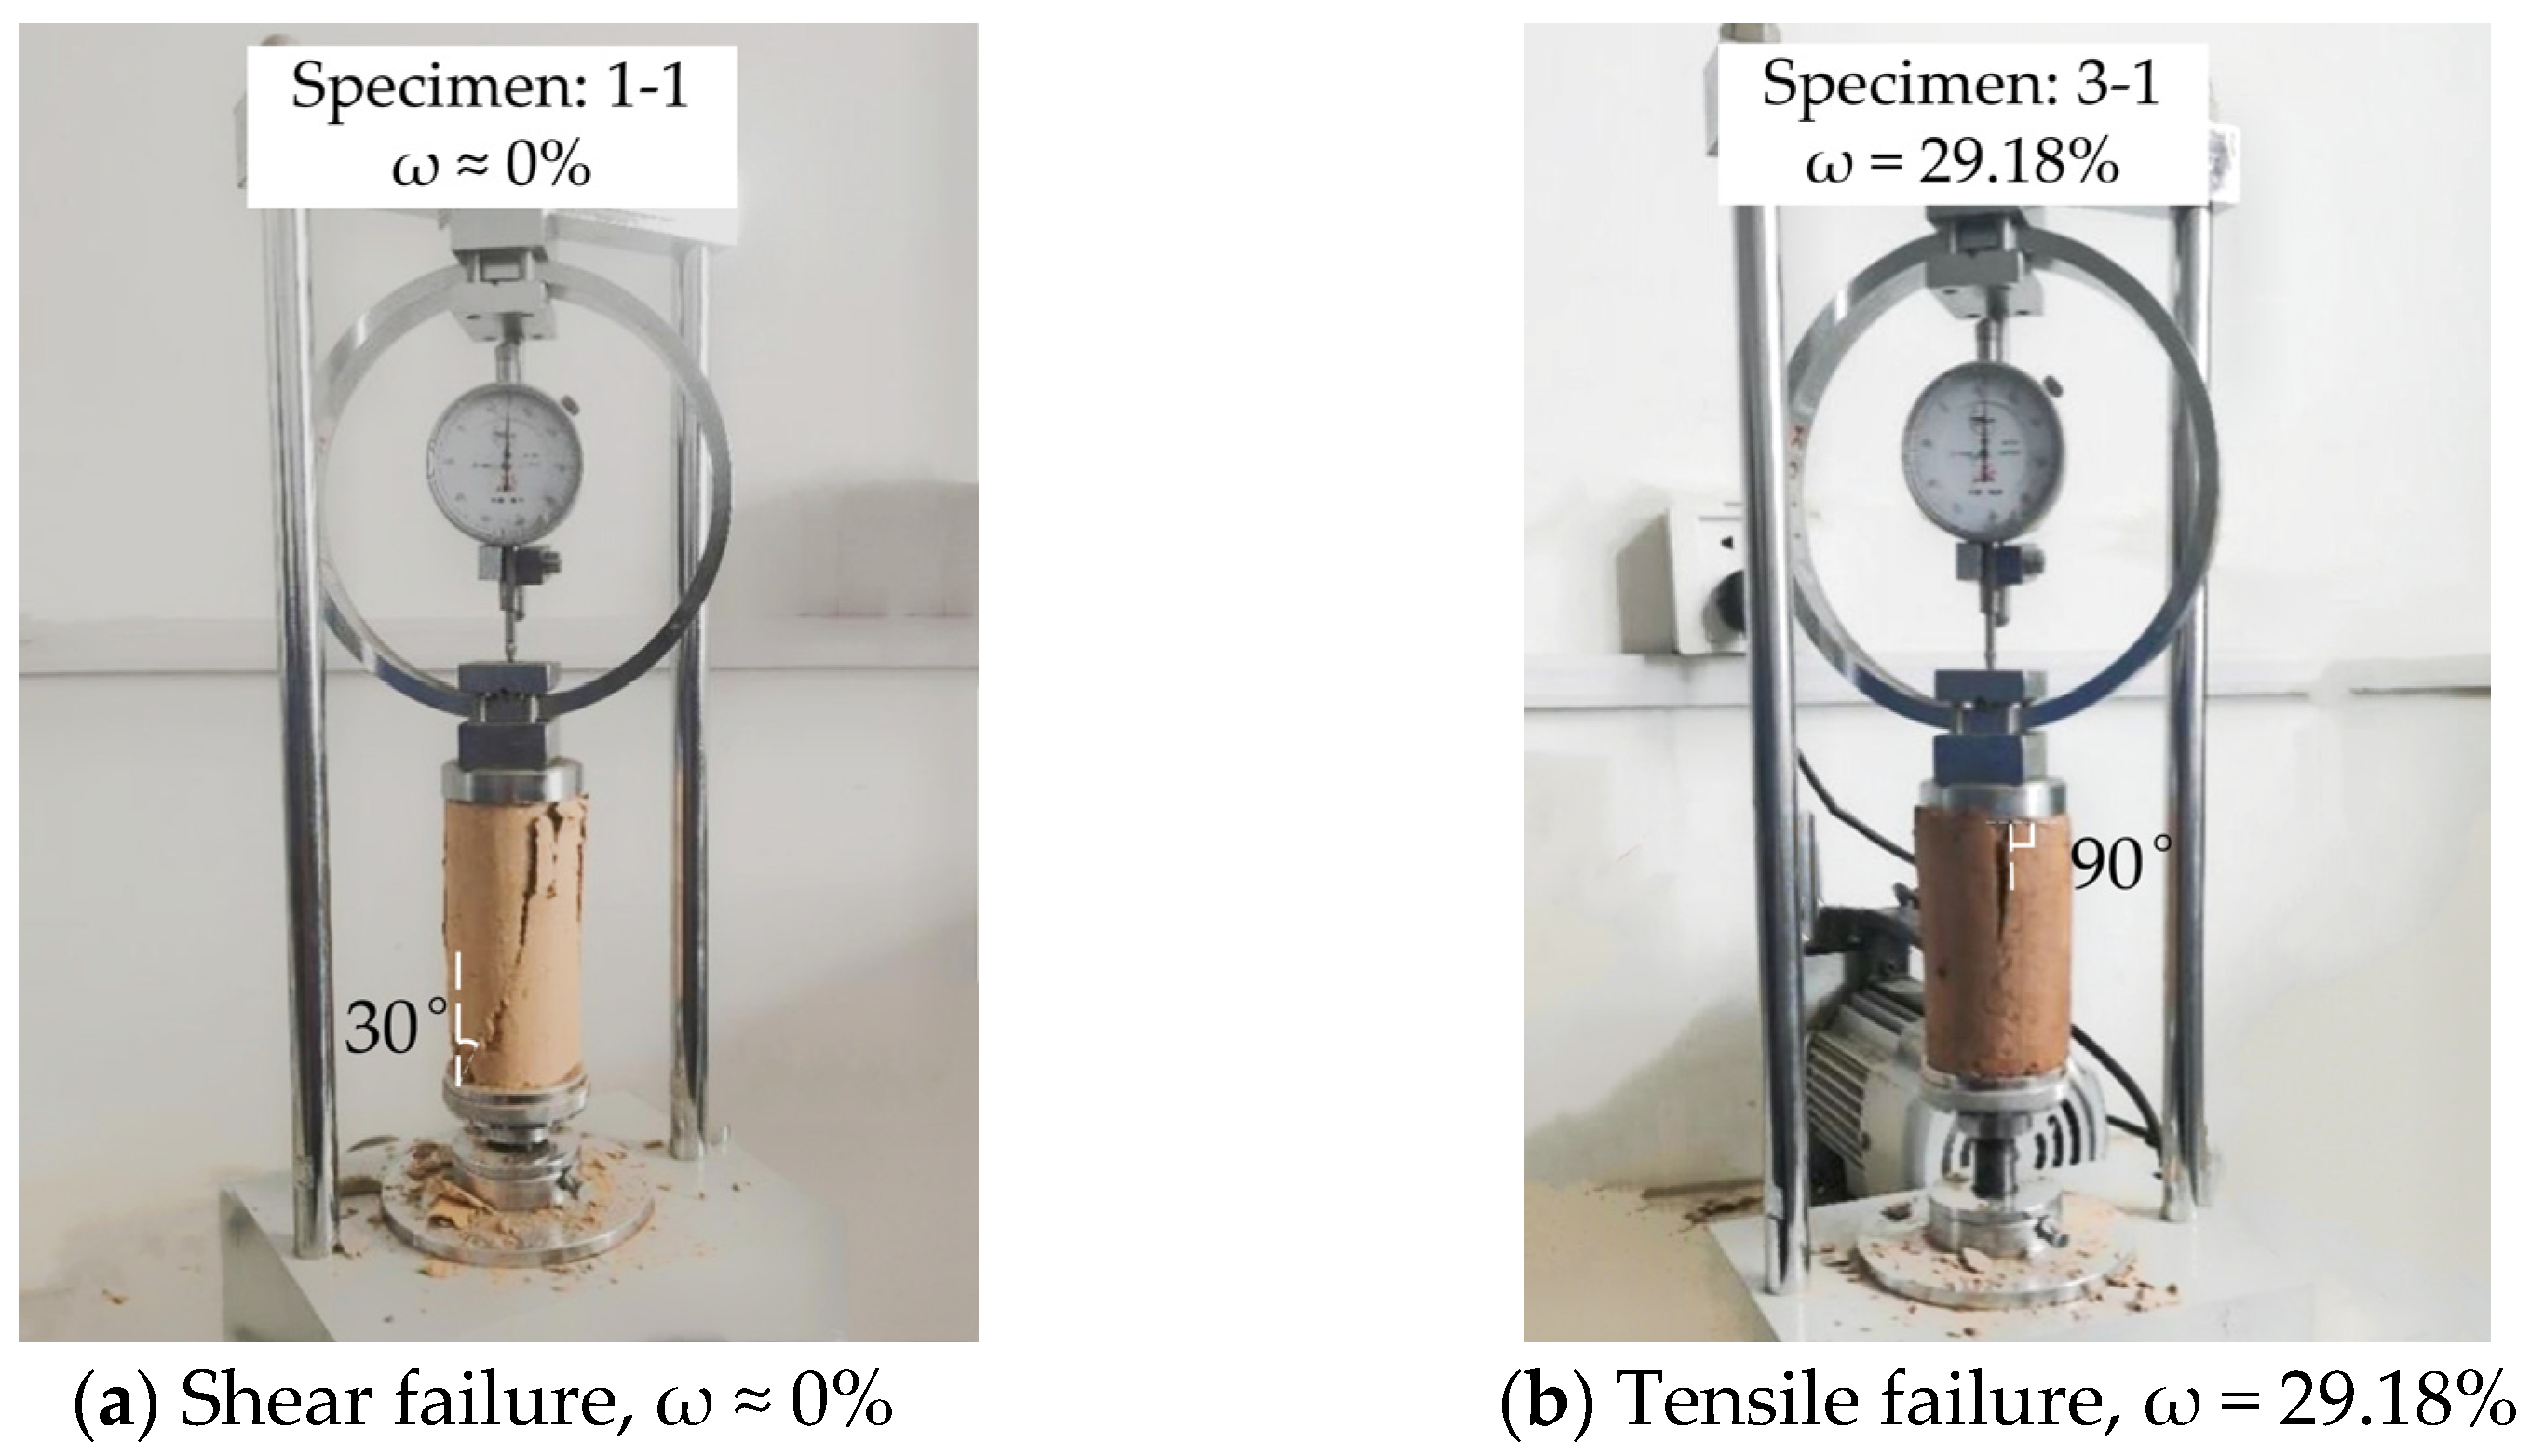
2.2. Uniaxial Compressive Strength Test

In order to obtain the strength-influence law and failure mode of fully weathered sandy shale under different moisture contents, a uniaxial compressive strength test was carried out. The test results thereof also provided the loading basis for the following creep test.
Accordingly with the Industrial Standard of China (JTG E41-2005): Rock Test Procedures for Highway Engineering [18], nine cylindrical standard specimens, each with a diameter of 50 mm and a height of 100 mm, were prepared. Three specimens were taken out to measure the average moisture content, which was 20.35% and considered the natural moisture content. The rest of the specimens were stored in the container, undisturbed.
For the purpose of analyzing the impact of the moisture content on fully weathered sandy shale, the rest of the specimens were divided into three groups (two in each group), whose moisture contents were close to 0%, 20.35% and 29.18%, respectively. The first group of specimens was placed in a drying oven to ensure that the moisture of the specimens was completely evaporated. The second group had the natural moisture content and needed no treatment. The third group was humidified with intermittent water replenishment until the moisture content reached the target content. After all of the specimens met the requirements, the uniaxial compressive mechanical test was carried out with a YSH-2 lime soil unconfined pressure gauge.
The uniaxial compressive strength and failure mode under different moisture conditions are shown in Table 1 and Figure 2.
It can be seen from Table 1 that compressive strength obviously decreased with increases in moisture content. The uniaxial strength value of fully weathered sandy shale was at the maximum in the dry state, which was 1068.8 kPa. The compressive strength was 320.2 kPa when the moisture content was 20.35%. However, the compressive strength was only 191 kPa when the moisture content reached 29.18%, which is about 82% lower than that in the dry state.
As shown in Figure 2, the failure modes of specimens in dry and wet states were different. In the dry state, oblique cracks appeared at the bottom of the specimen as soon as the load action was applied. Soon afterward, blocks shed off from the specimen, and a slight expansion appeared. The cracks gradually developed downward during the test, and the specimen was finally destroyed with the increasing load, forming a 30-degree surface of rupture through the specimen. This failure model can be called tensile shear failure. In the wet state, the expansion of the specimen was rather obvious, and vertical cracks appeared at the top of the specimen. Cracks at the top of the specimen gradually developed along the vertical direction and finally merged with the cracks caused by expansion. The specimen was finally destroyed and formed a vertical rupture surface; this is called tensile failure.
Compared with the wet state, rock in the dry state had relatively high compressive strength. From the microscopic perspective, the reason for this is that fully weathered sandy shale has developed pores and fissures; when moisture content is high, the cohesive strength between the particles would be obviously reduced, resulting in weakening of the integrity of the rock.

2.3. Uniaxial Creep Characteristic Test

In order to study the creep characteristics of the specimens, a uniaxial creep experiment was carried out. Test specimens were standard and cylindrical, each with a diameter of 50 mm and a height of 100 mm, which is the same as in Section 2.2.

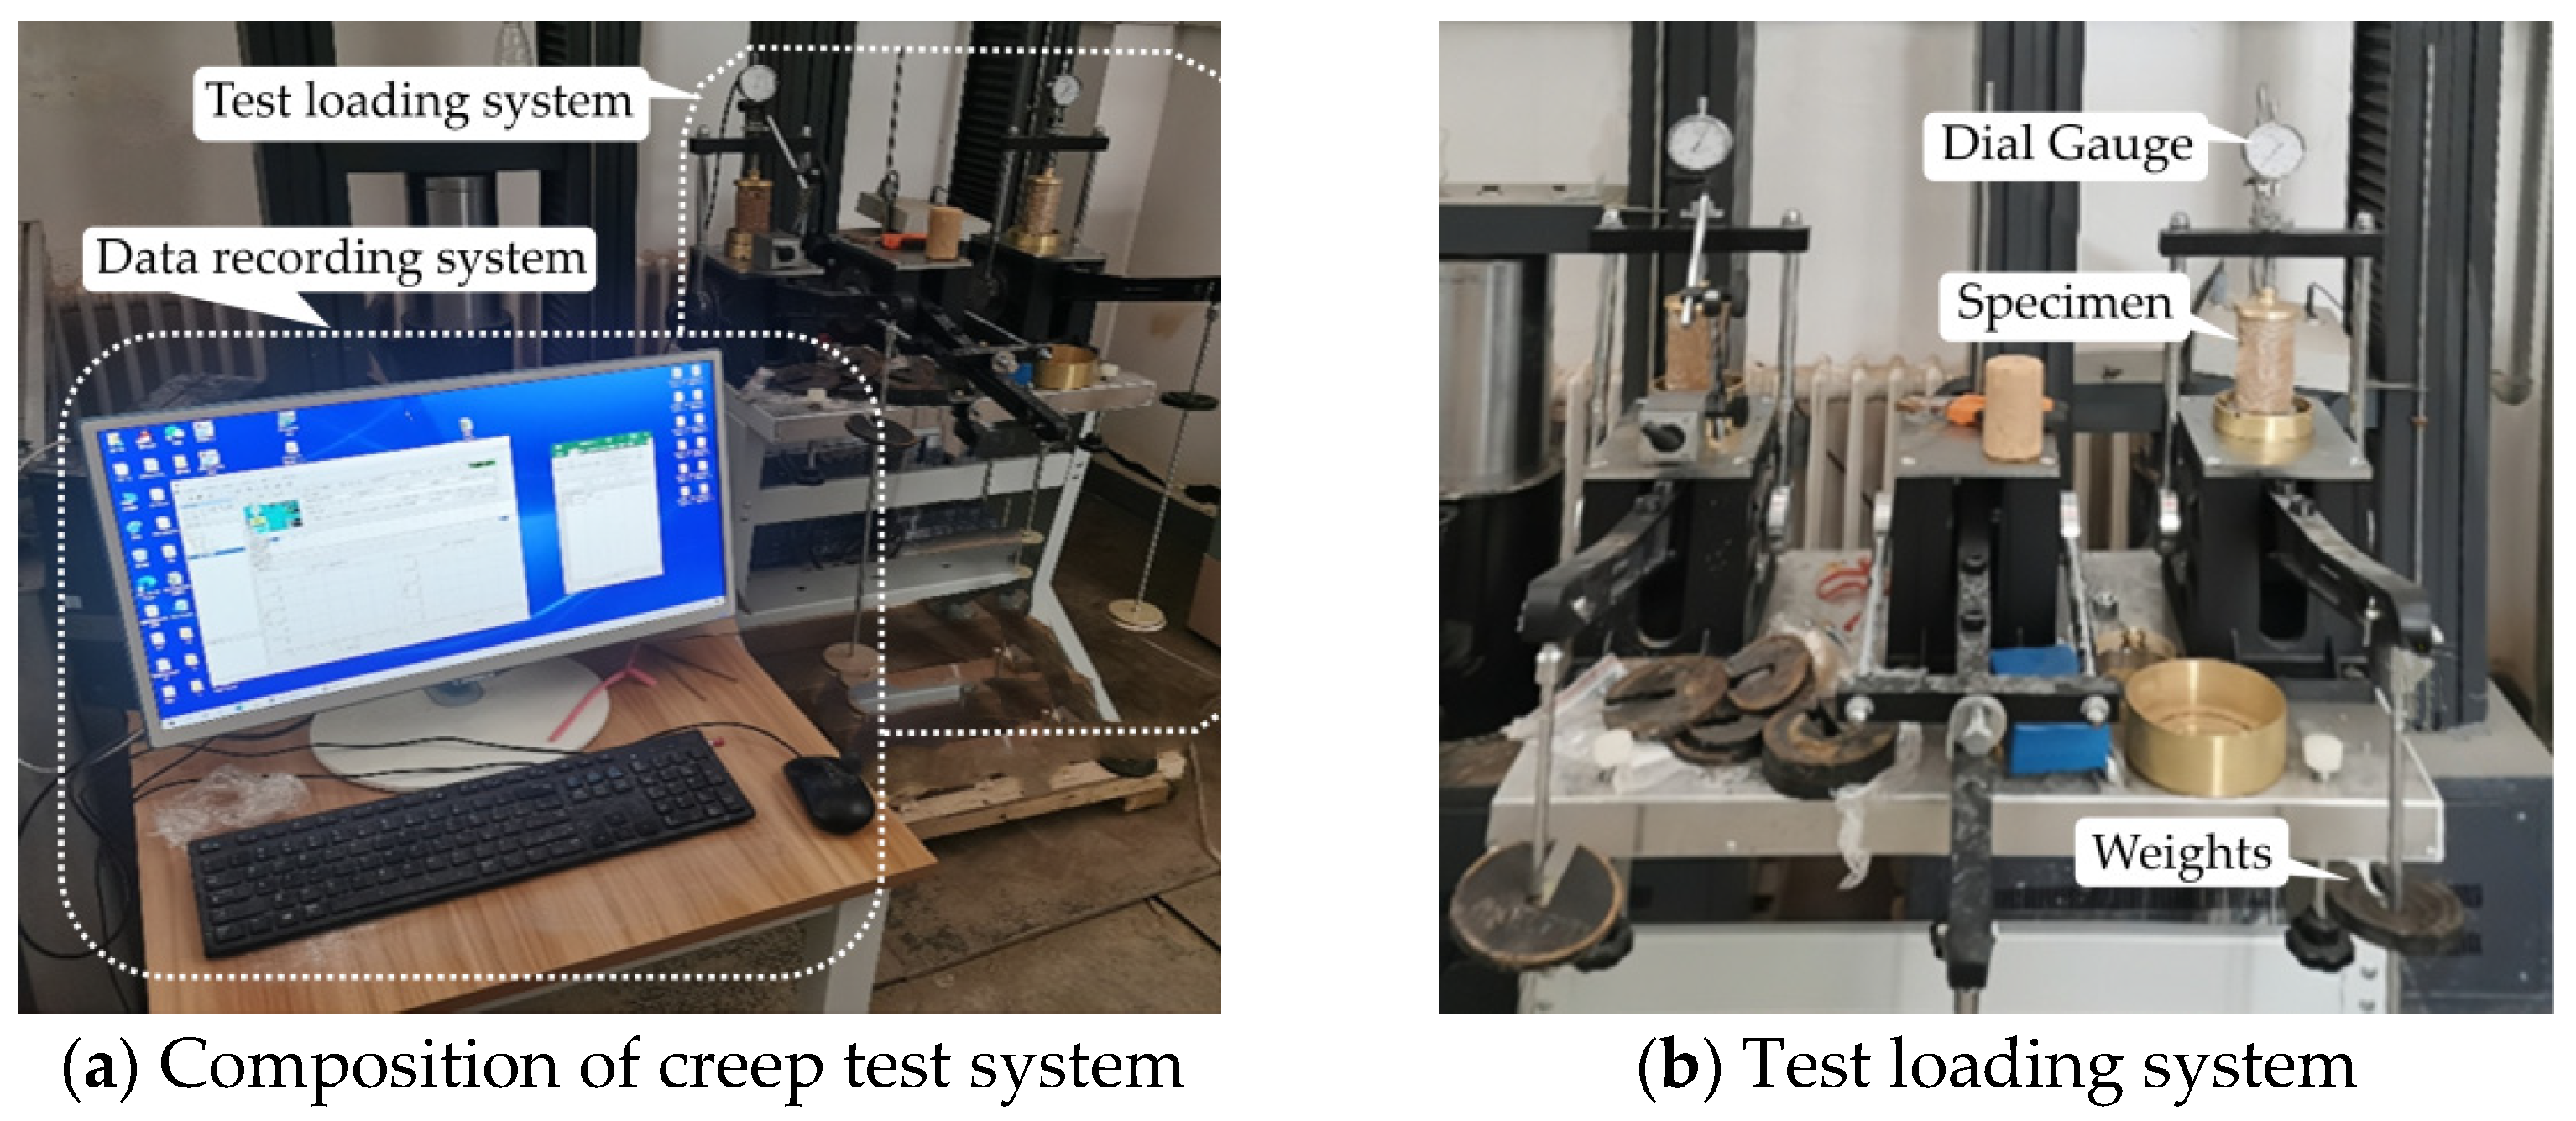
2.3.1. Test Equipment

A triple uniaxial compression rheometer produced by Nanjing Soil Instrument Factory was used as the test equipment (shown in Figure 3). Load could be applied with manual loading weights. The displacement deformation of the specimen was measured with a dial gauge, and the data were recorded in real time.

2.3.2. Test Scheme

(1)
The value of moisture content
In practical engineering, the large deformation disasters of the Lianhua Tunnel Project mainly occur in the rainy season. Thus, referring to the field-measured moisture content value of the project in the rainy season, the moisture contents of the specimens were determined to be 15.80%, 17.85%, 20.35%, 26.91% and 29.18%, respectively.
(2)
Step loading
The loading method was step loading, which is applied step by step; the next step load cannot be applied until the deformation of the specimens becomes stable or the loading time meets the requirement. The specimens were installed at the center position of the equipment base so that the axial of each specimen coincided with the load line of the loading equipment to ensure that the specimen would not be damaged in the action of eccentric force.
According to previous research results, the sand layer would creep when the load reached 12.5~80% of the ultimate pressure [19]. On the basis of the peak strength of the specimen obtained from the uniaxial compressive strength test in Section 2.2, the minimum value of 191 kPa was chosen as the ultimate pressure to ensure that the specimen would not be instantaneously damaged due to high load. Thus, a five-grade load procedure was set up in this test at 20%, 30%, 40%, 50% and 60% of the ultimate pressure, accordingly (the values of the pressure were 38.2 kPa, 57.3 kPa, 76.4 kPa, 95.5 kPa and 114.6 kPa). Each level lasted for 52 h, and the subsequent load level could not be loaded until the specimen deformation had entered a stable state. The instantaneous displacement value of the specimen was recorded with measuring equipment as soon as the load was applied. The data was recorded at every 0.5 h in the first 6 h and at every 2 h after 6 h, at every load level. The indoor temperature was 25 degrees Celsius during the test.

3. Analysis of the Creep Test Results

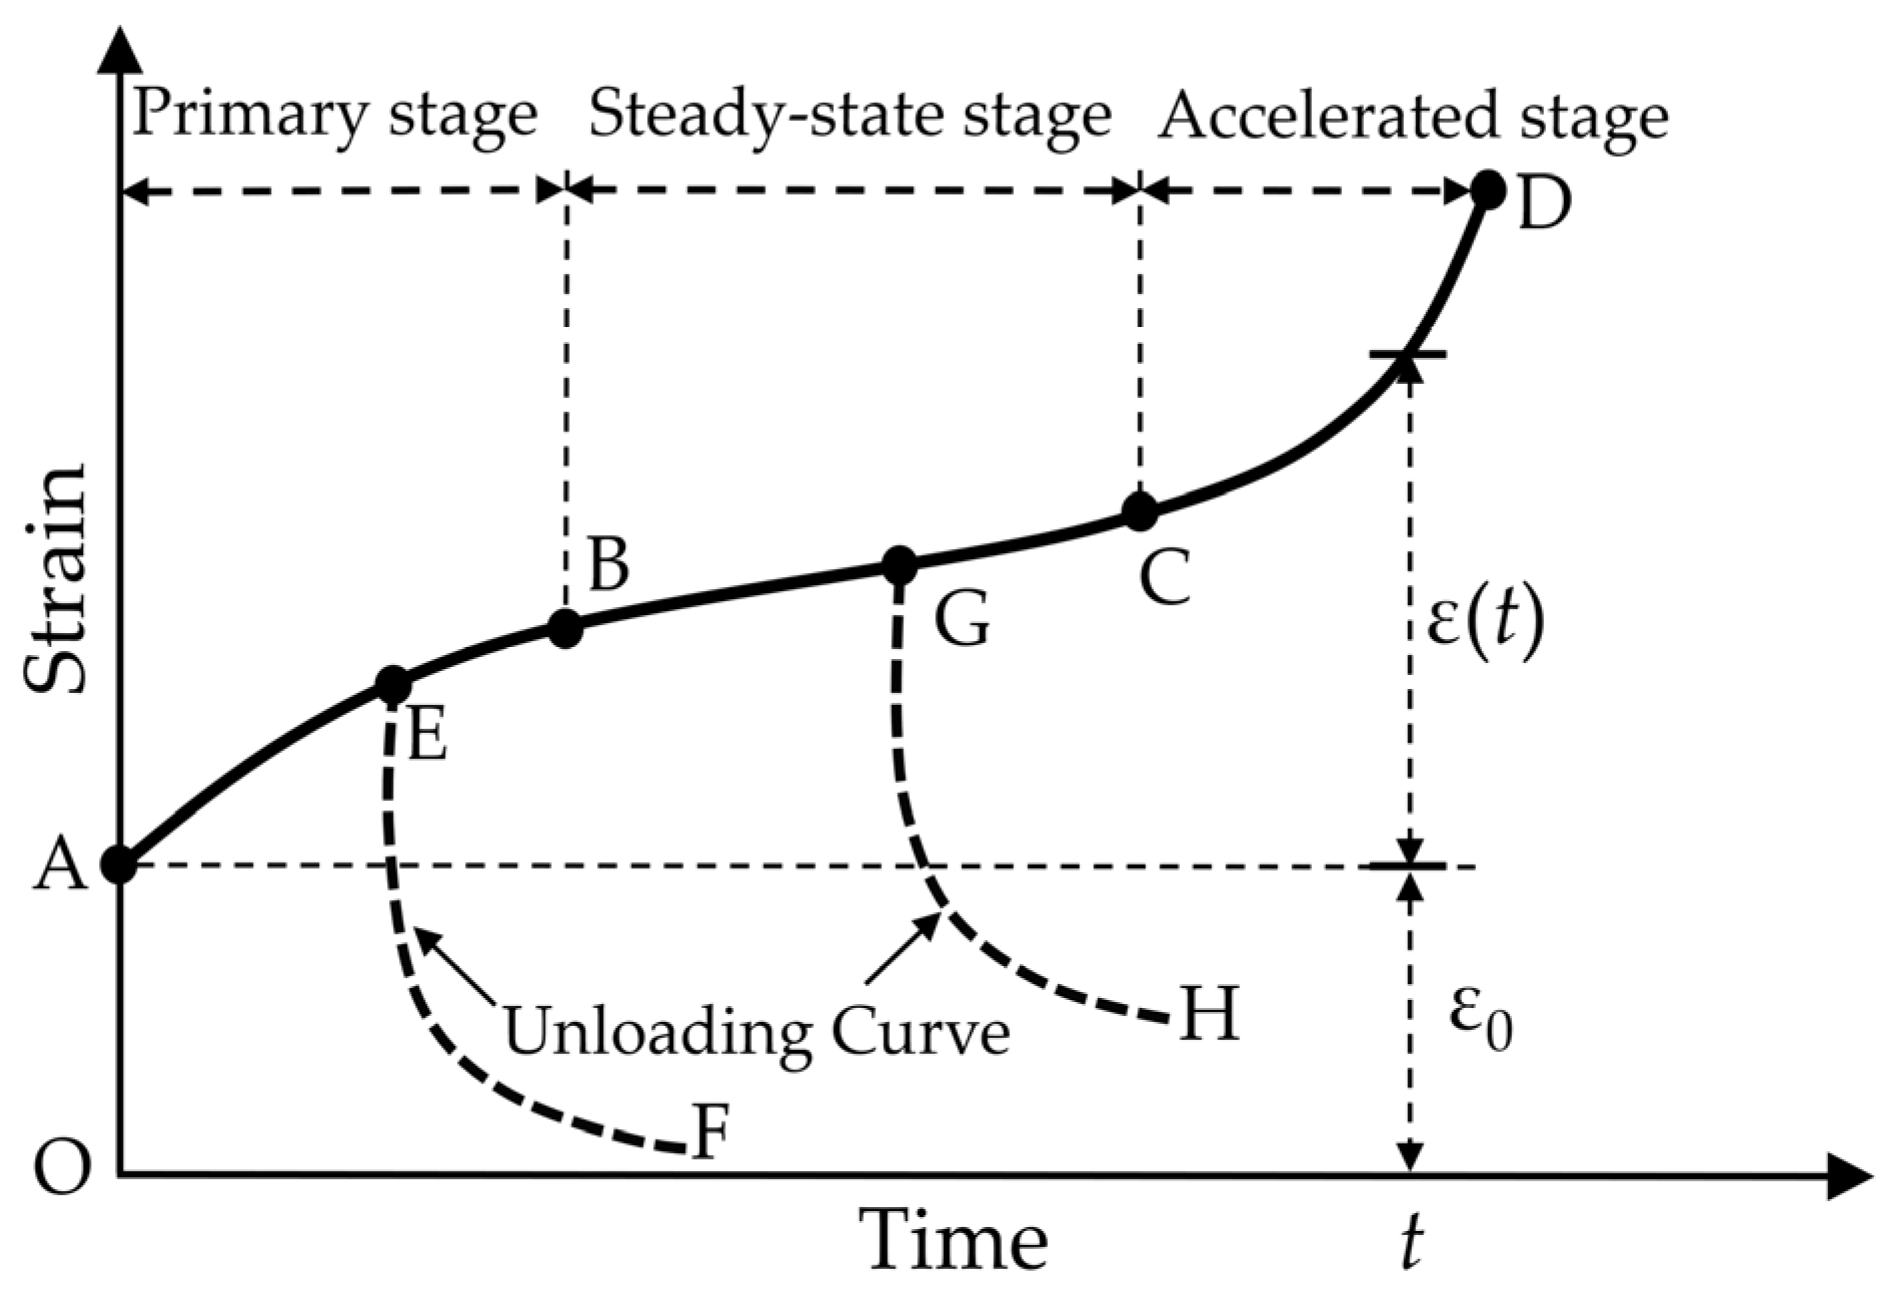
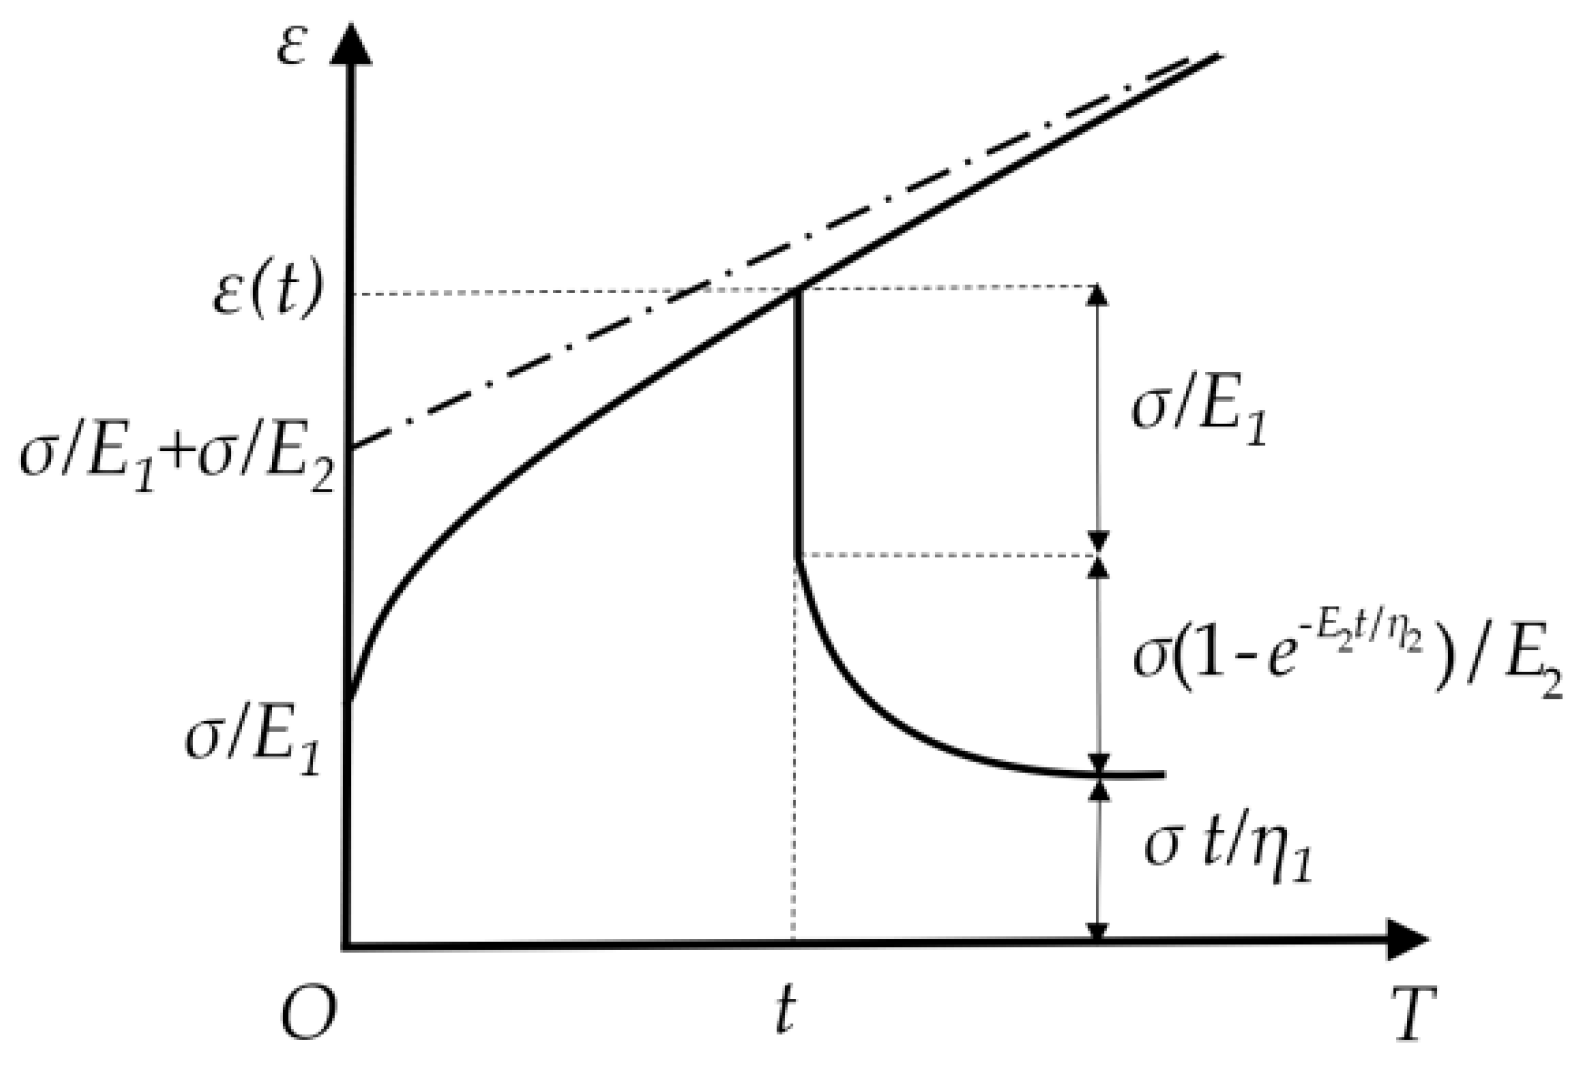
3.1. Typical Rock Creep Curve

The typical creep curve of rocks under certain pressure is shown in Figure 4. In this figure, ε(t) represents the creep strain at time t, and ε0 represents the instantaneous strain under certain pressure. Thus, the total strain at time t under certain pressure is the sum of ε(t) and ε0.
Creep deformation can be divided into three phases: AB, BC and CD. The OA segment is instantaneous strain, with no creep occurring. The AB segment is the waning phase of creep, with a decreasing curve slope and a decreasing deformation rate, that is called the primary creep stage. It can be seen from the unloading curve, EF, that the form of deformation is mainly elastic in this stage. The BC phase is called the steady-state creep stage, where the curve slope is constant and the deformation rate is basically unchanged. It can be seen from the unloading curve, GH, that both elastic and plastic deformation occur in this stage. The CD stage is called the accelerated creep stage, where the curve is upward and the slope increases sharply with time. At this stage, deformation is mainly plastic and the rock is prone to damage.

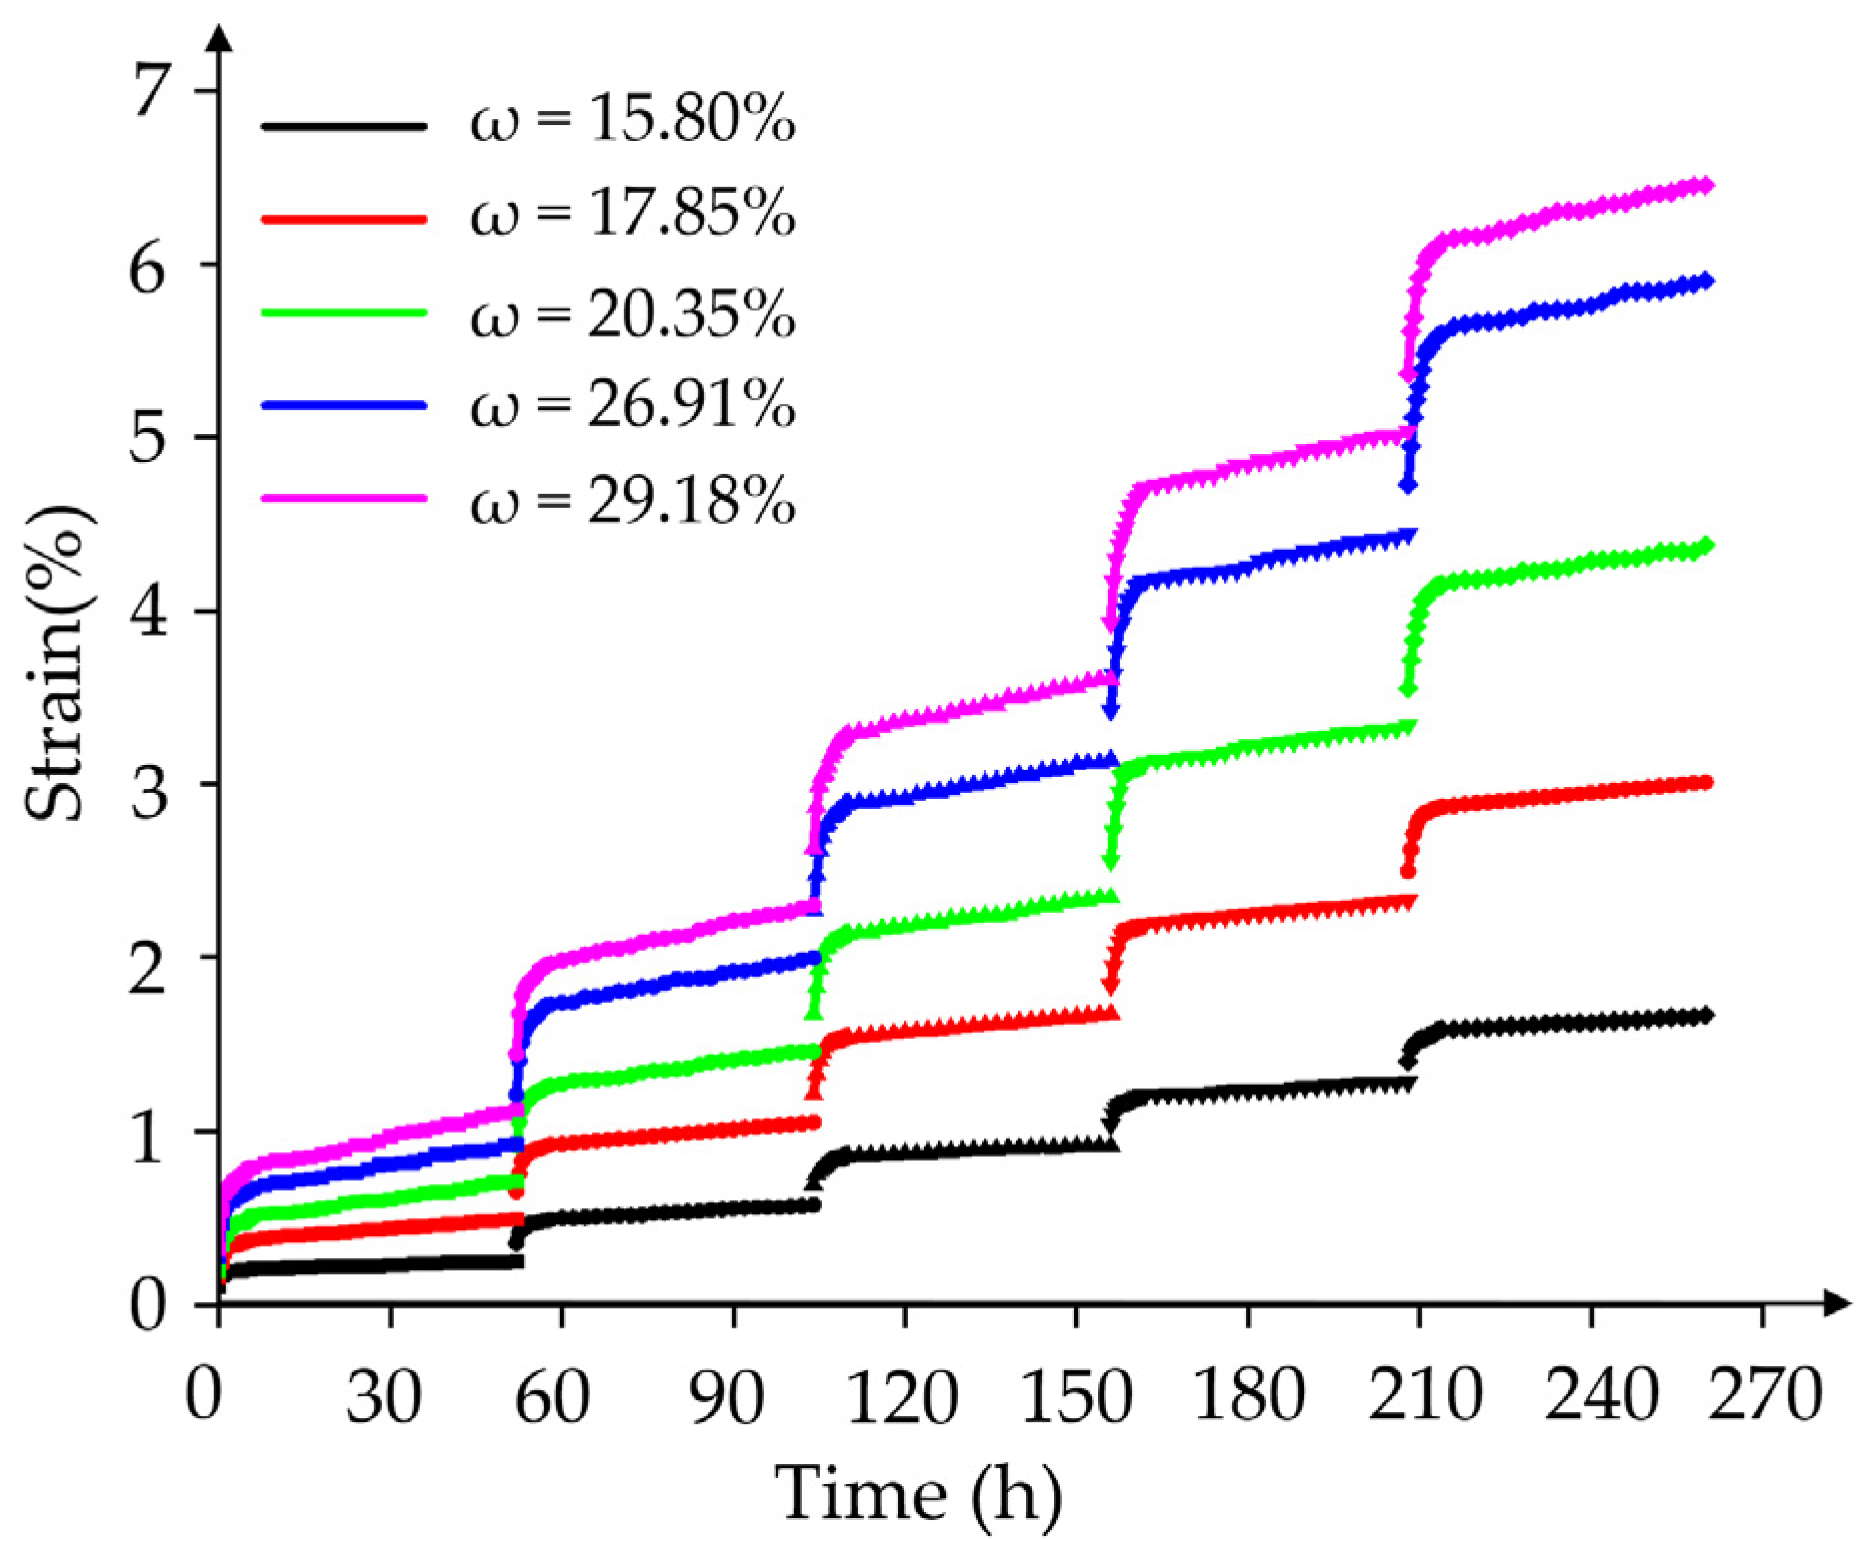
3.2. Creep Characteristic Test-Result Analysis

The uniaxial creep characteristic test results of fully weathered sandy shale with different moisture contents are shown in Figure 5 and Table 2.
The test results show that the creep deformation of fully weathered sandy shale has the following rules:
(1)
The specimen undergoes instantaneous elastic deformation as soon as the load is applied. With an increase in loading time, the creep undergoes the primary creep stage and the steady-state creep stage. At the end of loading, the creep deformation tends to be stable and has not yet entered into the accelerated creep stage;
(2)
The instantaneous elastic deformation of the specimen increases with an increase in moisture content. For instance, under a load of 38.2 kPa, the instantaneous elastic deformation was 0.102 mm with a moisture content of 15.8%, while the instantaneous elastic deformation was 0.321 mm with a moisture content of 29.18%. The instantaneous elastic deformation increased by 68% when the moisture content increased by 45%. The reason for this is that the increase in moisture content weakens the cementation force and the friction force between the soil particles and results in the increasing deformation of the specimen;
(3)
The ratio of creep deformation to total deformation increases with any increase in moisture content. For instance, under a load of 38.2 kPa, the deformation of the specimen with a moisture content of 15.8% accounted for 59% of the total deformation, while the deformation of the specimen with a moisture content of 29.18% accounted for 71%. This shows that the higher the moisture content, the greater the influence of the creep deformation on the total deformation of fully weathered sandy shale, which needs great attention in engineering;
(4)
The test results show that the higher the moisture content and the higher the load level, the longer the initial creep duration of the specimen. For instance, when the moisture content was 15.8%, the duration of the initial creep was 90 min under the load of 38.2 kPa, while the duration of the initial creep was 130 min under the load of 57.3 kPa. When the moisture content was 29.18%, the duration of the initial creep was 120 min under the load of 38.2 kPa, while the duration of the initial creep was 190 min under the load of 57.3 kPa. In other words, when the moisture content increased from 15.8% to 29.18% under the load of 38.2 kPa, the duration of the initial creep increased by 25%. When the load level increased from 38.2 kPa to 57.3 kPa, the duration of the initial creep increased by 31%, with a moisture content of 15.8%. The main reason for this is that the existence of water makes the internal pores of the specimen interpenetrate. A specimen with higher moisture content needs more time to adjust and reorganize the initial particles to reach a steady state;
(5)
Creep deformation increases with any increase in load level or moisture content, and the influence of moisture content is more significant. For instance, when the moisture content was 15.8%, the creep deformation was 0.148 mm under a load of 38.2 kPa and 0.226 mm under a load of 76.4 kPa. That is, the creep deformation increased by 35% when the load increased by 50% under the same moisture content. Under a load of 38.2 kPa, the creep deformation was 0.148 mm when the moisture content of the specimen was 15.8% and 0.800 mm when the moisture content of the specimen was 29.18%. That is, the creep deformation increased by 82% when the moisture content increased by 45% under the same load level;
(6)
The steady creep deformation rate increases with any increase in moisture content or load level, and the influence of moisture content is more significant. For instance, when the moisture content was 15.8%, the steady creep deformation rate was 1.06 × 10⁻³ mm/h under a load of 38.2 kPa and 1.68 × 10⁻³ mm/h under a load of 76.4 kPa. That is, the steady creep deformation rate increased by 37% when the load increased by 50% under the same moisture content. Under a load of 38.2 kPa, the steady creep deformation rate was 1.06 × 10⁻³ mm/h when the moisture content of the specimen was 15.8% and 8.72 × 10⁻³ mm/h when the moisture content of the specimen was 29.18%. That is, the steady creep deformation rate increased by 88% when the moisture content increased by 45% under the same load level. The steady creep deformation rate of the specimen with low moisture content was close to zero, and the creep deformation no longer increased. Therefore, reducing moisture content is beneficial in controlling creep deformation and ensuring stability of rock.

4. Creep Model of Fully Weathered Sandy Shale, Considering the Moisture Content

It can be seen above that moisture content has a significant influence on the creep characteristics of fully weathered sandy shale. In this chapter, based on the Burgers creep model, creep equations of fully weathered sandy shale, considering moisture content, are established in order to describe its creep behavior more comprehensively.

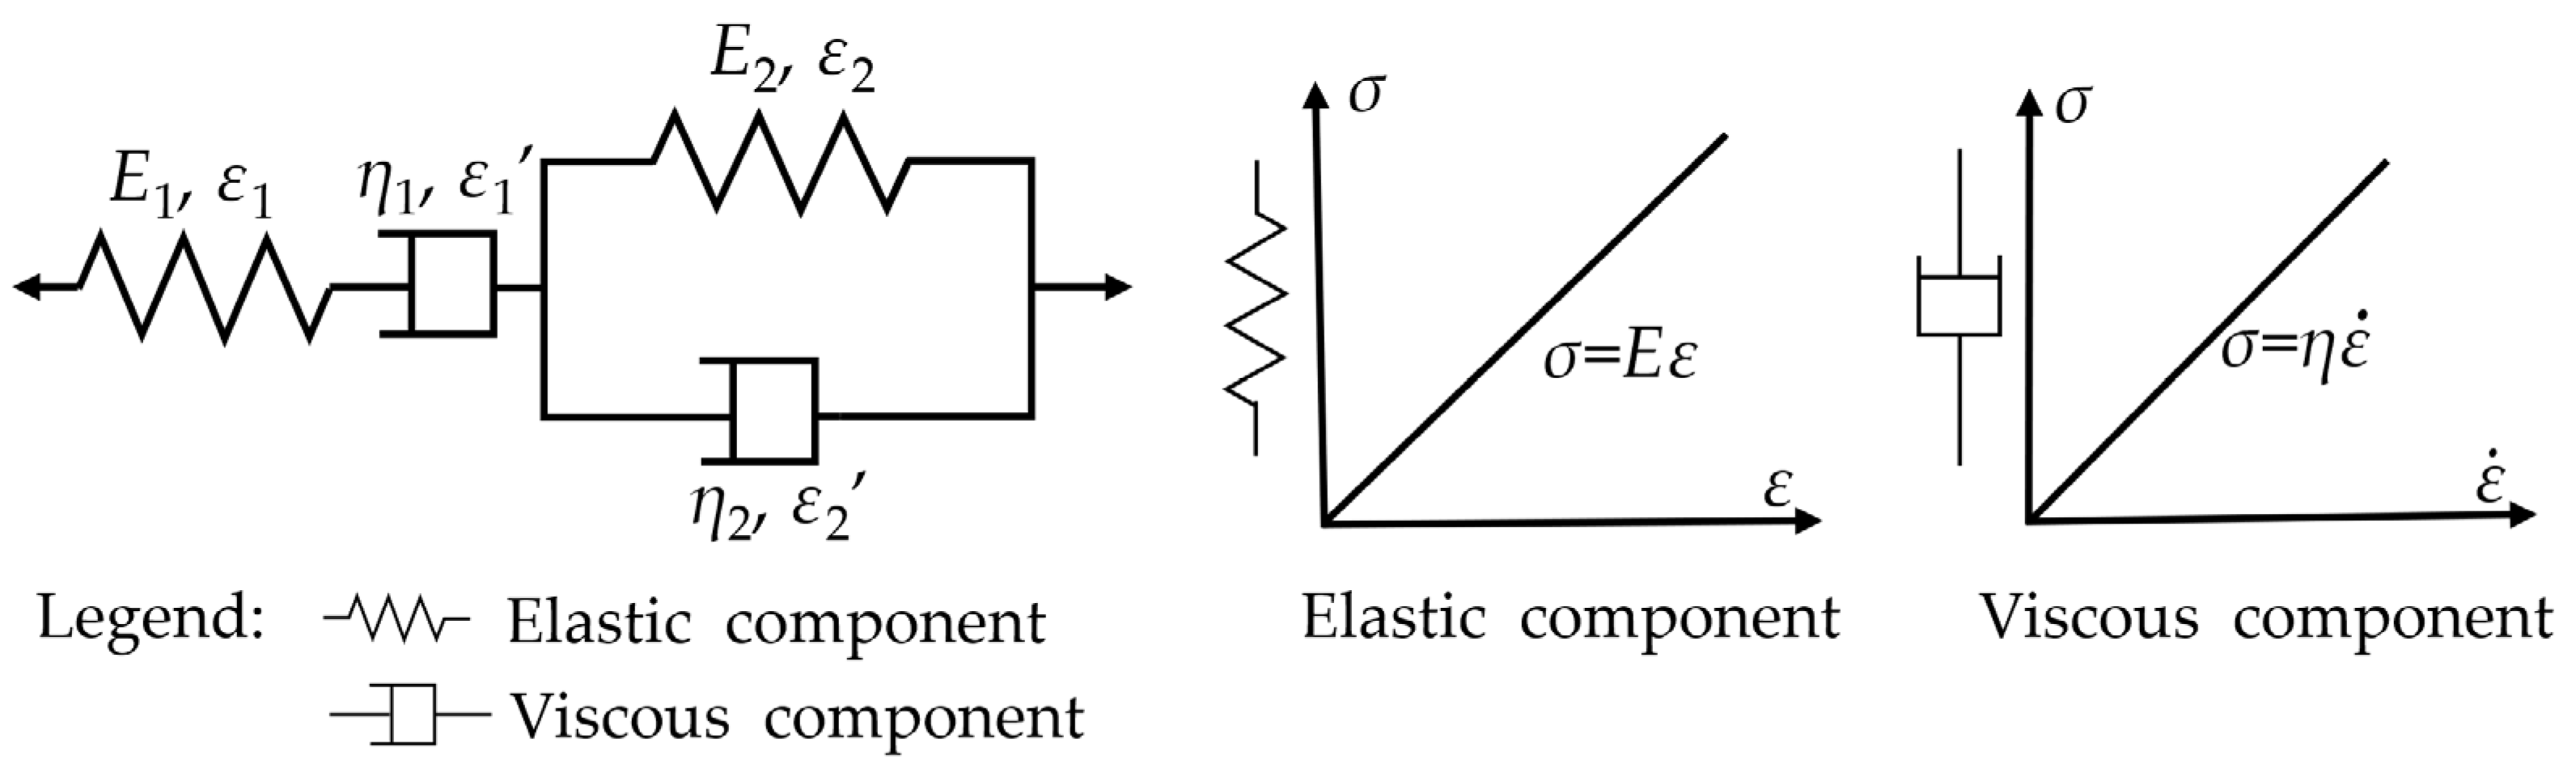
4.1. Creep Model of Fully Weathered Sandy Shale

The creep experiment curve of the fully weathered sandy shale has the following characteristics:
(1)
Instantaneous deformation occurs at the moment of loading and the deformation of the specimen can be partially recovered after unloading, so there must be elastic elements in the creep model.
(2)
There is a nonlinear relationship between deformation and time. The deformation of the specimen increases with an extension of loading time.
(3)
The uniaxial compressive strength of the specimen was low and the integrity was poor. The creep phenomenon appeared at a relatively low stress level.
Based on the above points, the Burgers model, which is suitable for viscoelastic soil, was chosen as the basic creep model for fully weathered sandy shale. The Burgers creep model is shown in Figure 6. The elastic component shown in the figure is represented with a spring, and its stress–strain relationship satisfies Hooke’s law. The viscous component shown in the figure is represented with a dashpot, and its stress–strain rate relationship is linear. If the elastic component and the viscous component are connected in series, the model is called Maxwell-body. If the elastic component and the viscous component are connected in parallel, the model is called Kelvin-body. In Figure 6, E1 and E2 are the elastic coefficients of Maxwell-body and Kelvin-body, respectively, and ε1 and ε2 are the corresponding elastic strain; η and η2 are the viscosity coefficients of Maxwell-body and Kelvin-body, respectively, and ε1‘ and ε2‘ are the corresponding viscous strain.
The constitutive equation of the Burgers model is shown in Equation(1):
σ + ( η 2 E 1 + η 2 E 2 + η 1 E 2 ) σ ˙ + η 1 η 2 E 1 E 2 σ ¨ = η 1 ε ˙ + η 1 η 2 E 2 ε ¨
In this equation, σ is the initial compressive stress; σ ˙ is the stress rate; σ ¨ is the change rate of the stress rate; ε ˙ is the strain rate; ε ¨ is the change rate of the strain rate; and the meanings of E1, E2, η1 and η2 are as described above.
When the stress, σ, is constant, the creep equation is simplified as Equation (2) and the Burgers creep curve is shown in Figure 7, where t is loading time; ε is the strain of surrounding rock; and the meanings of E1, E2, η1 and η2 are as described above.
ε ( t ) = σ E 1 + σ η 1 t + σ E 2 ( 1 e E 2 η 2 t )
Through the methods of data fitting and regression analysis, creep parameters in the Burgers model can be obtained on the basis of creep experiment results. The fitting results and the values of each parameter are shown in Figure 8 and Table 3. All of the correlation coefficients, R2, of the equations were greater than 0.99, indicating that the Burgers model fits well with the experimental data.

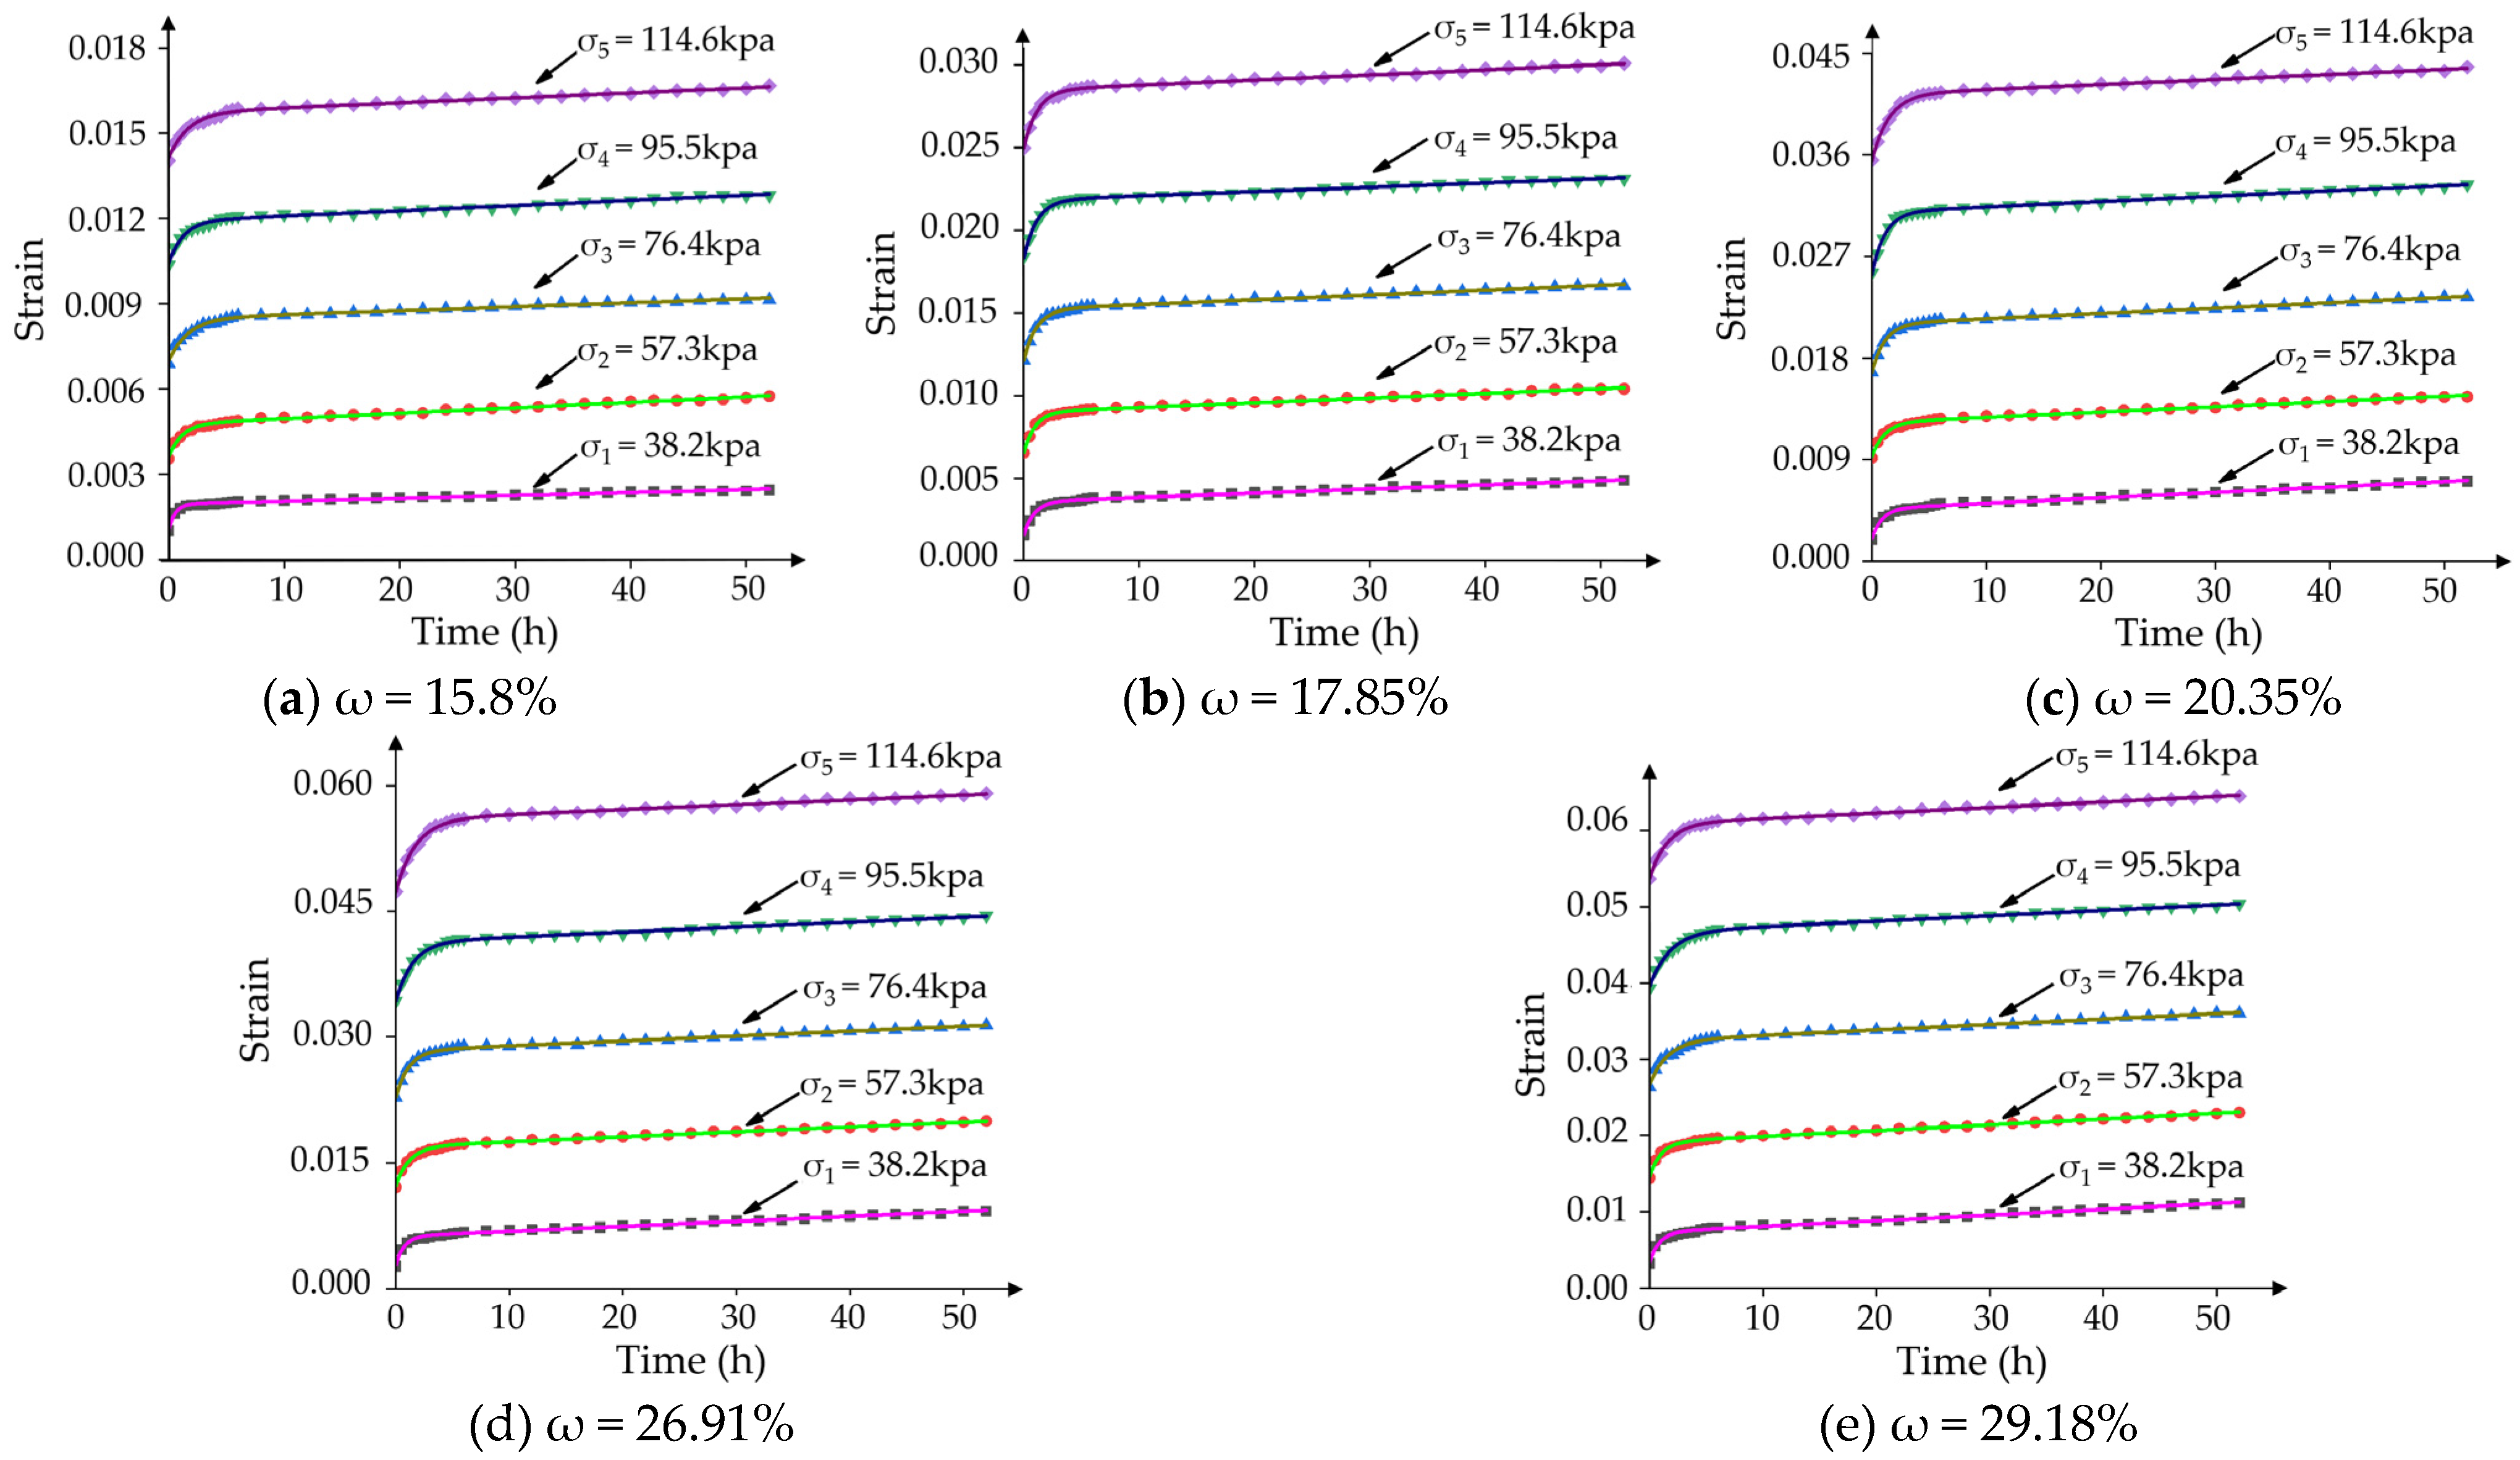
4.2. Analysis of Creep Model Parameters

(1)
Effects of moisture content on creep model parameters
It can be seen from Table 3 that E1/E2/η1/η2 decrease with any increase in moisture content when the load level is constant. For example, when the moisture content of the specimen increased from 15.8% to 29.18%, creep parameter E1 decreased by 69%, E2 decreased by 77%, η1 decreased by 81% and η2 decreased by 65%, correspondingly, under a load of 38.2 kPa. According to the research results of Yang et al. [20], elastic coefficient E1 is negatively correlated with instantaneous elastic deformation; elastic coefficient E2 is negatively correlated with initial creep; viscosity coefficient η1 is negatively correlated with the initial creep rate, initial creep and the steady creep rate; and viscosity coefficient η2 is negatively correlated with the initial creep rate. Therefore, it can be seen that with an increase in moisture content, the instantaneous elastic deformation, initial creep, initial creep rate and steady creep rate would increase significantly, which is consistent with the conclusions of the creep test.
(2)
Effects of load level on creep model parameters
It can be seen from Table 3 that with an increase in load value, E1 decreases while E2/η1/η2 increase. For instance, when the load value increased from 38.2 kPa to 114.6 kPa, creep parameter E1 decreased by 56%, E2 increased by 26%, η1 increased by 44% and η2 increased by 70%, with a constant moisture content of 15.8%. The changes of E1 and η2 were more significant, which means that with an increase in load level, instantaneous elastic strain increases while the initial creep rate decreases. The reason for this is that as the degree of compaction of the specimen increases under the action of the previous load, the friction force and the interlocking force between soil particles increases, which leads to a decrease in the initial creep deformation rate and prolongation of the initial creep stage. However, even though the increase in instantaneous elastic creep was greater than the decrease in initial creep deformation, the total creep deformation still showed an increasing trend, which is consistent with the creep test results.

4.3. Establishment of the Creep Equations Considering the Moisture Content

The creep equation for fully weathered sandy shale with different moisture contents can be conducted as Equation (3):
ε = { σ 16,240 + t 4,776,833 σ + 1 e 55,829 73,798 t 55,829 σ ,   ω = 15.80 % σ 9729 + t 2,704,260 σ + 1 e 25,557 27,274 t 25,557 σ ,   ω = 17.85 % σ 7185 + t 1,651,682 σ + 1 e 17,633 20,501 t 17,633 σ ,   ω = 20.35 % σ 5363 + t 1,293,926 σ + 1 e 12,791 16,557 t 12,791 σ ,   ω = 26.91 % σ 4542 + t 1,049,202 σ + 1 e 13,093 18,177 t 13,093 σ ,   ω = 29.18 %
The relationship of the creep parameters (elastic coefficients E1/E2 and viscosity coefficients η1/η2) and the moisture content, ω, of fully weathered sandy shale can be obtained with the fitting regression method, as shown in Equations (4)–(7).
E 1 = 5.385 × 10 11 ω 6.399 + 4678
E 2 = 3.404 × 10 16 ω 9.932 + 13,390
η 1 = 8.326 × 10 14 ω 6.968 + 1.083 × 10 6
η 2 = 1.971 × 10 19 ω 12.13 + 16,100
The correlation coefficient, R2, of each fitting equation was greater than 0.99, indicating that the Burgers model fit well with the experimental data. Through means of substituting the above relationship into the Burgers creep equation, the creep equation considering the moisture content can be achieved, as shown in Equation (8). This equation can describe the creep behavior of fully weathered sandy shale with moisture content in the range of 15.8~29.18%.
ε = σ 5.385 × 10 11 ω 6.399 + 4678 + t 8.326 × 10 14 ω 6.968 + 1.083 × 10 6 σ + 1 e 3.404 × 10 16 ω 9.932 + 13,390 1.971 × 10 19 ω 12.13 + 16,100 3.404 × 10 16 ω 9.932 + 13,390 σ
In this equation, ε is the strain of fully weathered sandy shale, σ is the stress of fully weathered sandy shale (kPa), ω is the moisture content of fully weathered sandy shale, t is creep time (h) and Pu is the ultimate pressure of fully weathered sandy shale.
In order to verify the accuracy of the creep equation, the calculation results of Equation (8) were compared with the creep experimental data. Results are shown in Figure 9. It can be seen that the creep experiment curve is basically consistent with the obtained creep equation curve, proving that the creep equation can describe the creep behavior of fully weathered sandy shale.

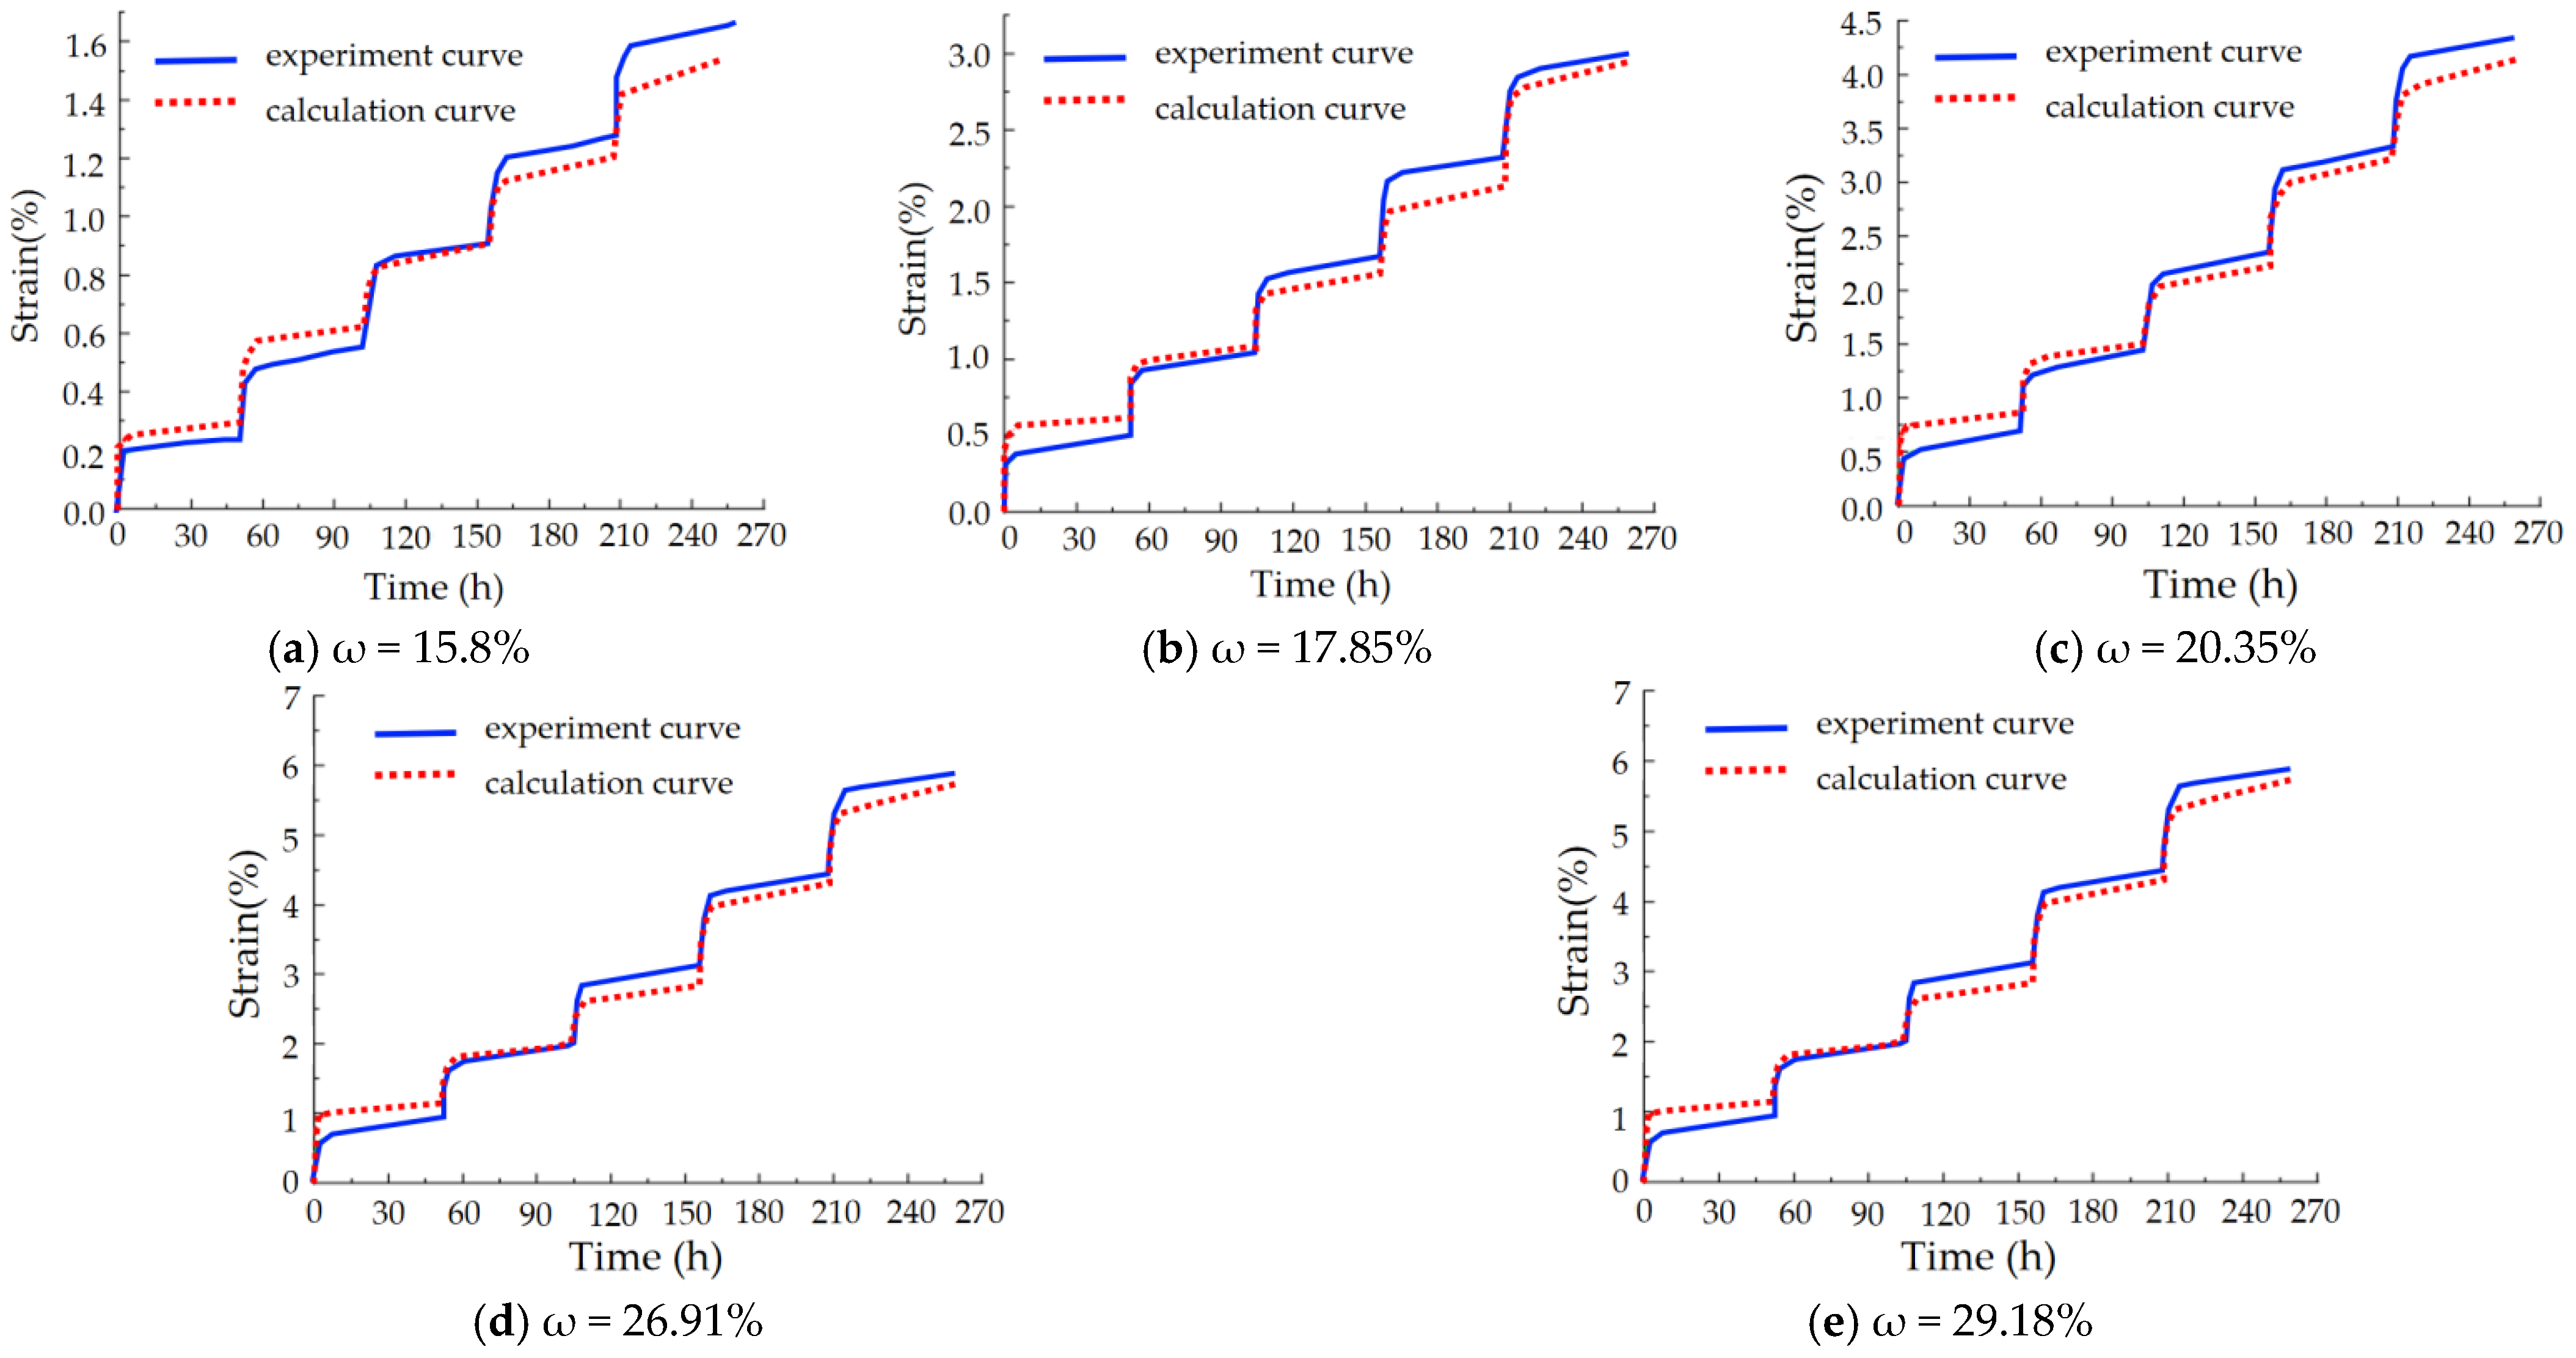
4.4. Discussion of the Creep Equations Considering the Moisture Content

Based on the compressive and creep test results and the Burgers model, a creep constitutive equation of fully weathered sandy shale was obtained and is shown in Equation (8). It can be seen that creep strain is positively correlated with the first power of σ and positively correlated with the sixth or higher power of moisture content. This is a quantitative result of the influence of moisture content and load level, meaning that the greater the moisture content, the higher the load level, resulting in larger creep deformation, and moisture content has a more significant influence on creep behavior than does load level. In addition, it also can be seen that the second and the third expression in Equation (8) are related to loading time, t, of which the second term is the expression of the first power of t and the third term is the expression of the reciprocal of the exponential function of t. That is to say, when the moisture content and the load level are fixed values, the creep strain values show a nonlinear growth trend with an increase in time and the creep rate becomes slower and slower until the creep deformation reaches a certain degree and the rock arrives at a stable state.
In particular, since the creep test was carried out under the condition of moisture content of 15.8~29.18% and load levels of 20~60% of the ultimate compressive strength, the optimum-use condition of Equation (8) is when the moisture content is between 15.8 and 29.18% and the load level is no more than 60% of the ultimate compressive strength. When the load exceeds this limit, the soil is likely to enter the accelerated creep stage, which would affect the accuracy of calculation results. However, this equation still has an important guiding significance to the large-deformation disasters of a large amount of sandy-shale tunnel excavation projects. Using this equation, creep deformation during the construction and trial periods can be judged under measured water-content and stress conditions. In summary, this creep model is not only a modification to the Burgers model but also a powerful supplement to the theory of creep characteristics of sandy shale.

5. Conclusions

(1)
Fully weathered sandy shale is easy to disintegrate in water, and its strength is high in the dry state. With an increase in moisture content, the compressive strength of the specimen decreases significantly. The compressive strength of the specimen with a moisture content of 29.18% was only 18% of the specimen in the dry state.
(2)
The creep characteristic curves of fully weathered sandy shale under the load of 20~60% of the ultimate strength had only two creep stages, the primary creep stage and the steady-state creep stage, with no accelerated creep stage. The creep deformation increased with time nonlinearly.
(3)
The creep behavior of fully weathered sandy shale is obviously affected by moisture content and load level. The greater the moisture content, the higher the load level, resulting in larger instantaneous elastic deformation, a larger steady creep rate and greater creep deformation. The duration of initial creep is longer as well. Moisture content has a more significant influence on creep behavior than does load level. In the later part of the steady-state creep stage, the creep rate of specimens with low moisture content was close to zero, the creep deformation no longer increased and the specimens entered a stable state. Therefore, it is quite beneficial to reduce moisture content in order to control creep deformation.
(4)
The elastic coefficients E1/E2 and viscosity coefficients η1/η2 are correlated with moisture content and load level. E1/E2/η1/η2 decrease with an increase in moisture content; E1 decreases with an increase in load level while E2/η1/η2 increase with an increase in load level.
(5)
The creep model of fully weathered sandy shale, considering moisture content, fits well with the creep experiment. It is expected to provide a theoretical basis for the large deformation mechanism and disaster treatment of fully weathered sandy shale.

Author Contributions

Conceptualization, L.Z. and Z.H.; methodology, C.H.; software, Z.L.; validation, X.W. and L.W.; formal analysis, L.Z.; investigation, Z.L.; resources, L.Z.; data curation, C.H.; writing—original draft preparation, Z.H.; writing—review and editing, C.H.; visualization, Z.L.; supervision, L.W.; project administration, X.W.; funding acquisition, L.Z. All authors have read and agreed to the published version of the manuscript.

Funding

This work was supported by the National Key Research and Development Project (2020YFB1600500), the National Natural Science Foundation of China (52179120, 52171267, 51909270, 51909147) and the Key Projects of Jiangxi Provincial Department of Communications (2020C0005).

Institutional Review Board Statement

Not applicable.

Informed Consent Statement

Not applicable.

Data Availability Statement

The data used to support the findings of this study are available from the corresponding author upon request.

Conflicts of Interest

The authors declare no conflict of interest.

References

  1. Zhou, X.; Pan, X.; Berto, F. A state-of-the-art review on creep damage mechanics of rocks. Fatigue Fract. Eng. Mater. Struct. 2022, 45, 627–652. [Google Scholar] [CrossRef]
  2. Yang, C.; Daemen, J.; Yin, J. Experimental investigation of creep behavior of salt rock. Int. J. Rock Mech. Min. Sci. 1999, 2, 233–242. [Google Scholar] [CrossRef]
  3. Yang, S.; Jiang, Y. Triaxial mechanical creep behavior of sandstone. Min. Sci. Technol. 2010, 3, 339–349. [Google Scholar] [CrossRef]
  4. Xie, S.; Shao, J.; Xu, W. Influences of chemical degradation on mechanical behavior of a limestone. Int. J. Rock Mech. Min. Sci. 2011, 5, 741–747. [Google Scholar] [CrossRef]
  5. Yang, S.; Jing, H.; Cheng, L. Influences of pore pressure on short-term and creep mechanical behavior of red sandstone. Eng. Geol. 2014, 179, 10–23. [Google Scholar] [CrossRef]
  6. Sun, X.; Miao, C.; Jiang, M.; Zhang, Y.; Yang, L.; Guo, B. Experimental and theoretical study on creep behaviors of sandstone with different moisture contents based on modified Nishihara model. Chin. J. Rock Mech. Eng. 2021, 40, 2411–2420. [Google Scholar]
  7. Zhu, H.; Ye, B. Experiment study on creep mechanical properties of tunnel surrounding rock under saturated state. Chin. J. Rock Mech. Eng. 2002, 21, 1791–1796. [Google Scholar]
  8. Chen, Q.; Nishida, K.; Iwamoto, T.; Kameya, H.; Itabasi, T. Creep behavior of sedimentary soft rock under triaxial compression. Chin. J. Rock Mech. Eng. 2003, 22, 905–912. [Google Scholar]
  9. Maranini, E.; Brignoli, M. Creep behavior of a weak rock: Experimental characterization. Int. J. Rock Mech. Min. 1999, 36, 127–138. [Google Scholar] [CrossRef]
  10. Zohravi, S.E.; Lakirouhani, A.; Molladavoodi, H.; Medzvieckas, J.; Kliukas, R. A new constitutive model for the time-dependent behavior of rocks with consideration of damage parameter. J. Civ. Eng. Manag. 2022, 28, 223–231. [Google Scholar] [CrossRef]
  11. Zhu, X.; Yang, S.; Xia, H.; Xia, Q.; Zhang, G. Joint support technology and its engineering application to deep soft rock tunnel with strong creep. Geotech. Geol. Eng. 2020, 38, 3403–3414. [Google Scholar] [CrossRef]
  12. Wang, Y.; Liu, Y.; Wang, Z.; Zhang, X.; Hui, Y.; Li, J. Investigation on progressive failure progress of tunnel lining induced by creep effect of surrounding rock: A case study. Eng. Fail. Anal. 2023, 144, 106946. [Google Scholar] [CrossRef]
  13. Li, W.; Han, Y.; Wang, T.; Ma, J. DEM micromechanical modeling and laboratory experiment on creep behavior of salt rock. J. Nat. Gas Sci. Eng. 2017, 46, 38–46. [Google Scholar] [CrossRef]
  14. Okubo, S.; Nishimatsu, Y.; Fukui, K. Complete creep curves under uniaxial compression. Int. J. Rock Min. Sci. Geomech. Abstr. 1991, 28, 77–82. [Google Scholar] [CrossRef]
  15. Wang, X.; Huang, Q.; Lian, B.; Liu, N.; Zhang, J. Modified Nishihara rheological model considering the effect of thermal-mechanical coupling and its experimental verification. Adv. Mater. Sci. Eng. 2018, 2018, 4947561. [Google Scholar] [CrossRef] [Green Version]
  16. Gutierrez-Ch, J.; Senent, S.; Graterol, E.; Zeng, P.; Jimenez, R. Rock shear creep modelling: DEM-Rate process theory approach. Int. J. Rock Mech. Min. 2023, 161, 105295. [Google Scholar] [CrossRef]
  17. Zhang, X.; Wei, C.; Zhang, H. Analysis of Surrounding Rock Creep Effect on the Long-Term Stability of Tunnel Secondary Lining. Shock Vib. 2021, 2021, 4614265. [Google Scholar] [CrossRef]
  18. Ministry of Transport of the people’s Republic of China. Industrial Standard of China (JTG E41-2005): Rock Test Procedures for Highway Engineering; China communication Press: Beijing, China, 2005; pp. 27–47. ISBN 9787114133510. [Google Scholar]
  19. Griggs, D. Creep of Rocks. J. Geol. 1939, 47, 225–251. [Google Scholar] [CrossRef]
  20. Yang, Z.; Jin, A.; Zhou, Y.; Yan, Q.; Wang, K.; Gao, Y. Parametric analysis of Burgers model and creep properties of rock with particle flow code. Rock Soil Mech. 2015, 36, 240–248. [Google Scholar]
Figure 1. Images of fully weathered sandy shale. (a) Fully weathered sandy shale in situ, (b) a specimen in the lab and (c) the lamellar texture under a microscope.
Processes 11 00610 g001
Figure 2. Failure modes from the uniaxial compressive test: (a) shear failure with a moisture content of close to 0% and (b) tensile failure with a moisture content of 29.18%.
Processes 11 00610 g002
Figure 3. Uniaxial creep characteristic test system: (a) composition of the creep test system and (b) the test loading system.
Processes 11 00610 g003
Figure 4. Typical rock creep curve, where AB is the primary creep stage, BC is the steady-state creep stage, CD is the accelerated creep stage, EF is the unloading curve during the primary creep stage, GH is the unloading curve during the steady-state creep stage, ε0 is the instantaneous strain and ε(t) is the creep strain at time t.
Processes 11 00610 g004
Figure 5. Strain–time curve of step loading.
Processes 11 00610 g005
Figure 6. The Burgers creep model: a combination of elastic components and viscous components.
Processes 11 00610 g006
Figure 7. The Burgers creep curve.
Processes 11 00610 g007
Figure 8. Fitting results of strain–time curves: (a) ω = 15.8%, (b) ω = 17.85%, (c) ω = 20.35%, (d) ω = 26.91% and (e) ω = 29.18%.
Processes 11 00610 g008
Figure 9. Experiment curve and calculation curve of specimens: (a) ω = 15.8%, (b) ω = 17.85%, (c) ω = 20.35%, (d) ω = 26.91% and (e) ω = 29.18%.
Processes 11 00610 g009
Table 1. Results of the uniaxial compression test.
Specimen NumberMoisture Content ωAverage Compressive Strength
1–1; 1–2Close to 0%1068.8 kPa
2–1; 2–220.35%320.2 kPa
3–1; 3–229.18%191.0 kPa
Table 2. Creep characteristics of specimens with different moisture contents.
Moisture ContentPressure (kPa)Instantaneous Elastic Deformation (mm)Steady Creep Deformation Rate (mm/h)Creep Deformation (mm)
15.80%38.20.1021.06 × 10−30.148
57.30.1051.62 × 10−30.206
76.40.1091.68 × 10−30.226
95.50.1101.72 × 10−30.257
114.60.1142.27 × 10−30.271
17.85%38.20.1592.96 × 10−30.333
57.30.1613.10 × 10−30.396
76.40.1633.23 × 10−30.464
95.50.1643.42 × 10−30.491
114.60.1693.60 × 10−30.514
20.35%38.20.1944.75 × 10−30.524
57.30.1974.93 × 10−30.560
76.40.1995.16 × 10−30.681
95.50.2025.37 × 10−30.793
114.60.2045.50 × 10−30.825
26.91%38.20.2706.54 × 10−30.659
57.30.2767.03 × 10−30.731
76.40.2777.15 × 10−30.867
95.50.2807.70 × 10−31.018
114.60.2848.16 × 10−31.176
29.18%38.20.3218.72 × 10−30.800
57.30.3248.84 × 10−30.861
76.40.3289.05 × 10−30.974
95.50.3319.26 × 10−31.130
114.60.4109.38 × 10−31.204
Table 3. Creep model parameters.
Moisture Contentσ (kPa)E1 (kPa)E2 (kPa)η1 (kPa·h)η2 (kPa·h)
15.80%38.2 37,10641,4552,666,66622,238
57.315,89649,2913,980,90055,653
76.410,91951,8815,471,20086,896
95.5917264,1575,221,70081,234
114.6810872,3626,543,700122,970
Mean value16,24055,8294,776,83373,798
17.85%38.2 23,81019,1681,530,40017,731
57.3875023,4782,003,30022,565
76.4629324,9562,598,80027,251
95.5521227,2163,687,10030,471
114.6458332,9703,701,70038,354
Mean value973025,5582,704,26027,274
20.35%38.2 18,19214,482823,41013,901
57.3618619,0011,228,40020,719
76.4456717,7861,616,00019,692
95.5375217,3982,013,50019,494
114.6323219,4992,577,10028,702
Mean value718617,6331,651,68220,502
26.91%38.2 13,57411,111649,2608539
57.3467913,351960,07014,895
76.4335214,6131,315,20016,697
95.5278914,1061,605,70020,206
114.6242315,8751,939,40023,450
Mean value536313,8111,293,92616,757
29.18%38.2 11,3999705493,8007795
57.3391212,192756,31012,868
76.4286013,1881,068,50018,258
95.5241213,4301,346,50017,284
114.6213013,1521,580,90020,684
Mean value454312,3141,049,20215,378
Disclaimer/Publisher’s Note: The statements, opinions and data contained in all publications are solely those of the individual author(s) and contributor(s) and not of MDPI and/or the editor(s). MDPI and/or the editor(s) disclaim responsibility for any injury to people or property resulting from any ideas, methods, instructions or products referred to in the content.

