Abstract
At present, there has been no mechanized equipment designed for the separation of the leaves from the stems of wakame in China, and the stem–leaf separation is mainly completed by manual work, which suffers from problems such as low efficiency, high cost, and poor quality. To develop mechanized stem–leaf separation equipment of wakame, it is necessary to have a preliminary understanding of the biomechanical characteristics of wakame. In this study, we adopted an electronic universal testing machine, a texture tester, and a friction tester to investigate the mechanical characteristics of the stems and leaves of salted wakame. Analysis was performed to clarify the effects of salted wakame thickness and loading speed on the tension, compression, shear, and separation mechanical properties as well as the effects of the loading speed, normal force, and contact material on the friction characteristics. As shown in the results, the average tensile strength, shear strength, and resilience of salted wakame stems were 2.27 MPa, 6.34 MPa and 0.27, respectively; the average tensile strength and shear strength of salted wakame leaves were 1.67 MPa and 2.93 MPa; the separation strength of the stems and leaves was 1.78 MPa, and the friction coefficient between salted wakame and stainless steel, silicone rubber, and vulcanized rubber was 0.38, 0.44 and 0.40 on average. In general, the increase in the loading rate, the shear strength, and the stem–leaf separation strength of salted wakame showed a downward trend, while the changes in the friction coefficient showed an upward trend, with no significant influence on the recovery and tensile strength. The tensile strength, resilience, shear strength, stem–leaf separation force, and strength increased as the thickness of the salted wakame improved. The friction coefficient of the salted wakame stems decreased with increasing the normal force, while the friction coefficient of the salted wakame leaves increased. In general, the increase in wakame thickness improved its mechanical properties, and the increase in the test loading rate led to the decrease in the mechanical properties of salted wakame. The research results in this paper can provide suggestions for the research and development of stem–leave separation equipment for saline salted wakame.
1. Introduction
Wakame, one of the annual large seaweeds [1], is known as the “King of Seaweeds”. It is commonly grown in China’s coastal Shandong and Liaoning provinces and is heavily exported to Japan and Korea. Because of its relatively high market value both as foods and food ingredients, wakame and its extracts are also increasingly popular in western countries [2,3,4,5]. The total cultivated area of Chinese salted wakame was 6.93 × 10³ hm2 and its total output reached 212,200 tons in 2021, of which Liaoning Province has a breeding area of 5.71 × 10³ hm2 and an output of 160,300 tons [6]. Almost all salted wakame products are currently produced from cultured wakame. The processing steps of wakame products include harvesting, boiling, cooling, salting, and stem–leaf separation [7,8]. The harvesting period of wakame is concentrated in February to April, so workers need to complete the harvesting and processing of wakame in a short period of time [9]. Among the processing steps, stem–leaf separation is quite crucial. However, wakame stem–leaf separation has to be performed manually because no automated machinery is available now in China, which significantly raises the cost of the initial processing of wakame, in addition to problems such as poor quality and low efficiency [10]. In view of the above problems, it is urgent to design and develop efficient stem–leaf separation equipment for wakame. The existing research on stem–leaf separation equipment mainly centers around sugarcane, corn, and other straw crops, with little attention being paid to the stem–leaf separation equipment for aquatic flexible crops such as wakame, and data evidence of the mechanical properties of flexible crops is seriously in short. Therefore, it is necessary to study the tensile, compression, shear, friction, and other mechanical properties of wakame stems and leaves.
Many investigations have been conducted to analyze the mechanical characteristics of seaweed, laver, corn, tobacco, and other agricultural products [11,12,13,14,15,16]. For example, the research of Lu et al. [17] on the biomechanical characteristics of laver confirmed the influence of the origin and harvesting time on the tensile strength, shear strength, adhesion, and adhesion of laver, which provided references for the design and optimization of machineries that can be used for harvesting, postharvest transportation, and laver processing. Tian et al. [18], by conducting comparative tensile tests on the roots of artificially planted flower sticks and salix psammophila, reached the conclusion that the maximum tensile force, tensile strength, and Young’s modulus of flower sticks are better than salix psammophila. Their results provide useful information for the study of root soil fixation and the selection of windbreak and sand-fixation species. Mou et al. [19] examined the morphological indexes, tensile properties, compressive properties, and compressive stability properties of different melon grafted crops, and found that the mechanical properties of different melon grafted crops are highly correlated with the diameter of the long axis, which largely promoted the development of automatic grafting devices. Liu et al. [20] investigated the influence of the TPA test conditions on the texture parameters of muskmelon and obtained concrete evidence of how experimental conditions affect the resilience of muskmelon and the texture characteristics of muskmelon pulp tissues, which provided references for the TPA test on fruit and vegetable type samples. Jiang et al. [21] explored the influence of variety and maturity on the texture parameters of figs by studying the TPA texture characteristics of different varieties of figs, and the results provided a theoretical basis for the selection of fig varieties for deep processing and the judgment of fig maturity. Wu et al. [22] tested the compression and shear properties of the “Nuomici” litchi branch, measured the compression strength and compression energy, the shear strength and shear work of this litchi branch, and conducted a correlation analysis between its mechanical properties. The research informed the development of fruit tree pruning machines. Zhang et al. [23], through compression and shear characteristics tests on taro plants, obtained the minimum breaking force and minimum cutting force in front of taro damages, providing a theoretical basis for the mechanized harvesting and transportation of taro products. Wang et al. [24] clarified the effect of lubrication and wrinkles on the coefficient of friction on small intestine surface. Nevertheless, they did not examine the effect of normal force on the coefficient of friction. Their results are of great significance for promoting minimally invasive and non-invasive diagnosis and treatment. Huo et al. [25] studied the physical parameters of corn straws by testing the coefficient of internal friction of corn straws in different regions and the maximum static coefficient of friction between corn straws and metal and rubber materials and analyzed the differences in the stacking characteristics of corn straw raw materials. Their research offered important suggestions for the design of relevant equipment that can be used for the compression, transportation, and storage of straw raw materials. Despite the many attempts and achievements mentioned above, there has been no report on the mechanical properties of wakame. In this study, based on the characteristics of wakame itself and the previous literature, a test for the biomechanical properties of wakame was designed.
In the present study, tensile tests and stem–leaf separation tests on salted wakame were carried out on a computer-controlled electronic universal testing machine; compression and shear tests on salted wakame were performed on the TMS-PRO texture tester, and a friction test on salted wakame was completed on the friction coefficient tester. The tensile strength, resilience, shear strength, stem–leaf separation force, and strength of salted wakame under different loading rates and thicknesses, as well as the coefficient of friction of materials under different normal forces and load rates, were analyzed with SPSS 26.0 software. This study is expected to have theoretical implications for the development of stem–leaf separation equipment for salted wakame.
2. Materials and Methods
2.1. Materials
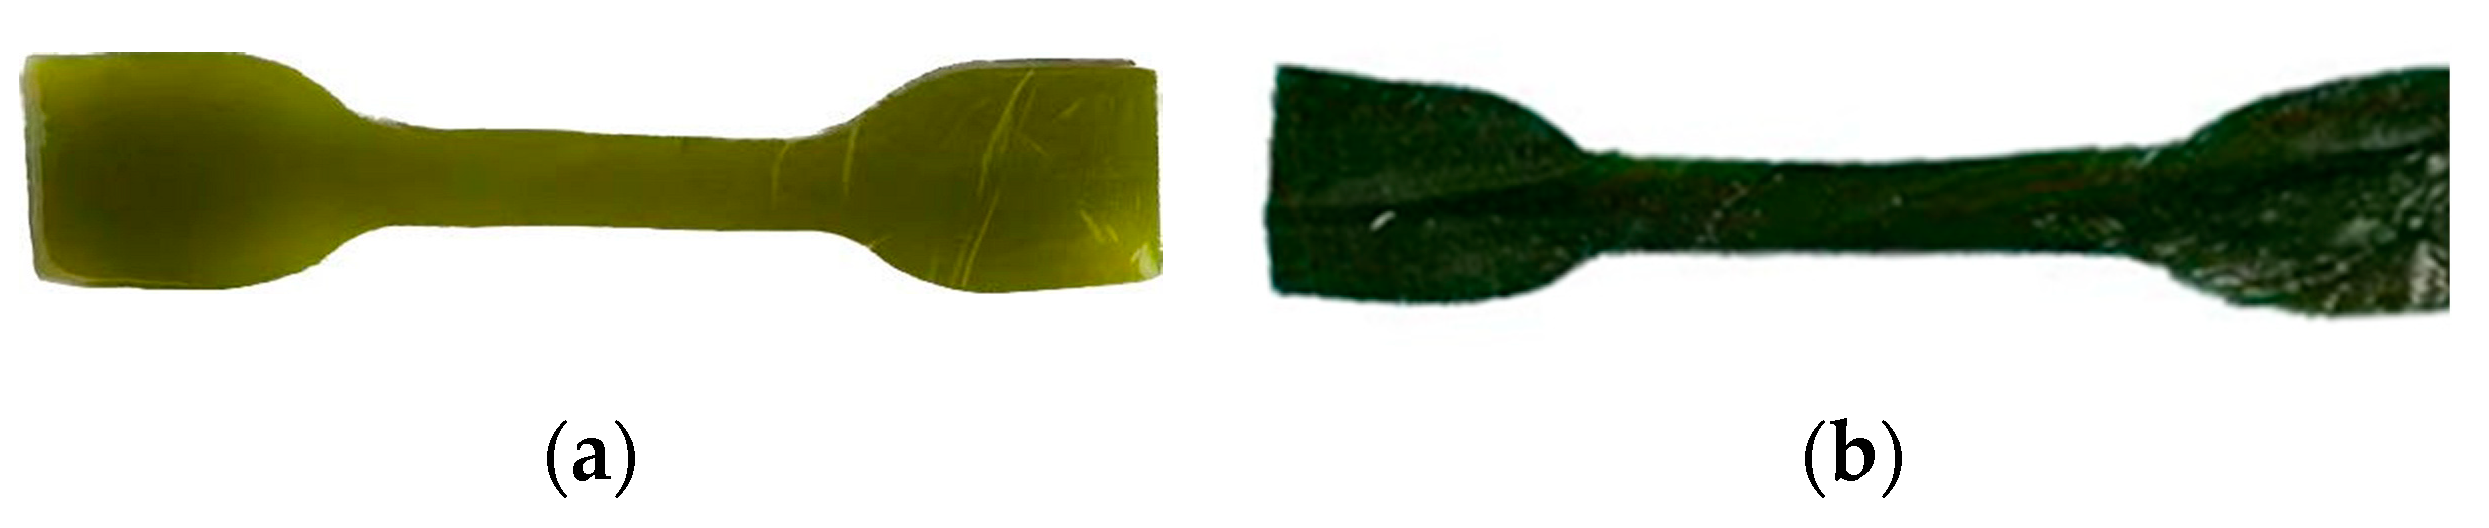
The test salted wakame was collected from the aquaculture sea area of Shigou Town, Dalijia Street, Jinzhou District, Dalian City, Liaoning Province, China. Fresh wakame samples without pathological changes and surface damage were selected for preliminary treatment according to the standard SC/T3211-2002 of salted wakame (hereinafter referred to as wakame) and stored at lower temperature to avoid salt analysis and water changes in wakame. Sample wakame had stem thickness of 3.60–0.60 mm, leaf thickness of 0.45–0.15 mm, and water content of 10.90%. Sample treatment was carried out at lower temperature, and the experiment was completed within two weeks after treatment. The macromorphology and microstructure of wakame are shown in Figure 1.
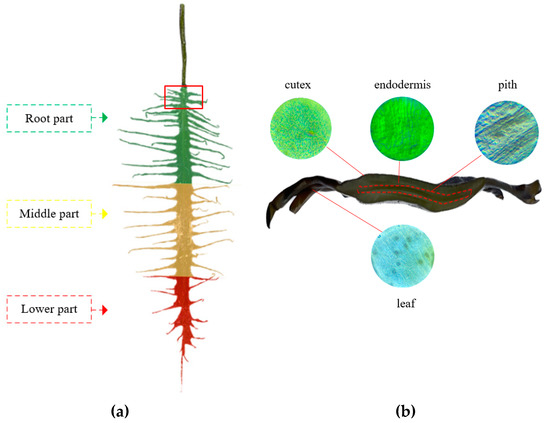
Figure 1.
Macromorphology and microstructure of wakame (a) Macromorphology of wakame (b) microstructure of wakame.
2.2. Instruments
The test adopted a WDB-01A computer-controlled electronic universal testing machine manufactured by Jinan Jingji Test Instrument Co., Ltd. (Jinan, China). with an accuracy of <1% and a measuring range of 0~100 N. The TMS-PRO texture tester developed by FTC company (Los Angeles, CA, USA) in the USA had an accuracy of <1% and a measuring range of 0~1000 N. MXZ-1 friction coefficient tester manufactured by Jinan Jingji Test Instrument Co., Ltd. (Jinan, China) with an accuracy of 0.01. ZL-033 digital display dial gauge of Zhejiang Ningbo Evert Import and Export Co., Ltd. (Ningbo, China). had an accuracy of 0.01 mm and a measuring range of 0~12.7 mm. A Hebei Yeyi Zhongke Equipment Technology Co., Ltd. (Cangzhou, China). 10 × 120 dumbbell cutting knife was used as a self-made separation fixture for stems and leaves.
2.3. Method
2.3.1. Tensile Test
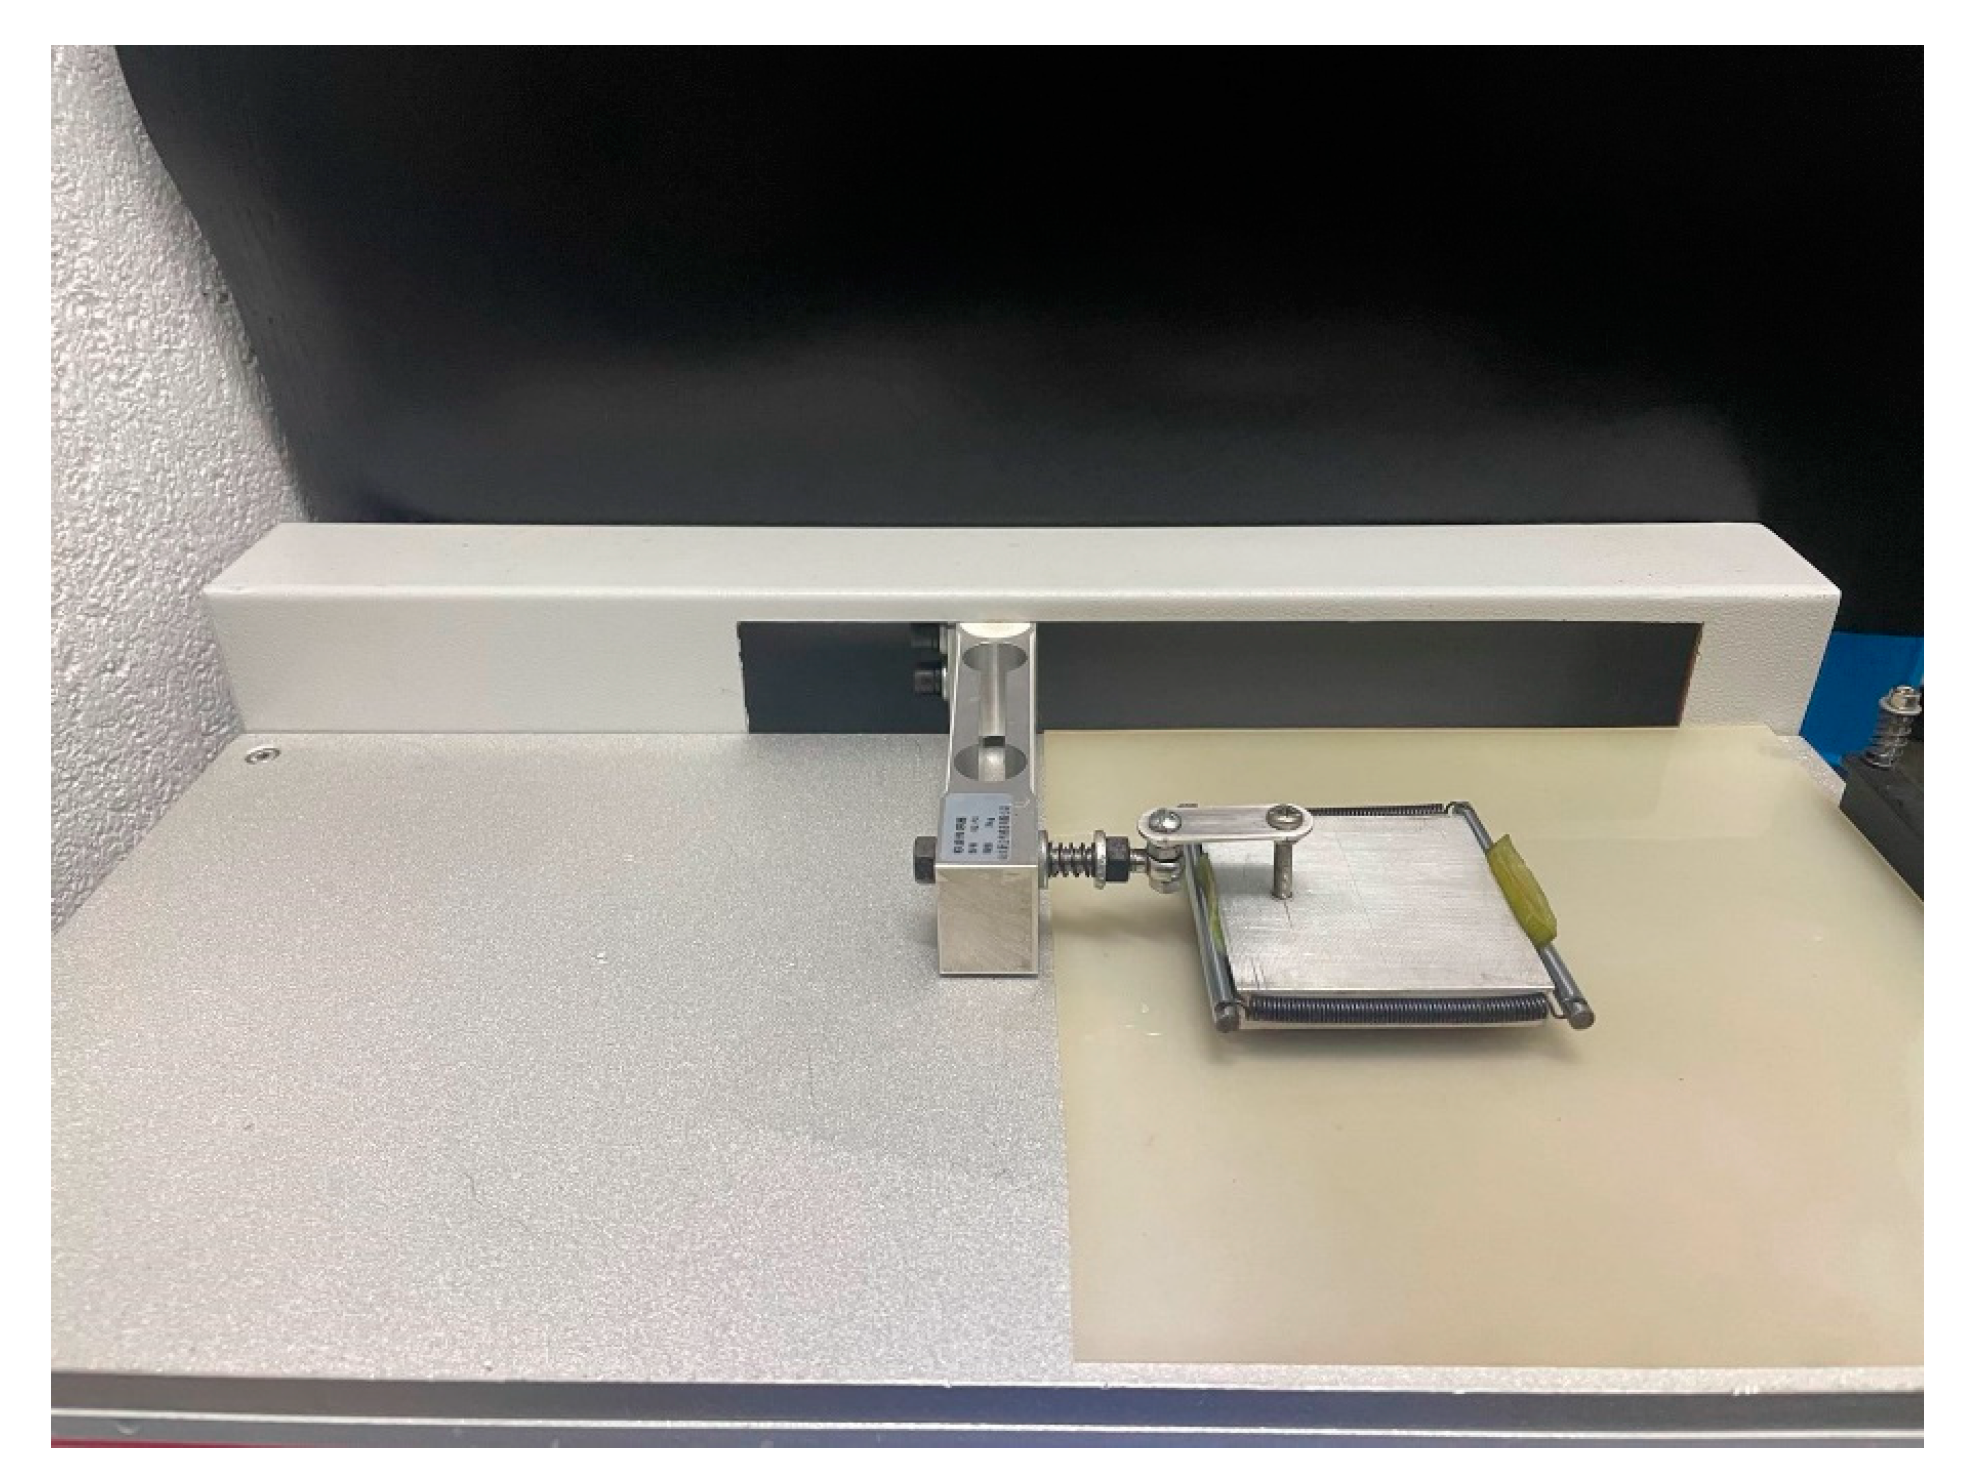
According to the maximum tensile force FLmax measured by the electronic universal testing machine, the maximum tensile strength δLmax was calculated by Formula (1). In order to make the breakage of the wakame occur in the middle of the specimen during the tensile test and have sufficient clamping force at the clamping end, the specimen was made into dumbbell-shaped specimen with dimensions and cutters by referring to the standard GB/T 528-2009, as shown in Figure 2, while the dumbbell type specimen is shown in Figure 3. During the test, the cushion pad was added on the basis of the wedge-shaped tension fixture to increase the friction between the fixture and the wakame so as to prevent the sample from cutting and breaking at the contact point with the fixture. Tensile tests were carried out on the wakame at loading speeds of 5 mm/min, 10 mm/min, and 15 mm/min. Effective tests without slipping, jamming, and failure were repeated at each loading speed for 15 groups. The test device is shown in Figure 4.
where δLmax is the maximum largest tensile strength (MPa), FLmax is the maximum load of test (N), A is the cross-sectional area of the test specimen in the direction of load application (mm2).
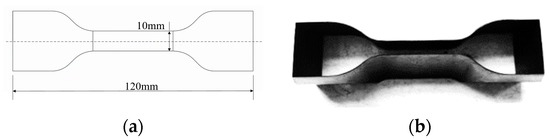
Figure 2.
Sample size and dumbbell cutter (a) Sample size; (b) Dumbbell cutter.

Figure 3.
Dumbbell-shaped sample of wakame stem and leaf (a) Stem; (b) Leaf.
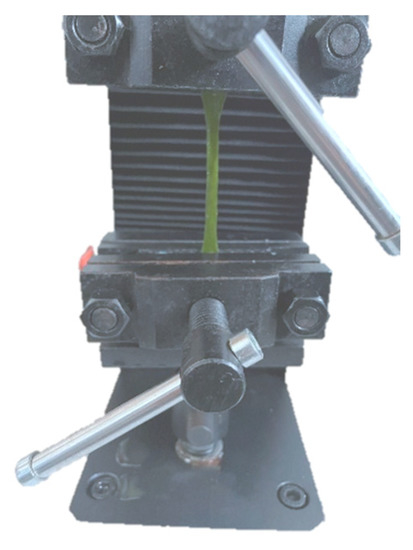
Figure 4.
Schematic diagram of tensile test device.
2.3.2. Compression Test
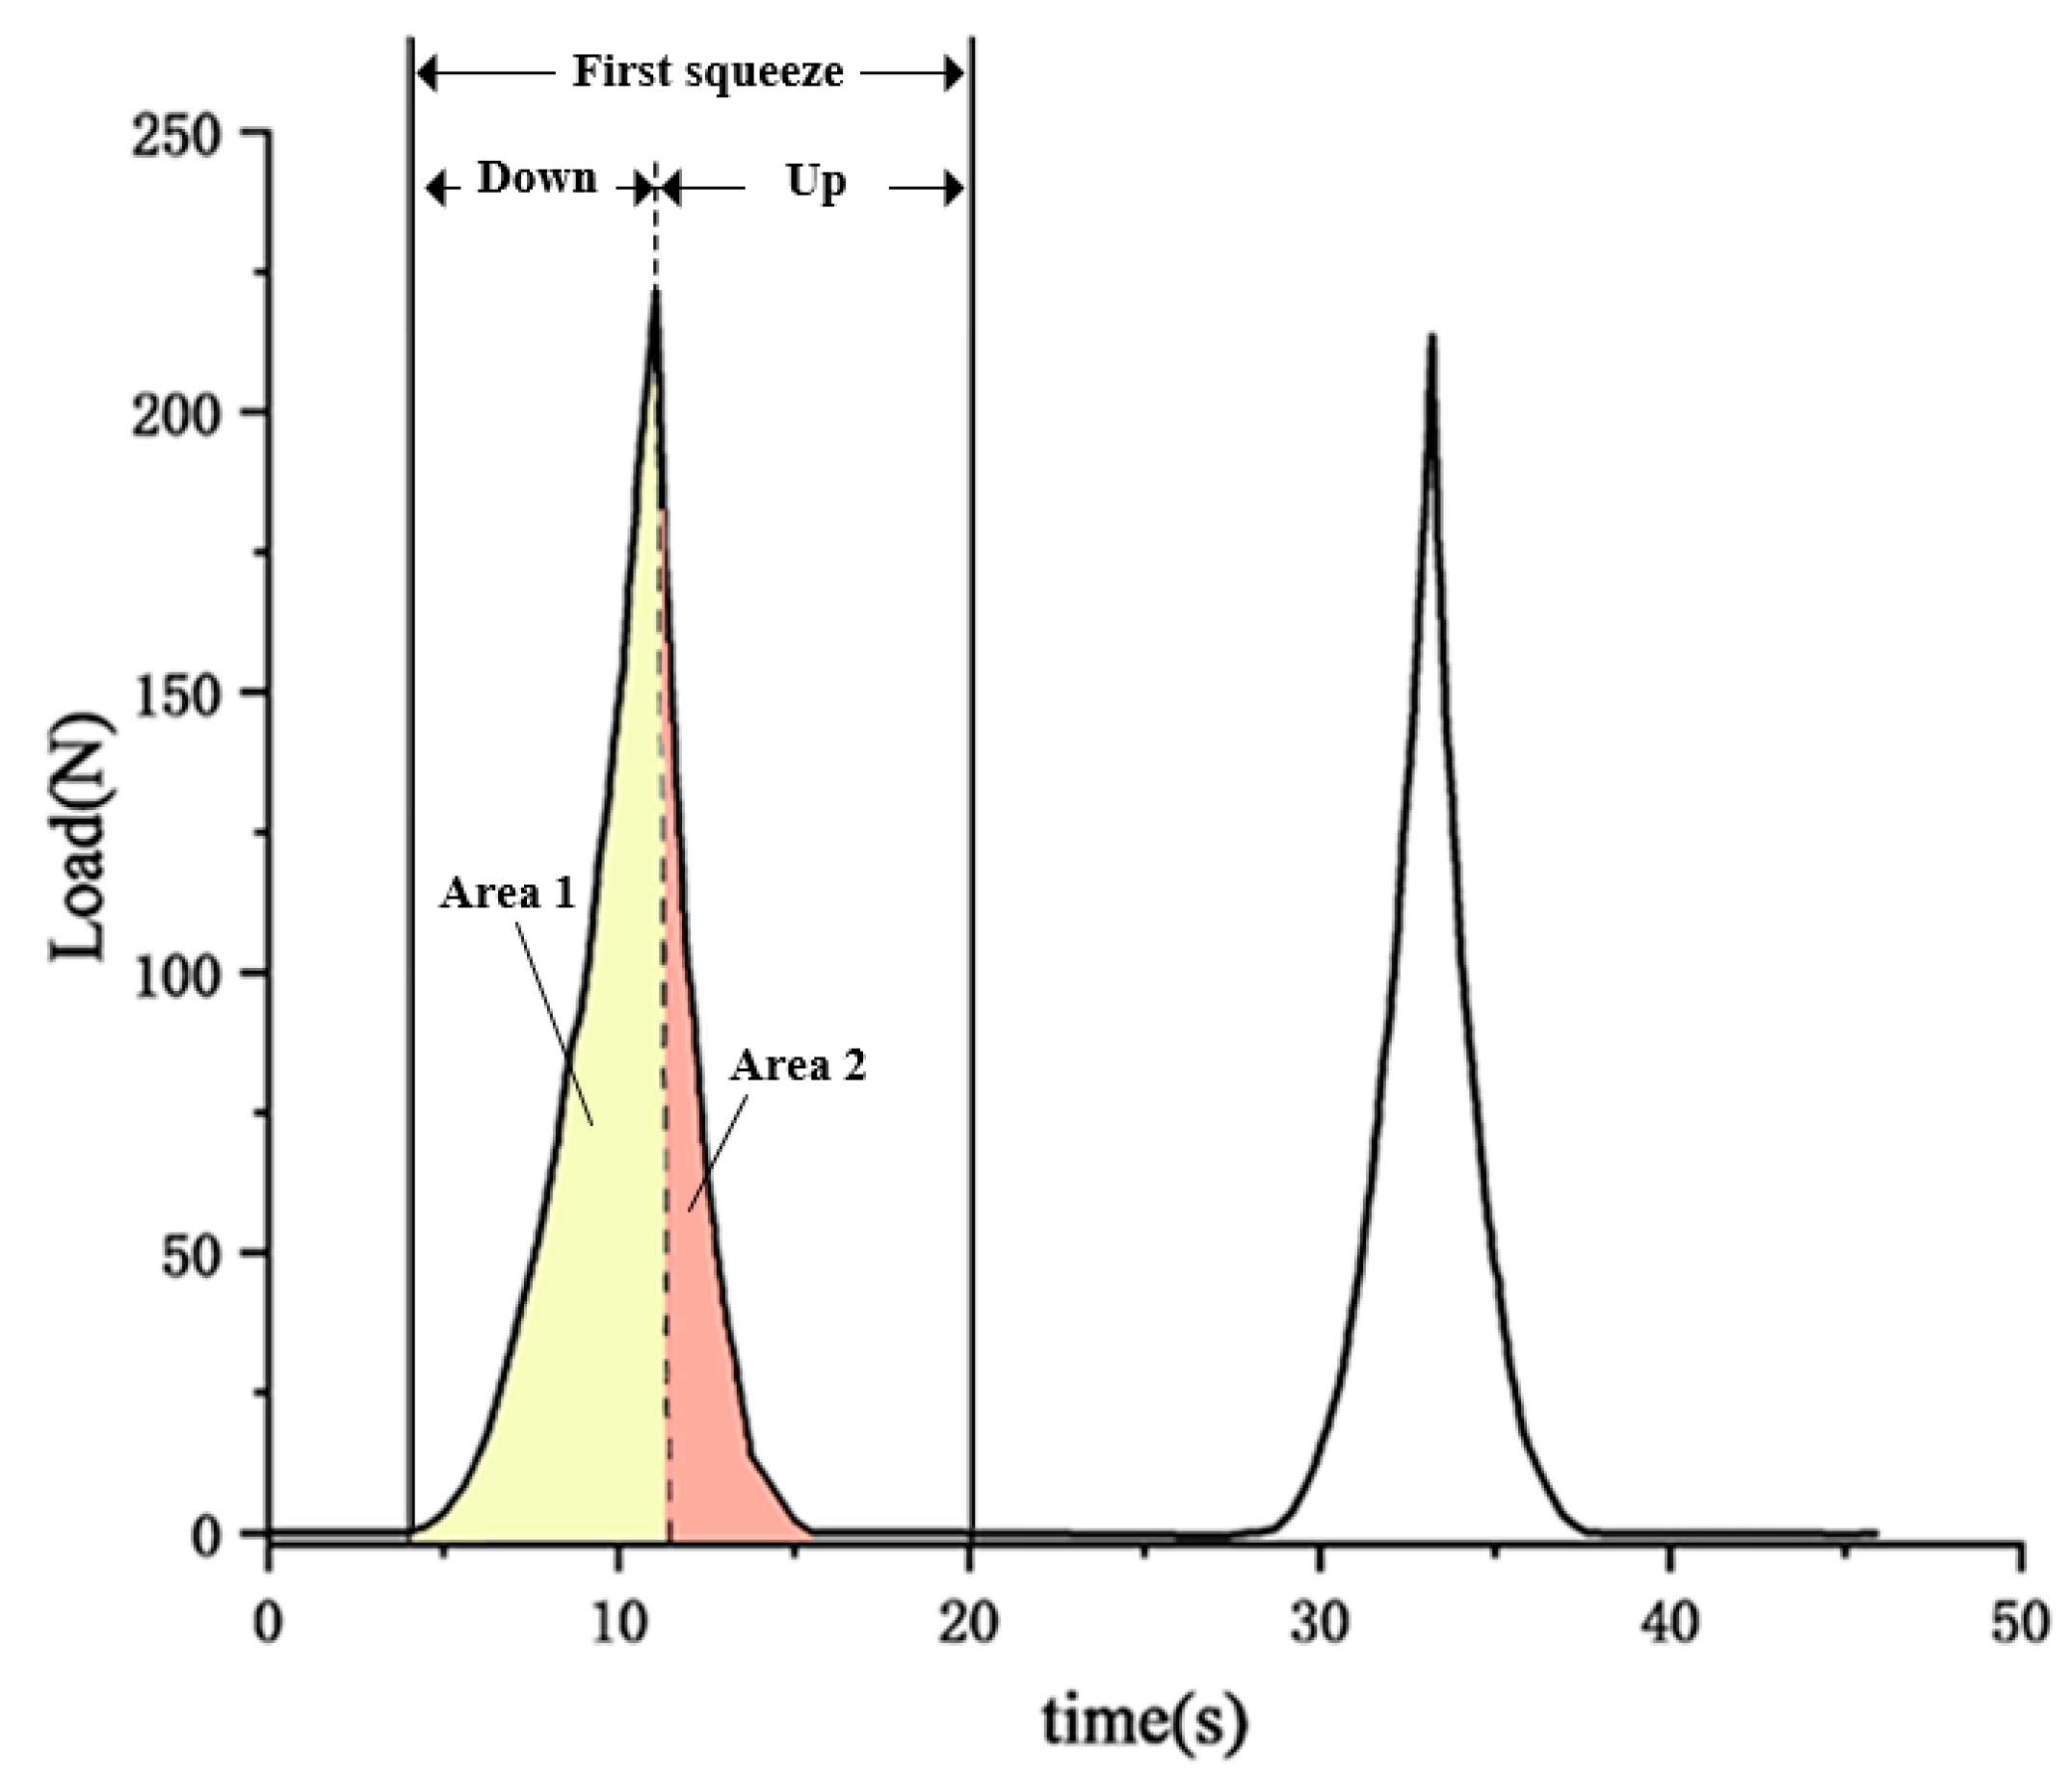
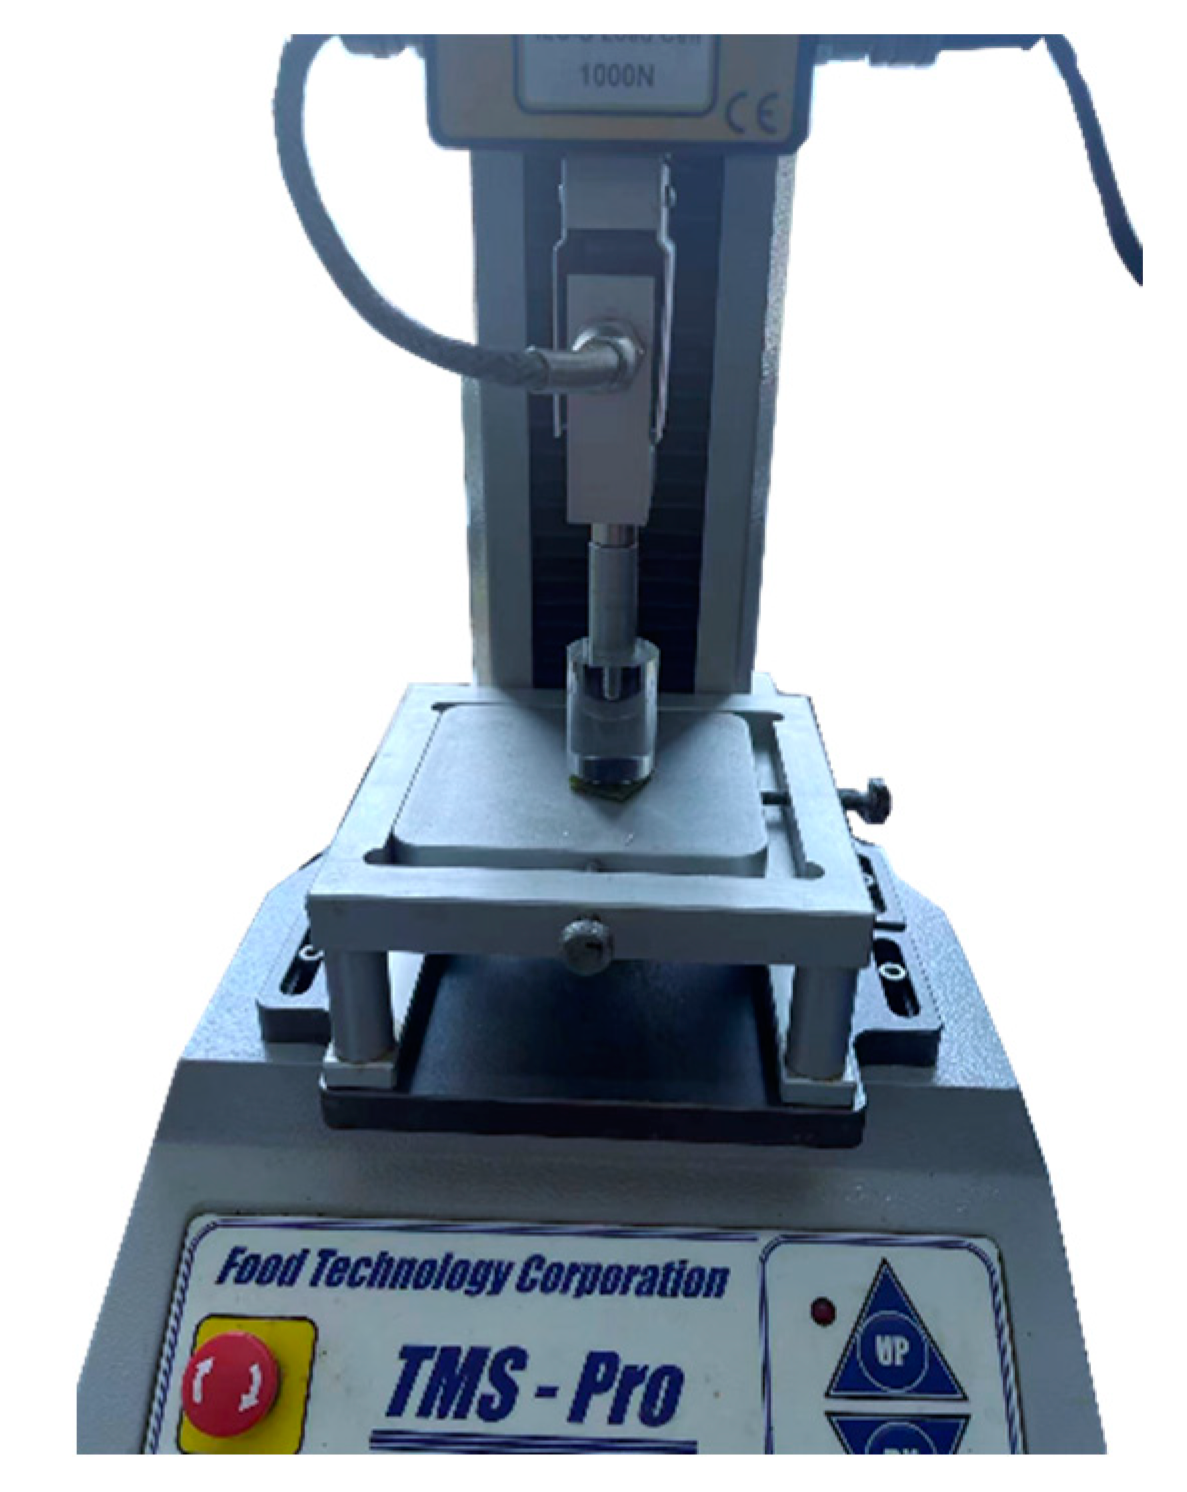
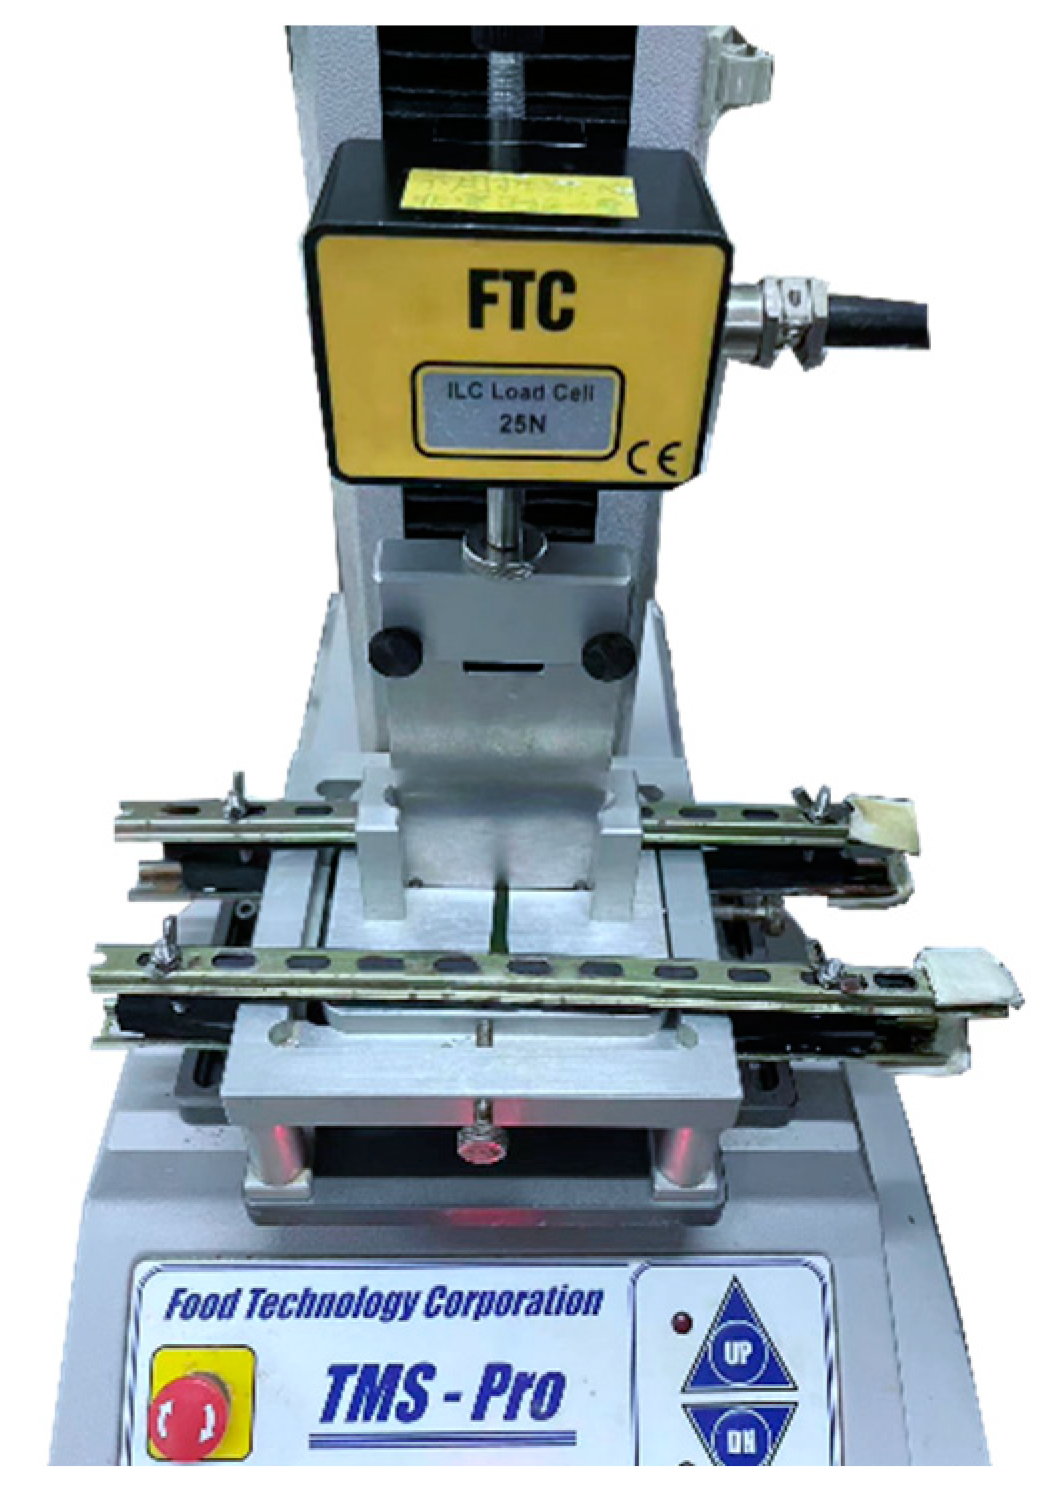
The resilience is area 2 (return work)/area 1 (extrusion work). Because the stem and leaf separation equipment had a clamping action on the wakame stem, which will cause certain extrusion, this experiment used the texture analyzer TPA to test the resilience of the wakame stem. The wakame stem was cut into a 20 mm × 20 mm sample, where the sample thickness range was 0.6–3.6 mm. The test adopted a cylindrical probe, with the shape variable set to 60%. The loading speed was 5 mm/min, 10 mm/min, 15 mm/min, and the test was repeated for 15 groups at each loading speed. The curve was recorded and displayed by computer, as shown in Figure 5. The test device is shown in Figure 6.

Figure 5.
TPA test texture characteristic curve.
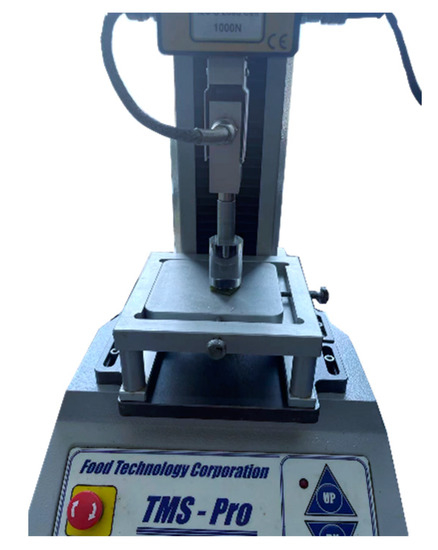
Figure 6.
Schematic diagram of compression test device.
2.3.3. Shear Test
The shear force and displacement curves during the test were recorded and displayed by computer, and the shear strength of the sample was calculated according to formula (2) δJmax. Before the test, a dumbbell cutter was used to cut the stem and leaf of the wakame sample into dumbbell samples, as shown in Figure 7. In order to prevent the wakame from moving during the cutting process of the cutter, the self-made cutting fixture shown in Figure 8 was used to clamp and fix it. The standard straight plate shear probe was used for the test; the loading speed was 5 mm/min, 10 mm/min, 15 mm/min, and 15 groups of tests were repeated at each loading speed. The test device is shown in Figure 9.
where δJmax is the maximum shear strength (MPa), FJmax is the maximum load for the test (N), A2 is the cross-sectional area of the test specimen in the direction of shear load application (mm2).
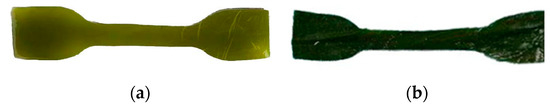
Figure 7.
The sample of wakame stem and leaf (a) Stem; (b) Leaf.

Figure 8.
Self-made shearing fixture.

Figure 9.
Schematic diagram of shear test device.
2.3.4. Stem–Leaf Separation Test
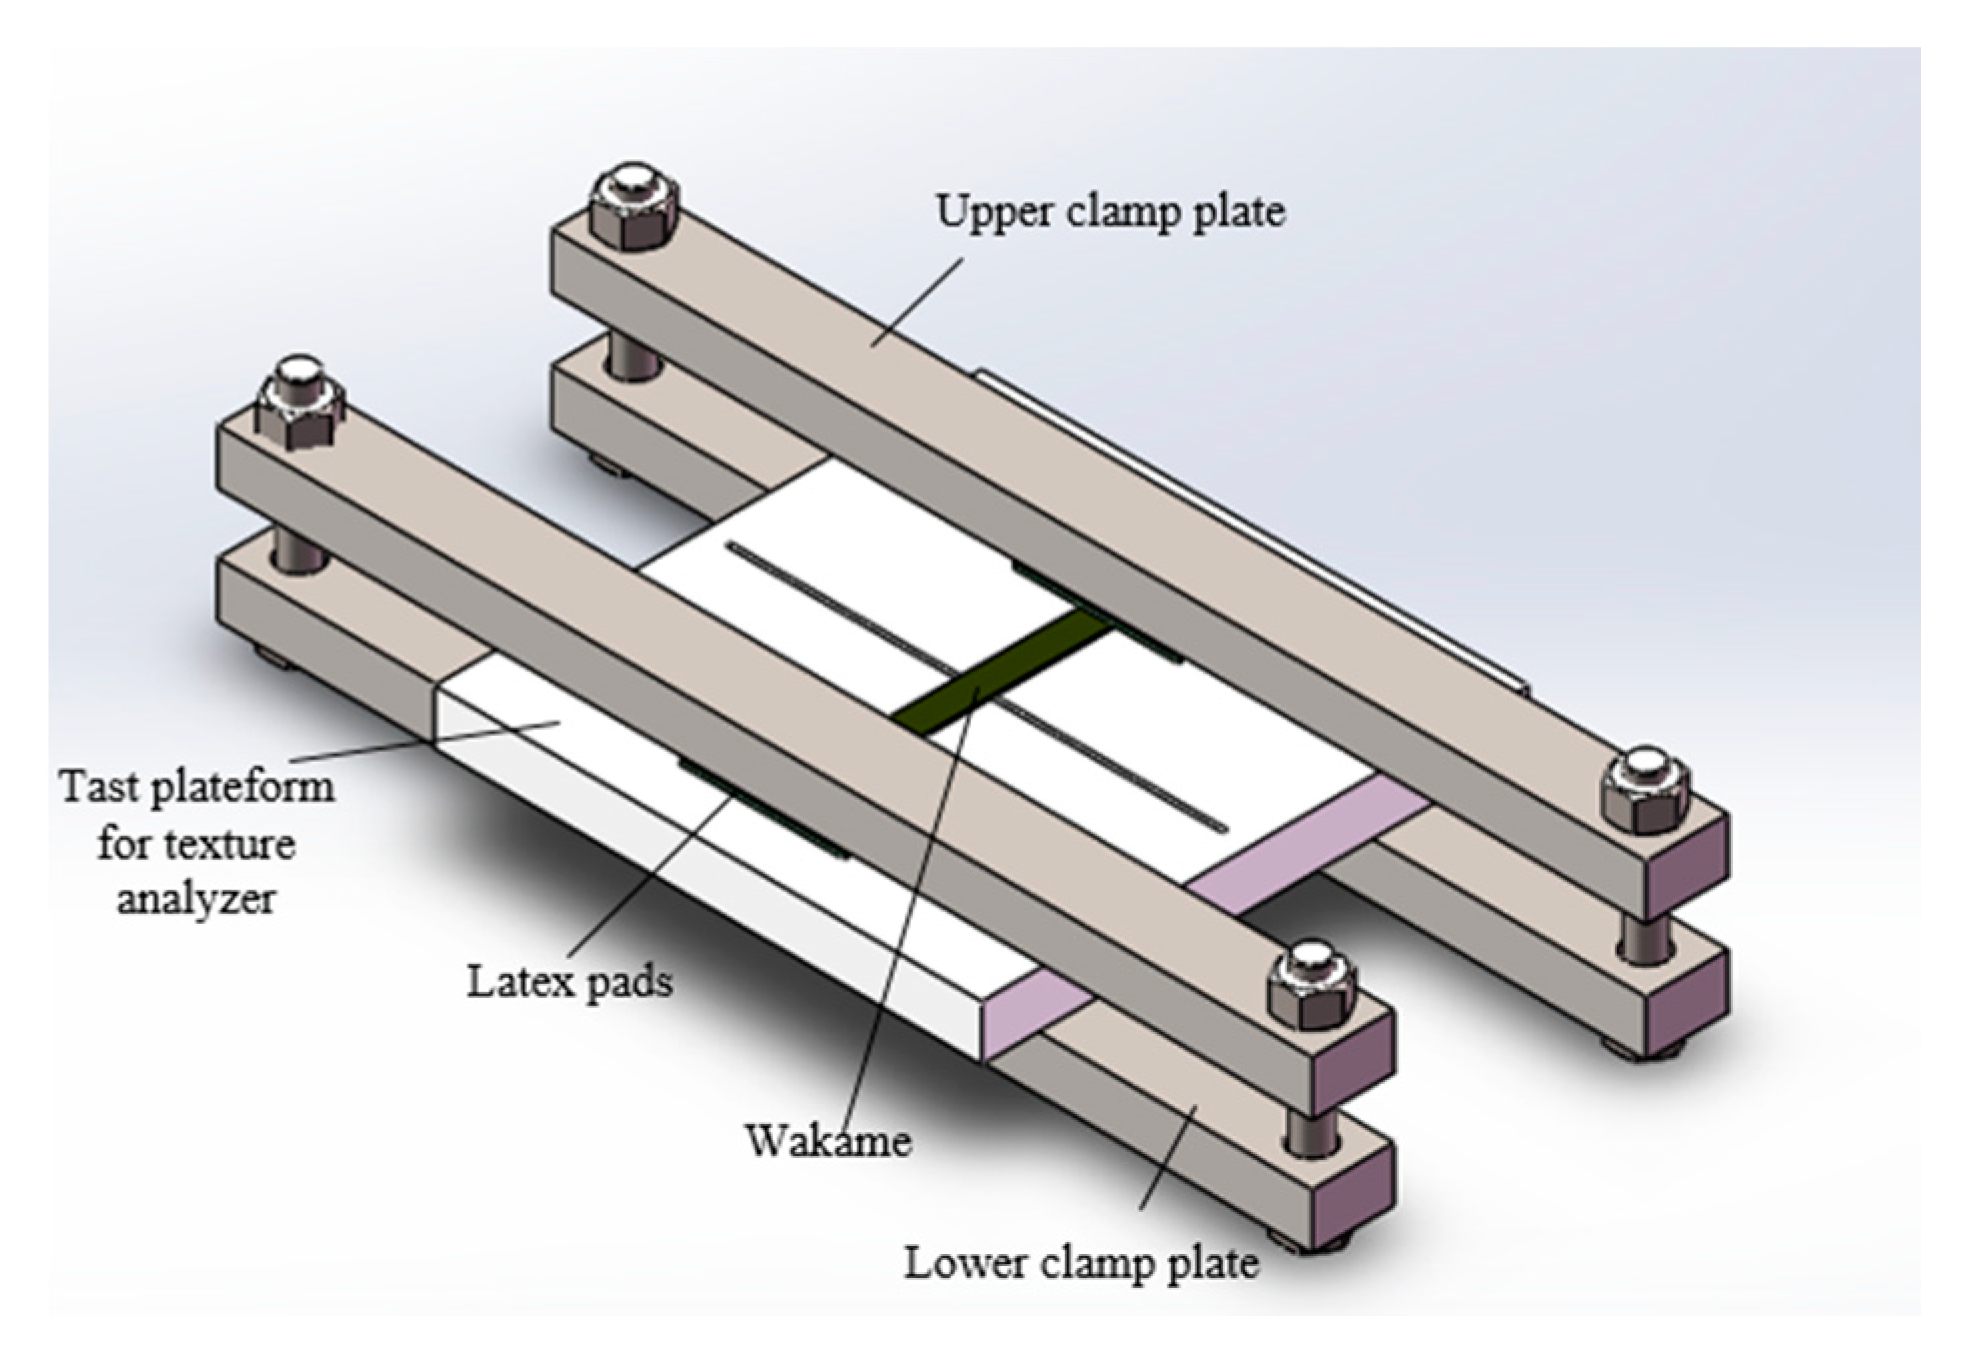
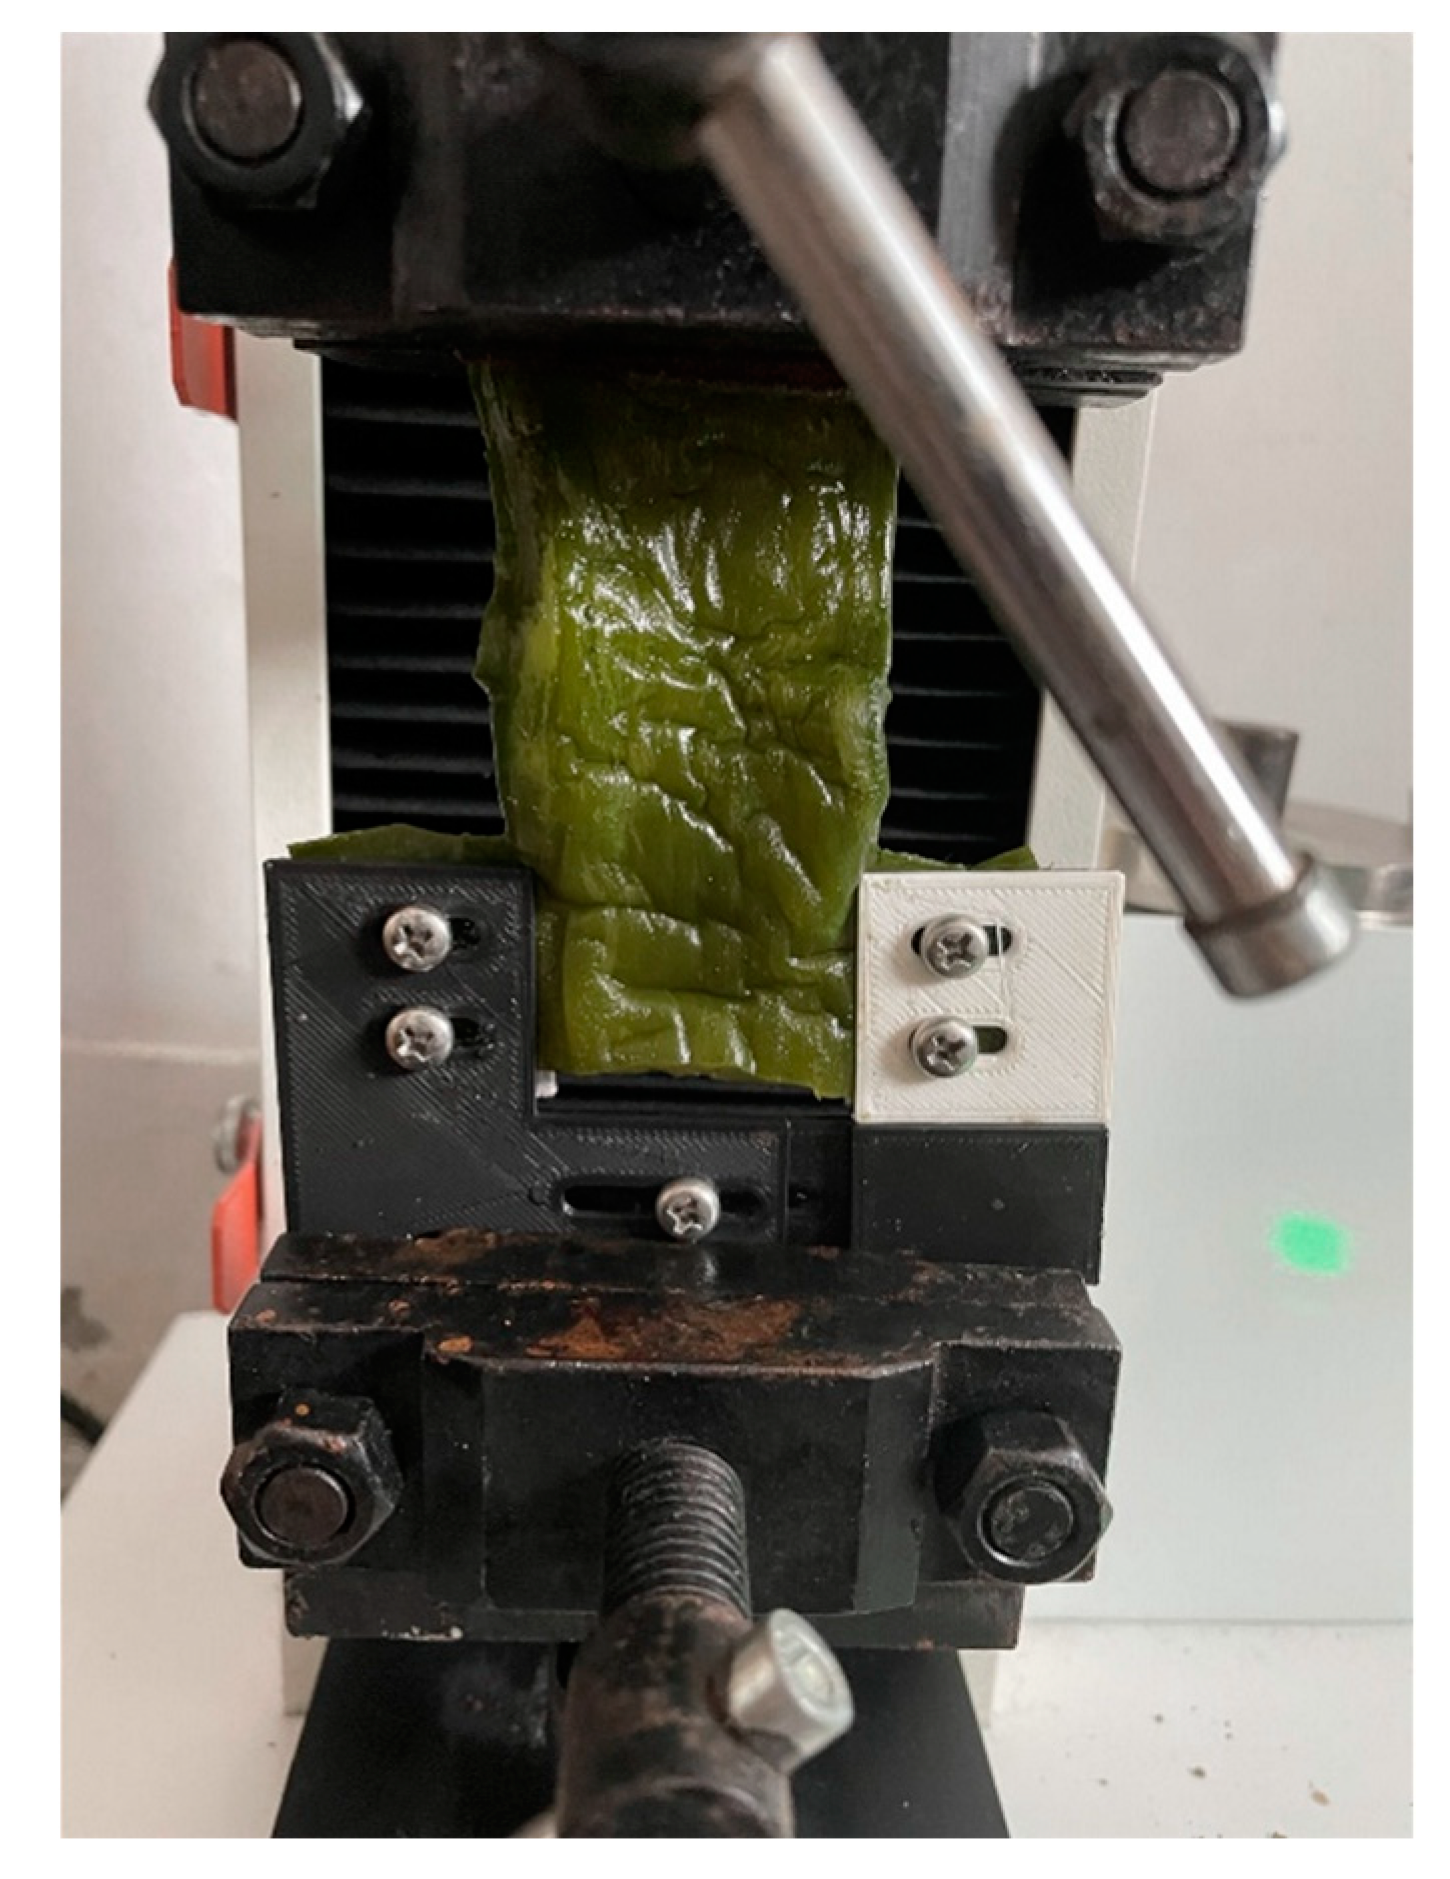
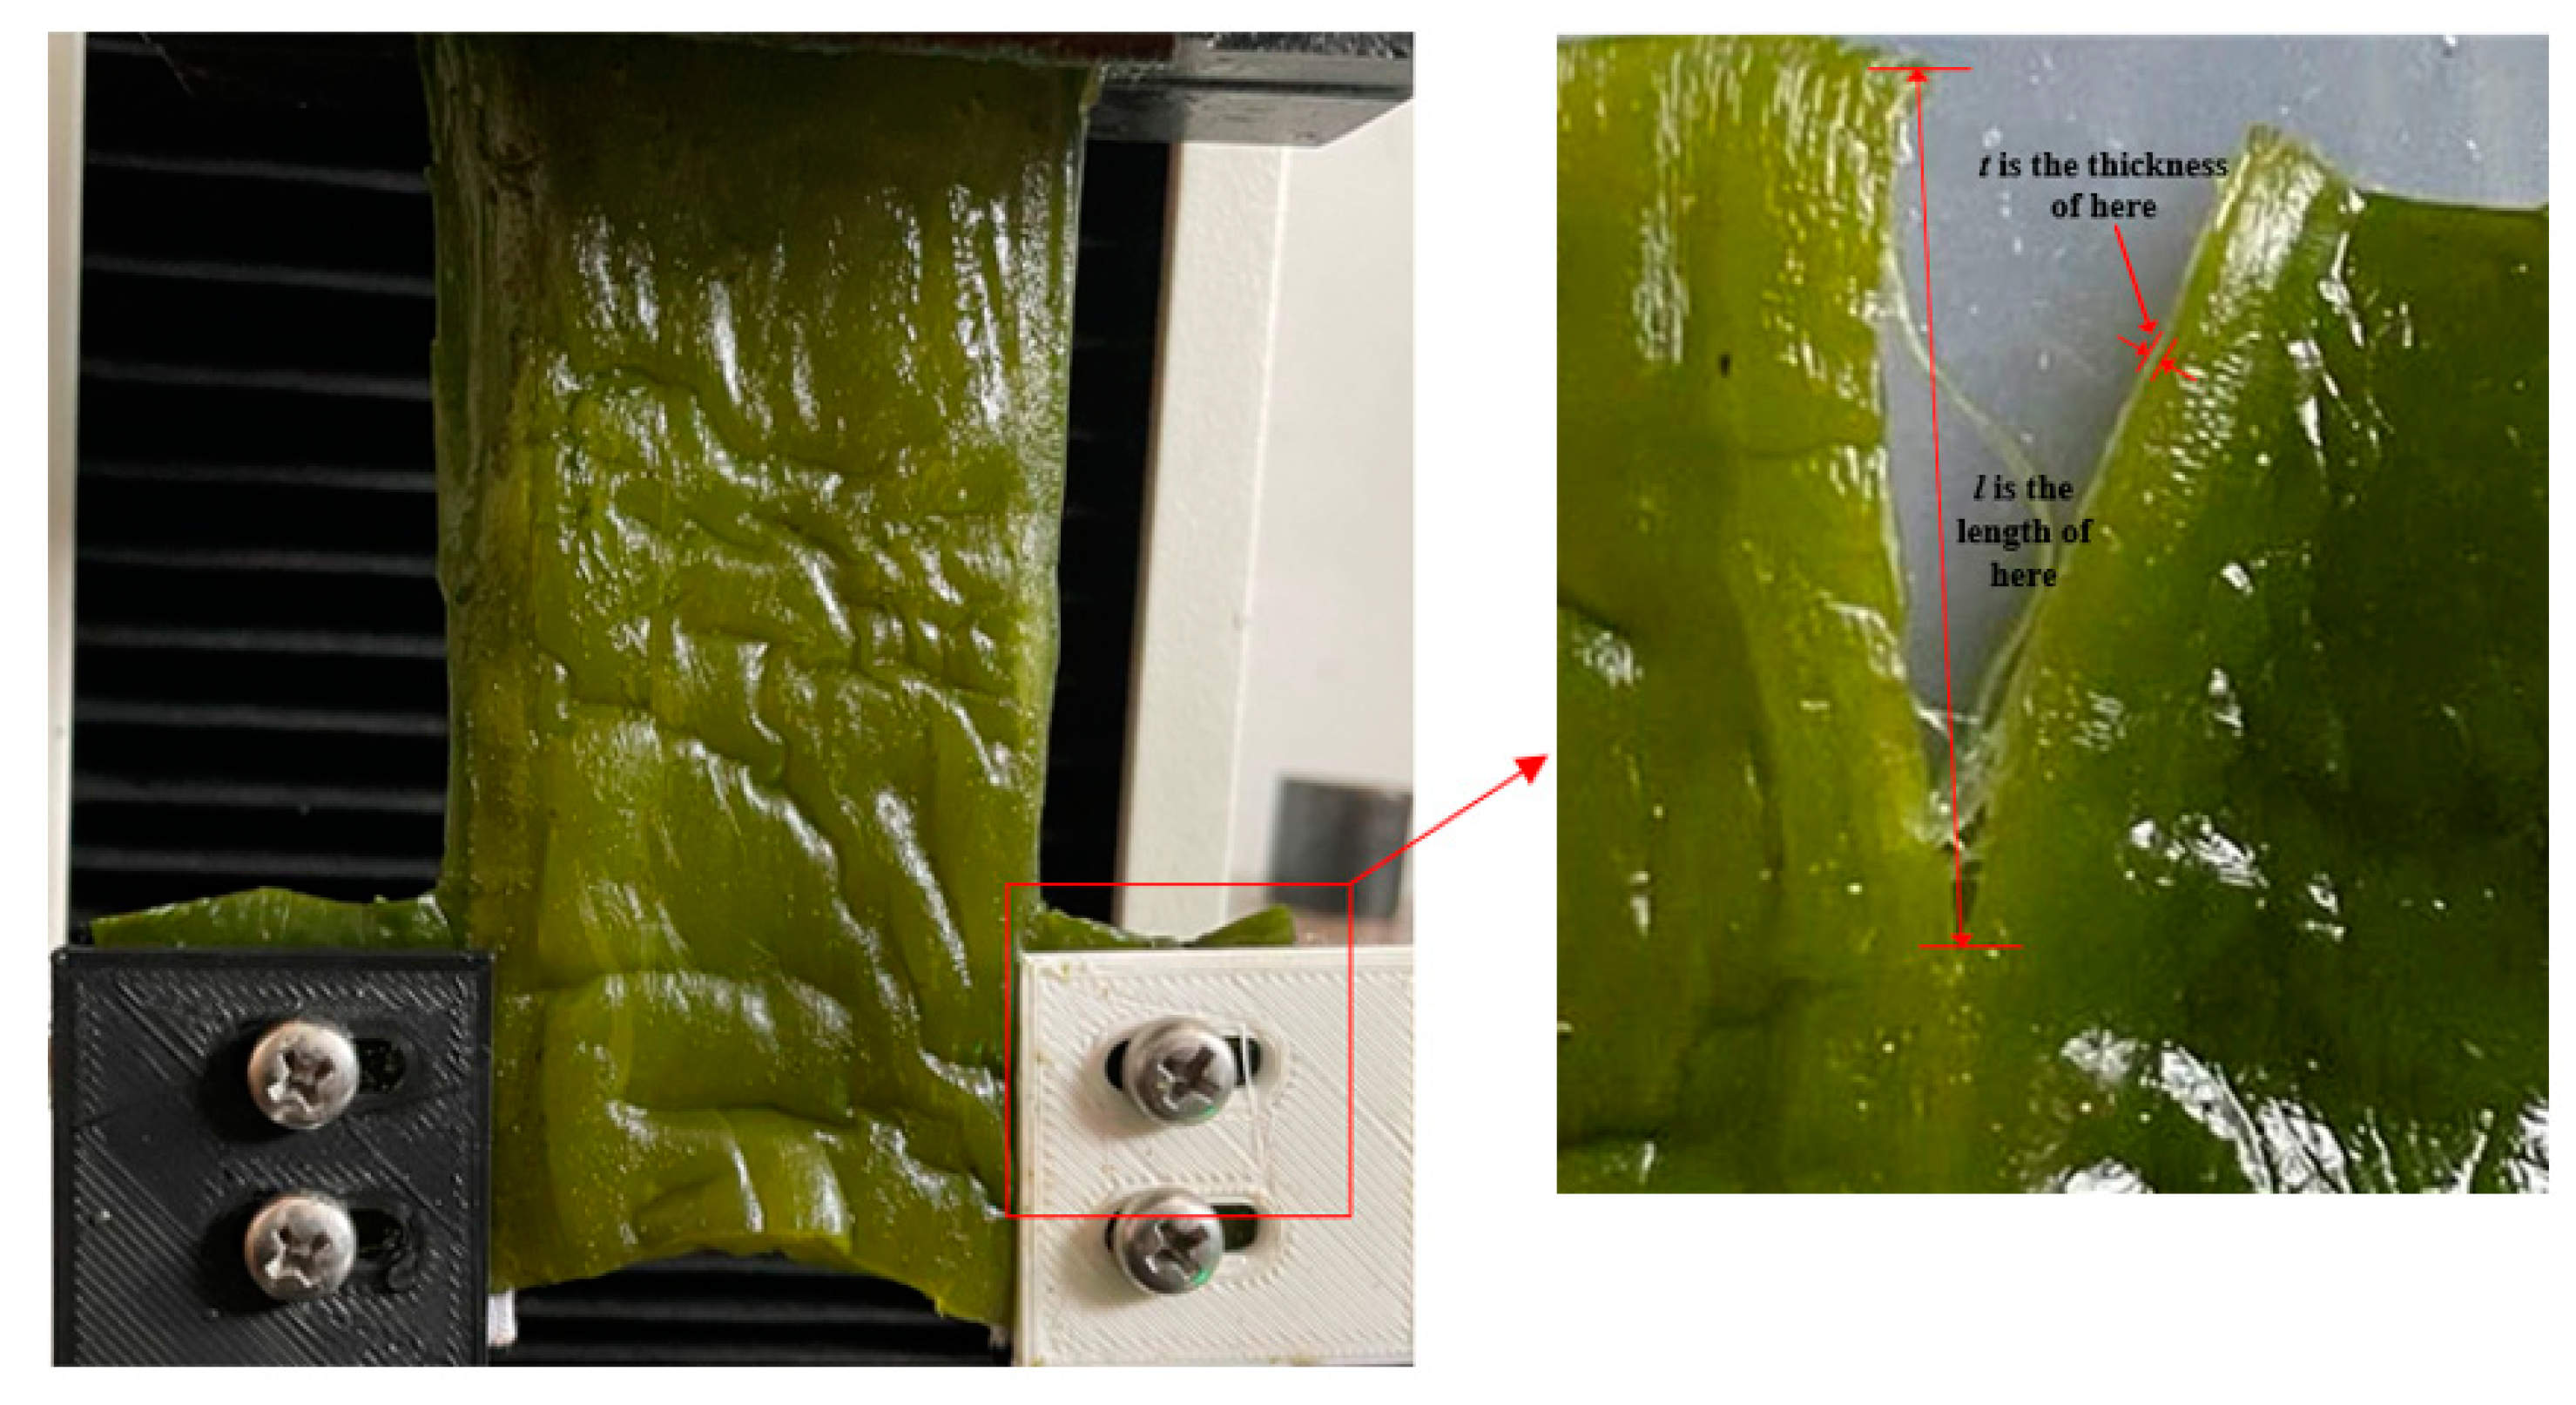
A microcomputer-controlled electronic universal testing machine was used to test the separation force FFmax of the wakame stem and leaf, and then the maximum separation strength δFmax was calculated according to Formula (3) and (4) In the test, the upper wedge clamp clamped the wakame stem, and the lower end clamped the leaves on both sides of the stem. On the basis of the contact surface between the upper wedge clamp and the lower self-made clamp and the wakame, a rubber pad was added as a cushion to increase the friction and reduce the damage to the wakame. The test speed was 5 mm/min, 10 mm/min, 15 mm/min, and the test was repeated for the 15 groups at each loading rate. The tensile and deformation curves during the test were recorded and displayed by computer. The test device is shown in Figure 10, while the dumbbell type specimen is shown in Figure 3, the situation after stem-leaf separation test is shown in Figure 11.
where δFmax is the maximum separation strength (MPa), FFmax is the maximum load for the test (N), A3 is the cross-sectional area of the stress point of the wakame (mm2), l is the width of the stem–leaf fracture (mm), t is the thickness of the stem–leaf fracture (mm).
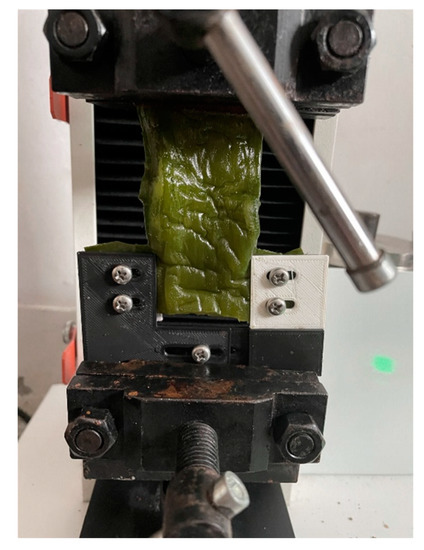
Figure 10.
Schematic diagram of stem–leaf separation test.

Figure 11.
Schematic diagram of wakame after test.
2.3.5. Friction Characteristic Test
The friction coefficient tester was used to test the friction coefficient between the stem and leaf of the wakame and the surfaces of the stainless steel, silica gel and rubber. The stem and leaf of wakame were fixed at the bottom of the slider, the normal force was set at 5 N, 10 N and 15 N, and the load rate was set at 5 mm/min, 10 mm/min and 15 mm/min. Under each test condition, 5 groups totaling 45 groups were completed. The test device is shown in Figure 12.

Figure 12.
Schematic diagram of friction characteristic test.
3. Results and Discussion
3.1. Analysis of Tensile Properties of Wakame
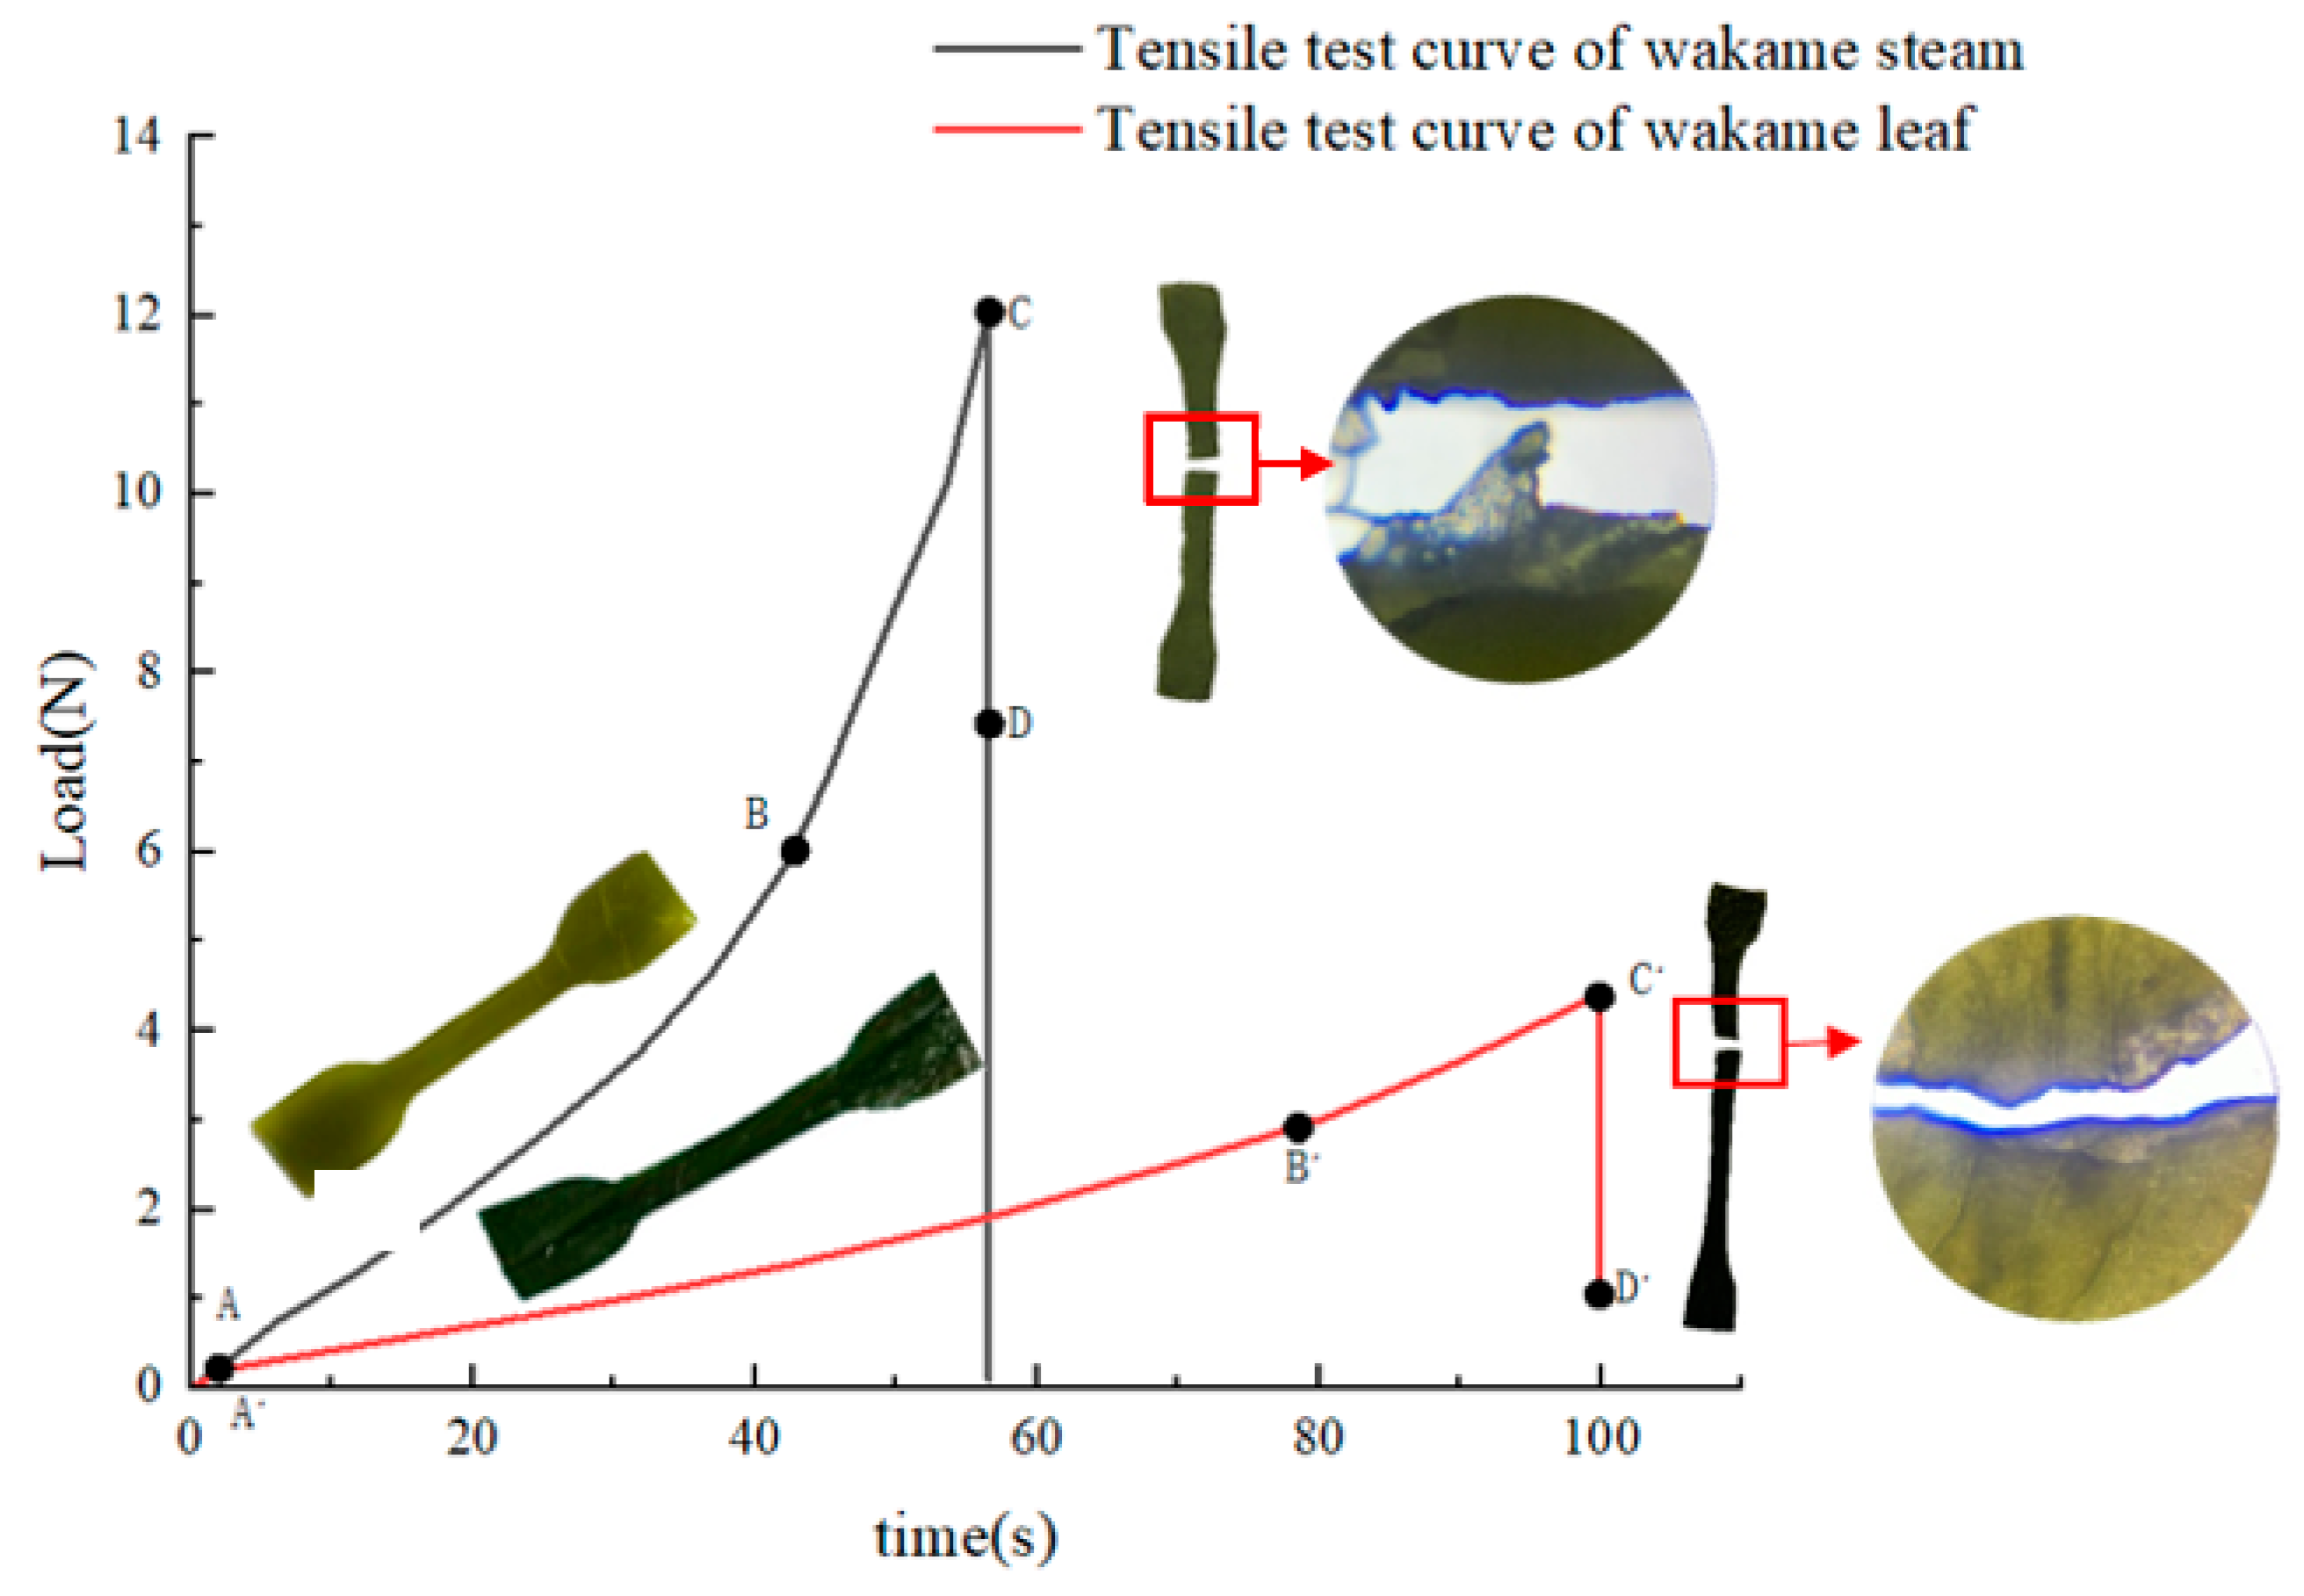
Figure 13 depicts the three-sectioned typical tensile curve of the wakame. In the AB section, the load grows exponentially as displacement rises. Wakame, a flexible aquatic crop, has excellent ductility and causes significant deformation in response to external forces of a small magnitude. The load change with the displacement curve was essentially linear before the displacement of section BC approached the breaking point C, showing that this stage is the elastic deformation stage of the wakame and that its deformation properties follow Hooke’s law. The elastic modulus of the wakame is represented by the slope of section BC. After point C, the plant was still under tensile tension. However, it did not show yield characteristics, but broke instantly, the tensile force decreased rapidly, and the tensile test ended.
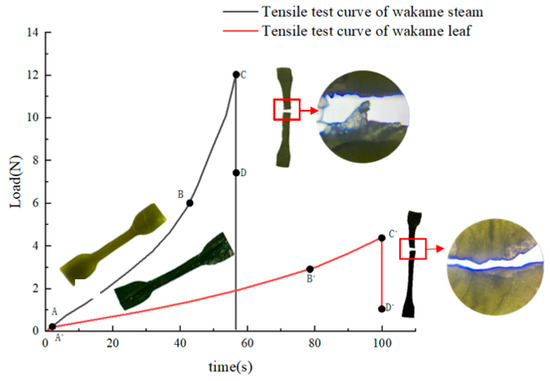
Figure 13.
Force–time curve of typical wakame stem and leaf tensile test.
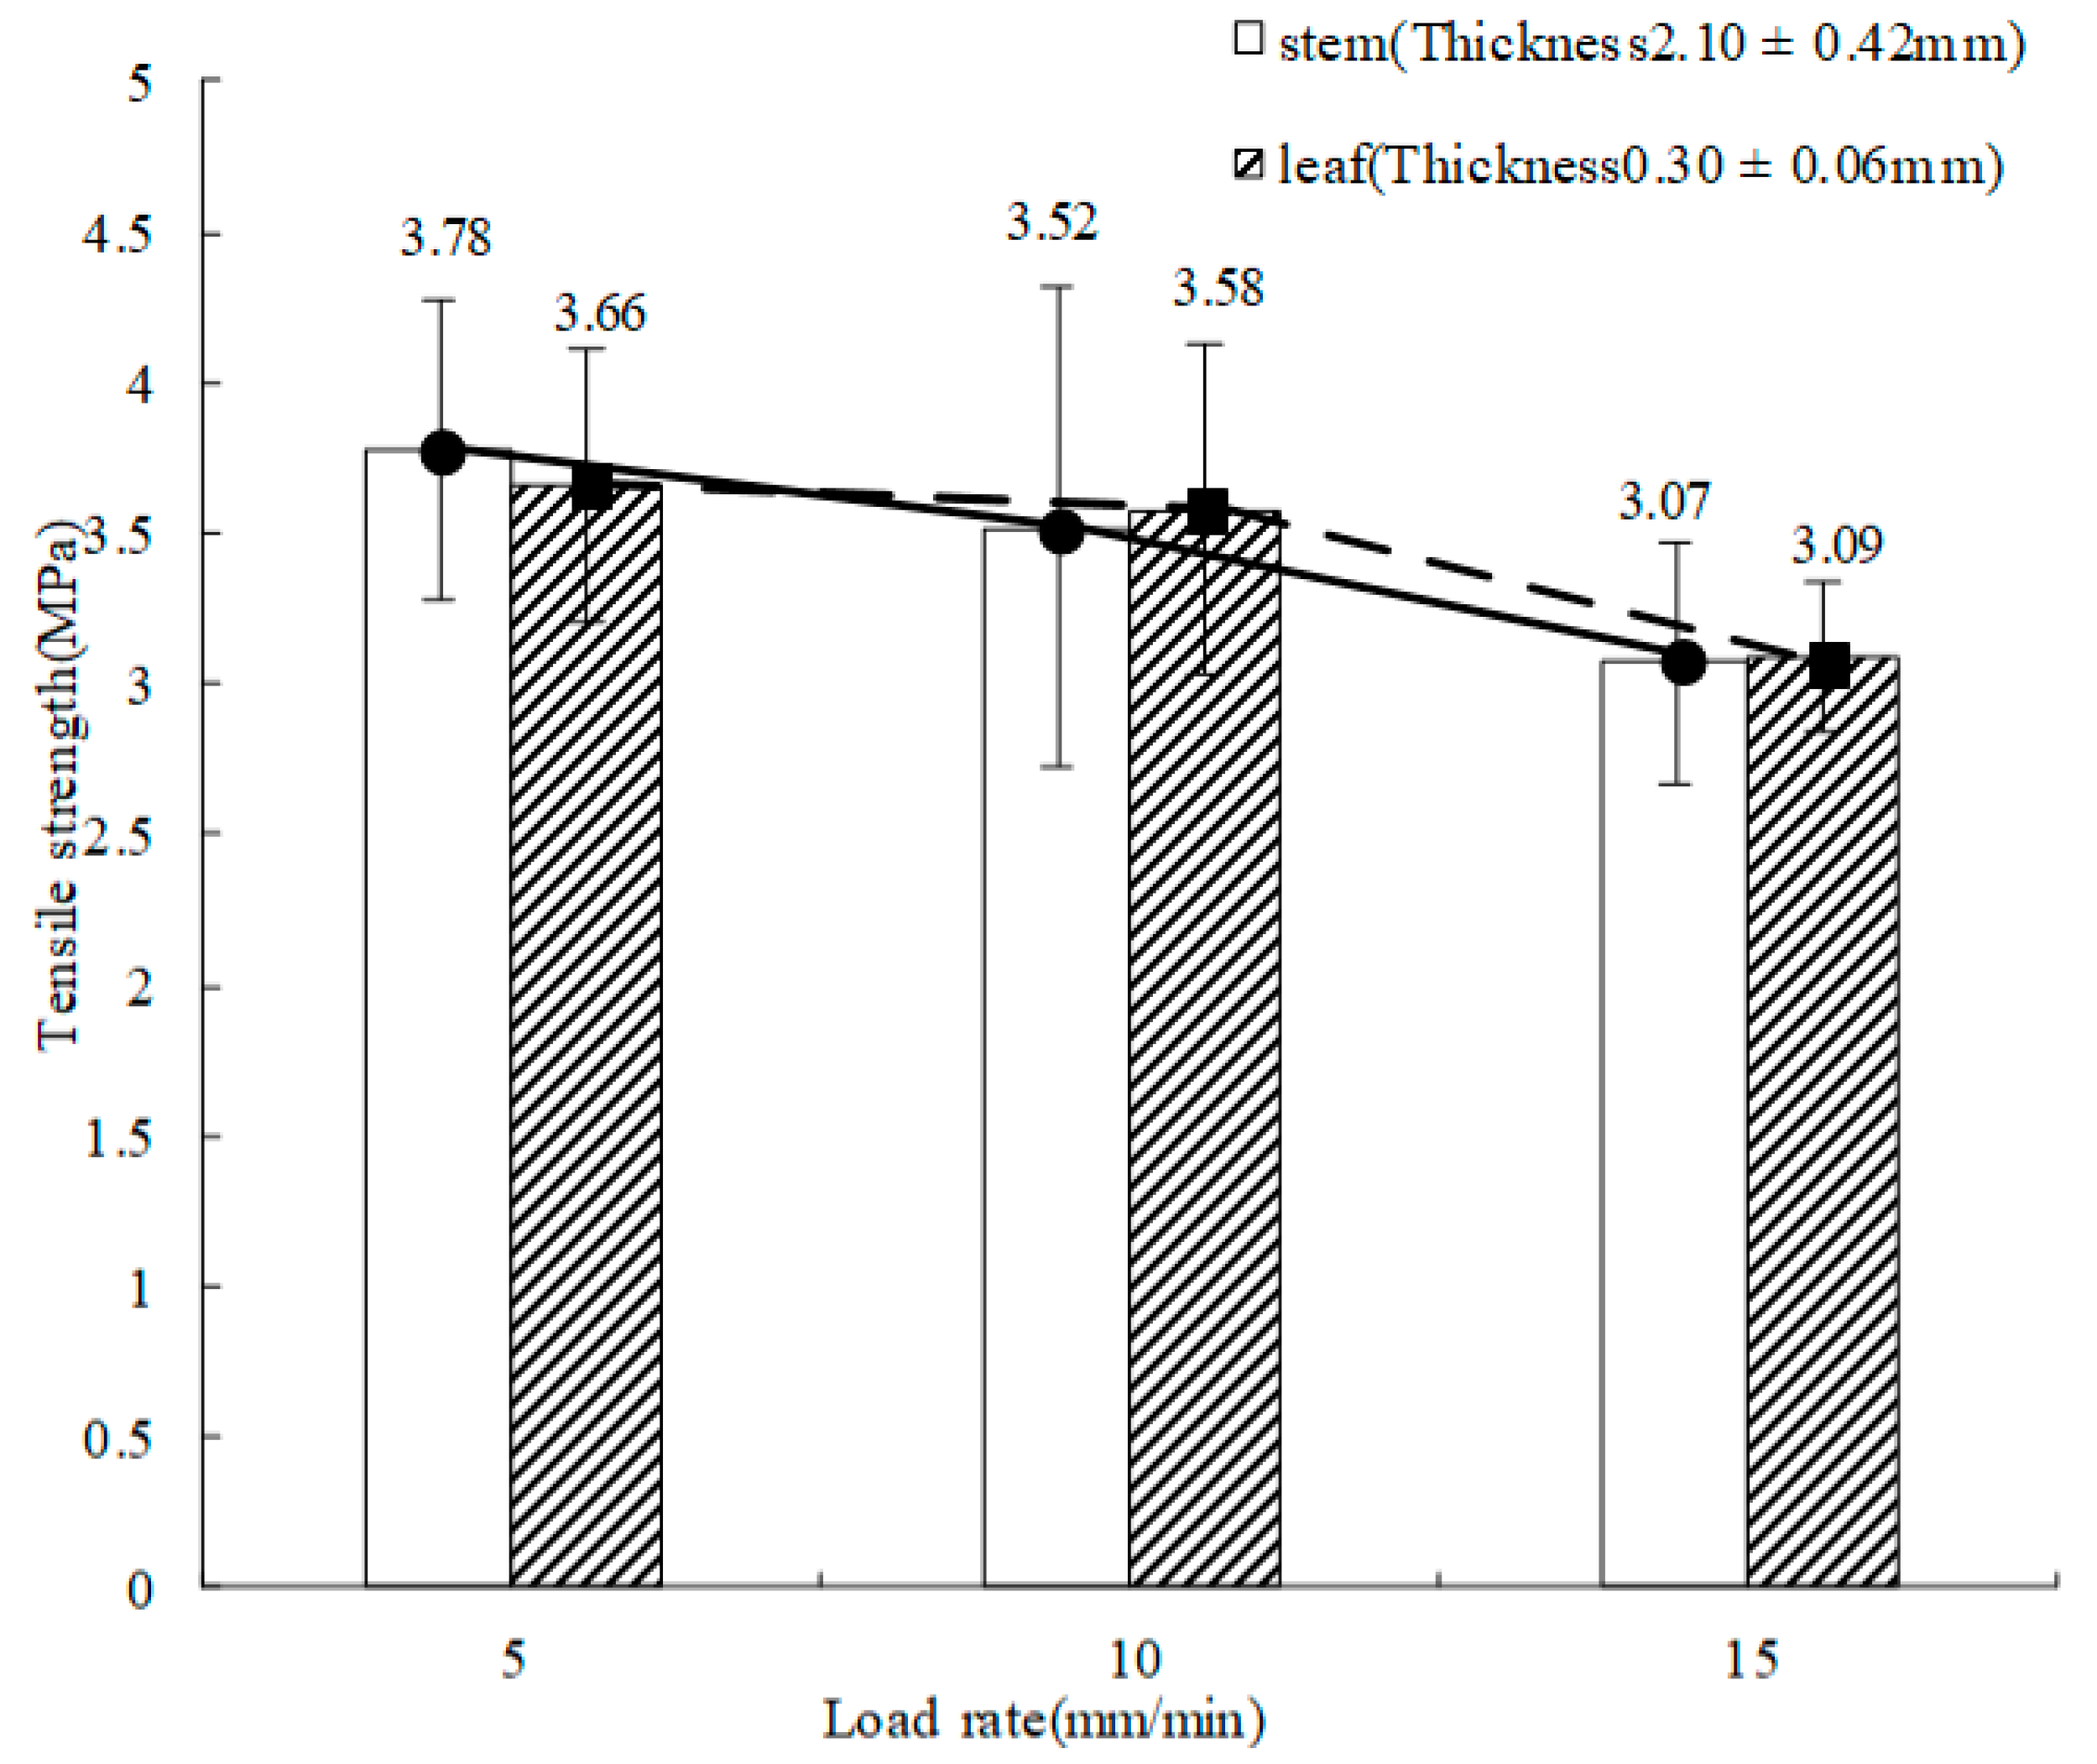
Figure 14 shows that the tensile strength of the wakame stem, with a thickness of 2.10 ± 0.42 mm, decreased from 3.78 MPa to 3.07 MPa with an increase in the loading speed from 5 mm/min to 15 mm/min, and the tensile strength of the wakame leaf, with a thickness of 0.30 ± 0.06 mm, decreased from 3.66 MPa to 3.09 MPa. The tensile strength of wakame stem and leaf decreased with the increase in the loading rate, while the tensile strength of the wakame stem and leaf decreased with the increase in loading rate; this is due to the stress creep phenomena in the wakame’s tensile process, which is a characteristic of biological materials with viscoelasticity. Wakame exhibits some brittleness as the loading rate rises, and it will fail before reaching the maximum tensile strength. Lu et al. [17] had similar conclusions on the study of mechanical properties of laver; it was found that the tensile strength of laver decreased from 3.56 MPa to 0.77 MPa when the loading rate increased from 10 mm/min to 50 mm/min, and the tensile strength was negatively correlated with the loading rate. Chen et al. [26] had different conclusions on the tensile test of fresh kelp. In their study, they found that the tensile strength is positively correlated with the tensile rate. This may be because the cell wall of fresh kelp contains more glia, which increases the ductility of kelp. However, after processing, the internal cells of salted petunia in this paper were severely dehydrated and had lower elasticity, greater brittleness, and poor ductility. During the operation of the stem–leaf separation equipment, the tensile force mainly comes from the pulling force caused by the different movement directions of the equipment parts. The excessive movement speed will cause the fracture damage of the processed dishes. This result can provide a reference for the movement speed of the contact parts of the stem–leaf separation equipment.
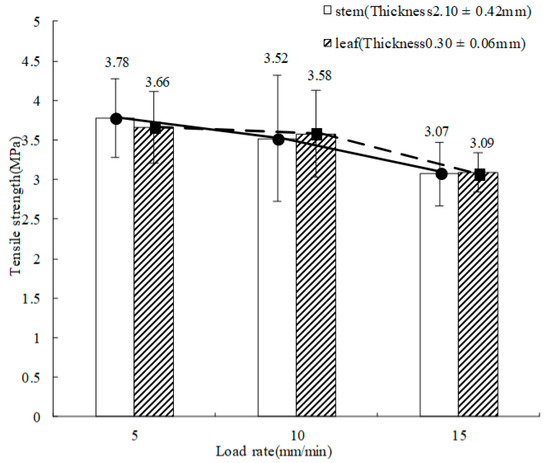
Figure 14.
Tensile strength of wakame stem and leaf under different loading rates.
The effect of thickness on the tensile strength of the wakame stem and leaf is shown in Figure 15. When the loading rate was 10 mm/min, the tensile strength increased from 2.32 MPa to 4.03 MPa when the thickness of the wakame stem increased from 1.10 ± 0.50 mm to 3.10 ± 0.50 mm, and from 2.44 MPa to 3.60 MPa when the thickness of the wakame leaf increased from 0.20 ± 0.05 mm to 0.40 ± 0.08 mm. The tensile strength of wakame increased with the thickness of its stem and leaf because the stem of wakame is mainly composed of epidermis, cortex, and pith, and the leaf is mainly composed of cortex cells, while the cortex cell wall contains abundant glia. With the increase in the sample thickness and maturity, the number of cortex cells also increased correspondingly, accompanied by the stronger the ability to resist external forces. Chen [26] had similar research results on the mechanical properties of kelp; the tensile strength of kelp was positively correlated with its thickness; in their study, the loading rate was 10 mm/min, and the tensile strength decreased from 4.63 MPa to 1.82 MPa when the thickness of kelp decreased from 1.16 mm to 0.48 mm, and the mechanical characteristics showed that the tensile strength increased with the increase in its thickness. The thickness and tensile strength of the same wakame gradually decreased from root to tail. During the separation and processing of wakame stem and leaf from root to tail, the equipment operating speed can be appropriately reduced to ensure the integrity of the wakame.
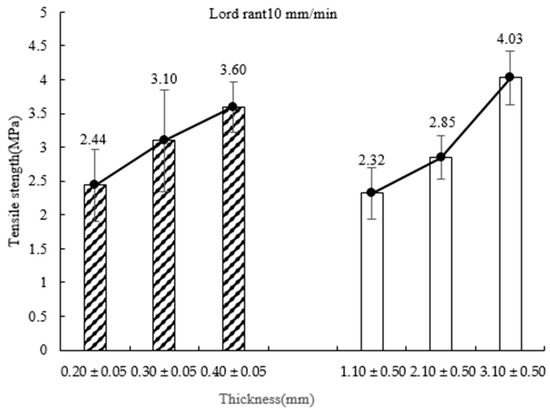
Figure 15.
Tensile strength of wakame stem and leaf under different thickness.
3.2. Analysis on Compressive Properties of Wakame
The resilience reflects the ability of wakame to recover deformation after compression. If the wakame tissue is damaged greatly during compression, its resilience will be smaller. The test shows that wakame stem has better resilience under the condition of 60% deformation. Figure 16 is the TPA characteristic curve of a typical wakame stem.

Figure 16.
TPA characteristic curve of typical wakame stem.
Figure 17a illustrates how, as the loading rate rises from 5 mm/min to 15 mm/min, the recovery of the 2.10 ± 0.58 mm thick stem of wakame increases from 0.27 to 0.31. The resilience of wakame stem increased with the increase in the loading rate. The slower the speed, the longer the compression time, which could cause the resilience to worsen. This is similar to the conclusion of Li Yumei’s [27] research on potato recovery under different loading rates, which found that potato tuber resilience increased with the increase in loading rates.
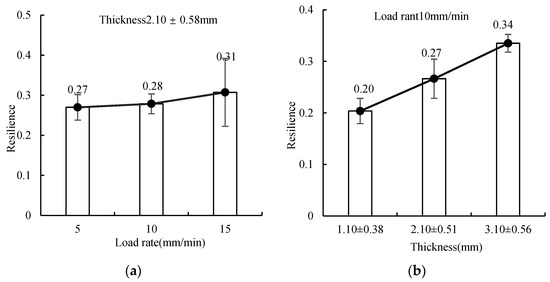
Figure 17.
Resilience of wakame stem under different thickness and loading rate. (a) Resilience of wakame stem under different load rate; (b) Resilience of wakame stem under different thickness.
Figure 17b shows that when the thickness of the wakame stem increased from 1.10 ± 0.38 mm to 3.10 ± 0.56 mm at a loading rate of 10 mm/min, its resilience increased from 0.20 to 0.34, and the greater the thickness, the better the ability to maintain bioelasticity. The reason is that as the thickness increased, the more mature the stem of wakame became and the closer its tissue cells were arranged, and a tightly arranged cell structure increased the pressure resistance of the wakame stem. The clamping time and depth of the wakame can be suitably decreased during the operation of the stem–leaf separation equipment to lower the degree of squeezing of the wakame. This will assure the quality of wakame.
3.3. Analysis of Shear Resistance Characteristics of Wakame
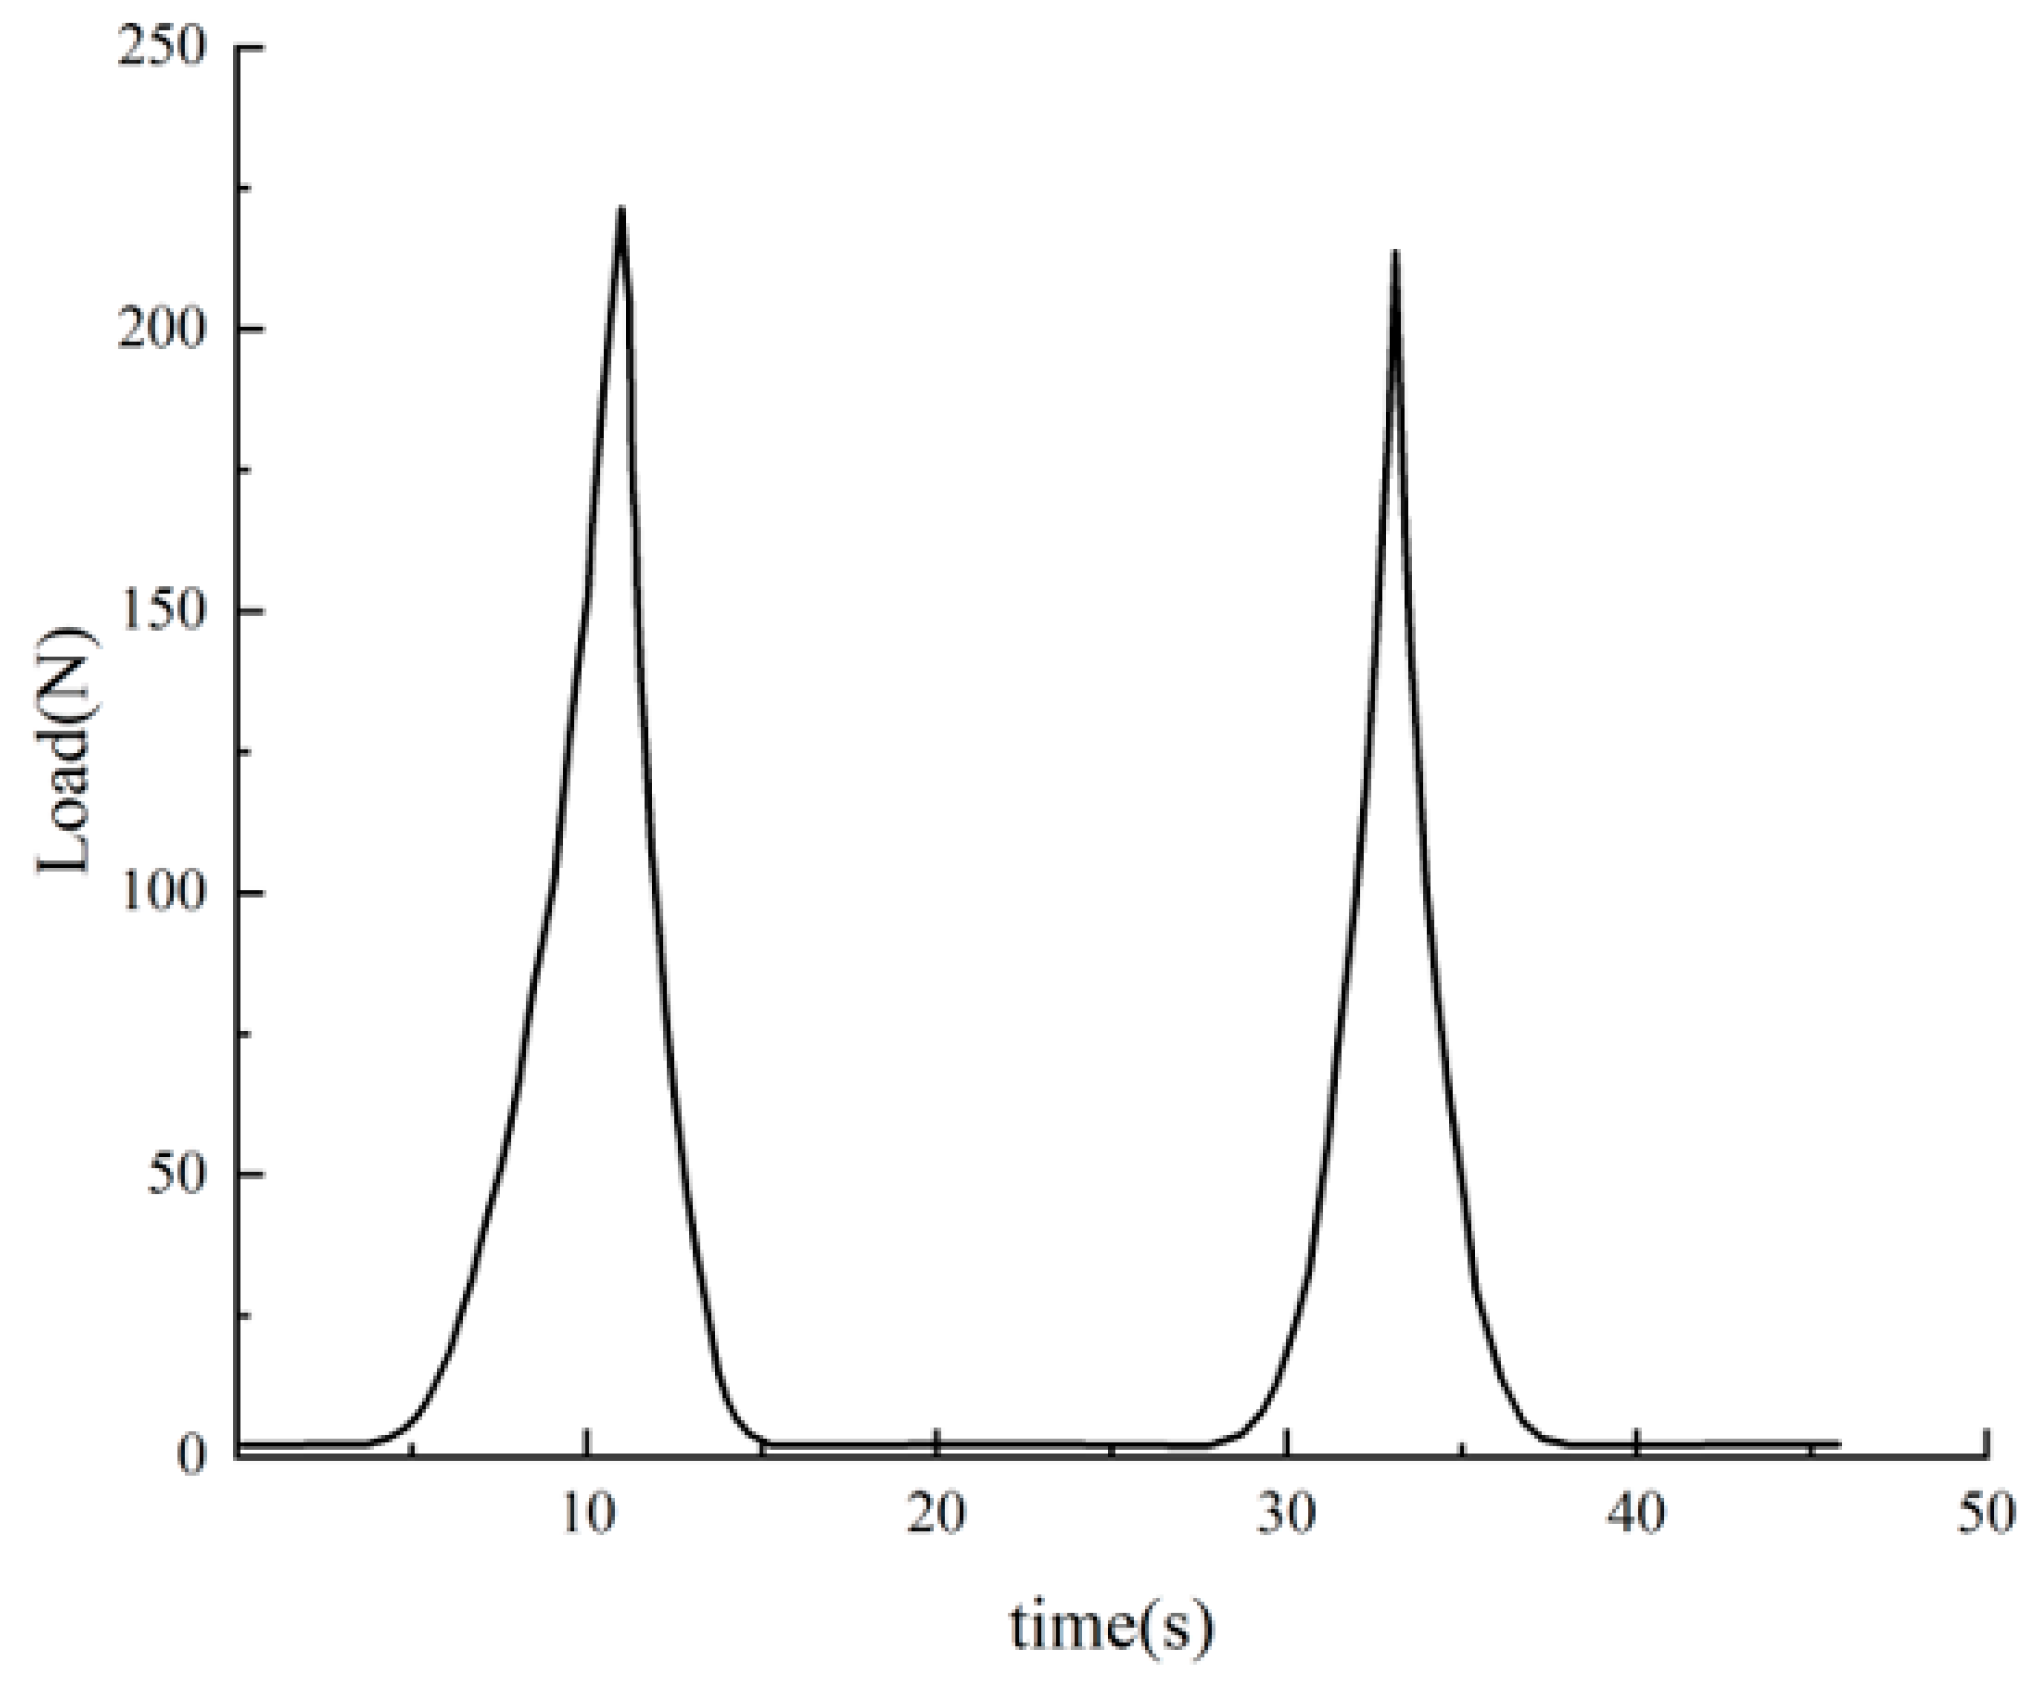
The typical shear-time curve of the wakame stem and leaf is shown in Figure 18. The stem of wakame has a higher shear strength than the leaf at the same loading rate. Wakame leaf is made up of a single layer of densely packed cortical cells, but the wakame stem is a composite structure made up of cutex, endodermis, and pith. The primary cause of the difference in shear strength between the stem and leaf of wakame is the distinct structure of the stem and leaf.
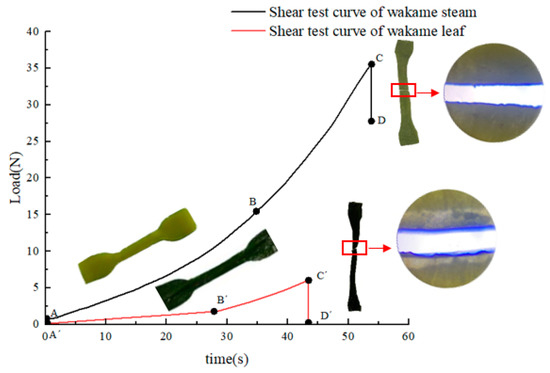
Figure 18.
Shear-time curve of typical wakame stem and leaf.
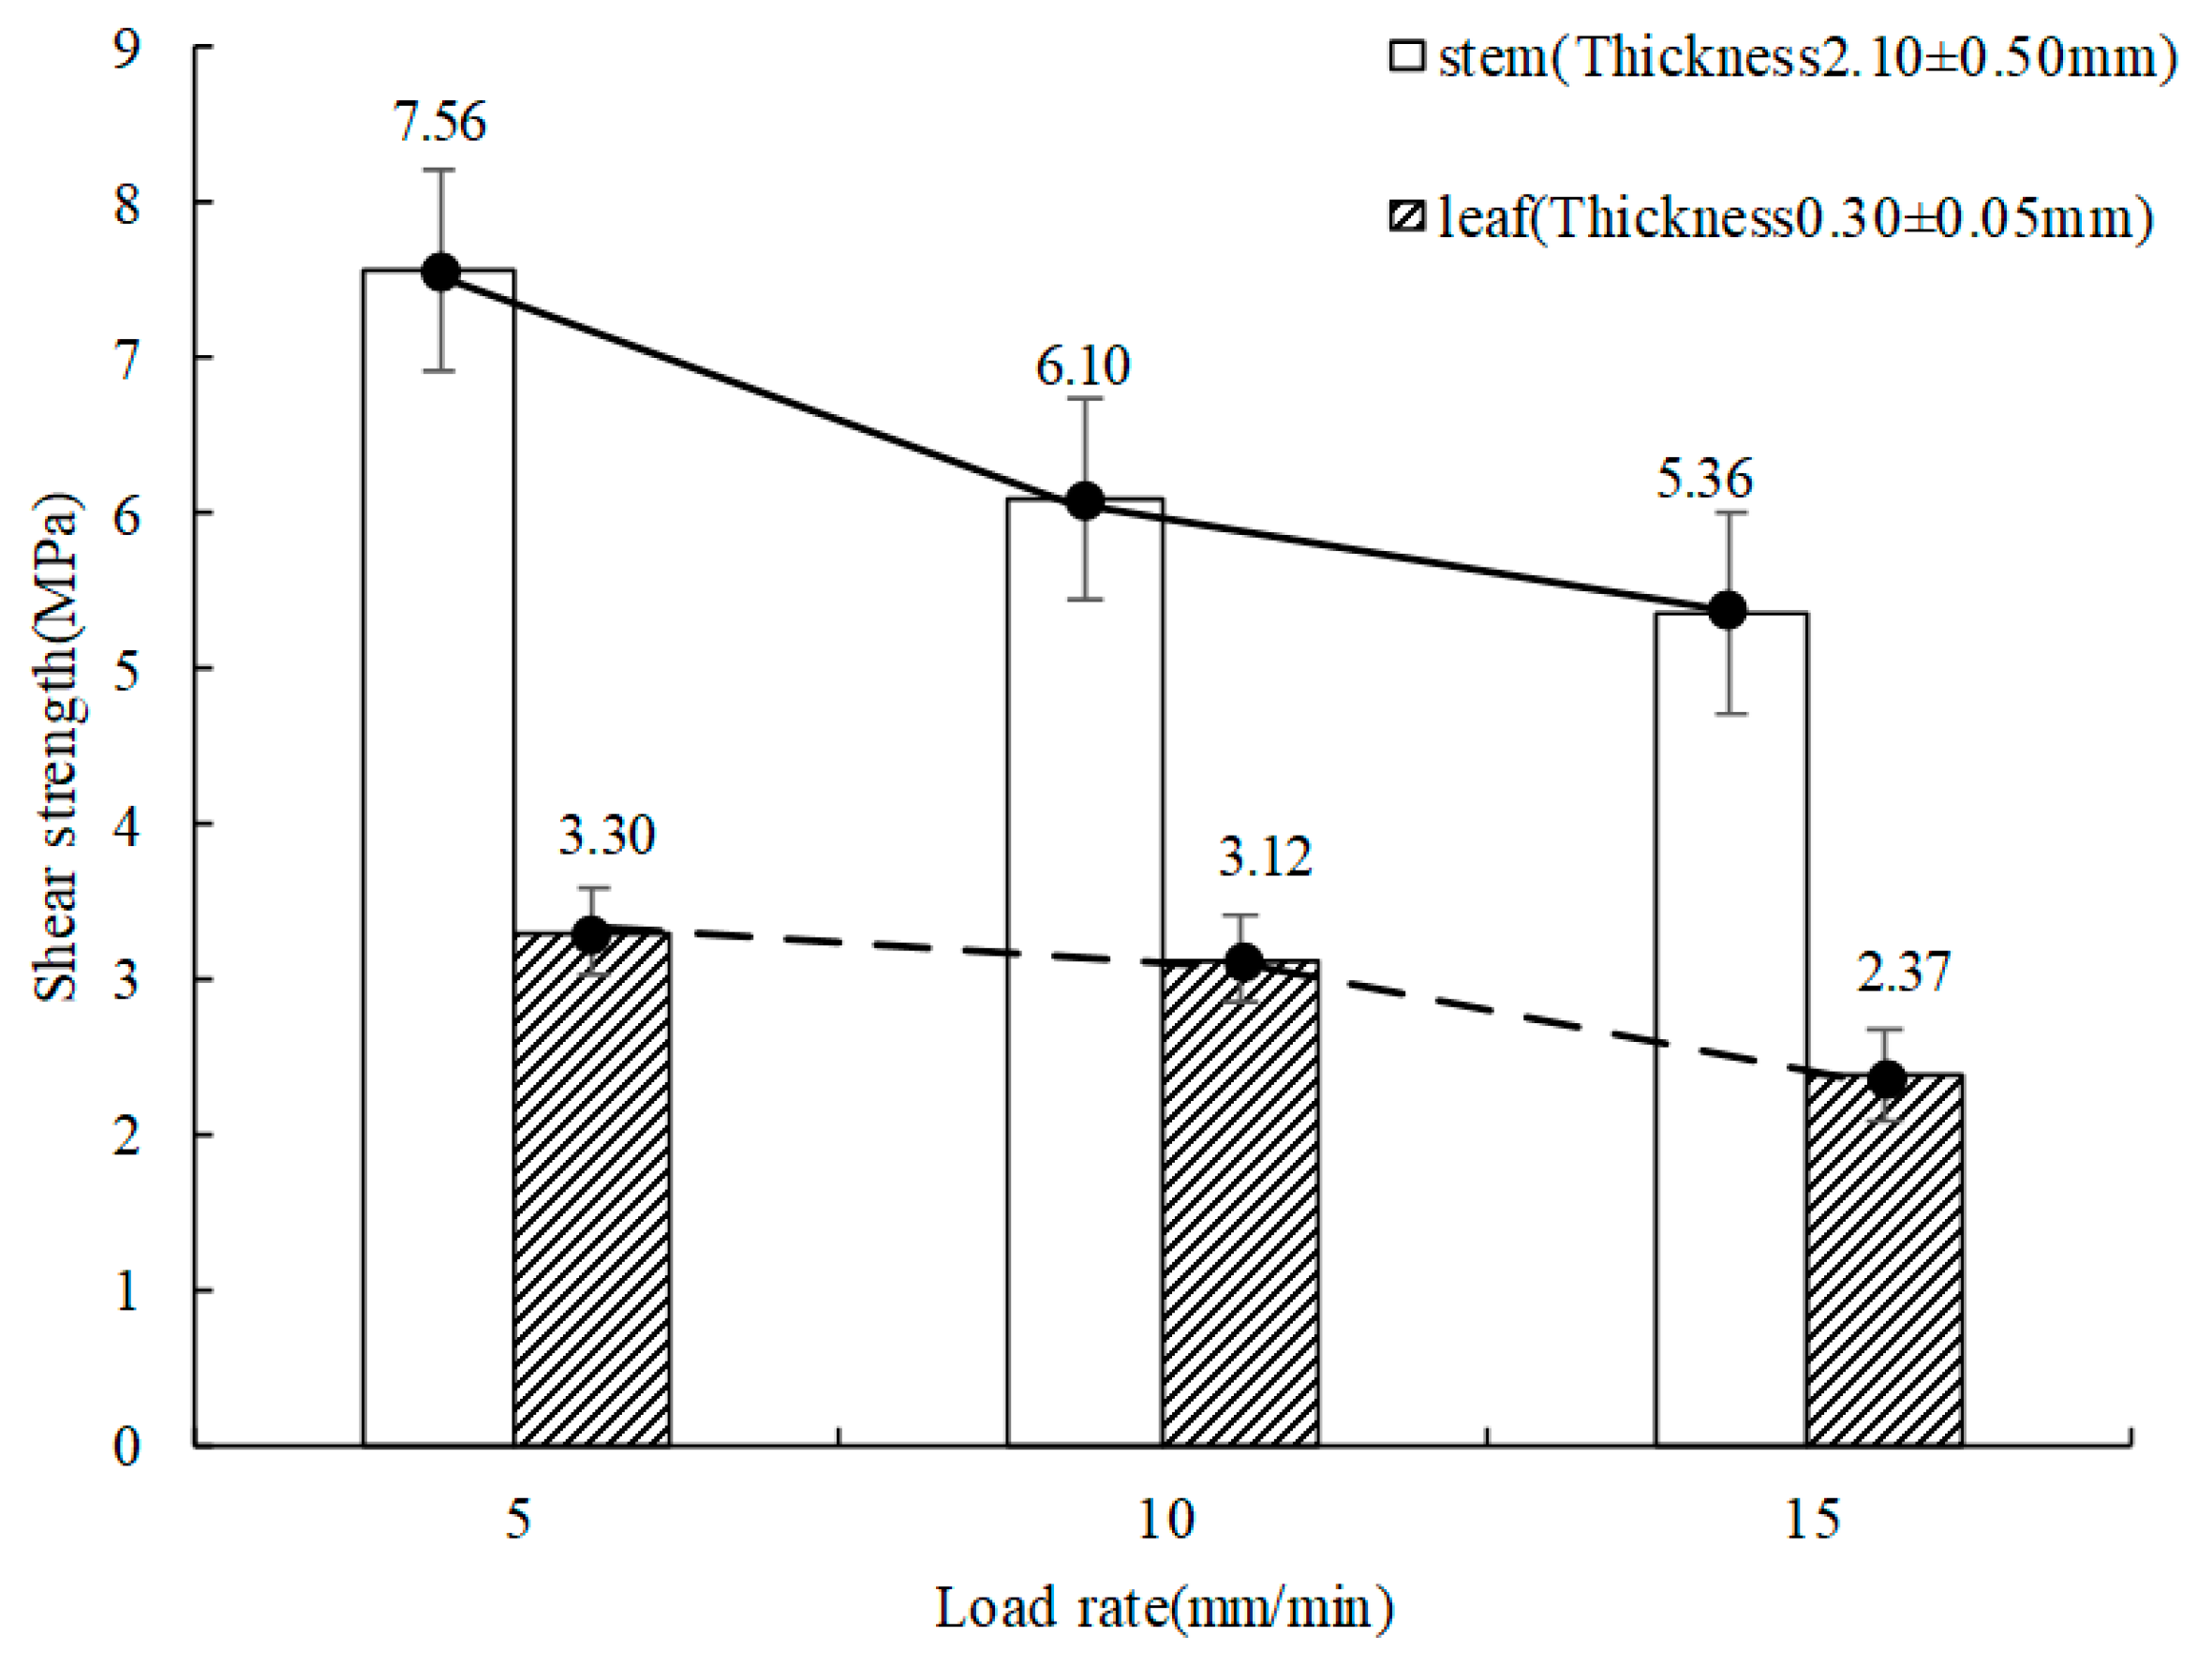
According to Figure 19, when the loading rate increased from 5 mm/min to 15 mm/min, the shear strength of wakame stem with a thickness of 2.10 ± 0.49 mm decreased from 7.56 MPa to 5.36 MPa, and that of wakame leaf with a thickness of 0.30 ± 0.06 mm decreased from 3.30 MPa to 2.34 MPa. With the increase in the loading rate, the shear strength of wakame stem and leaf showed a downward trend. Wakame, as a kind of aquatic flexible organism, has a certain viscoelasticity. At a low loading rate, the wakame was pressed tightly and resisted the shear of the cutting tool. However, at a high loading rate, the elastic wall of the cell did not have enough time to pass the shear force to the viscous liquid in the cell, resulting in a decrease in shear strength of the wakame stems and leaves when the loading rate increased. P.S. Chattopadhyay et al. [28] had similar conclusions about the shear characteristics of sorghum stems. When the shear angle was fixed, the loading rate increased from 10 mm/min to 100 mm/min, and the maximum shear strength of sorghum stems decreased from 3.74 MPa to 1.94 MPa.
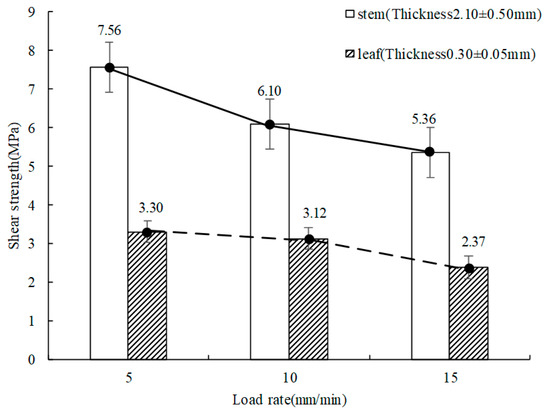
Figure 19.
Shear strength of wakame under different loading rates.
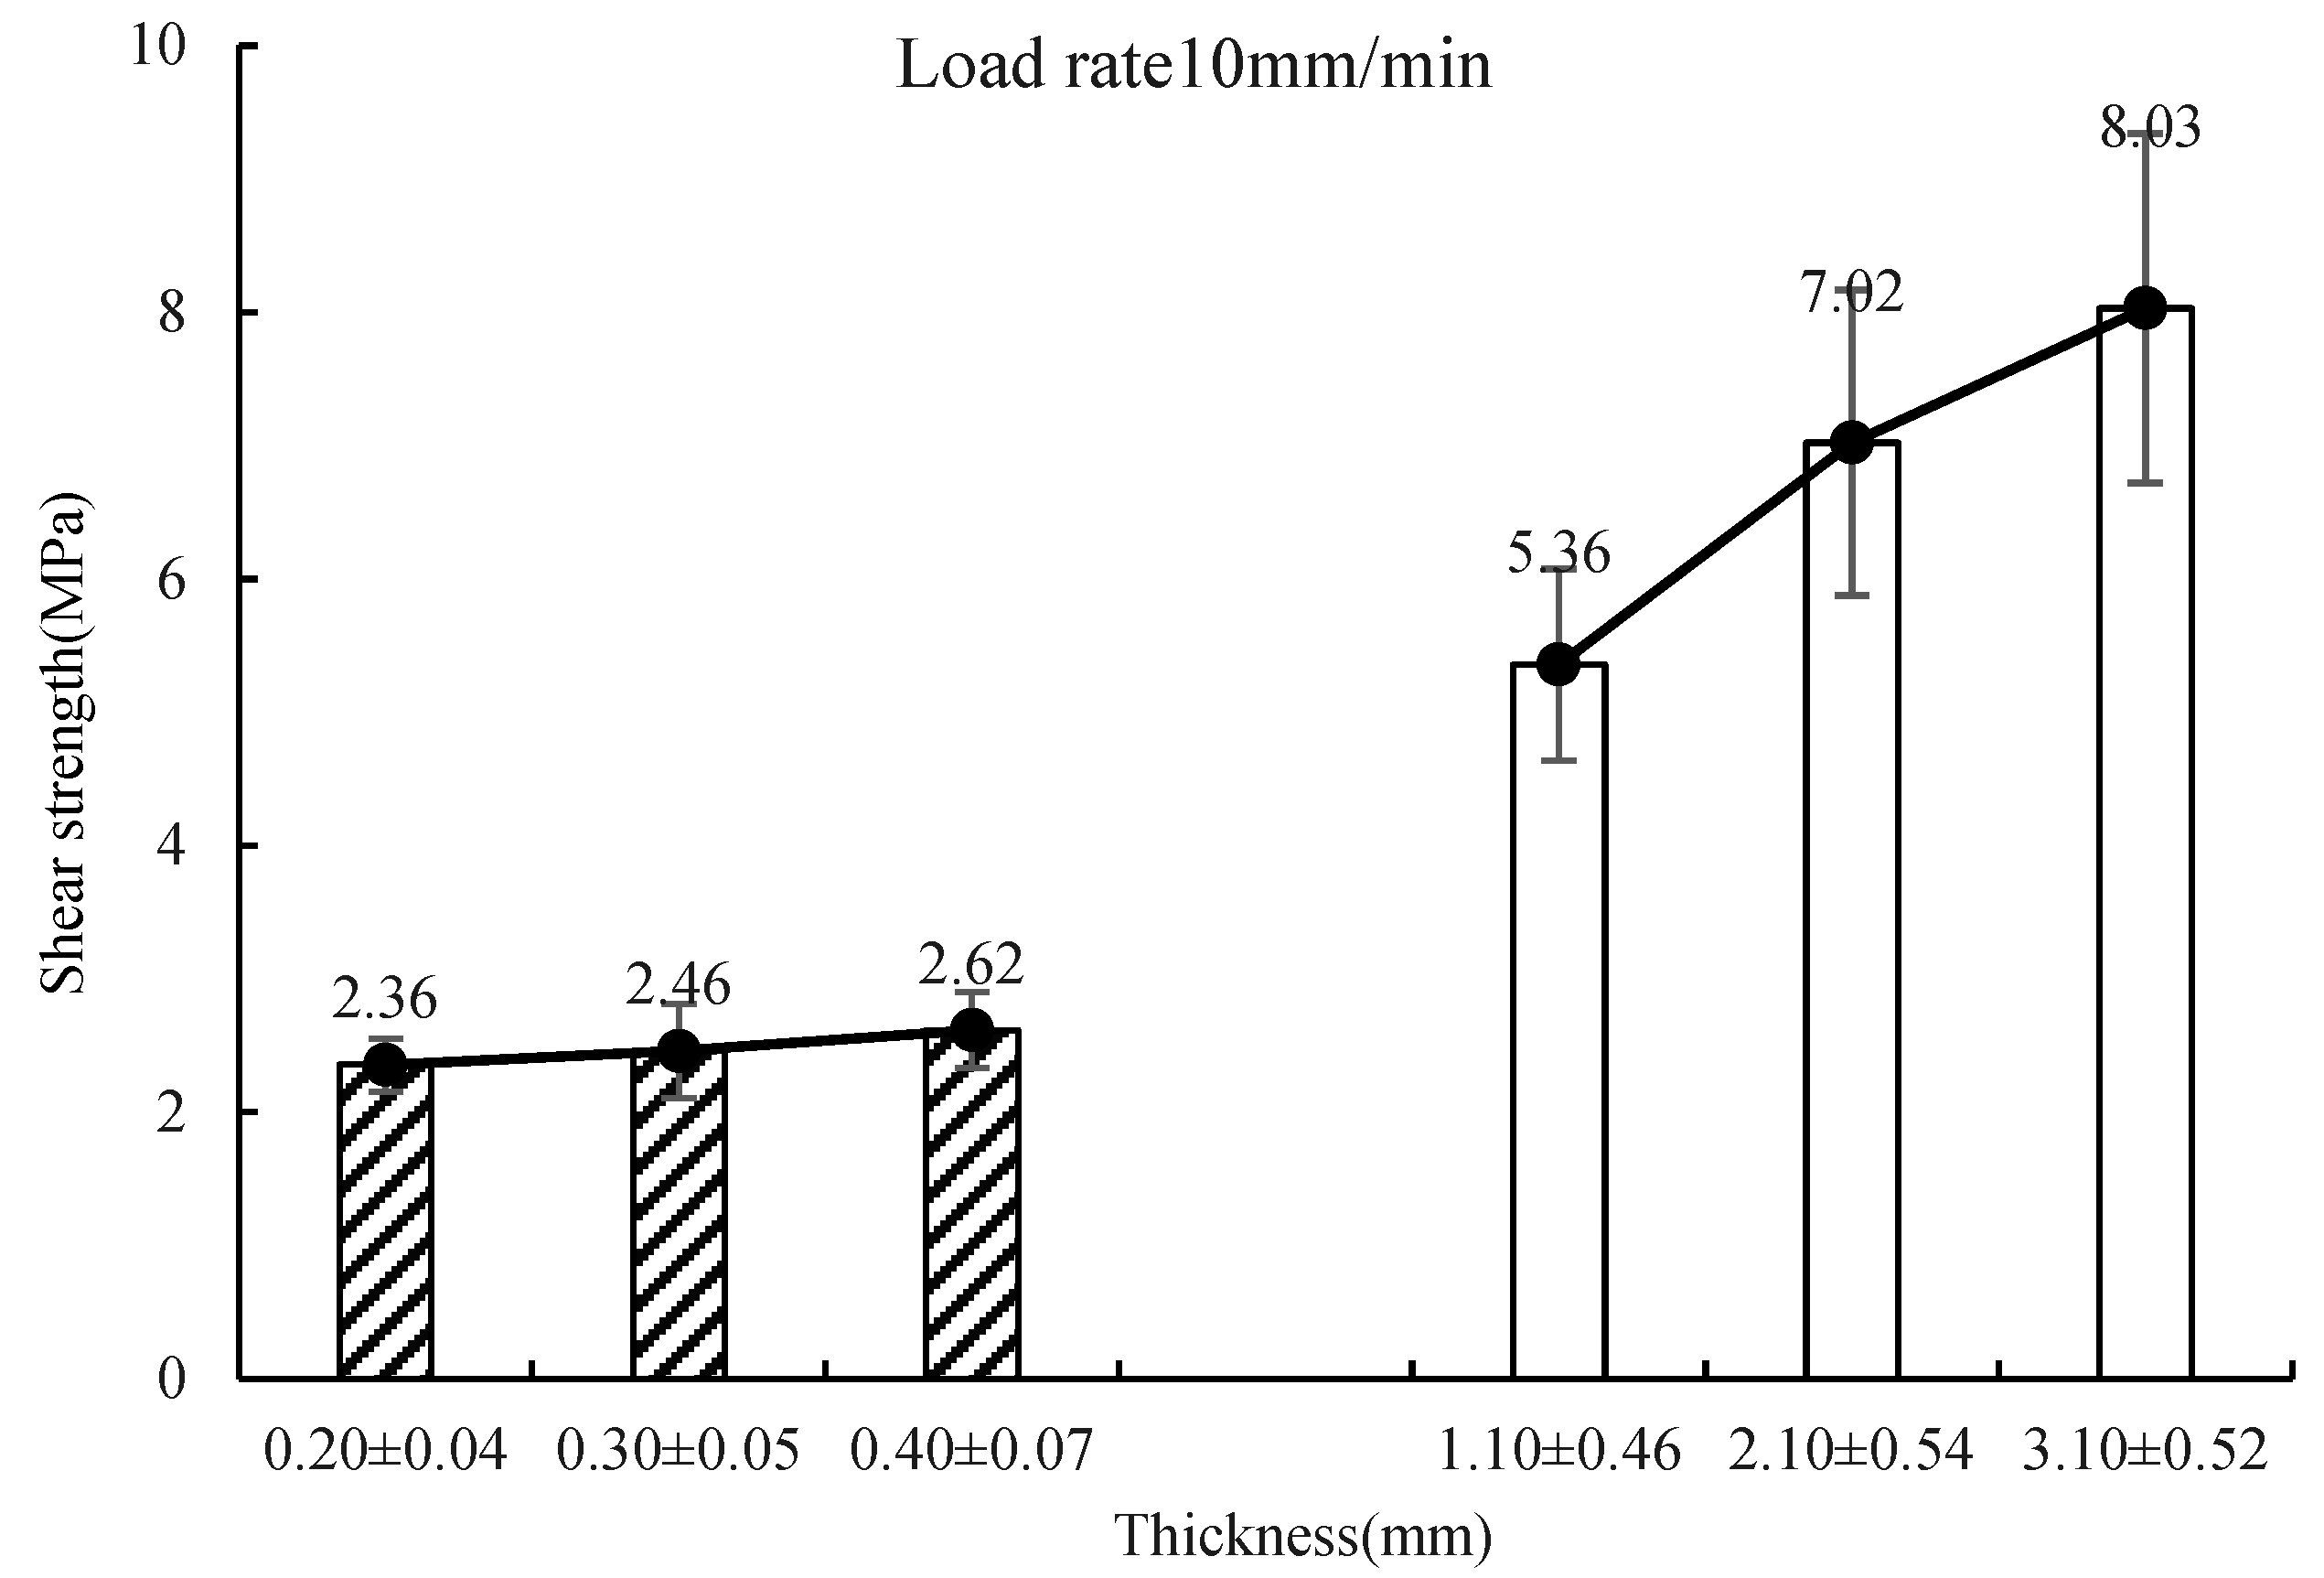
Figure 20 shows that the shear strength increased from 5.36 MPa to 8.03 MPa when the stem thickness of the wakame increased from 1.10 ± 0.46 mm to 3.10 ± 0.52 mm at a loading rate of 10 mm/min. The shear strength increased from 2.35 MPa to 2.61 MPa when the thickness of the wakame leaves increased from 0.20 ± 0.04 mm to 0.40 ± 0.07 mm. The shear strength of the wakame stem and leaf increased with the increase in thickness, but the change range of the leaf thickness was small, about 0.20 mm, so the shear strength of the wakame leaves changed little. As the thickness of wakame stem increased, the amount of pith filament in the central pith also increased, and the shear strength of the pith filament was higher, so the shear strength of the wakame stem increased significantly with the increase in thickness. This is consistent with the conclusion of Xue et al. [29] in the study on the effect of cassava stem growth sites on shear strength; they found that the cassava stem growth site had a very significant impact on shear strength, and the maximum shear strength gradually decreased from the root to the tail sheath stem diameter, and the radial shear strength decreased from 2.50 MPa to 1.91 MPa.
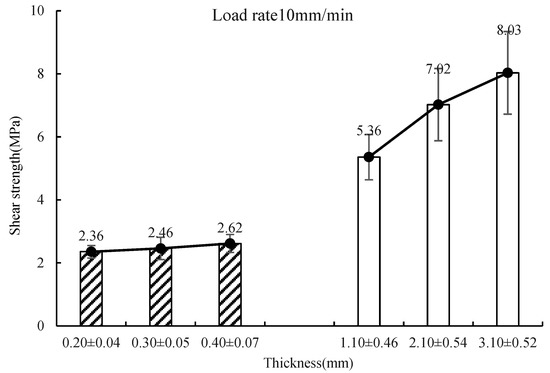
Figure 20.
Shear strength of wakame under different thickness.
The shear force produced on the wakame was mainly caused by the impact force of equipment movement. Considering that the thickness of the wakame gradually decreased from root to tail, in order to reduce the damage of the wakame in the stem–leaf separation equipment without affecting the working efficiency, the working speed of equipment from root to tail can be appropriately reduced.
3.4. Analysis of Stem and Leaf Separation Characteristics of Wakame
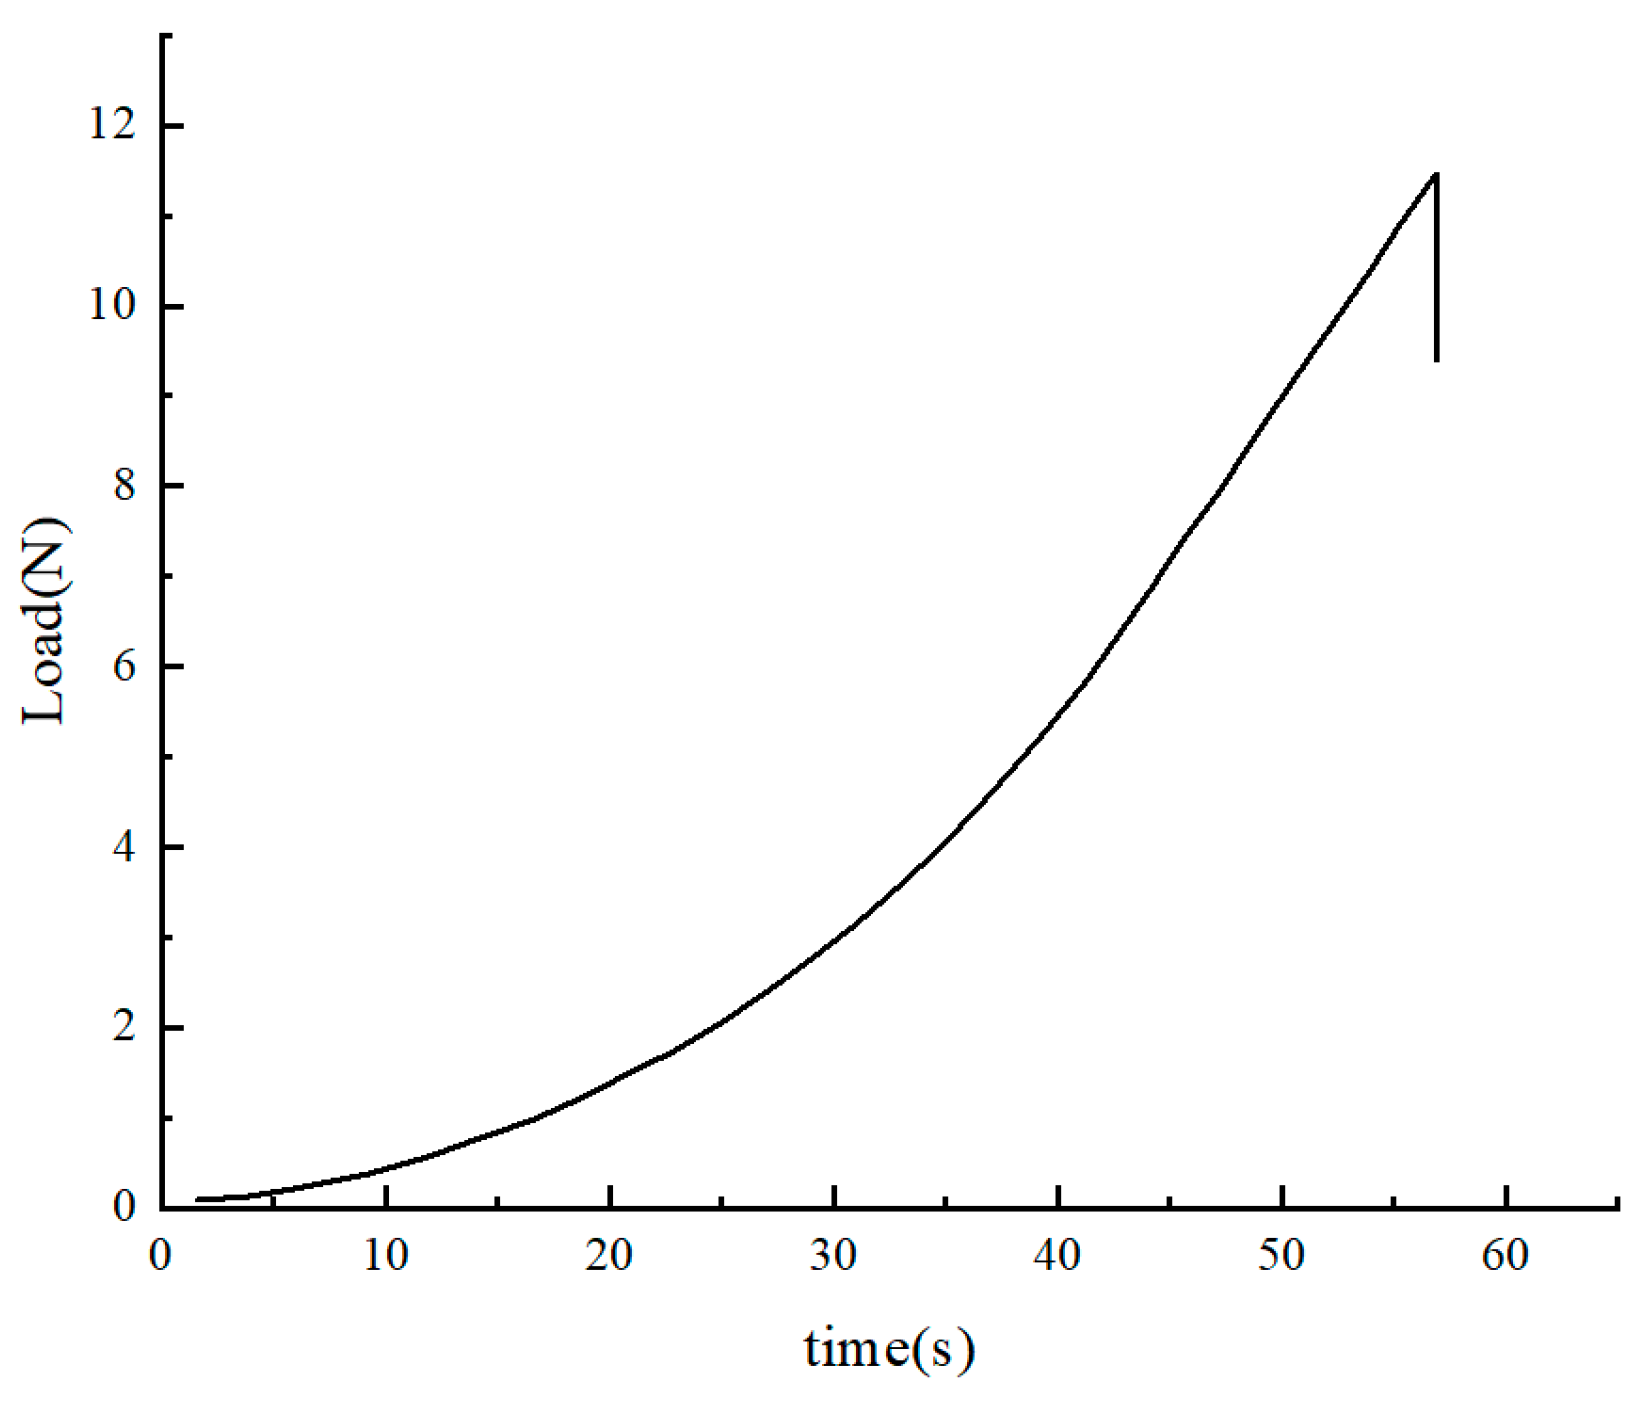
Figure 21 shows the typical stem–leaf separation force–time curve, which is composed of three parts, including the taut stage, the elastic stage and the rupture stage, which is determined by the elastic material of wakame.
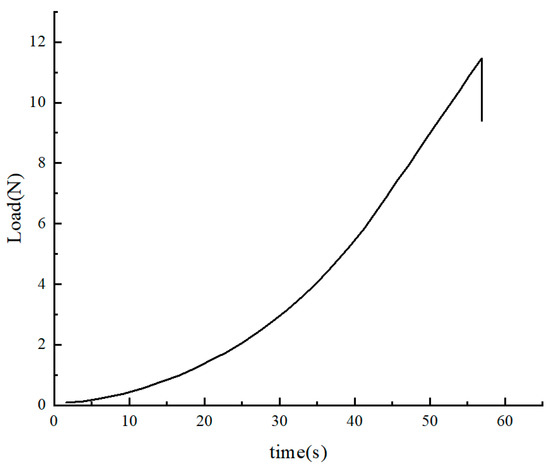
Figure 21.
Typical stem–leaf separation force–time curve.
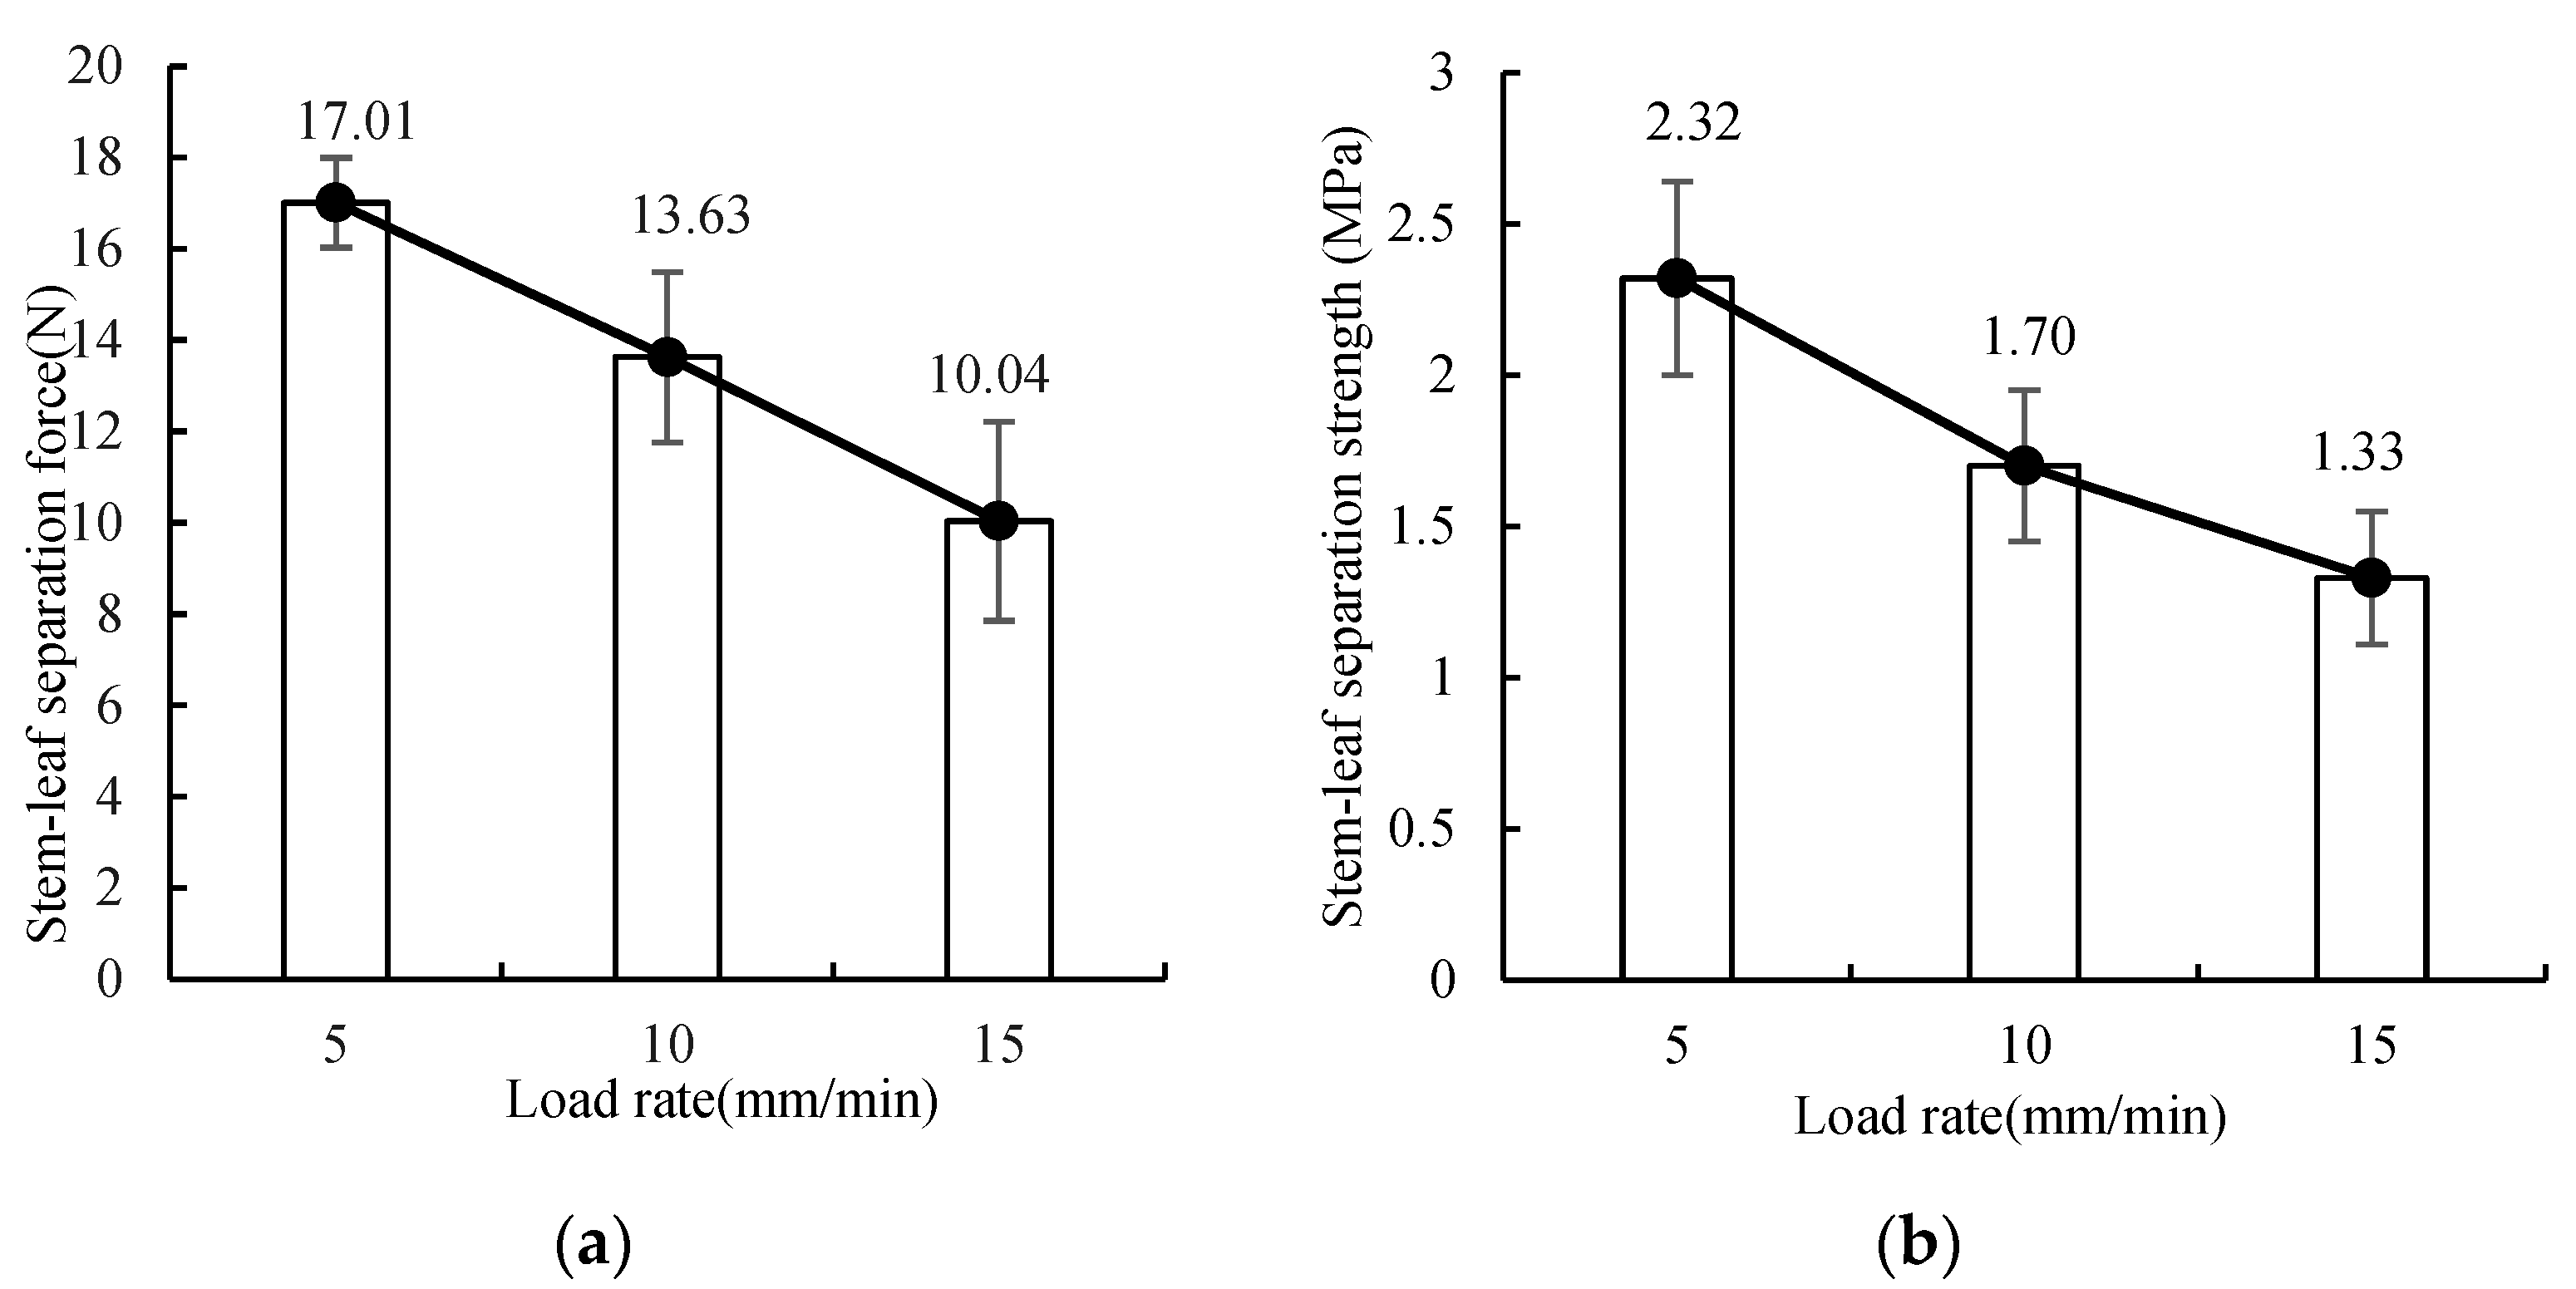
Figure 22 shows the change of stem and leaf separation force and strength with the loading rate. In the test, the stem thickness of wakame was 2.10 ± 0.54 mm, and the leaf thickness was 0.30 ± 0.03 mm. When the loading rate increased from 5 mm/min to 15 mm/min, the stem–leaf separation force decreased from 17.01 N to 10.04 N, and the stem–leaf separation strength decreased from 2.32 MPa to 1.33 MPa. When the loading rate increased, the stem–leaf separation force and separation strength of the wakame decreased. Without affecting the processing efficiency, the loading rate of the stem–leaf separation equipment can be appropriately increased to obtain the lower stem–leaf separation intensity of the wakame.
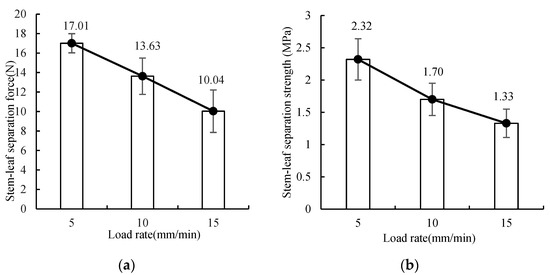
Figure 22.
Wakame stem–leaf separation force and strength under different loading rates. (a) wakame stem–leaf separation force under different loading rates; (b) wakame stem–leaf separation strength under different loading rates.
Figure 23 shows the stem and leaf separation force and strength of the wakame under different thickness. The loading rate in the test was 10 mm/min. The test sample was divided into three groups. In the first group, the stem thickness was 1.10 ± 0.12 mm and the leaf thickness was 0.20 ± 0.04 mm. In the second group, the stem thickness was 2.10 ± 0.76 mm and the leaf thickness was 0.30 ± 0.06 mm. In the third group, the stem thickness was 3.10 ± 0.59 mm and the leaf thickness was 0.40 ± 0.07 mm. In the first group, the stem–leaf separation force was 6.38 N and the stem–leaf separation strength was 1.23 MPa. In the second group, the stem–leaf separation force was 11.52 N and the stem–leaf separation strength was 1.50 MPa. In the third group, the stem–leaf separation force was 12.21 N and the stem–leaf separation strength was 1.69 MPa. With the increase in the stem and leaf thickness of the wakame, its stem and leaf separation force and intensity showed an increasing trend. Because the thickness of the stem–leaf junction in group 1 was 0.41 ± 0.09 mm, the thickness of the stem–leaf junction in group 2 was 0.57 ± 0.13 mm. The thickness of the stem–leaf junction in group 3 was 0.63 ± 0.23 mm, and the thickness difference between the stem–leaf junction in groups 1 and 2 was 0.16 mm, while the thickness difference between the stem–leaf junction in groups 2 and 3 was 0.06 mm. The growth trend of the stem–leaf separation force in group 1 to group 2 was significantly greater than that in group 2 to group 3. For the same root of the wakame, the thickness gradually decreased from the root to the tail. On the premise of no tensile fracture and shear fracture, the stem–leaf separation speed can be adjusted according to the thickness to improve the stem–leaf separation efficiency.
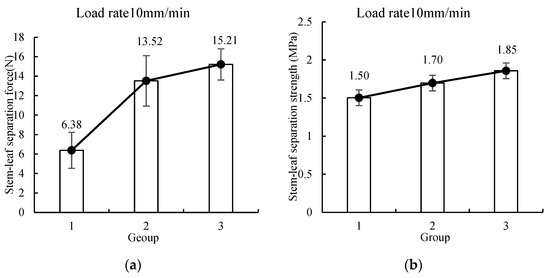
Figure 23.
Wakame stem–leaf separation force and strength under different thickness. (a) wakame stem–leaf separation force under different thickness; (b) wakame stem–leaf separation strength under different thickness.
3.5. Analysis of Frictional Characteristics of Wakame
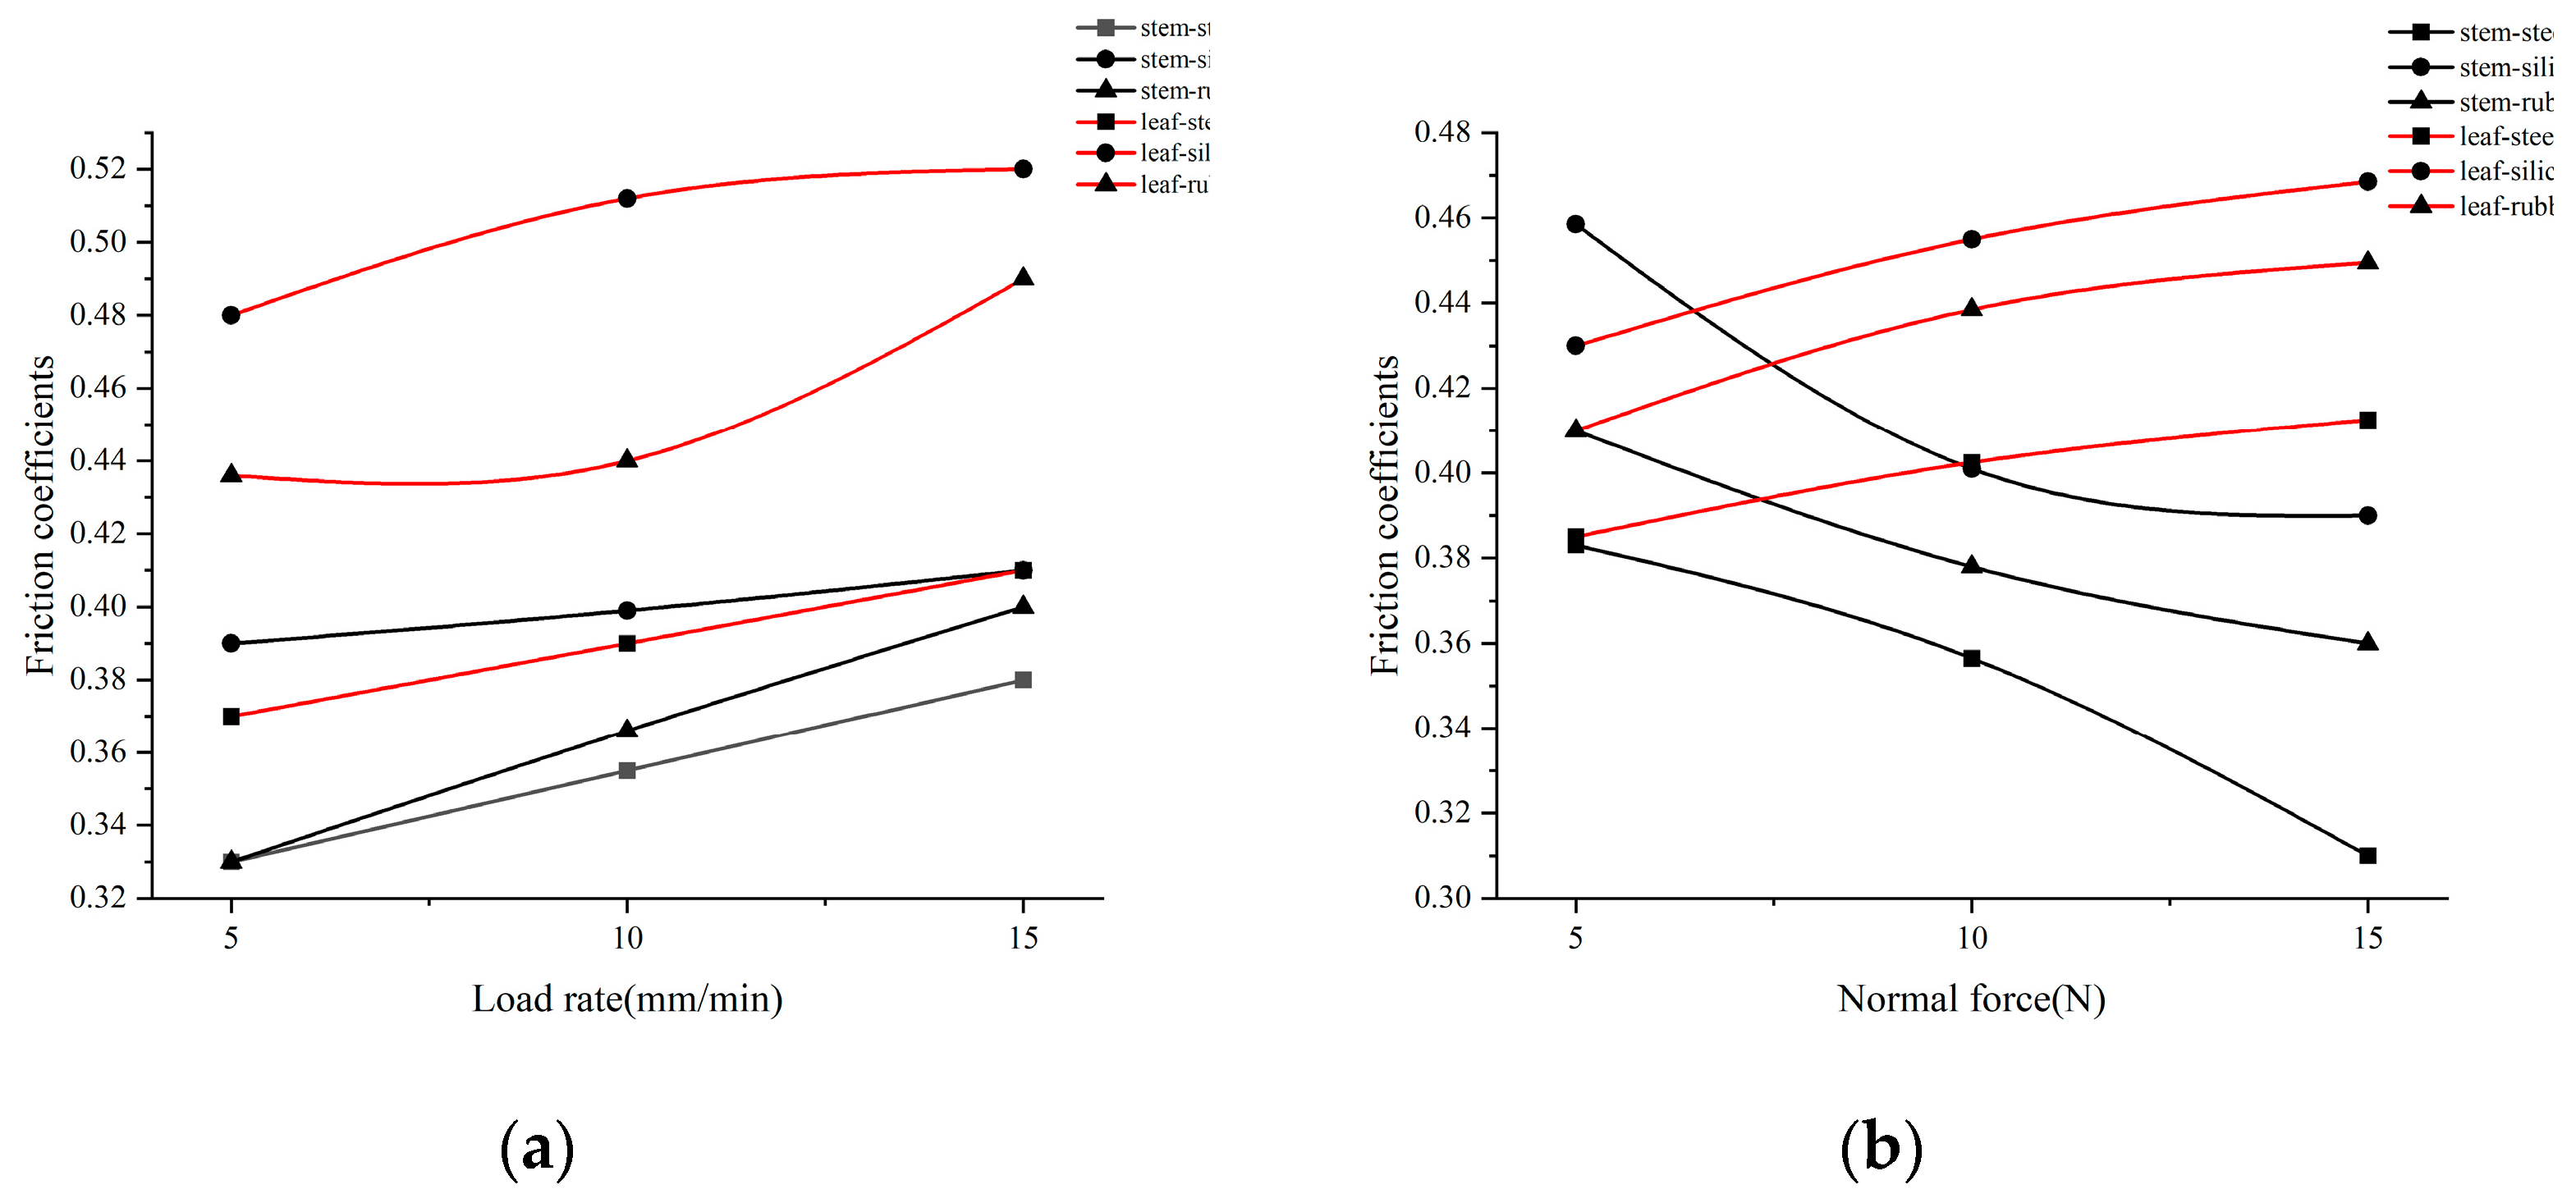
The test results for the friction coefficient of the stem and leaf of wakame when the normal force was 10 N are shown in Figure 24a. The friction coefficient between the stem and stainless steel increased from 0.33 to 0.38, the friction coefficient with silica gel increased from 0.39 to 0.41, and the friction coefficient with rubber increased from 0.33 to 0.40 when the loading rate increased from 5 mm/min to 15 mm/min. The friction coefficient between the leaf and stainless steel increased from 0.37 to 0.41, the friction coefficient with silica gel increased from 0.48 to 0.51, and the friction coefficient with rubber increased from 0.44 to 0.49. The coefficient of friction for the wakame’s stem and leaf all had a positive correlation with the loading rate. This is due to the fact that the wakame’s surface will wrinkle in the direction of movement during the friction process. The more wrinkles there are, the higher the speed will be, and the higher the speed, the higher the friction coefficient. The friction action caused the stem to wrinkle less than the leaf did under the same loading rate and contact material, resulting in a larger friction coefficient for the leaf. Philipp et al. [30] reached a similar conclusion in the study of the friction coefficient between food and the simulated oral cavity. In the investigation, it was discovered that the friction coefficient between food and the mouth cavity increased with the loading speed and even the friction force exceeded the applied normal force. They concluded that it is caused by the adhesion between the simulated mouth and food.
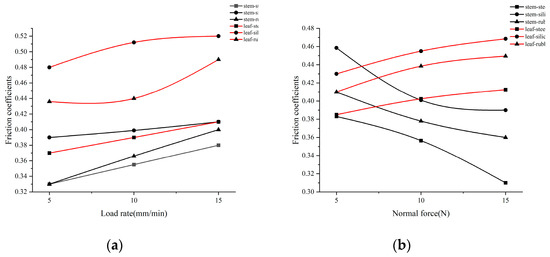
Figure 24.
Friction coefficient between wakame stem and leaf and different contact materials. (a) Friction coefficient between wakame stem and leaf and different contact materials under different loading rates; (b) Friction coefficient between wakame stem and leaf and different contact materials under different normal force.
It can be seen from Figure 24b that when the loading rate was 10 mm/min and the normal force increased from 5 N to 10 N, the friction coefficient between the wakame stem and stainless steel decreased from 0.38 to 0.31, the friction coefficient between wakame stem and silica gel decreased from 0.46 to 0.39, and the friction coefficient between wakame stem and rubber decreased from 0.41 to 0.36. The coefficient of friction between the wakame leaf and stainless steel increased from 0.38 to 0.41, the coefficient of friction with silica gel increased from 0.43 to 0.47, and the coefficient of friction with rubber increased from 0.41 to 0.45. With the increase in normal force, the friction coefficient between the wakame stem and material gradually decreased, and the friction coefficient between the wakame leaf and material gradually increased. The analysis reason is that the increase in normal force causes more water to precipitate from the wakame stem, which will play a role in lubrication, thus reducing the friction coefficient. The gland cells with protrusions on the surface of wakame leaf are shown in Figure 1b. Increasing the normal force will increase the contact area between the blade protrusions and the material. Moreover, the leaves of wakame are thin and can be extruded to release less water for lubrication. This is similar to Yan Zhifeng’s [31] research on the friction coefficient of the cuticle surface of the clam, which found that when there is a liquid film at the contact interface, the friction coefficient is related to the liquid capacity between the two surfaces and the composite roughness of the interface. In terms of mechanical properties, compared with the condition without water, the surface of the cuticle at the front of the clam is reduced under the condition of water.
The friction coefficient between different contact materials and wakame is in the order of silica gel > rubber > stainless steel. Silica gel can be used as a super hydrophobic material and has a good anti-slip effect, which is caused by the porous microstructure of its surface, and this is also an important reason for the high friction coefficient between wakame and the gel. Rubber can be used to make tire treads. Its wear resistance, tensile strength, tear strength, and aging resistance are good, but its wet skid resistance is poor, which will lead to the reduction in its friction coefficient in the presence of water. The contact parts made of stainless steel have a greater impact on wakame, which will reduce the quality of processed wakame. Therefore, the main contact parts of the wakame stem and leaf separation equipment can be made of silica gel material to obtain a large friction coefficient.
3.6. Correlation Analysis of Mechanical Properties of Wakame
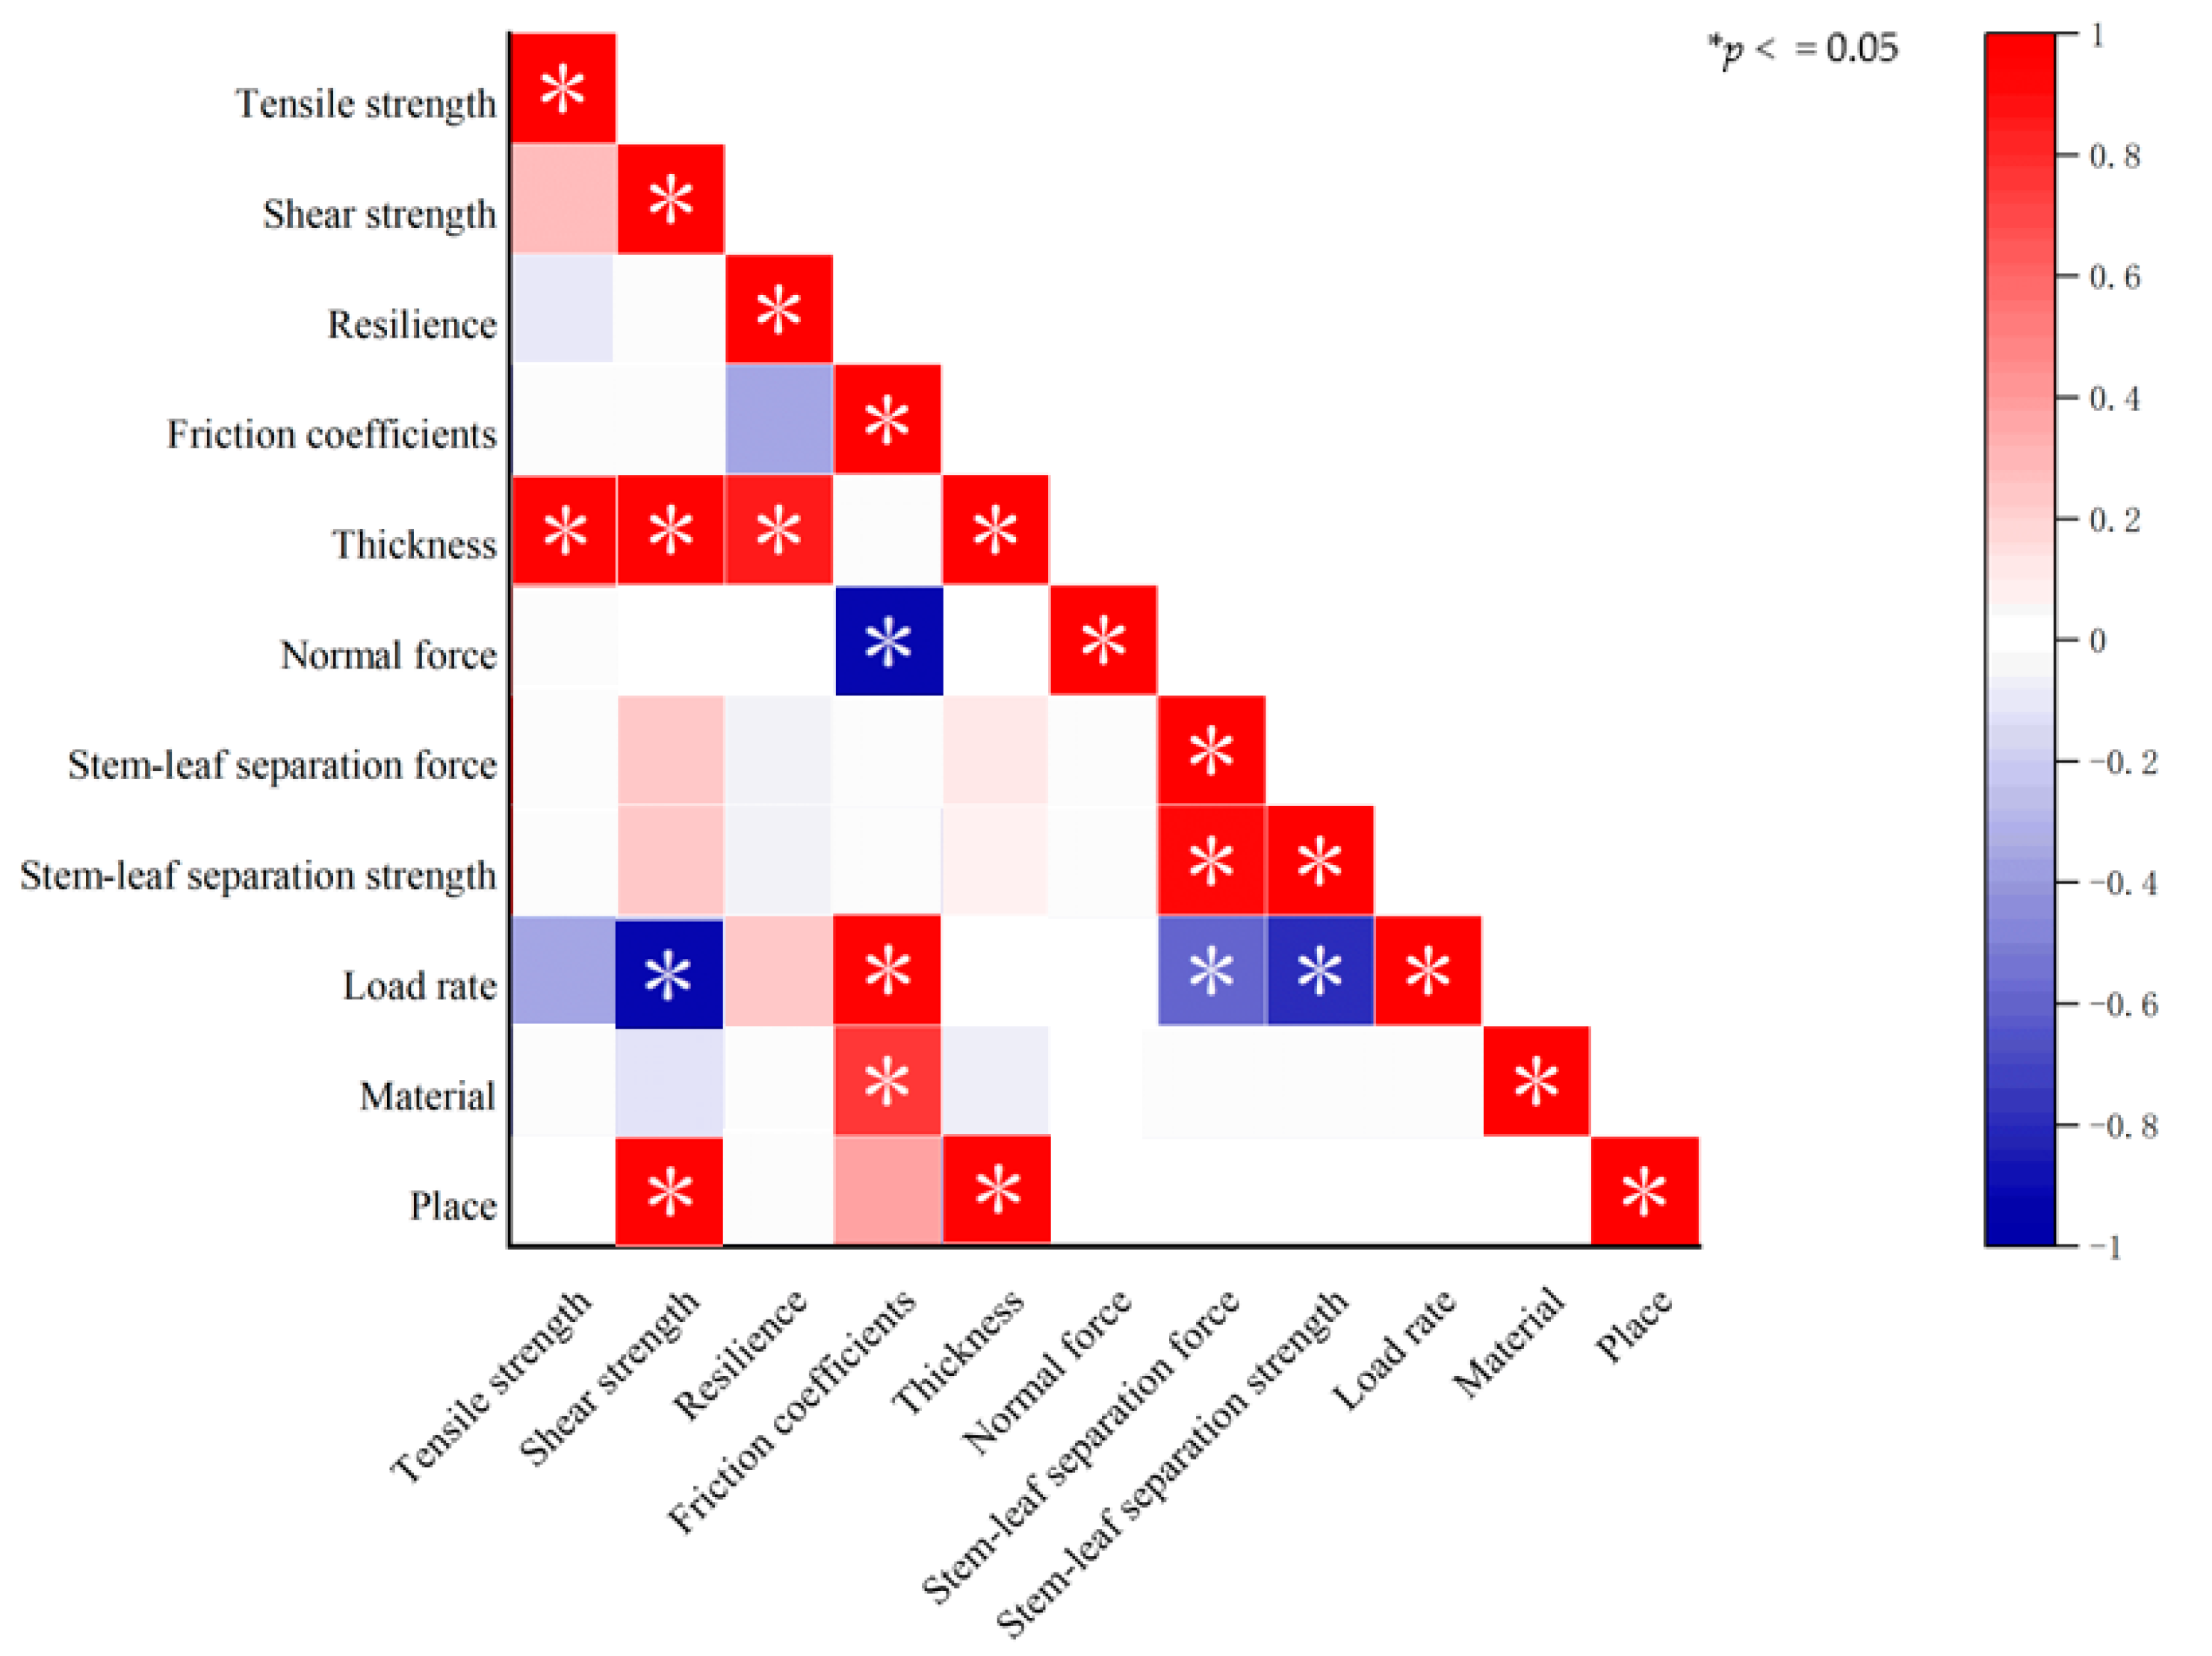
In order to study the influence of different factors on the mechanical properties of wakame, the correlation analysis between the mechanical properties of wakame and different factors was carried out, and the results are shown in Figure 25.

Figure 25.
Correlation plot.
It can be seen from Figure 25 that the tensile strength, resilience, shear strength, and stem–leaf separation strength of wakame have a significant positive correlation with the thickness (p ≤ 0.05), the friction coefficient has a significant positive correlation with the loading rate (p ≤ 0.05), and the resilience also has a positive correlation with the loading rate, but the correlation coefficient is weak. The shear strength, stem–leaf separation strength, and loading rate were significantly negatively correlated (p ≤ 0.05), the friction coefficient was significantly negatively correlated (p ≤ 0.05), the tensile strength and loading rate were negatively correlated, but the correlation coefficient was small, and the shear strength of the wakame was also significantly correlated with its location (p ≤ 0.05).
In general, increasing the thickness will significantly improve the mechanical properties of wakame, increasing the loading rate will increase the friction coefficient and reduce other mechanical properties, and increasing the normal force will significantly reduce the friction coefficient.
4. Conclusions
The biomechanical characteristics of wakame are investigated in this paper. The impact of loading rate and thickness on the biomechanical characteristics of wakame are examined by tensile, compression, shear, and friction tests. The following conclusions are reached in this study.
The test results showed that the tensile strength of the stems and leaves of wakame with a moisture content of 10.90% were 2.27 MPa and 1.67 MPa, the stem recovery was 0.27, the shear strength of the stems and leaves were 6.34 MPa and 2.93 MPa, the separation force and strength of the stems and leaves were 13.56 N and 1.78 MPa, and the coefficient of friction between the wakame and stainless steel, silica gel and vulcanized rubber were 0.38, 0.44, and 0.40, respectively. As suggested by the tensile test results, the thickness has a significant impact on the tensile strength of wakame (p ≤ 0.05), and the test loading rate exerts no significant impact on its tensile strength. Therefore, when separating the wakame stems from the leaves, a smaller loading rate should be applied to thin wakame to reduce damages to the dishes. At the same time, in the compression process of the wakame stems, the thickness has a significant impact on its recovery (p ≤ 0.05) while the test loading rate has no significant impact on its recovery. Thus, in order to ensure the integrity of the dishes in the actual processing, a small amount of pressure should be applied to the thin wakames. In addition, as suggested by the shear test results, both the test loading rate and thickness have a significant impact on the shear strength of wakame (p ≤ 0.05), so the loading rate of wakame with small thickness should be reduced in processing to prevent the wakame from being cut off. Moreover, according to the results of stem–leaf separation test, the test loading rate and thickness have a significant impact on the stem–leaf separation force and strength of wakame (p ≤ 0.05), so a high loading rate should be provided to reduce the required the stem–leaf separation force. Further, as shown by the friction test results, silica gel and wakame have a large coefficient of friction of 0.44, and both the loading rate and the normal force have a significant impact on the coefficient of friction (p ≤ 0.05). Therefore, silica gel can be used as the main contact material in the design of mechanized stem–leaf separation equipment to reduce the impact force on the wakame, and the loading rate and normal force should be properly controlled to obtain a large coefficient of friction.
The mechanical characteristics test on wakame designed in this study measured the mechanical characteristics of the stems and leaves of wakame, filling the gap in the research on the biomechanical characteristics of wakame. The results of this study provide valuable references for the design of mechanized wakame stem–leaf separation equipment with a low damage rate, low cost, and high efficiency, and provide a basis for investigations into the biomechanical characteristics of other flexible crops.
Author Contributions
Conceptualization, H.Z.; methodology, H.Z. and W.H.; software, H.K. and S.W.; writing—original draft preparation, W.H.; writing—review and editing, H.Z.; supervision, X.L.; project administration, X.L. All authors have read and agreed to the published version of the manuscript.
Funding
This research was funded by Project for Marine Economy Development in Liaoning Province (for Jun Ding); Key Laboratory of Environment Controlled Aquaculture (Dalian Ocean University) Ministry of Education (202212); Scientific Research Fund of Liaoning Provincial Education Department (20220073).
Data Availability Statement
All data that support the findings of this study are included within the article.
Conflicts of Interest
The authors declare no conflict of interest.
References
- Leng, L.; Zou, H.; Wang, Y.; Yu, C.; Qi, H. Seaweed Slurry Improved Gel Properties and Enhanced Protein Structure of Silver Carp (Hypophthalmichthys molitrix) Surimi. Foods 2022, 11, 3115. [Google Scholar] [CrossRef]
- Synytsya, A.; Kim, W.J.; Kim, S.M.; Pohl, R.; Synytsya, A.; Kvasnička, F.; Čopíková, J.; Park, Y.I. Structure and antitumour activity of fucoidan isolated from sporophyll of Korean brown seaweed Undaria pinnatifida. Carbohydr. Polym. 2010, 81, 41–48. [Google Scholar] [CrossRef]
- Suetsuna, K.; Maekawa, K.; Chen, J.-R. Antihypertensive effects of Undaria pinnatifida (wakame) peptide on blood pressure in spontaneously hypertensive rats. J. Nutr. Biochem. 2004, 15, 267–272. [Google Scholar] [CrossRef] [PubMed]
- Teas, J.; Zhang, Q.; Kennedy, V. Seaweed as an anticarcinogenic agent in breast cancer. Cancer Res. 2007, 67, 4988. [Google Scholar]
- Boo, H.-J.; Hyun, J.-H.; Kim, S.-C.; Kang, J.-I.; Kim, M.-K.; Kim, S.-Y.; Cho, H.; Yoo, E.-S.; Kang, H.-K. Fucoidan from Undaria pinnatifida Induces Apoptosis in A549 Human Lung Carcinoma Cells. Phytother. Res. 2011, 25, 1082–1086. [Google Scholar] [CrossRef] [PubMed]
- Department of Fisheries, Ministry of Agriculture. China Fishery Statistical Yearbook; China Agricultural Publishing House: Beijing, China, 2022. [Google Scholar]
- Hasegawa, K.; Suzuki, S. Work Analysis of Harvesting and Salt-Preserved Wakame Seaweed (Undaria pinnatifida) Processing; Technical Report of National Research Institute of Fisheries Engineering; Food and Agriculture Organization of the United Nations: Rome, Italy, 2005. [Google Scholar]
- Yimit, A.; Takagi, M.; Hagihara, Y.; Miyoshi, T. A method of determining cut position of automatic stem removal system for salted wakame, Agricultural Engineering International. CIGR J. 2015, 17, 188–196. [Google Scholar]
- Hasegawa, K. Workload Analysis of Wakame Seaweed Harvesting at Sanriku District. Fish. Eng. 2006, 43, 179–184. [Google Scholar]
- Solana, V.P.; Makte, M.; Dellatorre, F.G. Innovation on Marine Fishing Resources from Patagonia: Harvest and Processing Undaria pinnatifida for Wakame Production in Puerto Madryn; Congreso Argentino de Ingeniería Industrial: Chubut, Argentina, 2014. [Google Scholar]
- Yinyan, S.; Man, C.; Xiaochan, W.; Yongnian, Z.; Odhiambo, M.O. Experiment and analysis on mechanical properties of artemisia selengensis stalk. Int. J. Agric. Biol. Eng. 2017, 10, 10. [Google Scholar]
- Zhao, C.; Zhang, F.; Cao, Z. Experiment on stalk mechanical properties of legume forage and grasses. Trans. Chin. Soc. Agric. Eng. 2009, 25, 122–126. [Google Scholar]
- Song, J. Effects of Experimental Conditions on Texture Profile Analysis (TPA) of Chicken Sausage. Food Sci. 2009, 30, 54–58. [Google Scholar]
- Xiaodong, L.; Youwei, Z.; Xiaofei, L.; Mingfu, Z.; Xinzheng, L.; Shaojun, P. Phylogenetic Analysis of Algal Pests of the Economic Alga Undaria pinnatifida in the Farming Region of Dalian. Prog. Fish. Sci. 2021, 42, 13. [Google Scholar] [CrossRef]
- Liu, D.; Xiao, H.; Jin, Y.; Cao, G.; Liu, M. Mechanical properties test and analysis on the stalks of Chinese little greens. Int. Agric. Eng. J. 2018, 27, 38–43. [Google Scholar]
- Li, Z.; Fu, J.; Luo, X. Tensile Properties and Fracture Mechanisms of Corn Bract for Corn Peeling Device Design. Agriculture 2021, 11, 796. [Google Scholar] [CrossRef]
- Lu, W.; Li, X.; Zhang, G.; Tang, J.; Ni, S.; Zhang, H.; Zhang, Q.; Zhai, Y.; Mu, G. Research on Biomechanical Properties of Laver (Porphyra yezoensis Ueda) for Mechanical Harvesting and Postharvest Transportation. AgriEngineering 2022, 4, 48–66. [Google Scholar] [CrossRef]
- Jia, T.; Bing, C.; Jinnan, J.; Caihua, L.; Li, Z.; Niyuan, M. Biomechanical characteristics of root systems of Hedysarum scoparium and Salix psammophila. Trans. Chin. Soc. Agric. Eng. 2014, 30, 7. [Google Scholar]
- Yinghui, M.; Song, G.; Zhiyu, M. Experimental analysis on biomechanical properties of cucurbits grafted seedlings. Trans. CSAE 2012, 28, 6. [Google Scholar]
- Xiang, L.; Ping, Z.; Weixin, X.; Shaohui, Z.; Xing, G.; Li, L. Effect of Experimental Conditions in TPA Test on Melon Textural Property. China Veg. 2015, 2015, 38–44. [Google Scholar]
- Yong, J.; Yunhu, W.; Yanhong, B.; Liniln, H.; Xinqi, Z.; Rui, S. Analysis on TPA Textual Characteristics of Various Species of Figs. Shandong Agric. Sci. 2018, 50, 52–56. [Google Scholar]
- Liangjun, W.; Zhou, Y.; Tiansheng, H.; Jieli, D.; Weizu, W.; Liuyi, W.; Guangneng, T. Experimental study on mechanical properties of litchi branches. Trans. Chin. Soc. Agric. Eng. 2012, 28, 68–73. [Google Scholar]
- Mengyue, Z.; Yong, Z.; Guozhong, Z.; Dezhu, L.; Huibin, K.; Hang, C.; Chuangchuang, F. Mechanical properties of compression and shear of taro. J. Gansu Agric. Univ. 2020, 55, 206–221. [Google Scholar]
- Ze, W.; Ming, Z.; Dongmei, S.; Xiulian, L.; Lin, D.; Xia, Y.; Qinxian, J. Experimental Study Concerning the Effects of Profile Morphology of Intestine on the Frictional Characteristics. Tribology 2014, 34, 193–197. [Google Scholar]
- Lili, H.; Haibo, M.; Yishui, T.; Lixin, Z.; Shulin, H. Experimental study on physical property of smashed crop straw. Trans. Chin. Soc. Agric. Eng. 2012, 28, 7. [Google Scholar]
- Tianchi, C. Study on Mechanical Properties of Kelp and Design of Mechanisms for Knotting Kelp. Master’s Thesis, Southeast University, Dhaka, Bangladesh, 2018. [Google Scholar]
- Yumei, L.; Shouqiang, L.; Shilong, T.; Junzhou, W. Texture parameters of potato tubers with texture profile analysis method. Sci. Technol. Food Ind. 2016, 37, 92–96. [Google Scholar]
- Chattopadhyay, P.S.; Pandey, K.P. Mechanical Properties of Sorghum Stalk in relation to Quasi-static Deformation. J. Agric. Eng. Res. 1999, 73, 199–206. [Google Scholar] [CrossRef]
- Zhong, X. Cutting Mechanical Characteristics and Simulation Analysis of Cassava Stalk. Ph.D. Thesis, Huazhong Agricultural University, Wuhan, China, 2018. [Google Scholar]
- Fuhrmann, P.; Aguayo-Mendoza, M.; Jansen, B.; Stieger, M.; Scholten, E. Characterisation of friction behaviour of intact soft solid foods and food boli. Food Hydrocoll. 2020, 100, 105441. [Google Scholar] [CrossRef]
- Zhifeng, Y.; Xingwang, C.; Shenglong, S.; Donghui, C.; Zhiqin, W.; Yunhai, M. Tribological Properties of Cyclina sinensis Shell Cuticle. Trans. Chin. Soc. Agric. Mach. 2012, 43, 339–343. [Google Scholar]


Disclaimer/Publisher’s Note: The statements, opinions and data contained in all publications are solely those of the individual author(s) and contributor(s) and not of MDPI and/or the editor(s). MDPI and/or the editor(s) disclaim responsibility for any injury to people or property resulting from any ideas, methods, instructions or products referred to in the content. |
© 2023 by the authors. Licensee MDPI, Basel, Switzerland. This article is an open access article distributed under the terms and conditions of the Creative Commons Attribution (CC BY) license (https://creativecommons.org/licenses/by/4.0/).