Abstract
The life of the hearth is the main limiting link of the campaign of a blast furnace. As the equipment for holding molten iron in the furnace, the high-temperature molten iron is in direct contact with the refractory, which makes the refractory have a larger temperature increase. If the temperature gradient inside the refractory is large, it generates large thermal stress and causes the refractory to crack. Blast furnace gas and molten iron intrude into the gap, which directly causes melting erosion and other chemical erosion with carbon bricks. It aggravates the erosion degree of the furnace and seriously affects the production life of the furnace. Therefore, the furnace often occurs with different types of severe depression erosion in the late service of the blast furnace. In this study, the calculation model of the thermal fluid-solid coupling considering the molten iron flow and the solidification of molten iron was established. This calculation model was applied to study thermal stresses in the furnace with severe erosion. Based on the calculation model, the effect of blast furnace production parameters and deadman condition on thermal stresses in the furnace with severe depression erosion were analyzed, including tapping productivity, tapping temperature, cooling intensity, and deadman geometry. The research results are of great significance for prolonging the safe production life of blast furnaces.
1. Introduction
The blast furnace (BF) is an important piece of equipment for ironmaking production. The BF hearth is a reactor containing high-temperature molten iron. Its structure consists of refractory, cooling equipment, and a steel shell. The remaining thickness of the lining of the hearth is the main factor limiting the life of the BF [1,2,3,4]. The hearth is used to hold the molten slag and the molten iron. The hearth is subjected to complex physical and chemical erosion [5,6,7,8,9,10]. The causes of furnace erosion are mainly divided into the following aspects [11,12]:
- Flow scouring of high-temperature liquid slag and molten iron;
- Thermal stress leads to the destruction and annular fracture of refractories;
- Abnormal erosion of molten iron infiltration;
- The erosion of alkali metals (potassium, sodium, and their compounds) and zinc leads to material deterioration;
- Oxidation erosion of carbon brick by oxidizing gas.
The erosion degree of the furnace gradually increases with service time. This leads to thinner refractory materials. If the erosion continues to expand, it can eventually cause a major accident in which the furnace burns through [10,13]. Therefore, it is of great significance to study the erosion state of furnace lining for BF safety production and economic and technical indices. With the development of computer technology, the function and calculation accuracy of computer-aided engineering systems have been greatly improved. Computer numerical simulation technology has become a feasible research method. Based on numerical simulation technology, scholars have established different numerical simulation models of BF hearths.
Kumar [14] established an axisymmetric thermal and heat transfer model based on the finite element method to predict and quantify the erosion of the furnace refractory. The temperature distribution of two different designs of BFs was simulated using the calculation model. The severe erosion of the furnace was predicted according to the worst-case position of the 1150 °C isotherm during furnace operation. In addition, the effects of molten iron temperature, cooling conditions, and the coke bed state on the furnace temperature distribution and refractory erosion were studied.
Based on the solidification numerical method, Zhao et al. [15] established a simulation model to form a stable solidified molten iron protective layer in the hearth. The calculation model was applied to optimize the structural design of the furnace and the operating parameters of BF production. The influence of factors on the solidified layer of molten iron was discussed, including the cooling strength, the tapping rate, and the temperature and viscosity of molten iron.
Gan et al. [16] analyzed the thermal stress of a hot blast stove in different operation processes based on the thermal fluid-solid coupling simulation model. First, the temperature of the hot blast stove was solved in a quasi-steady state. Then, the temperature of the refractory was introduced to solve the temperature distribution of the multilayer refractory. At last, the refractory temperature was introduced to solve the thermal stress of the refractory.
This paper discusses the thermal stress of furnace refractories when serious erosion occur. In the production of BFs, there are three typical depression erosions of the furnace lining, i.e., mushroom-type erosion, bowl-type erosion, and mumps face-type erosion [17]. In this study, the numerical simulation model of the BF hearth with typical erosion was established. Three types of three-dimensional models of depression erosion furnaces were established by SolidWorks (v2019). The thermal fluid-solid coupling calculation model of the BF hearth, considering the molten iron flow and solidification protection effect, was established. The calculation model was applied to analyze the effects of the BF production, tapping temperature, cooling intensity, and deadman geometry on the stress of the refractory with different types of erosion.
2. Model Description
The simulation model of the BF hearth is divided into two parts, which are thermal-fluid coupling analysis and structural stress analysis. Fluent (v2021R2) was used to solve the flow state of the molten iron and the coupled heat transfer between the molten iron and the refractory. Then, in the structural analysis module, the temperature of the refractory was introduced as the thermal boundary condition. After setting the displacement boundary conditions, the stress of the BF hearth was analyzed based on the finite element method. It should be noted that the simulation model ignored the effect of thermal radiation on the furnace temperature [18]. Additionally, the temperature was taken as the only factor affecting stress in this study. The process of the simulation model calculation is shown in Figure 1.
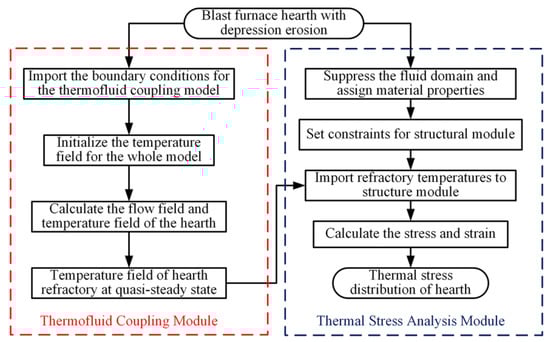
Figure 1.
The calculation process of the BF hearth thermal stress.
2.1. Furnace Physical Model
In this study, the refractory of a BF hearth is a combination of ceramic cups and carbon bricks. Figure 2a is the structural design and erosion profile of the BF hearth. The figure shows the five types of carbon bricks that make up the lining of the furnace. The furnace taphole is located at an elevation of 5375 mm, and its internal diameter is 250 mm. The taphole forms an angle of 10° with a horizontal direction. The stemming forms a boss-shaped mud bag near the taphole inside the furnace. In the calculation, the mud bag is simplified by the round table.
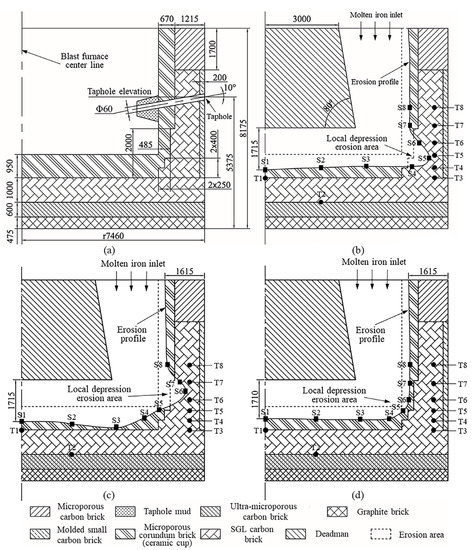
Figure 2.
The structural design and erosion profile of the BF hearth: (a) Hearth structure; (b) Mushroom-type erosion profile; (c) Mumps-type erosion profile; (d) Bowl-type erosion profile.
In this study, the calculation model constructs the mushroom-type erosion, bowl-type erosion, and mumps face-type erosion in a 45° difference from the taphole. The mushroom-type erosion profile was established based on the measured temperature data and the two-dimensional erosion boundary inverse solve technique. Based on this, the other two typical erosion profiles (mumps-type erosion and bowl-type erosion) of the furnace were established by referring to the literature [17]. Figure 2b–d shows schematic diagrams of three typical hearths lining erosion boundaries. The three-dimensional models of three typical depression erosion hearths are shown in Figure 3a–c, respectively.
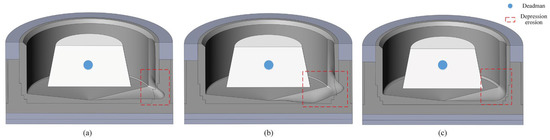
Figure 3.
The three-dimensional models of typical erosion hearths: (a) Mushroom-type; (b) Mumps face-type; (c) Bowl-type.
In the process of BF production, there is a cone-shaped material column made of coke in the center of the furnace outside the range of the bosh burning zone. Because of its extremely slow consumption and renewal speed, it is called the deadman. The deadman has an influence on the hot metal flow, temperature distribution in the furnace, and erosion of the furnace lining [19]. In order to consider the effect of the deadman on the flow state of the molten iron, it was simulated with a circular table-shaped porous medium in the calculation model [20]. The physical properties of the refractories and molten iron are listed in Table 1 and Table 2.

Table 1.
Physical properties of molten iron.
Table 2.
Physical properties of refractories [10].
2.2. Mathematical Models
2.2.1. Fluid Flow Equation
Since this study focuses on the heat transfer between molten iron and the refractory, it is assumed that molten iron is an ideal single-component viscous fluid. The chemical reaction between molten iron, the refractory, and the process of cracking and spalling in the refractory is not considered in this model. The realizable k-epsilon turbulence model is used to simulate the flow of molten iron in the hearth [21,22]. The transport equation for the realizable k-ε model is shown below.
where Gk represents the generation of turbulence kinetic energy due to the mean velocity gradients; Gb represents the generation of turbulence kinetic energy due to buoyancy; YM represents the contribution of the fluctuating dilatation in compressible turbulence to the overall dissipation rate;, , and represent constants (, in the present model); and represent the turbulent Prandtl numbers for k and , respectively, (, in the present model) [23]; and represent user-defined source terms; represents the mean rate-of-strain tensor; represents fluid density; k represents turbulence kinetic energy; t represents time; μ represents dynamic viscosity; ε represents the turbulent dissipation rate; and represents velocity components.
2.2.2. Differential Equation of Heat Conduction
The single tapping time of the BF hearth is long. The heat transfer state inside the furnace is relatively stable, which can be simplified as a quasi-steady process [24,25,26]. The coupled heat transfer process between molten iron and the refractory is described by the heat conduction differential equation. The cylindrical coordinate system is used for research; the radius direction of the BF hearth is the r direction, and the axial direction is the z direction. The differential equation of heat conduction is as follows.
where T represents temperature; and represent the heat conduction coefficient of linings in the r and z direction, respectively.
2.2.3. Solidification Melting Model
There is usually an embedded cooling device between the hearth and the furnace shell. The heat inside the furnace is discharged through the cooling water, which plays a role in extending the service life of the furnace. As a result, the temperature near the inner wall of the furnace is lower than the solidification temperature of the molten iron. In this area, the solidified iron layer was formed [27,28]. Compared with molten iron, the thermal conductivity of the solidified iron layer was relatively low. The solidified iron layer was simulated using the solidification melting model [29,30]. In addition, the user-defined function (UDF) was used to dynamically correct the thermal conductivity of the solidified iron layer. Equation (5) is the energy equation.
where H represents total enthalpy; represents fluid density; represents fluid velocity; S represents the source term.
2.2.4. Stress Model
Based on the theory of elasticity and thermoelasticity, Equations (6)–(8) are the equilibrium equation, the equation of motion, and the physical equation in the cylindrical coordinate system, respectively.
where represent thermal stress; represent thermal strain; and represent shear stress; E represents the elasticity modulus; represent displacement components; represents Poisson’s ratio; represents the coefficient of thermal expansion; represents the change in temperature.
2.3. Boundary Conditions
The computation model uses the annular area at the top of the BF as the inlet, as shown in Figure 4. Additionally, the taphole of the furnace is set as the outlet. The outlet type is the pressure outlet, and its pressure value has a standard atmospheric pressure. The structural BF hearth and production parameters of the BF are listed in Table 3. According to the relevant formula in reference [17] and the data in Table 3, the inlet mass flow rate was calculated to be 90 kg/s. Cooling staves are usually arranged at the bottom and sidewalls to reduce the refractory temperature and protect the furnace. In this study, the calculation model uses the equivalent replacement method of the convective heat transfer coefficient in references [17] and [31] to calculate the equivalent convective heat transfer coefficient of the furnace sidewall and bottom. The equivalent convective heat transfer coefficients of the sidewall and bottom are approximately 120.0 W/(m2·K) and 60 W/(m2·K), respectively. Other boundaries are set as adiabatic boundaries. Figure 4a is a schematic diagram of the thermal fluid coupling analysis boundary of the calculation model.
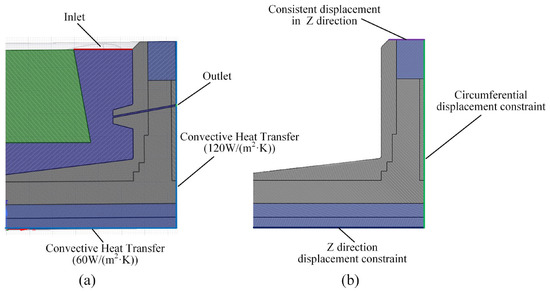
Figure 4.
The schematic diagram of the boundary conditions of the simulation model: (a) Thermal fluid coupling analysis boundary; (b) Structure stress analysis boundary.
Table 3.
The BF hearth structure and production index parameters.
There are filler layers, cooling staves, and furnace shells on the outside of the carbon bricks, which play a role in supporting the furnace circumferentially. The BF base in the bottom limits the axial movement. The top of the hearth supports the equipment in the medium and upper parts of the BF, such as the BF tuyere equipment and the carbon bricks and cooling walls of the furnace belly. Therefore, the circumferential displacement of the furnace sidewall and the axial displacement of the hearth bottom are limited in the stress analysis section. Additionally, set the axial deformation of the top of the hearth to be consistent [32]. The structure stress analysis boundary of the calculation model is shown in Figure 4b.
2.4. Mesh Generation
In this study, all three calculation models divide the mesh in the same way. Tetrahedral meshes are used to discretize the calculation model, and the meshes in the depression erosion and the small-sized taphole are encrypted. In addition, to improve the calculation accuracy and convergence of the model, five layers of inflation layer meshes are added at the junction of the molten iron and refractory. The inflation layers are divided in the way of a smooth transition. The transition ratio is 0.272. The growth rate is 1.2. As the mesh models of the hearth with different types of erosion are similar, the mesh independence of the calculation model with the mushroom-type erosion as an example is analyzed in this section. When the number of grids reached 2.7 × 10⁷, the temperature change at each monitoring point was less than 2%, as shown in Figure 5. It indicates that the calculation results were no longer influenced by the number of meshes. After mesh independence analysis, the mumps face type, bowl-type, and mushroom-type erosion hearths were finally divided into 26,035,449, 26,568,126, and 27,013,135 meshes, respectively. The mesh model of the hearth with mushroom-type erosion is shown in Figure 6.
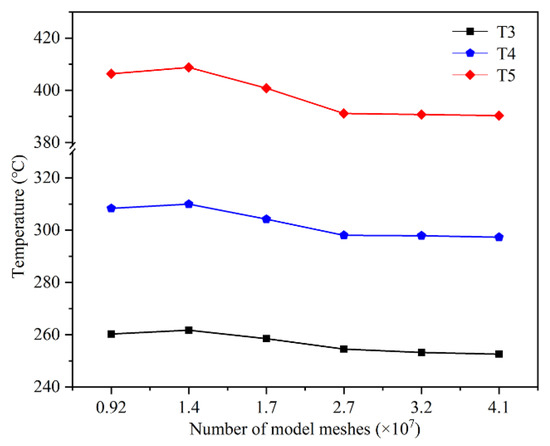
Figure 5.
The temperature of monitoring points with different mesh.
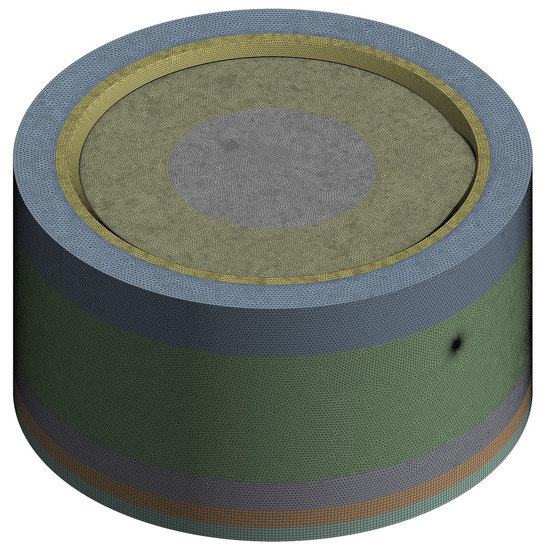
Figure 6.
The mesh model of BF hearth.
3. Results and Discussion
In this study, 35 thermocouples were arranged on each orientation of the BF hearth. Firstly, the accuracy of the calculated results was verified by comparing the temperature values of some thermocouples. Then, the effects of the BF production rate, tapping temperature, the cooling intensity of the cooling wall, and deadman geometry on the hearth stress were discussed. To analyze the influence of the above factors on the furnace, a portion of the thermocouple position was selected as the temperature monitoring position (marked as T). In addition, the significant locations at the erosion profile were selected as stress monitoring locations (marked as S). The specific locations of each monitoring point are marked in Figure 2b–d. Taking into account that the refractory materials composing the furnace are all brittle, the calculations were evaluated using the maximum principal stress criterion to assess the thermal stress of the hearth [32].
3.1. Model Verification and Normal Production Status
Since the calculation models for the three erosion types were established in the same way, only the mushroom-type erosion model was validated in this paper. The calculated and measured values of the temperature at each monitoring point are listed in Table 4. From the error data in the table, it can be seen that the maximum error between the calculated and measured values of the temperature at each monitoring point was 2.25%, and the maximum error occurred at the bottom of the hearth (T2). This indicates that the calculation results are in high agreement with the actual working condition of the BF and also proves that the calculation model is valid and usable. The temperatures of each monitoring point in the other two types of erosion models are also listed in Table 4. It can be seen that there is a large difference in the temperature distribution of the BF hearth for different erosion types.
Table 4.
The calculated and measured temperature of monitoring points. (K).
Figure 7a–c shows the volume fraction of the molten iron in the axial section of the BF hearth. The blue area (volume fraction is 0) indicates that the molten iron has completely solidified and adhered to the furnace lining. It can be seen from Figure 7a,b that a solidified iron layer was formed in the deep erosion position of the hearth with mushroom and mumps-type erosion. The simulation results are consistent with the solidification phenomenon of the molten iron in the furnace at actual production in the Reference [17]. Therefore, the simulation results in this paper were credible. As the BF was in service longer and longer, the erosion of the furnace lining became more and more serious. The thickness of the hearth sidewall area became very thin, and its thermal resistance was very low, which satisfies the conditions for solidifying the molten iron. It can be seen from Figure 7c that no solidified iron layer was formed in the bowl-type erosion hearth. The reason for this was that the erosion depth of the bowl-type erosion model established in this paper was shallow. The conditions for the formation of a solidified iron layer were not reached.
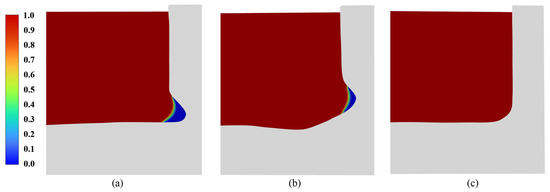
Figure 7.
The volume fraction of molten iron: (a) Mushroom-type, (b) Mumps-type; (c) Bowl-type, respectively.
The temperature distribution is shown in Figure 8a–c. It can be seen that the temperature distribution of three typical erosion hearth refractories was the same. The high-temperature zone appeared on the coupled heat transfer surface between the ceramic cup and the molten iron and gradually decreased toward the outside of the furnace. The simulation result is consistent with the temperature distribution in the cross-section of the hearth in Reference [2] (Figure 4 in the reference). Therefore, the simulation results in this paper are reliable. In addition, the refractories undertook a significant temperature drop near the ceramic cup. The reason for this is that the thermal conductivity of the ceramic cup material was much lower than other carbon bricks. At the same time, less heat is transferred from the ceramic cup. The ceramic cup blocks most of the heat and effectively protects the outer carbon bricks. The ceramic cups were completely eroded in areas where the hearth was heavily eroded. However, as seen in Figure 7, there is a solidified iron layer attached to the furnace lining at the above locations. The thermal conductivity of the layer is relatively low and plays the same role as the ceramic cup to protect the hearth.
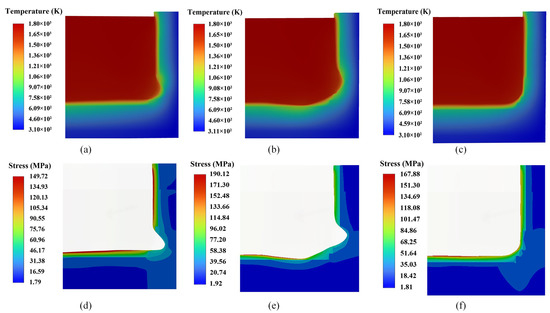
Figure 8.
The temperature and thermal stress in the axial section: (a–c) the temperature of mushroom-type erosion, mumps-type erosion, and bowl-type erosion, respectively; (d–f) the thermal stress of mushroom-type erosion, mumps-type erosion, and bowl-type erosion, respectively.
From Figure 8d–f, it can be observed that the stress distribution in the axial cross-section of refractories with three typical types of erosion is the same. The distribution is similar to the temperature distribution, which decreases from the furnace lining to the outside and appears as a large gap near the ceramic cup. The areas with large thermal stress are mainly concentrated in the high-temperature area of ceramic cups. In addition, the maximum stress of the hearth with mushroom-type and bowl-type erosion is in the center of the hearth bottom. Additionally, the maximum stress of the hearth with mumps faces types of erosion in the depressed area of the hearth bottom.
3.2. Influence of Tapping Productivity
This subsection simulates the working condition of the hearth when the BF production rate changes. Five groups of comparative calculation models were established by modifying the model inlet parameters. It can be seen from Figure 9a–c that the changing trend of the three types of hearth temperatures is the same. The temperature of the hearth increased, and the center of the hearth had the highest temperature. The simulation results were consistent with the effect of the BF utilization coefficient on the sidewall temperature in Reference [33] (Figure 5 in reference). The sidewall temperature increases approximately linearly as the utilization coefficient (tapping productivity) increases. This indicates that the simulation results are reliable in this paper. From the temperature change degree in each temperature monitoring point of the hearth, there are clear differences among the three types of erosion hearths. The change rule of the hearth temperature of mushroom-type and mumps face-type erosion is the same. When the mass flow rate increases from 70 kg/s to 110 kg/s, the temperature change in the hearth bottom (T1, T2) is relatively small, and the average temperature change rate is only 1.1%. The temperature changes at the monitoring points near the deep area of erosion are the largest. The temperatures of T4, T5, and T6 in the mushroom-type erosion hearth increased by 13.2%, 14.8%, and 14.6%, respectively. The temperatures of T5, T6, and T7 in the mumps face-type erosion hearth increased by 9.1%, 10.1%, and 7.8%, respectively.
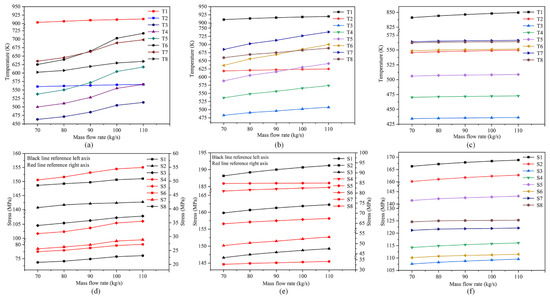
Figure 9.
The influence of tapping productivity: (a–c) the temperature of mushroom-type erosion, mumps-type erosion, and bowl-type erosion, respectively; (d–f) the stress of mushroom-type erosion, mumps-type erosion, and bowl-type erosion, respectively.
The variations in BF productivity directly affect the flow rate of the molten iron in the hearth. Additionally, the flow rate of molten iron affects the heat transfer between the molten iron and the ceramic cup. When the BF productivity increases, the flow rate of molten iron increases, which eventually leads to an increase in the overall temperature of the hearth. In addition, an excessive molten iron flow rate prevents the formation of solidified iron. This eventually leads to particularly large temperature variations in the erosion area. With the increase in productivity, the temperature change rate of the hearth of mushroom erosion decreases, and the temperature of the hearth of mumps face-type erosion increases approximately linearly. The temperature of the bowl erosion hearth is quite different from the abovementioned two types of hearth, and the temperature change is particularly small. The maximum temperature change is located in the center of the furnace bottom (T1), with an increase of only 8.5 K. This occurs because the profile of bowl-type erosion is in the ceramic cups; most of the temperature changes caused by the mass flow rate are isolated by the ceramic cups, and there is no excessive heat transfer to the carbon bricks; thus, the temperature monitoring points at the carbon bricks have little change.
The effect of tapping productivity on the hearth stress is shown in Figure 9d–f. When the tapping productivity increased by 57% (inlet mass flow rate increased from 70 kg/s to 110 kg/s), the stresses in all parts of the mushroom-type erosion hearth increased differently. In addition, when the inlet mass flow rate exceeds 100 kg/s, the amount of stress variation in the hearth decreases significantly. For the mumps-type erosion hearth, the hearth stress increases approximately in a linear way after increasing the tapping productivity. As with the mumps-type erosion hearth, the stresses increase approximately in a linear way in all parts of the bowl-type erosion hearth. However, the variation is smaller than the other two types of erosion hearths.
In this study, a single-factor regression analysis of the thermal stress at each monitor point of the refractory was performed. In order to analyze the degree of influence of tapping productivity on the thermal stress in each region of the furnace, this study focused on the primary standard regression coefficients of the regression equation. The larger the value of this coefficient, the greater the influence of tapping productivity on the stress at that location. The standard regression coefficients and coefficient of determination (R2) for each regression equation are listed in Table 5. The coefficient of determination (R2) for each regression equation was greater than 85%, so the regression equations were all valid.
Table 5.
The standard regression and determination coefficients of the regression equation.
As shown in Table 5, when the tapping productivity increased, the refractory with mushroom-type erosion had the largest stress change at the locations S4 and S5, with 4.52 MPa (8.9%) and 4.47 MPa (14.4%), respectively. The refractory with mumps-type erosion had the largest stress changes at S2 and S6, with 3.07 MPa (1.6%) and 4.17 MPa (8.4%), respectively. The locations of the greatest stress changes in the refractory with a bowl-type erosion were S1 and S2, which increased by 2.52 MPa (1.5%) and 2.57 MPa (1.6%), respectively. In addition, from the bottom to the sidewall of the hearth (S1 to S8), the stress change value of each monitoring point gradually decreased. The abovementioned analysis shows that when tapping productivity was reduced, the temperature and stress of the three types of erosion hearths were reduced to some extent. It can be used to extend the life of the hearth by moderately reducing the tapping productivity. In addition, tapping productivity has relatively little influence on the bowl-type erosion hearth, which indicates that the working state of the bowl-type erosion hearth is more stable.
3.3. Influence of Tapping Temperature
The temperature of the molten iron in the furnace determines the production activity of the BF. If the temperature of the molten iron is too low, it causes the furnace to cool down and shut down production. The excessive temperature inside the furnace leads to the greater thermal stress of refractories and crushing of carbon bricks, and the erosion area of refractories expands, threatening the safe production of BFs. In this section, the influence of tapping temperature on the three typical erosions of hearths was analyzed and studied. In practice, the tapping temperature is usually taken as an indicator to observe the production activity of the BF. In this section, five groups of comparative models were developed to analyze the effect of different tapping temperatures on the hearth stress.
As seen in Figure 10a–c, the highest temperatures of the three types of erosion hearth occurred in the center of the hearth bottom (T1). In terms of the amount of change in temperature, the mushroom-type erosion and mumps face-type erosion of the hearth is essentially the same. When the tapping temperature increased from 1714.8 K to 1831.7 K, the temperature of T1 and T2 increased by only 4.5%. The area of severe erosion has the largest temperature increase. The temperatures of T4, T5, and T6 of the mushroom-type erosion hearth increased by 22.5%, 25.7%, and 26.1%, respectively. The temperature of T5, T6, and T7 of the mumps face-type erosion hearth increased by 23.9%, 28.1%, and 24.1%, respectively. It can be seen that the temperature distribution of the refractory was very sensitive to changes in the tapping temperature. The change in the tapping temperature not only affected the overall temperature but also influenced the thickness of the solidified molten iron. An excessive tapping temperature leads to a significant reduction in the solidified iron layer thickness, which causes a large temperature rise in the erosion area. The temperature rise of the bowl-type erosion hearth was relatively small, with an average temperature rise of 21.1 K and an average variation of 3.7%. The reason for this is the ceramic cup was not fully eroded and isolated most of the molten iron heat. From the rate of the temperature change, the temperature of the bottom and side walls of the mushroom-type erosion hearth changed in a linear manner. The rate of temperature change in the area of severe erosion increased significantly when the tapping temperature was greater than 1773.3 K. In contrast, the rate of temperature change at all locations of the mumps face-type erosion and bowl-type erosion hearth was relatively stable.
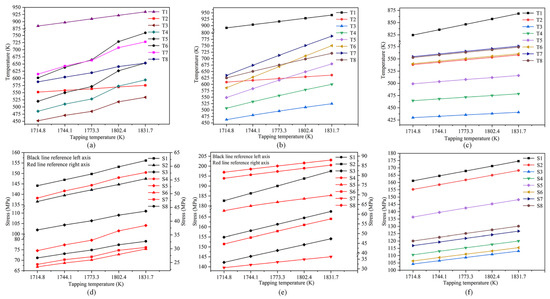
Figure 10.
The influence of tapping temperature: (a–c) the temperature of mushroom-type erosion, mumps-type erosion, and bowl-type erosion, respectively; (d–f) the stress of mushroom-type erosion, mumps-type erosion, and bowl-type erosion, respectively.
As can be seen in Figure 10d–f, the stresses of the three types of erosion hearth had a large increase in the tapping temperature. Additionally, the stress increases linearly. Mushroom-type erosion and mumps-type erosion hearth are similar, and the stress changes are greatest in areas with severe erosion. The stresses on S5 and S6 of the Mushroom-type erosion hearth increased by 31.2% and 27.8%, respectively. The stresses on the bottom (S2) and sidewall erosion area (S6) of the mumps-type erosion hearth increased by 8.2% and 28.91%, respectively. The stress change rate of the bottom area of the bowl-type erosion hearth (S1 and S2) is the largest, increasing by 13.46 MPa and 12.96 MPa, respectively. In addition, the stress change rate of each monitoring point in the hearth was about the same, around 8.4%. As summarized above, there is a strong relation between the tapping temperature and hearth stress. A reasonable reduction in the tapping temperature can effectively reduce the stress, thus slowing down the development of hearth erosion.
3.4. Influence of Cooling Intensity
The furnace cooling intensity is related to the cooling water flow, furnace masonry structure, cooling stave scaling, and air gap [34,35]. In this part, by changing the thermal boundary conditions of the furnace in the calculation model, the influence of the cooling intensity on the thermal stress of three types of erosion hearths was analyzed. The convective heat transfer coefficients are listed in Table 6.
Table 6.
The convection heat transfer coefficients. (W/(m2·K)).
In Figure 11a–c, it can be seen that the overall temperature decreases when the cooling intensity is increased. The maximum temperature drop in the mushroom-type erosion and bowl-type erosion hearth is at the bottom area of the hearth (T2). The maximum temperature drop in the mumps-type erosion hearth is in the sidewall erosion area (T6 and T7). In the same thermal boundary conditions, the enhanced cooling intensity forces more heat exchange to the furnace outside. After increasing the cooling intensity, the temperature variation in different areas experienced a small difference in the range, and the maximum difference was only 18.2 K. Compared to adjusting the tapping temperature, adjusting the cooling intensity could steadily reduce the overall temperature. It should be noted that the rate of temperature reduction decreased gradually after the cooling intensity was enhanced to a certain level. The simulation results are consistent with the effect of the cooling water velocity (cooling intensity) on the cooling stave hot surface temperature in reference [34] (Figure 4a in reference). The simulation results are reliable in this paper.
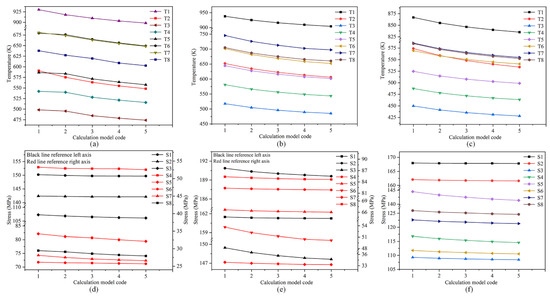
Figure 11.
The influence of cooling intensity: (a–c) the temperature of mushroom-type erosion, mumps-type erosion, and bowl-type erosion, respectively; (d–f) the stress of mushroom-type erosion, mumps-type erosion, and bowl-type erosion, respectively.
As seen in Figure 11d–f, the stresses in all regions of the hearth decreased in magnitude after the enhanced cooling intensity. The change in stress at the bottom of the mushroom-type erosion hearth was small after increasing the cooling intensity. The stress in the area of the severe erosion of the hearth (S5) decreased the most, with a decrease of 2.11 MPa (6%). The greatest stress reduction was observed in the bottom erosion area (S3) and sidewall erosion area (S6) of the mumps-type erosion hearth, with 1.82 MPa (1.2%) and 3.48 MPa (6.4%) reduction, respectively. The stress of S4 and S5 of the bowl-type erosion hearth decreased the most, by 2.24 MPa (1.9%) and 3.15 MPa (2.2%), respectively. In addition, the three types of erosion hearths have the same trend in stress variation. As the cooling intensity was enhanced, the rate of stress change in the furnace decreased. In summary, the enhanced cooling intensity of the hearth had a certain effect on reducing the thermal stress of the hearth. It is worth noting that when the cooling strength of the furnace sidewall increased by 120 W/(m2·K), a further increase in the cooling strength did not effectively reduce the temperature and thermal stress. Appropriate cooling conditions should be selected in production, which can not only effectively protect the furnace but also avoid resource waste.
3.5. Influence of Deadman Geometry
In the BF ironmaking process, the deadman is a non-moving porous coke column. It is relatively stable in its usual state, and it consumes and updates slowly. The state of the deadman has a large influence on the flow state of the molten iron in the BF hearth, which, in turn, leads to changes in the temperature and stress of the hearth. The state of the deadman mainly includes shape, porosity, coke size, etc. This section discusses the influence of the deadman geometry on the temperature and thermal stress distribution of the refractory. Based on the original calculation model, a cylindrical deadman comparison model was established. The radius of the deadman and the mass flow rate of the molten iron inlet are the same as in the original calculation model. The structure schematic diagram is shown in Figure 12.
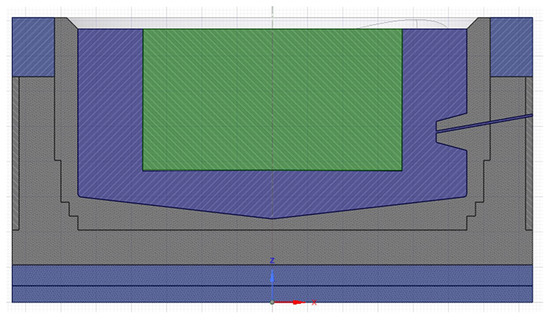
Figure 12.
The schematic diagram of the calculation model with a cylindrical deadman.
Figure 13a–c shows the temperature of the refractory under different geometries of the deadman. As can be seen from the figures, the hearth with mushroom-type and mumps-type erosion had a greater variation in temperature. The hearth with bowl-type erosion experienced less variation in the temperature. The sidewall (T6, T7) of the hearth with mushroom-type erosion had the greatest temperature variation at 13.76 K and 10.57 K, respectively. The largest temperature variations were found in the sidewall erosion zone (T5, T6) of the mumps-type erosion hearth, at 14.80 K and 12.49 K, respectively. The bottom area (T1, T2) of the furnace with bowl-type erosion showed the largest temperature variations of 7.42 K and 5.88 K, respectively. When the deadman geometry changed from the cone to the cylindrical, it led to a reduction in the coke-free zone near the side walls of the furnace cylinder. It caused the molten iron to flow faster in the furnace and intensified the circulation of the molten iron. This, in turn, led to an increase in the temperature of the refractory. Regarding the mushroom-type and mumps-type erosion hearth, the increased temperature caused a thinning of the solidified iron layer in the area of erosion. Combining these two factors, the hearth with mushroom-type and mumps-type erosion showed the greatest temperature variation in the severe erosion areas.
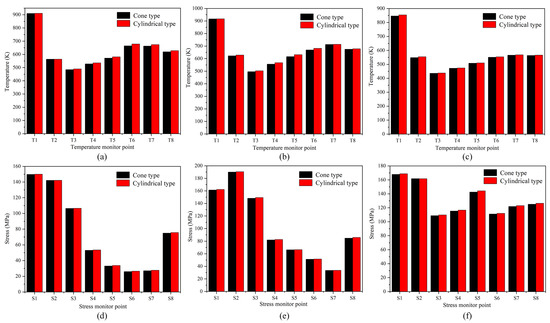
Figure 13.
The influence of deadman geometry: (a–c) are the temperature of mushroom-type erosion, mumps-type erosion, and bowl-type erosion, respectively; (d–f) are the stress of mushroom-type erosion, mumps-type erosion, and bowl-type erosion, respectively.
Figure 13d–f shows the effect of deadman geometry on the thermal stresses in the refractory. As can be seen from the figures, the mushroom-type erosion hearth had a low overall stress variation. The depression erosion and sidewall areas (S4–S8) had relatively large stress variations, averaging 0.6 MPa. The stress variation in the bottom erosion area (S3) and sidewall area (S8) of the mumps-type erosion hearth was high, at 1.14 MPa and 1.15 MPa, respectively. The stress variation in the corner area (S5) and sidewall area (S8) of the bowl-type erosion hearth was the largest, with 1.69 MPa and 1.30 MPa, respectively. In summary, the change in the deadman geometry from the cone to cylindrical mainly has an effect on the temperature and stress distribution in the sidewall and the severe erosion area of the furnace. However, the influence caused by the deadman geometry is relatively small compared to the other factors.
4. Conclusions
In this paper, the thermal stress of the BF hearth in the late service period was studied. The coupled thermal fluid-solid model of the BF hearth was established. The accuracy and usability of the model were verified by comparing the monitoring points and thermocouples temperatures. The effects of different BF production indicators and cooling conditions on the stress of the hearth with severe erosion were analyzed. The results are of great significance for guiding the production indicators and furnace protection strength of the BF in the later stage of service. The conclusions are as follows.
- The severe erosion areas of the mushroom and mumps-type erosion hearths form a solidified iron layer. The highest stress is at the bottom of the hearth. The maximum stress of the mumps face-type erosion hearth is higher than that of the other two erosion hearths. Under the same conditions, the stability of the mumps face-type erosion hearth is poor, and the erosion easily continues to expand.
- Among the three typical erosion hearths, when the tapping productivity, tapping temperature, and cooling intensity change, the change rate in the stress of the bowl-type erosion hearth is the smallest. This shows that the working state of the bowl-type erosion hearth is relatively stable. In addition, the mushroom-type erosion and mumps face-type erosion hearth always have the largest change in thermal stress in the deep erosion area. For the bowl-type erosion hearth, tapping productivity and tapping temperature have a great influence on the thermal stress at the center of the hearth, and the variation in the cooling intensity mainly affects the corner stress of the hearth.
- Overall, the influence of the tapping temperature on stress is the largest, followed by tapping productivity. The cooling intensity of the hearth has the smallest influence. In actual production, the productivity of the BF, tapping temperature and cooling intensity of the hearth can be properly adjusted to prolong the safe production life of the hearth.
- The change in deadman geometry from cone to cylindrical mainly has an effect on the temperature and stress distribution in the sidewall and the severe erosion area of the hearth. However, the influence of the deadman geometry is relatively small. In practice, the deadman geometry can be controlled appropriately to mitigate the stress increase in the refractory.
In future research work, we will further optimize the computation model. The chemical reaction between molten iron and refractory will be considered in the model to simulate the erosion process of molten iron scouring on the refractory. In addition, a damage model will be added to the structural stress analysis module to study the process of cracking and breaking of refractories caused by excessive thermal stress.
Author Contributions
Conceptualization, L.W. and L.C.; methodology, L.C.; software, L.W., F.Y. and L.Z.; validation, L.W., F.Y. and J.M.; formal analysis, Y.L. and F.Y.; investigation, J.M.; resources, L.C.; data curation, L.W., Y.L. and L.Z.; writing—original draft preparation, L.W., L.Z. and F.Y.; writing—review and editing, L.W.; visualization, Y.L. and L.Z.; project administration, L.C.; funding acquisition, J.M. All authors have read and agreed to the published version of the manuscript.
Funding
This research received no external funding.
Institutional Review Board Statement
Not applicable.
Informed Consent Statement
Not applicable.
Data Availability Statement
The data that support the findings of this study are available from the corresponding author upon reasonable request.
Conflicts of Interest
The authors declare no conflict of interest.
References
- Liu, Z.J.; Zhang, J.Z.; Zuo, H.B.; Yang, T.J. Recent progress on long service life design of chinese blast furnace hearth. ISIJ Int. 2012, 52, 1713–1723. [Google Scholar] [CrossRef]
- Huang, C.E.; Du, S.W.; Cheng, W.T. Numerical investigation on hot metal flow in blast furnace hearth through CFD. ISIJ Int. 2008, 48, 1182–1187. [Google Scholar] [CrossRef]
- Shao, L.; Saxen, H. Model of blast furnace hearth drainage. Steel Res. Int. 2012, 83, 197–204. [Google Scholar] [CrossRef]
- Shibata, K.; Kimura, Y.; Shimizu, M.; Inaba, S. Dynamics of dead-man coke and hot metal flow in a blast furnace hearth. ISIJ Int. 1990, 30, 208–215. [Google Scholar] [CrossRef]
- Zhang, C.B.; Zhao, C.X.; Shao, L.; Saxen, H.; Qu, Y.X.; Zou, Z.S. Numerical estimation of hearth internal geometry of an industrial blast furnace. Steel Res. Int. 2022, 93, 2100364. [Google Scholar] [CrossRef]
- Zhang, L.; Zhang, J.L.; Jiao, K.X.; Zhang, X.K.; Duan, S.J.; Wu, X.; Wang, J.C. Hot metal flow characteristics and its contribution to hearth erosion in the early stage of blast furnace campaign. Metall. Res. Technol. 2021, 118, 410. [Google Scholar] [CrossRef]
- Guo, Z.Y.; Zhang, J.L.; Jiao, K.X.; Zong, Y.B.; Wang, Z.Y. Occurrence state and behavior of carbon brick brittle in a large dissected blast furnace hearth. Steel Res. Int. 2021, 92, 2100273. [Google Scholar] [CrossRef]
- Brulin, J.; Gasser, A.; Rekik, A.; Blond, E.; Roulet, F. Thermomechanical modeling of a blast furnace hearth. Constr. Build. Mater. 2022, 326, 126833. [Google Scholar] [CrossRef]
- Wang, G.; Liao, Z.H.; Hu, Z.W.; Wang, D.D.; Bai, H.; Zou, Z.P.; Xu, J. Influence of the residual iron on the erosion of carbon bricks in a 4000 m(3) blast furnace hearth: From the measured properties to the proposed mechanisms. Metall. Mater. Trans. B-Proc. Metall. Mater. Proc. Sci. 2022, 53, 931–937. [Google Scholar] [CrossRef]
- Ni, A.; Li, C.Z.; Zhang, W.; Xiao, Z.X.; Liu, D.L.; Xue, Z.L. Investigation of the hearth erosion of WISCO no. 1 blast furnace based on the numerical analysis of iron flow and heat transfer in the hearth. Metals 2022, 12, 843. [Google Scholar] [CrossRef]
- Shinotake, A.; Nakamura, H.; Yadoumaru, N.; Morizane, Y.; Meguro, M. Investigation of blast-furnace hearth sidewall erosion by core sample analysis and consideration of campaign operation. ISIJ Int. 2003, 43, 321–330. [Google Scholar] [CrossRef]
- Shao, L.; Saxen, H. Numerical prediction of iron flow and bottom erosion in the blast furnace hearth. Steel Res. Int. 2012, 83, 878–885. [Google Scholar] [CrossRef]
- Li, Y.; Chen, L.Y.; Wang, L.; Ma, J.C. Monitoring the safety status of a blast furnace hearth using cooling stave heat flux. AIP Adv. 2020, 10, 25308. [Google Scholar] [CrossRef]
- Kumar, S. Heat transfer analysis and estimation of refractory wear in an iron blast furnace hearth using finite element method. ISIJ Int. 2005, 45, 1122–1128. [Google Scholar] [CrossRef]
- Zhao, Y.F.; Fu, D.; Lherbier, L.W.; Chen, Y.; Zhou, C.Q.; Grindey, J.G. Investigation of skull formation in a blast furnace hearth. Steel Res. Int. 2013, 85, 891–901. [Google Scholar] [CrossRef]
- Gan, Y.F.; Jang, J.Y.; Wu, T.Y. 3D dynamic thermal and thermomechanical stress analysis of a hot blast stove. Ironmak. Steelmak. 2020, 47, 959–972. [Google Scholar] [CrossRef]
- Li, Y.L.; Cheng, S.S.; Zhang, P.; Zhou, S.H. Sensitive influence of floating state of blast furnace deadman on molten iron flow and hearth erosion. ISIJ Int. 2015, 55, 2332–2341. [Google Scholar] [CrossRef]
- Wang, L.; Chen, L.Y.; Li, Y.; Ma, J.C. Numerical simulation model for evaluating protection measures of blast furnace hearth. Processes 2022, 10, 481. [Google Scholar] [CrossRef]
- Niu, Q.; Cheng, S.S.; Xu, W.X.; Niu, W.J.; Mei, Y.G. Analysis of the coke particle size distribution and porosity of deadman based on blast furnace hearth dissection. ISIJ Int. 2019, 59, 1997–2004. [Google Scholar] [CrossRef]
- Shao, L.; Xiao, Q.L.; Zhang, C.B.; Zou, Z.S.; Saxen, H. Dead-man behavior in the blast furnace hearth-a brief review. Processes 2020, 8, 1335. [Google Scholar] [CrossRef]
- Koponen, A.; Kataja, M.; Timonen, J. Permeability and effective porosity of porous media. Phys. Rev. E 1997, 56, 3319. [Google Scholar] [CrossRef]
- Launder, B.E.; Spalding, D.B. The numerical computation of turbulent flows. Comput. Meth. Appl. Mech. Eng. 1974, 3, 269–289. [Google Scholar] [CrossRef]
- Zhang, Q.C.; Chen, L.Y.; Zhao, C.C. Numerical simulation of combustion and air supplyprocess and optimal design of traditional topcombustion hot blast stoves. Steel Res. Int. 2020, 92, 2000311. [Google Scholar]
- Veynante, D.; Vervisch, L. Turbulent combustion modeling. Prog. Energy Combust. Sci. 2002, 28, 193–266. [Google Scholar] [CrossRef]
- Swartling, M.; Sundelin, B.; Tilliander, A.; Jonsson, P.G. Heat transfer modelling of a blast furnace hearth. Steel Res. Int. 2010, 81, 186–196. [Google Scholar] [CrossRef]
- Xu, X.; Wu, L.J.; Lu, Z. Performance optimization criterion of blast furnace stave. Int. J. Heat Mass Transfer. 2017, 105, 102–108. [Google Scholar] [CrossRef]
- Jiao, K.X.; Zhang, J.L.; Liu, Z.J.; Liu, F.; Liang, L.S. Formation mechanism of the graphite-rich protective layer in blast furnace hearths. Int. J. Miner. Metall. Mater. 2016, 23, 16–24. [Google Scholar] [CrossRef]
- Jiao, K.X.; Zhang, J.L.; Liu, Z.J.; Chen, C.L.; Liu, Y.X. Analysis of blast furnace hearth sidewall erosion and protective layer formation. ISIJ Int. 2016, 56, 1956–1963. [Google Scholar] [CrossRef]
- Sheikholeslami, M. Numerical simulation of magnetic nanofluid natural convection in porous media. Phys. Lett. A 2017, 381, 494–503. [Google Scholar] [CrossRef]
- Sheikholeslami, M. New computational approach for exergy and entropy analysis of nanofluid under the impact of Lorentz force through a porous media. Comput. Meth. Appl. Mech. Eng. 2019, 344, 319–333. [Google Scholar] [CrossRef]
- Li, Y.; Chen, L.Y.; Ma, J.C. Numerical study on the relationship between the localized depression erosion of a commercial blast furnace hearth lining and the heat flux of cooling staves. IEEE Access 2019, 7, 60984–60994. [Google Scholar] [CrossRef]
- Chen, L.Y.; Li, Y.; Gui, J.H. Thermal stress of blast furnace hearth linings under erosion state. Appl. Mech. Mater. 2009, 16–19, 1101–1105. [Google Scholar] [CrossRef]
- Jiao, K.X.; Zhang, J.L.; Hou, Q.F.; Liu, Z.J.; Wang, G.W. Analysis of the relationship between productivity and hearth wall temperature of a commercial blast furnace and model prediction. Steel Res. Int. 2017, 88, 1600475. [Google Scholar] [CrossRef]
- Jiao, K.X.; Zhang, J.L.; Liu, Z.J.; Jiang, H.B. Cooling efficiency and cooling intensity of cooling staves in blast furnace hearth. Metall. Res. Technol. 2019, 116, 414. [Google Scholar] [CrossRef]
- Jiao, K.X.; Zhang, J.L.; Liu, Z.J.; Deng, Y.; Chen, C.L. Cooling phenomena in blast furnace hearth. J. Iron Steel Res. Int. 2018, 25, 1010–1016. [Google Scholar] [CrossRef]
Disclaimer/Publisher’s Note: The statements, opinions and data contained in all publications are solely those of the individual author(s) and contributor(s) and not of MDPI and/or the editor(s). MDPI and/or the editor(s) disclaim responsibility for any injury to people or property resulting from any ideas, methods, instructions or products referred to in the content. |
© 2023 by the authors. Licensee MDPI, Basel, Switzerland. This article is an open access article distributed under the terms and conditions of the Creative Commons Attribution (CC BY) license (https://creativecommons.org/licenses/by/4.0/).