Article

A Techno-Economic Study of Catalytic Decarboxylation Process for Naphthenic Acids Utilizing Protonic Zeolite Socony Mobil Type 5 (HZSM-5) Catalyst

by
Nihad Omer Hassan
1,
Gasim Ibrahim
2,
Dhallia Mamoun Beshir
1 and
Nimir O. Elbashir
1,2,*
1
Department of Petroleum Transportation and Refining Engineering, Sudan University of Science and Technology, Khartoum P.O. Box 407, Sudan
2
Chemical Engineering Program, Texas A&M University at Qatar, Doha P.O. Box 23874, Qatar
*
Author to whom correspondence should be addressed.
Processes 2023, 11(2), 507; https://doi.org/10.3390/pr11020507
Submission received: 10 January 2023 / Revised: 30 January 2023 / Accepted: 31 January 2023 / Published: 7 February 2023

Abstract

:
This paper represents a detailed techno-economic analysis of a typical commercial-scale catalytic decarboxylation process of naphthenic acids over HZSM-5 zeolite. Simulation of the process has been performed in ASPEN Plus®. The performance of the modeled unit was compared to experimental results data from a similar plant. Two models were developed for the proposed industrial plant based on continuous flow reactors; the first is based on a fluidized bed reactor, and it was modeled as a continuous stirred tank reactor (CSTR) unit, and the second is a semi-regenerative process that consists of three fixed-bed reactors with intermediate preheaters and are modeled as three plug flow reactors (PFR). The outcome of the economic analysis of the two proposed commercial scale reactors of a decarboxylation process of a capacity of 11,000 bbl/day showed that the CAPEX, including the total equipment cost for the fluidized bed reactor plant and semi-regenerative process plant, was $44,319,362 and $4,447,919, respectively. The annual operating cost for the fluidized bed plant and semi-regenerative process plant is 45,269,180 $/year and 1,771,839 $/year, respectively. Our results demonstrated that catalytic decarboxylation over HZSM-5 zeolite is economically feasible using a semi-regenerative process, and is a promising method for removing naphthenic acid. The insight obtained from this work can be used as a basis for more comprehensive future financial and risk modeling of the process. The cost estimated in this work was compared to the Khartoum refinery cost for the naphthenic acid corrosion mitigation system, with a saving of $29,459,528.

1. Introduction

Naphthenic acids are organic acids found in crude oil and are mainly responsible for the acidity of crude oil [1]. Higher acidity causes corrosion to distillation columns, heat exchangers, storage tanks, and pipelines and creates the need for frequent maintenance and replacement of equipment and pipelines [2]. Currently, the deacidification of crude oils can be achieved by two approaches: The first approach involves destroying the carboxyl group in the acid (referred to as a chemical method for naphthenic acid removal) via esterification, neutralization, and decarboxylation [3,4,5,6,7]. The second approach involves separating the naphthenic acids from the oil for other uses (referred to as a physical method for naphthenic acid removal) via liquid–liquid extraction and adsorption [8,9,10,11,12,13]. Decarboxylation is the removal of carboxyl acid functional group reaction. The decarboxylation reaction follows two major steps: breaking the C-C bond and launching the carbon dioxide (CO2). The cleavage of the C-C bond gives carbonic acid as an intermediate, which decomposes to release CO2 [14,15,16]. Through this catalytic reaction, n-alkane of one less carbon number is produced [17]. In our previous research, studies were carried out to determine whether the total acid number (TAN) of a typical acidic crude oil derived from Al-Fula blocks in Western Sudan might be reduced by using the HZSM-5 zeolite catalyst [18]. The properties of Al-Fula crude oil are listed in Table 1. The effectiveness of the catalyst at three parametric levels (reaction temperature: 250–270–300 °C, reaction time: 2–3–4 h, and oil: catalyst weight ratio: 20–22–25 g/g) was better understood using a full factorial design of the experiment (DOE) framework. The results show that the HZSM-5 zeolite catalyst removes up to 99% of naphthenic acids via the decarboxylation route. Finally, a Langmuir–Hinshelwood (LH) kinetic model was developed to allow efficient prediction of the performance of the HZSM-5 zeolite catalyst in the decarboxylation reaction [18].
A reactor is the core of many chemical processes; it is considered a vessel whereby chemical reaction occurs as it has been designed in different shapes for this purpose. The chemical reaction converts reactants (raw material) into products. Standard reactors are classified into batch, semi-batch, and continuous according to operation type; however, other non-ideal reactors, such as recycle reactors, can also be used. If the reaction takes place in one phase, it is then classified as a homogeneous reaction, and if more than one exists, then it is classified as a heterogeneous reaction. The reactions themselves can be catalytic or non-catalytic [19]. Heterogeneous catalytic reactions are one of the important chemical technologies used to manufacture products; they typically deal with fluid reactants (gas or liquid) in the presence of a solid catalyst [19]. Ideal reactors are classified into three types: batch, continuous stirred tank reactor (CSTR), and plug flow reactor (PFR) [20].
The selection and design of a catalytic reactor depend primarily on the type of process and basic process variables such as residence time, temperature, pressure, mass transfer between different phases, the properties of the reactants, and the available catalysts [21,22]. The most important industrial catalytic reactors are two-phase reactors for the system fluid/solid and three-phase reactors for the system gas/solid/liquid. Catalytic reactions are generally carried out in continuous fixed-bed reactors (referred to as packed bed reactors), which are modeled as plug flow reactors (PFR) and operate without back mixing. On the other hand, the ideal continuous stirred-tank reactor with complete back mixing of the reaction mass is modeled as CSTR [23].
The practice of process simulation has developed over the last two decades in the field of chemical and engineering processes [24]. Many simulators were used for simulating chemical processes, such as ASPEN Plus®, ASPEN HYSYS®, Design Pro, and CHEMCADTM. ASPEN Plus® is a leading software that builds a model and simulates the model based on mass and energy and phase equilibrium; it handles several chemical processes such as chemical reactors, separation processes, recycling, bypass, and electrolytes [25,26].
Researchers have used ASPEN Plus® extensively to simulate and optimize various types of process equipment and unit operations. ASPEN Plus® Saidi et al. [27] used the continuous stirred tank reactor (RCSTR) to simulate the copper recovery process. Using absorber models, Sampath et al. Field [16] also developed a model to simulate CO2 removal from coal and gas-fired power plants. Qing et al. [28] developed a model to simulate the synthesis of nanocrystalline cellulose using the waste biomass using the RCSTR reactor model. Liu et al. [29] developed a model to simulate preparing biochar by biomass pyrolysis using a yield reactor (RYield). To date, a limited number of studies have been carried out in catalytic decarboxylation simulations, which are summarized in Table 2. Plazas et al. [30] developed a model for catalytic reduction of fatty acid through hydrogenation, decarboxylation, and decarbonylation using NiMo/γAl2O3 catalyst ASPEN Plus® 7.3 Software, where an equilibrium reactor was used to predict the reaction behavior. The impact of many factors affecting the process, such as reactor pressure, temperature, and H2/oil molar ratio, was analyzed. According to their research results, the optimized conditions were obtained at a pressure of 30 bar, a temperature of 300 °C, and a H2/oil molar ratio of 20:1.
Kin Wai Cheah et al. [31] developed a comprehensive techno-economic assessment using ASPEN Hysys® V8.0 software for hydro-processed diesel fuel production via catalytic decarboxylation of rubber seed oil in Malaysia. In this study, the facility was modeled to be capable of producing a total of 20 million liters of renewable diesel product per annum; moreover, sensitivity analysis was conducted to show which factors were affecting the overall profitability profile. Their results show that the production cost of renewable diesel is more sensitive to the price of rubber seed oil and the price of hydrogen gas. Natelson et al. [17] developed a model for the techno-economic evaluation of the production of Camelina jet fuel. ASPEN Plus® was used for material and energy balance, the evaluation of parameters that impact the process, and identifying the optimal conditions for the production process. On the other hand, ASPEN Icarus® was used for the cost evaluation. The results illustrated the importance of the choice of refinery location near farms. Braden et al. [32] developed a techno-economic evaluation based on the ASPEN Plus® simulation model. Sensitivity analysis studies were conducted to determine the impact of changes in key economic and processing parameters on the minimum selling price (MSP). Results reveal feedstock and total installed equipment costs are the most sensitive process parameters. Onwudili et al. [33] developed a hypothetical continuous process model to deliver 20,000 tonnes/year of bio propane in an ASPEN® simulation.
However, there is still a need to develop an industrial process for the catalytic decarboxylation of naphthenic acids that can be integrated into either oil production fields or refinery plants. The reliability of refinery equipment during the processing of high-acid crude oils is critical. Blending, material upgrading, inhibition, and process control are current solutions for corrosion. Blending can be used to reduce the naphthenic acid content of the feed, resulting in acceptable corrosion. Blending heavy and light crudes can alter shear stress parameters and may aid in corrosion reduction [34]. Upgrading materials of construction from carbon steel (CS) to metals and alloys containing chromium, nickel, and molybdenum (stainless steels), alloys based on nickel, cobalt, copper, titanium, and aluminum, polymers, and composite materials are complex tasks that necessitate a large capital investment as well as a longer execution time. Stainless steels and nickel alloys are also prone to pitting and crevice corrosion, intergranular corrosion, and stress corrosion cracking. A proper alloy selection method is based on information and experience in standards, procedures, reports, and articles. The disadvantage of this method is that environmental changes can affect alloy corrosion resistance. Corrosion mitigation with additives is an alternative to hardware changes. Corrosion at high temperatures is mitigated during naphthenic acid crude processing by injecting either phosphate-based ester additives or sulfur-based additives, which provide an adherent layer that does not corrode or erode due to the effect of naphthenic acids [34,35]. Therefore, the need for a permanent method for mitigating naphthenic acid corrosion includes destroying the naphthenic acids. This paper proposed a permanent method for the destruction of these acids through a catalytic decarboxylation process, in which the carboxyl group reacted to produce carbon dioxide.
Researchers have proposed many laboratory methods but scaling up the process remains challenging [23,24,25,26,27,28,29,30,31,32]. Moreover, the literature cited in Table 2 did not include a simulation of potential processes for the catalytic decarboxylation of naphthenic acids, as the process is yet to be developed. The development of the simulation model for the catalytic decarboxylation of naphthenic acids has yet to be considered due to the complex nature of the process and limited information in the literature. The development of simulation models in this area will facilitate the improvement of reactor technology for the removal process and help it find its way to commercialization. This study aims to develop a simulation model of the catalytic decarboxylation of naphthenic acids over the HZSM-5 zeolite catalyst and validate the applicability of the developed model using experimental data under similar conditions to the typical process. The validated model will be used to design commercial-scale plants. The novelty of this study is that it includes the economic feasibility of the proposed technology compared with existing commercial technology for highly acidic crude oil in Sudan. The highly acidic crude oil properties are listed in Table 1.
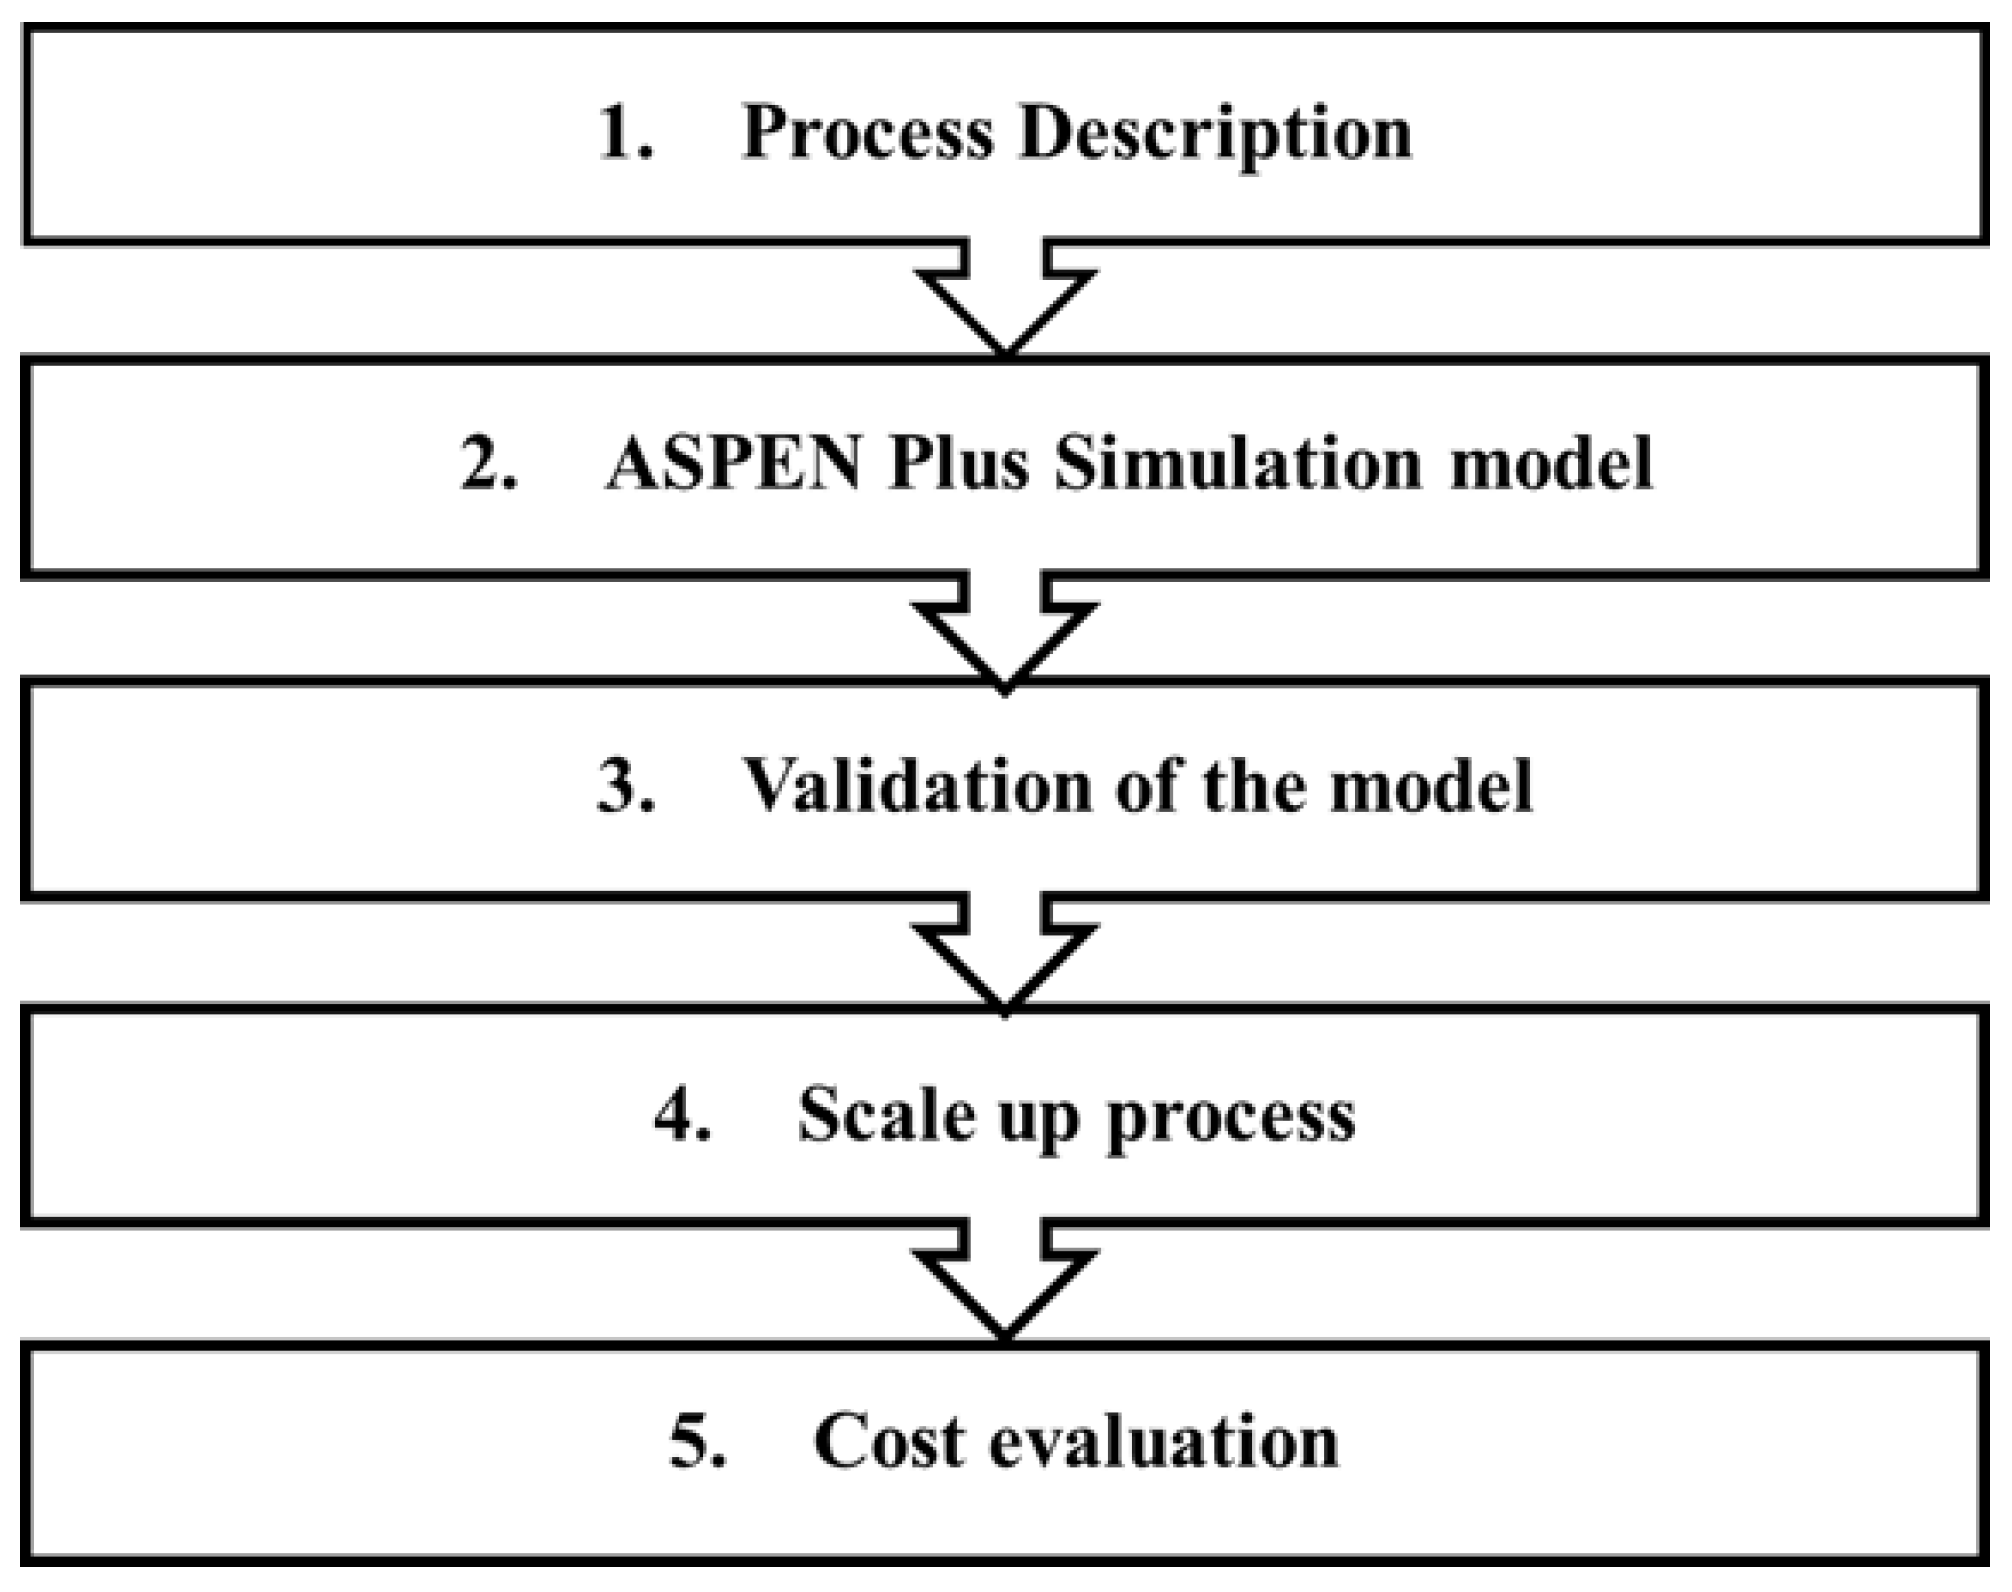
This paper’s first part focuses on converting the catalytic decarboxylation process pathway into the preliminary conceptual design flowsheet via the ASPEN Plus
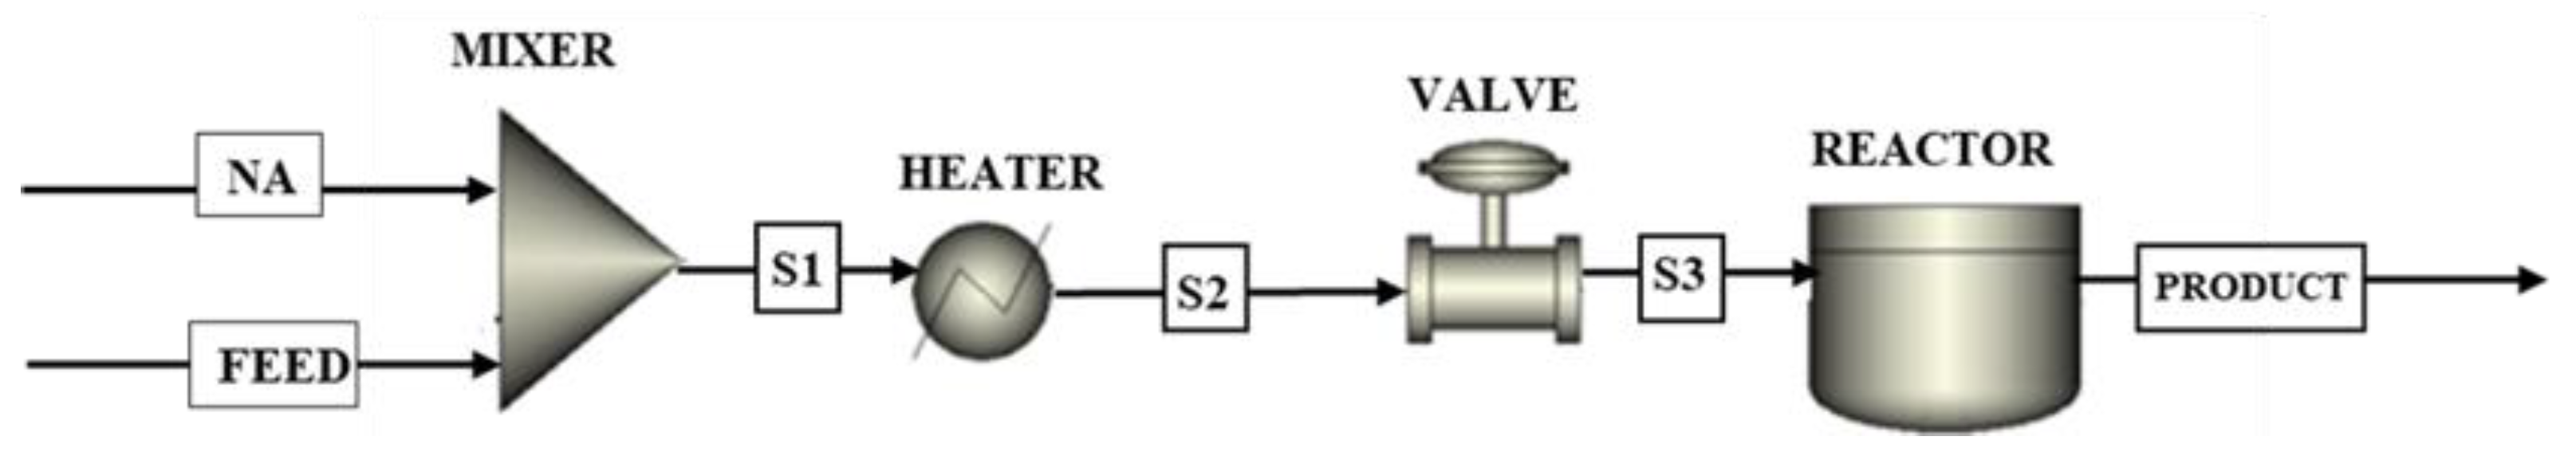
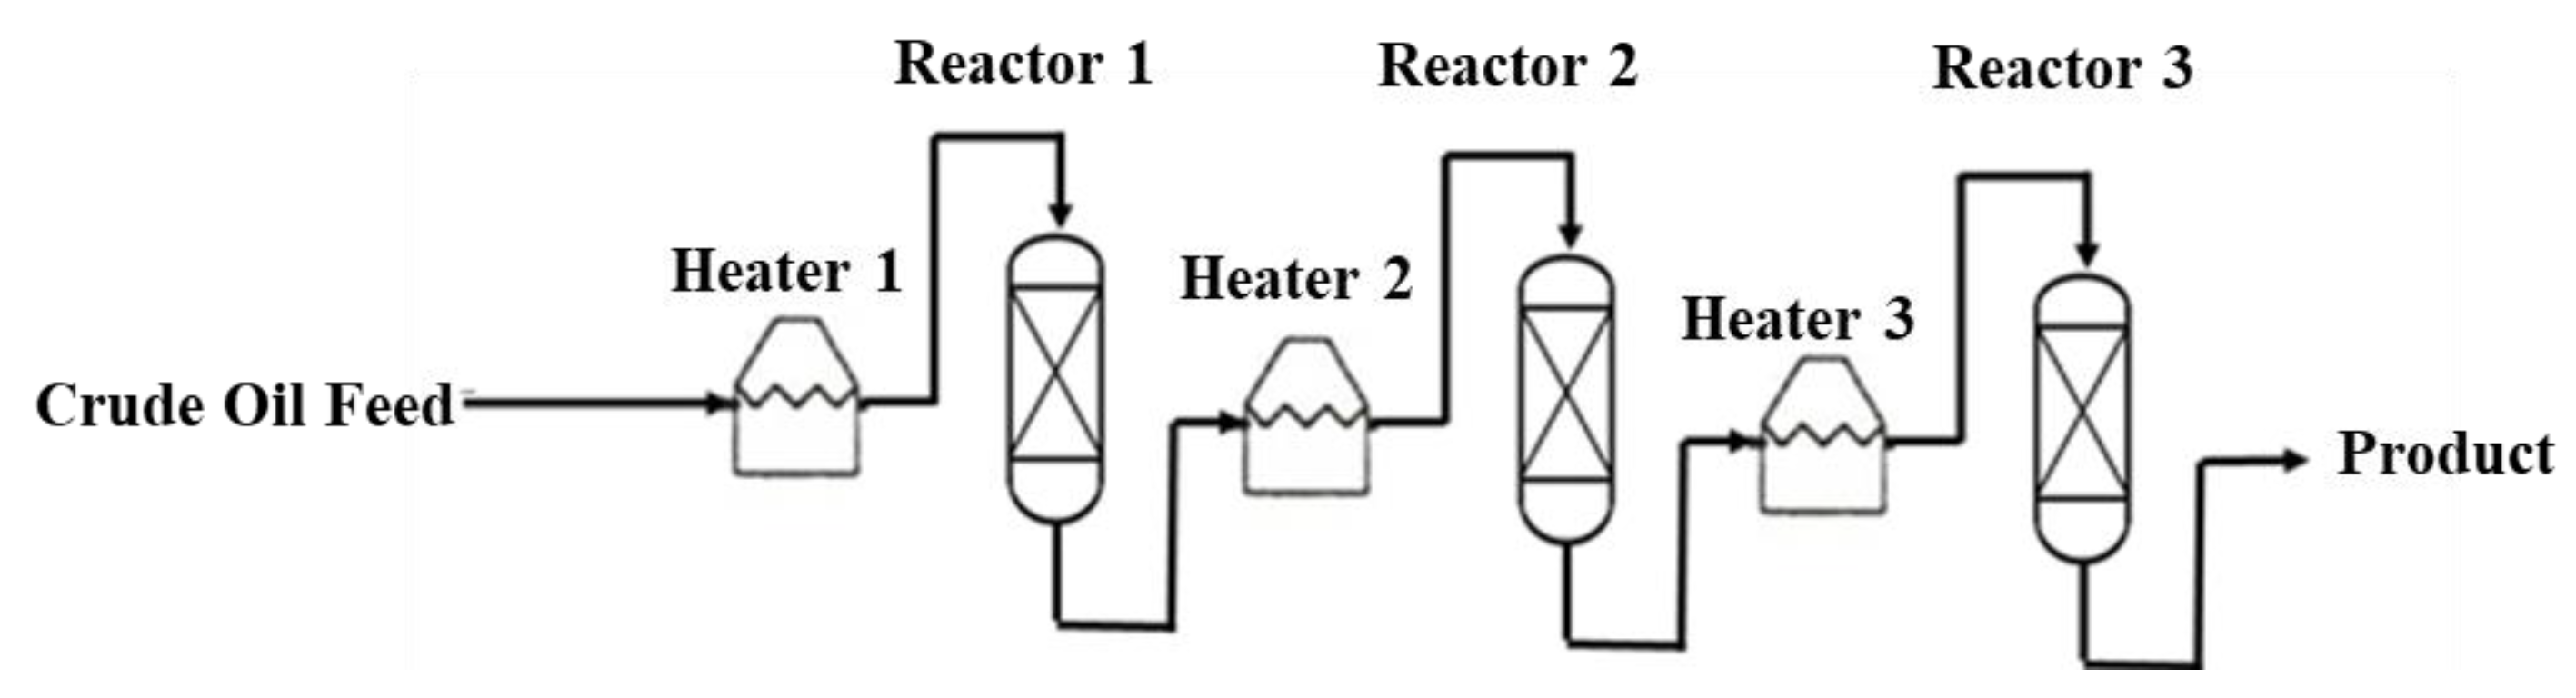
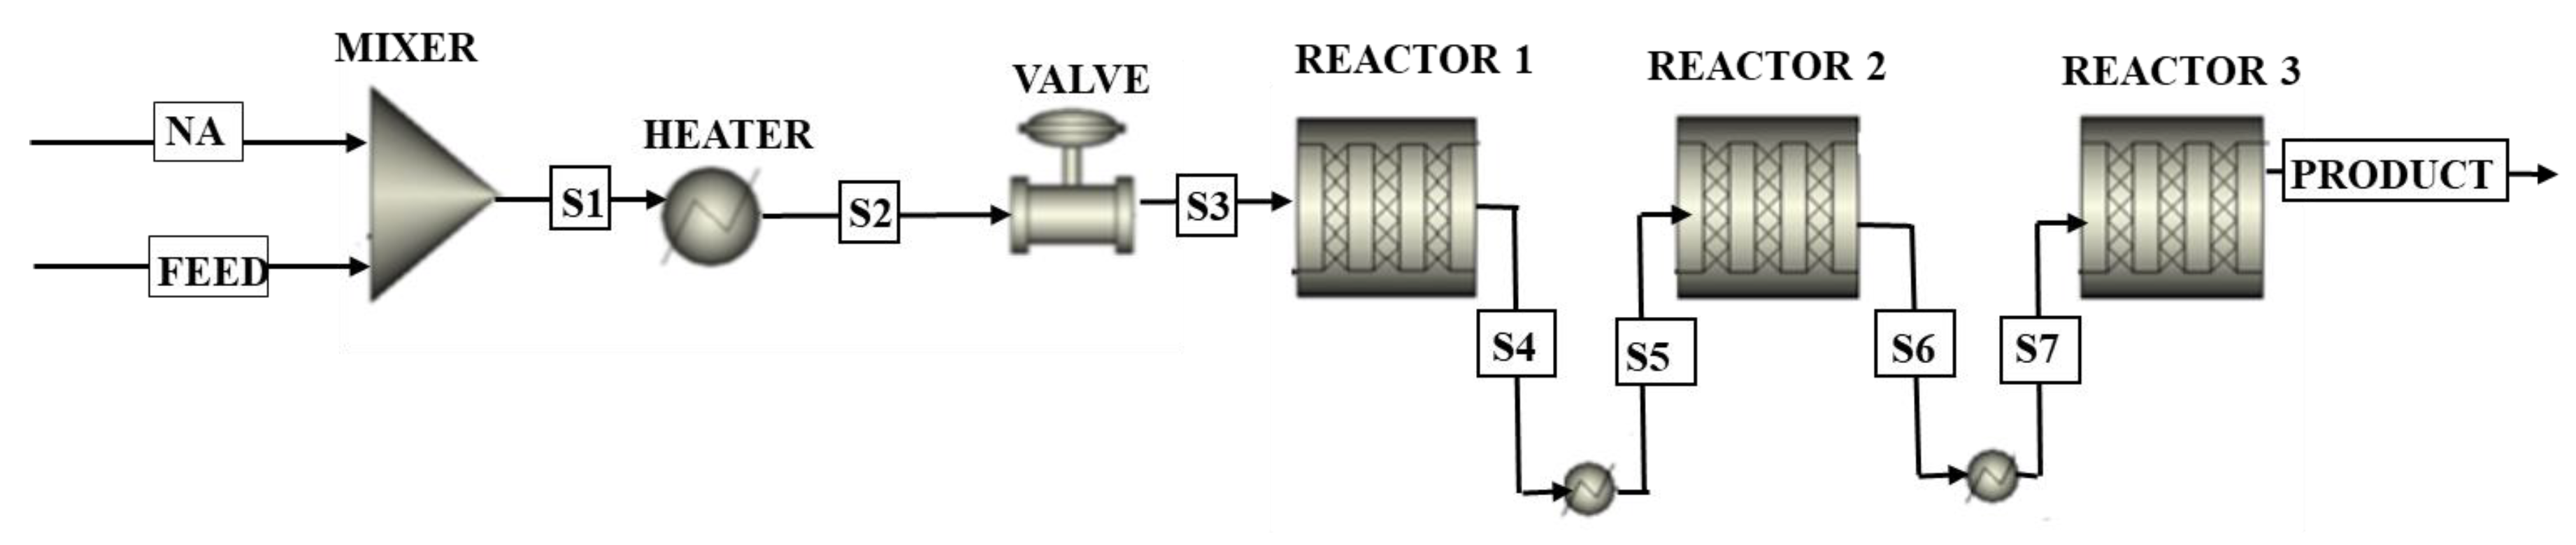
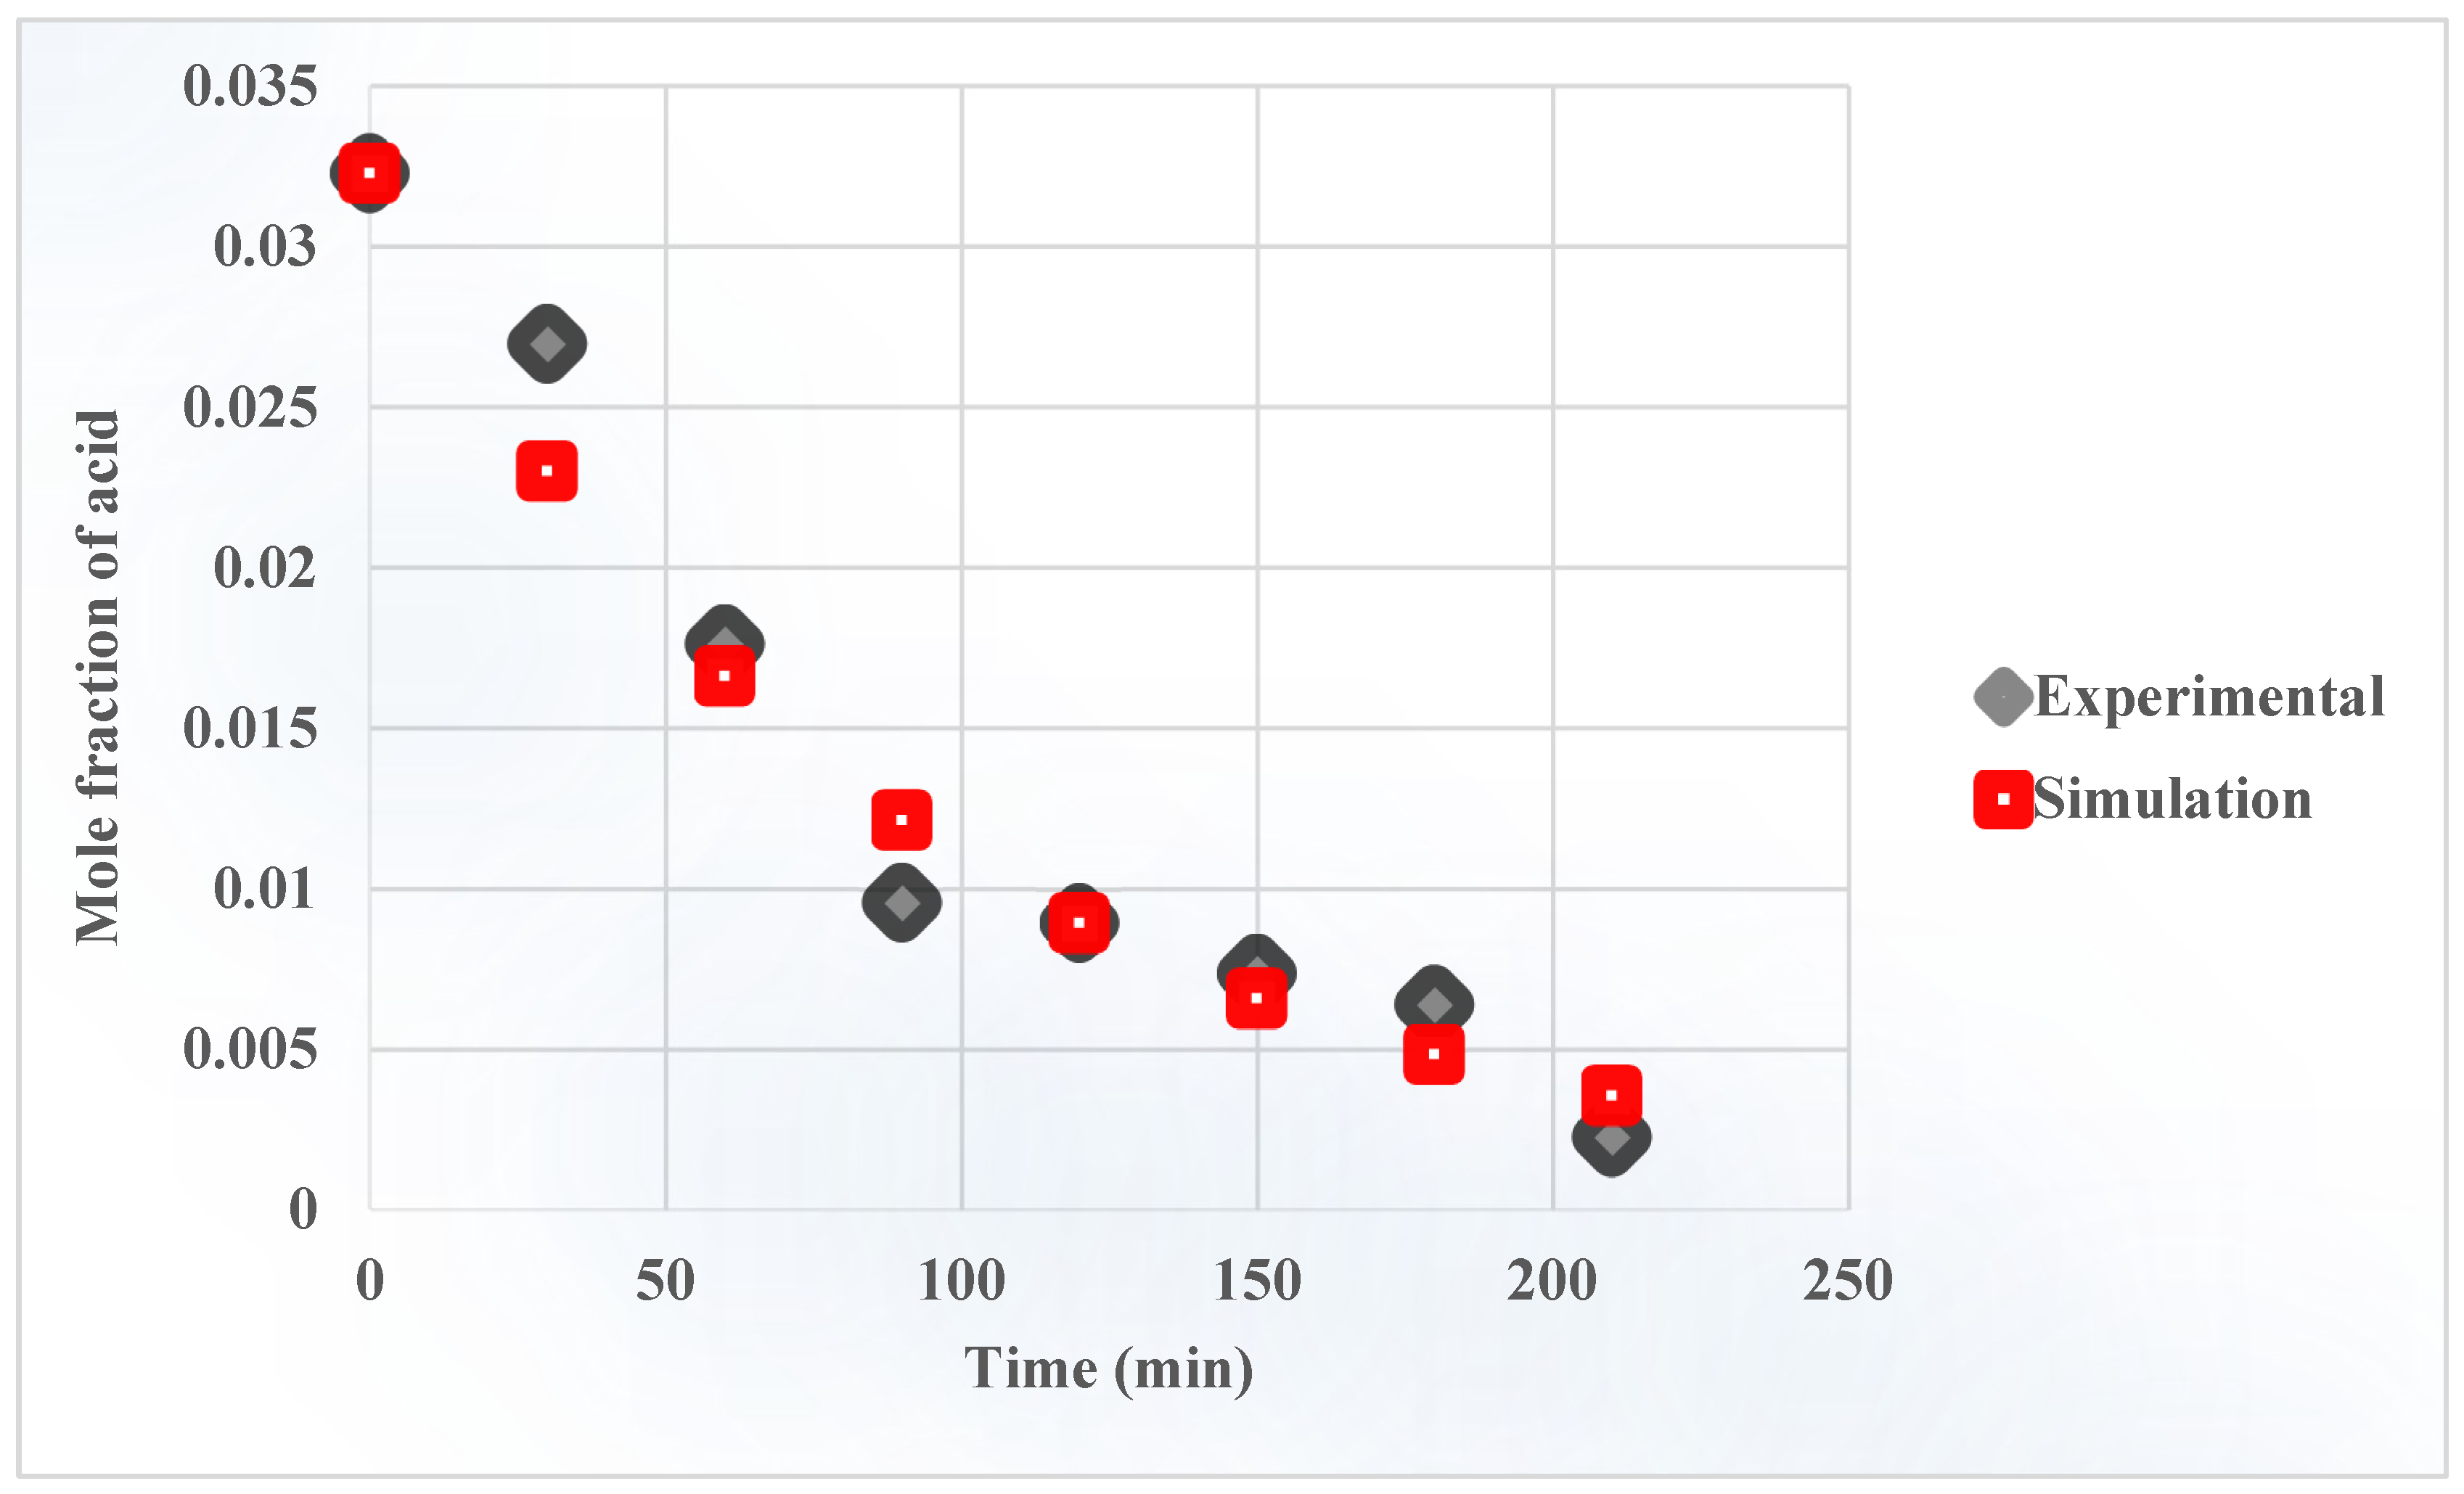
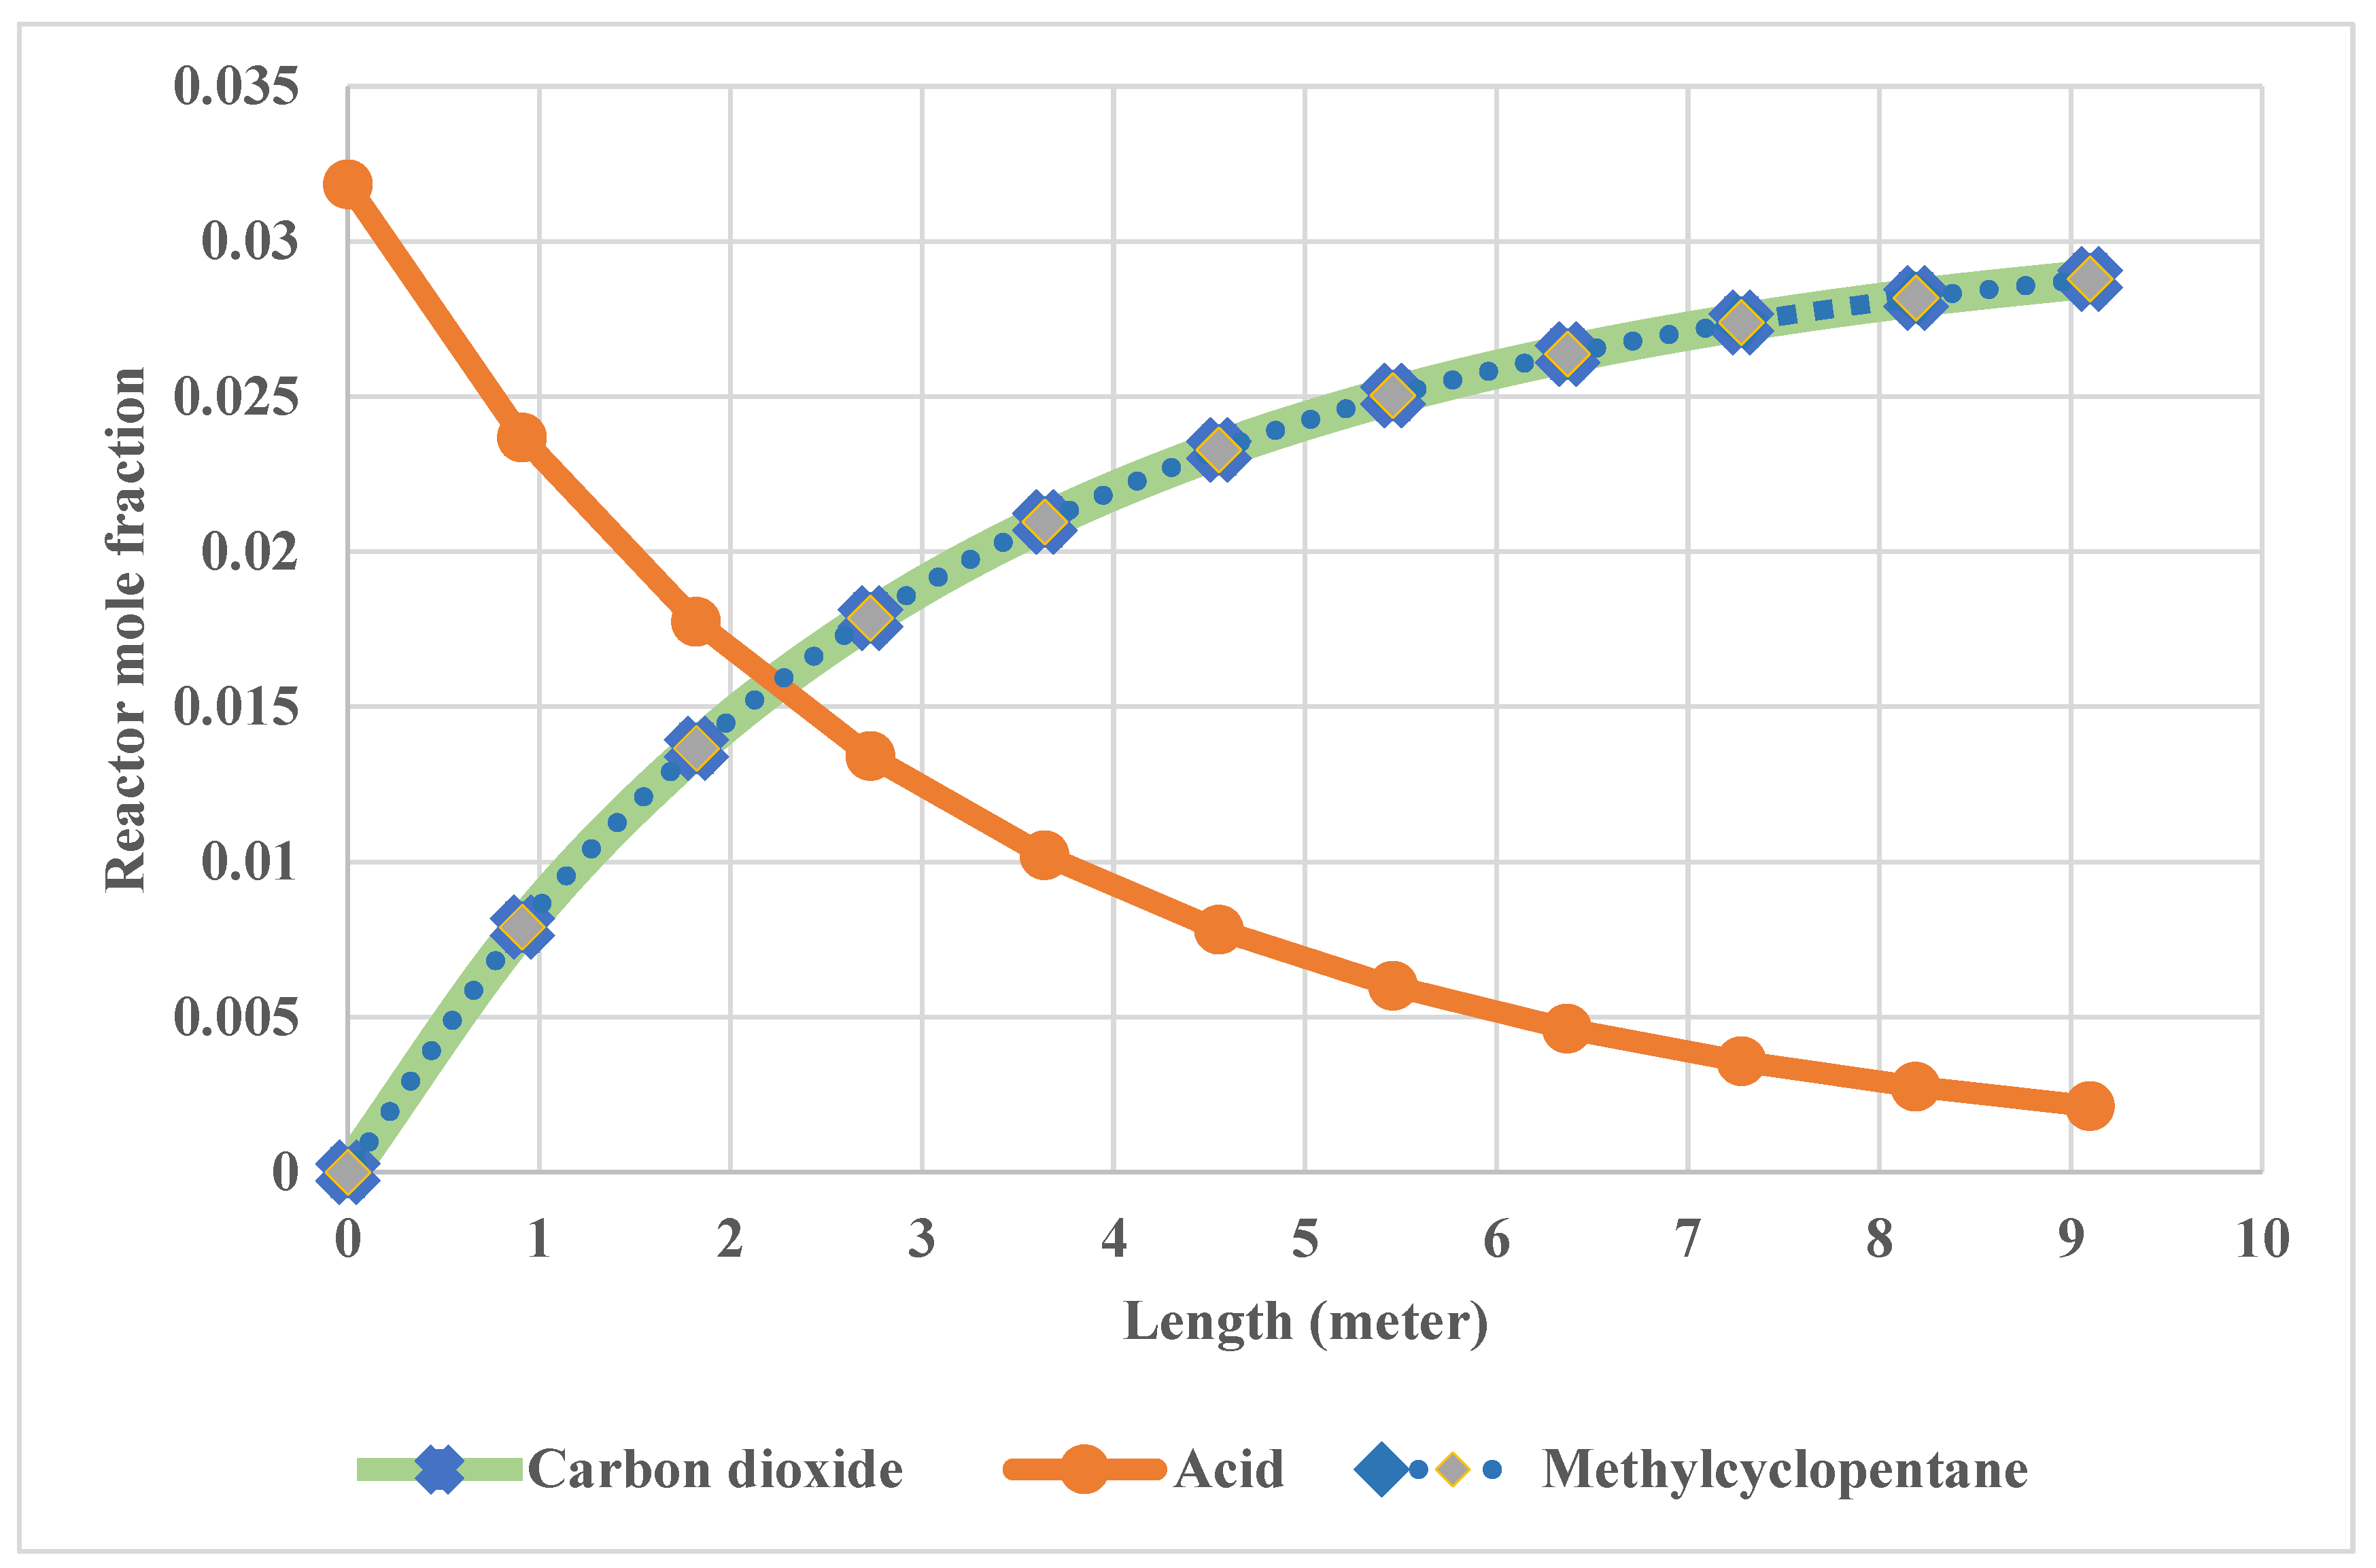
® simulator. For the validation of the model, experimental results from a batch reactor have been used to develop a hypothetical process [18], followed by investigating the possibility of scaling up the process and choosing the best industrial reactor for a potential commercial plant. The second part reported a comprehensive economic assessment for a feedstock of 11,000 bbl/day of acidic crude. A sensitivity analysis was then conducted to determine the dominant factors affecting the annual operating cost of the project. Non-technical investors or oil companies can use the results obtained in this study to consider the option of building a catalytic decarboxylation facility as part of the crude treatment before transportation and refining.

2. Materials and Methods

A detailed description of the sequential steps used to analyze the process is as follows: firstly, a base case process was designed with parameters and operation conditions obtained from the literature. Secondly, this flowsheet was simulated with a computer-aided simulation package (ASPEN Plus®) to evaluate the characteristics of the main equipment and streams entering and leaving the units. Thirdly, the model was validated using Root Mean Squared Deviation and compared with data literature data. Fourthly, a scaled-up process was developed and simulated, which then provided a comparison between different forms of industrial reactors. Finally, a cost evaluation study was conducted using an economic analyzer to assess the techno-economic feasibility of the process. The sequential steps for analyzing the potential design of a process for the catalytic decarboxylation of naphthenic acid over the HZSM-5 process are illustrated in Figure 1.

2.1. Process Description

The process used in this study and the performance of the zeolite catalyst for the decarboxylation of naphthalene was reported in our earlier publication [18]. Naphthenic acids present in the crude oil were converted into hydrocarbon and CO2 in a batch reactor at a temperature of 270 °C and a pressure of 0.8 bar.
The decarboxylation reaction of naphthenic acid on zeolite, according to the literature [11,15,16], is as follows:
R-COOH → R-H + CO2 [Overall Reaction]
R-COOH + s → R-COOH.s Adsorption of Reactant
R-COOH.s → R-H.s + CO2 Surface Reaction
R-H.s → R-H + s Desorption of Products

2.2. Process Simulation Using Experimental Reaction Kinetics

Commercial software ASPEN Plus® program version 11 was used to model the catalytic decarboxylation of naphthenic acids over an HZSM-5 zeolite catalyst. The process modeling methodology includes selecting chemical components from a database, choosing a proper unit system, defining stream conditions (temperature, pressure, flow rate, and individual composition of each chemical component), and lastly, selecting the proper thermodynamic model. The crude oil was gained from the Central Petroleum Laboratories (CPL). The true boiling point (TBP) (liquid volume basis) and API gravity curves data of Al-Fula crude oil were listed in Table 3. HZSM-5 Zeolite catalyst properties are listed in Table 4.
Process models were set up by connecting energy and material streams to unit operation blocks, including heaters, mixers, reactors, and valves, as shown in Figure 2. The model consists of four pieces of equipment: a mixer, heater, valve, and reactor, according to the operating conditions of the process. The feed entered the heater to elevate the temperature to 270 °C, after which it entered the valve to decrease the pressure from 1 bar to 0.8 bar. The mixer was needed to simulate the crude oil by blending the feed stream with the model naphthenic acid. RBatch reactor that operates at constant temperature 270 °C, pressure 0.8 bar. The Peng–Robinson equation of state (EOS) was employed due to its excellent capabilities in predicting vapor–liquid equilibria state. Moreover, it is considered the most widely used cubic EOS in the refinery and gas-processing industries [36,37,38]. The simulation was performed to calculate data needed for the economic analysis, such as mass and energy balances, which give the flow rate of utility and product flow rate.
The following assumptions were considered while modeling the catalytic decarboxylation of the naphthenic acids over the HZSM-5 zeolite catalyst process:
  • Isothermal process.
  • Naphthenic acid is modeled as cyclopentyl acetic acid in the model, and it has been mixed with the crude oil stream.
  • The decarboxylation reaction of cyclopentyl acetic acid over HZSM-5 Zeolite was represented by Equation (5).
C 7 H 12 O 2 HZSM 5 C 6 H 12 + C O 2

Modeling Development Stages

RBatch model in the ASPEN Plus® represents the batch reactor in the experiment, and the parameters were set according to the condition of the experiment. The operating phase of the experimental model was vapor and liquid; therefore, a valid phase of the RBatch reactor model in Aspen was selected as vapor and liquid. The detailed kinetics of the removal reaction has been described in our earlier publication [18]. The kinetic parameters were optimized by minimization of the mean average percentage error between the experimental data and the ASPEN Plus® model. According to that work, the catalytic decarboxylation reaction of naphthenic acid over the HZSM-5 catalyst follows the Langmuir–Hinshelwood mechanism (LHHW), and the complete rate equations were expressed as follows:
r = k A [ C A C B C C K ] ( 1 + K R C B C C + K B C B )  
k A = 0.97 + 2509 T
K = 34.5 + 11 , 760.5 T
K R = 4.68 + 2023.621 T
K B = 14 + 6737.21 T
where:
  • r = rate of reaction in mol/(gcat·min)
  • CA = Concentration of component A = Cyclopentylacetic acid (C7H12O2)) in mol/L
  • CB = Concentration of component B = Methylcyclopentane (C6H12) in mol/L
  • CC = Concentration of component C = CO2 in mol/L
The kinetics of the reaction was introduced to the ASPEN Plus® model using the general Langmuir–Hinshelwood equations as given by Equations (6)–(10).
The general LHHW expression is as follows [26]:
r = ( kinetic   factor ) ( driving   force   expression ) ( adsorption   term )
where:
Kinetic factor:
k ( T T 0 ) n e E R ( 1 T 1 T 0 )   or   k e E R ( 1 T )
Driving force expression:
k 1 i = 1 N C i a i k 2 j = 1 N C j b i
Adsorption term:
( i = 1 M K i ( J = 1 N C j v i ) ) m

2.3. Validation of the Model

The simulation model was validated and compared with experimental data. The validation of the model was accomplished using root-mean-square error (RMSE), mean absolute error (MAE), and mean absolute percentage error (MAPE) according to the following equations [39,40,41,42,43]:
R msd = i = 1 n ( X i , exp X i , model ) 2 n
MAE = i = 1 n | X i , exp X i , model | n
MAPE = 1 n i = 1 n | X i , exp X i , model | X i , exp
where:
  • X i , exp = Experimental mole fraction of acid,
  • X i , model = Model mole fraction of acid,
  • n = number of samples, and data for t = 0 was not included in the calculation because it is the initial condition before treatment with an HZSM-5 catalyst.

2.4. Process Scale-Up

2.4.1. Challenges in Catalytic Decarboxylation Process Technology

The major challenges in catalytic decarboxylation process technology are discussed in this section. There are many challenges regarding the selection of the types of catalytic reactors proposed for the process. Fula crude oil is a heavy crude oil that poses various technological difficulties in pumping, pipeline transportation, and processing. This is the first challenge. It is a very viscous crude oil that impedes the mobility of the crude oil. Additionally, low-quality heavy feedstocks lead to quick catalyst deactivation due to a high coke formation rate. Coke is created during the reaction; it coats the catalyst and reduces its activity. The catalyst must be continuously replaced during the catalytic decarboxylation process, and this presents the second challenge. The third challenge is focused on the problem of heat transfer limitation in reactor scale-up. Since the decarboxylation reaction is endothermic and the catalytic decarboxylation process for naphthenic acid over an HZSM-5 zeolite catalyst is considered an isothermal process, there will always be a need for heat supply and efficient reactor temperature control to ensure that the desired reaction occurs at the desired rate.

2.4.2. Industrial Reactor Technologies Proposed for Catalytic Decarboxylation Process

For the industrial catalytic decarboxylation process for naphthenic acid over an HZSM-5 zeolite catalyst, many reactor technologies were proposed in oil refineries:

Semi-Regenerative Process

Generally, the commercial semi-regenerative process is carried out in three fixed-bed reactors in series with intermediate preheaters as shown in Figure 3. The following points are considered during the design of the process.
  • Due to the endothermic nature of most catalytic decarboxylation reactions a preheater is typically installed before each reactor to heat up the feed of each reactor to the required temperature.
  • The catalyst activity decreases gradually due to the formation of coke. The catalyst is renewed by burning off the coke deposit from the catalyst surface and requires shutdown approximately once every six months to two years for regeneration of the catalyst.
There are several variations of the regenerative process which differ in how they handle catalyst regeneration. Catalyst regeneration involves using oxygen to burn off the coke. The semi-regenerative process is the simplest configuration, but it requires that the unit be shut down for catalyst regeneration, during which all reactors are regenerated.
Technically when a fixed-bed reactor is used, low-quality heavy Fula crude oil will cause rapid coke production and quick catalyst deactivation. In most cases, the heat transfer rate into or out of the reactor is insufficient to even approach isothermal operation. Since the fluid velocities must be low enough to allow for the necessary contact time, this results in insufficient mixing to obtain uniform concentration and temperature profiles.
To overcome all of the above challenges, a semi-regenerative process is used. It is carried out in three fixed-bed reactors in series with intermediate preheaters to ensure an adequate supply of heat for the endothermic reaction. The reactor temperature is raised as catalyst activity drops to keep the reaction conversion relatively constant. To maximize the time between two regeneration intervals, the catalyst must be shut down once every six months to two years for in situ regeneration. The cyclic configuration employs an additional swing reactor, which allows one reactor to be taken offline for regeneration while the other four remain operational. The continuous catalyst regeneration mode is a moving bed mode that continuously regenerates the catalyst. It does not require unit shutdown for catalyst regeneration, implying less downtime and more production time. The main challenge of this process is the complexity of the mechanism for engaging and disengaging the product from the last reactor to the regenerator.

Fluidized-Bed Reactor

A fluidized-bed reactor is mainly composed of several sections, including a riser reactor, a stripper, a regenerator, a disengage, catalyst transport lines (spent catalyst standpipe and regenerated catalyst standpipe), and several other auxiliary units, such as cyclones, air blowers, expanders, wet gas compressors, feed pre-heaters, air heaters, catalyst coolers, and so on [44,45]. A typical fluidized-bed reactor unit is illustrated in Figure 4.
The feedstocks are preheated before being charged into the riser inlet, where they come into contact with hot regenerated catalysts. The fluidized-oil feed mixture travels up the riser into the reactor vessel, where the effluent is separated from the spent catalyst. As the feed reacts endothermically in the reactor section, a carbonaceous substance (i.e., coke) deposits on the catalyst, gradually deactivating it and reducing its activity. A coked catalyst is drawn from the reactor’s bottom by gravity and transported to the regenerator, where it is combusted off in a fluidized state by injecting heat and air. After being cleaned (regenerated), the catalyst is redirected back to the reactor section to complete the process loop [46].

2.4.3. Simulation of Industrial Scale Reactors

Fluidized-bed reactors could be modeled in ASPEN Plus® as a CSTR proposed by P. Rainho et al. [47], and AF Kashani et al. [48]. The RCSTR is one of the ASPEN Plus® reactor models; it requires the kinetics of the reaction and residence time, and it assumes perfect mixing and that concentration inside the reactor and the concentration of the product are the same. The residence time was specified as 4 hours as developed in the batch process.
The semi-regenerative process consisted of three fixed-bed reactors and three heaters; the fixed-bed reactor could be modeled in ASPEN Plus® as an ideal plug flow reactor (PFR) proposed by Z Suying et al. [49], H Er-rbib et al. [50], L Pirro et al. [51], and SZ Abbas et al. [52]. The plug flow reactor (Rplug) assumes no mixing of reactants as they pass through the reactor; the PFR creates a concentration gradient between the inlet and outlet. The phase of operation for the experimental model was vapor–liquid and therefore the valid phase of the PFR model in the Aspen was selected as vapor–liquid.
Scale-up of the catalytic decarboxylation process was performed in ASPEN Plus® V11 using the data of the actual flow rate from the Sudan Central Process Facility (CPF) of 11,000 bbl/day. In addition, the model assumes the same operating conditions of the batch process described in Section 2.2. Figure 5 shows the flowsheet of the scale-up model of the fluidized-bed plant in ASPEN Plus®. Figure 6 shows the flowsheet of the semi-regenerative process plant in ASPEN Plus®.

2.5. Process Economics

The process simulation results of the naphthenic acid removal unit were used to conduct an economical assessment of the process. The cost was evaluated for the flow rate of Fula crude oil of 11,000 bbl/day. The total cost of the unit is the sum of capital cost and operating cost. The total capital investment (TCI) of the plant is equal to the sum of the fixed capital cost and the working capital cost. For the fixed capital cost estimation, the detailed factorial method was used, which considers the contribution of the direct and indirect costs in the capital cost calculation. Capital cost estimates for chemical process plants are mainly based on an estimation of the purchase cost of the main equipment required for the process, with the other expenditures calculated as factors of the equipment cost like equipment erection, piping, electrical, instruments, process buildings and structures, ancillary buildings, raw material and finished product storage, utilities and site preparation. Each of these component’s contribution to total capital cost is computed by multiplying the total equipment cost by an applicable factor [53]. Catalytic decarboxylation was considered a fluid–solid process. Typically, the WCI is 15/85 of FCI [54].
In addition, the chemical engineering cost index (CE index) of 806.3 as of 2022 was applied to consider price fluctuations (inflation or deflation) as described in Equation (18) [55,56]:
C t = C 0   ×   ( I t I 0 )
where:
  • C estimated cost at present cost t, I index value at present time t
  • C0 estimated cost at present cost t0, I0 index value at present time t0
Moreover, the effect of capacity on cost was calculated by Equation 19 [56].
S m a l l   s c a l e   c o s t = L a r g e   s c a l e   c o s t   ×   ( S m a l l   s c a l e   c a p a c i t y   L a r g e   s c a l e   c a p a c i t y   ) 0.7
The operating costs can be divided into two categories: fixed operating costs and variable operating costs. The fixed operating costs are incurred to operate the plant regardless of plant throughput. Maintenance, operating labor, laboratory costs, supervision, plant overheads, capital charges, insurance, local taxes, and royalties are the key components of fixed operating costs. Variable operating costs are dependent upon throughput. They are as follows: raw material, utility, and miscellaneous material costs. Sales expenses, general overheads, and research and development costs are all contributed to the operational cost [53].
Operating cost estimation has been performed annually; the plant operates on steady-state continuous mode, and a month and a half shut down for maintenance corresponds to 320 days/year. The raw materials cost consists of the cost of the catalyst. The lifetime is assumed to be 4 years. The cost of the utilities consists of the cost of steam for heating. It was estimated through the energy balances of the process.

3. Results and Discussion

The main objective of the current study is to conduct the techno-economic assessment of the catalytic decarboxylation process over the HZSM-5 zeolite catalyst. The first part of this section discusses the development of a model for the batch process and validates the simulation results with the experimental data. The second part discusses the scale of the model to a continuous process and compares CSTR and plug flow reactor. The third part of this section was dedicated to the economic assessment of the baseline plant.

3.1. Process Simulation

The proposed ASPEN Plus® flowsheet for the batch process is shown in Figure 2, and a summary of stream results of simulated flow sheet using batch reactor is shown in the supplementary section (Table S1). The batch reactor mole fraction vs. time is shown in Figure 7. The simulation results were compared to experimental data from our previously published paper [32] to validate the process model. The accuracy of the simulation was quantified using three different statistical techniques: the RMSD (2 × 10), the MAE (1.6 × 10⁻³), and the MAPE (19.8%). The agreement between the ASPEN Plus® prediction and experimental data is satisfactory, but more experimental work is still required to confirm the model’s accuracy and make it more reliable, but the current results are suitable for scale-up. The details about plant description and the assumptions were discussed earlier in Section 2.2. The flow rate of the reactant (cyclopentyl acetic acid) decreases while the flow rates of products (methyl cyclopentane and CO2) increase and finally reach a constant value at a mole fraction of 0.029. The results show that the mole fraction of cyclopentyl acetic acid in the product stream is 0.0026. The other components’ flow rates remain constant throughout the process.
Scale-up of the catalytic decarboxylation process over the HZSM-5 zeolite catalyst was performed in ASPEN Plus® V11. Figure 5 shows the ASPEN Plus® flowsheet for a fluidized-bed reactor. Figure 6 shows the ASPEN Plus® flowsheet for a semi-regenerative process. The simulation generated the respective mass and energy balance sheets for economic assessment. The summary of the plug flow reactors simulation results along the reactor length at temperature 270 °C and pressure 0.8 bar and the flow rate in Kmol/hour of product streams’ component of semi-regenerative process and the fluidized bed reactor are shown in the supplementary section (Table S2). The data obtained from the ASPEN Plus® simulation makes it possible to derive the best mode of operation and calculate if this process would be economically viable in an industrial application.
The comparison between the two proposed processes (fluidized-bed reactor and semi-regenerative process) was made for the same residence time and conversion. The simulation results were listed in Table 5.
The summary of the three fixed-bed reactor simulation results along the reactor length was illustrated in the supplementary section. The moles’ flow rate of the streams of the three fixed-bed reactors in the semi-regenerative process and the fluidized-bed reactor were illustrated in the supplementary section (Table S3). The change of reactant and product flow rate with reactor length in the three fixed-bed reactors is shown in Figure 8.

3.2. Economic Assessment

The process equipment cost estimation, capital cost estimation, and operating cost estimations are estimated. First, the economic assessment was conducted for the fluidized-bed plant as scenario 1 [53]., and the results are shown in Table 6 and Table 7. The second scenario was the semi-regenerative process plant; its economic results are listed in Table 8. The total capital cost for the fluidized-bed and semi-regenerative process plants is $205,620,846 and $4,447,919, respectively.
The catalyst required is 140,400 kg/year for a fluidized-bed plant and 27,300 kg/year for a semi-regenerative process. The price of the catalyst is 15 $/kg [59]. As a result, the catalyst cost for a fluidized-bed and semi-regenerative process plant is 2,106,000 $/year and 409,500$ per year, respectively. The cost of the utilities consists primarily of the cost of electricity. It was estimated through the process’s ASPEN Plus® mass and energy balances. Considering the electricity price of $6 kWh/h [60], we can calculate that for a plant capacity of 11,000 bbl/day the utility cost is 34,476,000 $/year for a fluidized-bed plant and 344,761 $/year for a semi-regenerative process plant.
The operating labor cost is based on estimating a plant capacity of 11,000 bbl/day of Fula crude oil will require 60 employee-hours/day and a cost of 6.5$/employee-hour corresponding to 320 days/year [60]. As a result, the operating labor cost is 124,800 $/year. Table 9 summarizes the calculation of the annual operating cost for both scenarios. The annual operating cost for the fluidized-bed plant and semi-regenerative process plant is 45,269,180 $/year and 1,771,839 $/year, respectively.
Given the comprehensive analysis developed, the recommended scenario for industrial catalytic decarboxylation over an HZSM-5 catalyst is a semi-regenerative process plant, which is the most cost-effective option with the lowest CAPEX and OPEX.
To summarize, corrosion is a naturally occurring phenomenon that has a costly and negative impact on the oil and gas industry. Corrosion’s economic cost can be estimated directly from the application, operation, and maintenance of corrosion mitigation processes such as corrosion-resistant materials, protective coatings, corrosion inhibitors, anodic/cathodic protection, and corrosion inspection and monitoring tools or indirectly from lost productivity, environmental pollution, and any other cost that is not directly incurred within that industry [34,35].
The reliability of refinery equipment during the processing of high-acid crude oils is critical. Therefore, the need for permanent methods for mitigating naphthenic acid corrosion includes the destruction of the naphthenic acids [34,35]. This paper proposed a permanent method for removing these acids through a catalytic decarboxylation process, along with economic evaluation for commercial scale, in which the carboxyl group reacted to produce carbon dioxide. It is important to mention that this paper represents the first cost estimation for removing naphthenic acid using a catalytic decarboxylation process over HZSM-5 zeolite. To ensure the feasibility of the proposed technique, a comparison will be made with the cost of the naphthenic acid corrosion mitigation program in the Khartoum Refinery (Sudan) (KRC) and the cost of the proposed process. The challenges associated with processing Al-Fula crude oil in KRC are the increased potential for naphthenic acid corrosion, the expensive stainless-steel equipment to resist corrosion, the increased fouling in the downstream unit, and the effect on the quality of crude unit distillates. The KRC’s preventive measures are both design and operational in nature. Feeding the crude directly to the delay coking unit (DCU), implementing four-stage desalting to increase desalter efficiency, and using corrosion-resistant materials (316 L stainless steel) for DCU equipment (cladding on the fractionator, heat exchanger bundles, corresponding valves, and the furnace tube) are among the design measures. The operational measures are choosing and using a proper emulsion breaker, injecting the proper kind of anti-coking agent, and increasing the GDHT reactor’s protective catalyst layer [61].
According to Figure 9, the additional cost of corrosion by naphthenic acids during the processing of Al-Fula crude oil in the KRC refinery is $51,663,818, whereas the cost of catalytic decarboxylation is $22,204,209. The proposed procedure in this research saves $29,459,528.

4. Conclusions

A detailed techno-economic study has been performed for the catalytic decarboxylation process of naphthenic acids over an HZSM-5 zeolite catalyst. The techno-economic analysis, including process simulation using a commercial process simulator, ASPEN Plus®, and economic analysis in terms of calculation of capital cost and the annual operating cost, was conducted for a fluidized-bed plant and semi-regenerative process to identify major technical and economic challenges. A process model was developed based on previous work’s reaction kinetics [18]. The reactor was modeled using RPlug and RCSTR block utilizing LHHW kinetics, and material and energy balances throughout the plant were carried out.
The techno-economic assessment of the catalytic decarboxylation of naphthenic acids over the HZSM-5 zeolite catalyst was found to be economically viable given the details of the cases examined in this study. The comparison was made with the existing solution to this problem by using stainless-steel equipment to process the highly acidic AL-Fula crude oil. The stainless-steel equipment reduces naphthenic acid corrosion probabilities; however, the proposed process of this study catalytically provides an opportunity for the decarboxylation of naphthenic acids utilizing HZSM-5 zeolite, which results in a saving of $29,459,528 for a plant capacity of 11,000 bbl/day.

Supplementary Materials

The following supporting information can be downloaded at: https://www.mdpi.com/article/10.3390/pr11020507/s1, Table S1: Stream results of simulated flow sheet using batch reactor; Table S2: The summary of plug flow reactor simulation results along the reactor length at temperature 270 °C and pressure 0.8 bar; Table S3: The flow rate in (kmol/hour) of product streams component of semi-regenerative process and the fluidized-bed reactor.

Author Contributions

N.O.H. is the first author and she conducted the research work. Her contribution is on the methodology, software, validation, formal analysis, data curation, and writing—original draft preparation. G.I. supported N.O.H.’s efforts in conducting formal analysis, writing—review and editing; D.M.B. is a co-supervisor for N.O.H. and her contribution is supervision; N.O.E. is the supervisor for N.O.H.’s thesis, and N.O.E.’s contribution is on the conceptualization, resources, supervision, and writing—review and editing. All authors have read and agreed to the published version of the manuscript.

Funding

This research received no external funding.

Data Availability Statement

The data presented in this study are available on request from the corresponding author.

Acknowledgments

The authors are thankful to Texas A&M GFRC for technical support. Moreover, our gratitude goes to Azahri Dafalla KBC (Bahrain) for the productive discussion and suggestions to improve the quality and relevancy of this research work and to Mahmoud El-Halwagi at Texas A&M University for the general comments.

Conflicts of Interest

The authors declare no conflict of interest.

References

  1. Wu, C.; De Visscher, A.; Gates, I.D. On naphthenic acids removal from crude oil and oil sands process-affected water. Fuel 2019, 253, 1229–1246. [Google Scholar] [CrossRef]
  2. Zhang, A.; Ma, Q.; Wang, K.; Tang, Y.; Goddard, W.A. Improved Processes to Remove Naphthenic Acids; California Institute of Technology (CalTech): Pasadena, CA, USA, 2005. [Google Scholar]
  3. Mandal, P.C.; Sasaki, M.; Goto, M. Non-catalytic reduction of total acid number (TAN) of naphthenic acids (NAs) using supercritical methanol. Fuel Process. Technol. 2013, 106, 641–644. [Google Scholar] [CrossRef]
  4. Wang, Y.-z.; Li, J.-y.; Sun, X.-y.; Duan, H.-l.; Song, C.-m.; Zhang, M.-m.; Liu, Y.-p. Removal of naphthenic acids from crude oils by fixed-bed catalytic esterification. Fuel 2014, 116, 723–728. [Google Scholar] [CrossRef]
  5. Li, X.; Zhu, J.; Liu, Q.; Wu, B. The removal of naphthenic acids from dewaxed VGO via esterification catalyzed by Mg–Al hydrotalcite. Fuel Process. Technol. 2013, 111, 68–77. [Google Scholar] [CrossRef]
  6. Ding, L.; Rahimi, P.; Hawkins, R.; Bhatt, S.; Shi, Y. Naphthenic acid removal from heavy oils on alkaline earth-metal oxides and ZnO catalysts. Appl. Catal. A Gen. 2009, 371, 121–130. [Google Scholar] [CrossRef]
  7. Zhang, A.; Ma, Q.; Wang, K.; Liu, X.; Shuler, P.; Tang, Y. Naphthenic acid removal from crude oil through catalytic decarboxylation on magnesium oxide. Appl. Catal. A Gen. 2006, 303, 103–109. [Google Scholar] [CrossRef]
  8. Shah, S.N.; Lethesh, K.C.; Mutalib, M.A.; Pilus, R.B.M. Extraction and recovery of naphthenic acid from acidic oil using supported ionic liquid phases (SILPs). Chem. Prod. Process Model. 2015, 10, 221–228. [Google Scholar] [CrossRef]
  9. Najmuddin, R.A.; Mutalib, M.A.; Shah, S.N.; Suleman, H.; Lethesh, K.C.; Pilus, R.B.M.; Maulud, A.S. Liquid-liquid extraction of naphthenic acid using thiocyanate based ionic liquids. Procedia Eng. 2016, 148, 662–670. [Google Scholar] [CrossRef]
  10. Kumara, R.B.; Shindeb, S.; Gaikwadc, S.G. Reactive extraction of naphthenic acid by using sodium hydroxide as an extractant. Int. J. Adv. Eng. Technol. 2014, 103, 106. [Google Scholar]
  11. Wang, Y.; Chu, Z.; Qiu, B.; Liu, C.; Zhang, Y. Removal of naphthenic acids from a vacuum fraction oil with an ammonia solution of ethylene glycol. Fuel 2006, 85, 2489–2493. [Google Scholar] [CrossRef]
  12. Lu, R.; Xu, X.; Yang, J.; Gao, J. Reduction of total acid number of crude oil and distillate. Energy Sources Part A 2007, 29, 47–57. [Google Scholar] [CrossRef]
  13. Silva, J.P.; Costa, A.L.; Chiaro, S.S.; Delgado, B.E.; de Figueiredo, M.A.; Senna, L.F. Carboxylic acid removal from model petroleum fractions by a commercial clay adsorbent. Fuel Process. Technol. 2013, 112, 57–63. [Google Scholar] [CrossRef]
  14. Kluger, R.; Howe, G.W.; Mundle, S.O. Avoiding CO2 in catalysis of decarboxylation. Adv. Phys. Org. Chem. 2013, 47, 85–128. [Google Scholar]
  15. Brown, B. The mechanism of thermal decarboxylation. Q. Rev. Chem. Soc. 1951, 5, 131–146. [Google Scholar] [CrossRef]
  16. Chumaidi, A.; Dewajani, H.; Sulaiman, M.; Angestine, F.; Putri, A.; Pravitasari, S. Effect of temperature and Mg-Zn catalyst ratio on decarboxylation reaction to produce green diesel from kapok oil with saponification pretreatment using NaOH. IOP Conference Series: Materials Science and Engineering. In Proceedings of the 2nd Annual Technology Applied Science and Engineering Conference (ATASEC 2020), Malang, Indonesia, 5 August 2020; p. 012002. [Google Scholar]
  17. Natelson, R.H.; Wang, W.-C.; Roberts, W.L.; Zering, K.D. Technoeconomic analysis of jet fuel production from hydrolysis, decarboxylation, and reforming of camelina oil. Biomass Bioenergy 2015, 75, 23–34. [Google Scholar] [CrossRef]
  18. Hassan, N.O.; Challiwala, M.; Beshir, D.M.; Elbashir, N.O. Kinetics of Catalytic Decarboxylation of Naphthenic Acids over HZSM-5 Zeolite Catalyst. Catalysts 2022, 12, 495. [Google Scholar] [CrossRef]
  19. Foutch, G.L.; Johannes, A.H. Reactors in process engineering. Encycl. Phys. Sci. Technol. 2003, 1, 1–54. [Google Scholar] [CrossRef]
  20. Luyben, W.L. Chemical Reactor Design and Control; John Wiley & Sons: Hoboken, NJ, USA, 2007. [Google Scholar]
  21. Fogler, H.S.; Fogler, S.H. Elements of Chemical Reaction Engineering; Pearson Educacion: Boston, MA, USA, 1999. [Google Scholar]
  22. Jenck, J.F. Gas-liquid-solid reactors for hydrogenation in fine chemicals synthesis. In Studies in Surface Science and Catalysis; Elsevier: Amsterdam, The Netherlands, 1991; Volume 59, pp. 1–19. [Google Scholar]
  23. Tarhan, M.O. Catalytic Reactor Design; McGraw-Hill Companies: New York, NY, USA, 1983. [Google Scholar]
  24. Wijayarathne, U.; Wasalathilake, K. Aspen plus simulation of saponification of ethyl acetate in the presence of sodium hydroxide in a plug flow reactor. J. Chem. Eng. Process Technol. 2014, 5, 1. [Google Scholar]
  25. Schefflan, R. Teach Yourself the Basics of Aspen Plus; Wiley Online Library: Hoboken, NJ, USA, 2011. [Google Scholar]
  26. Al-Malah, K.I. Aspen Plus; Wiley Online Library: Hoboken, NJ, USA, 2016. [Google Scholar]
  27. Saidi, M.; Kadkhodayan, H. Experimental and simulation study of copper recovery process from copper oxide ore using aspen plus software: Optimization and sensitivity analysis of effective parameters. J. Environ. Chem. Eng. 2020, 8, 103772. [Google Scholar] [CrossRef]
  28. Qing, E.B.C.; Wen, J.K.C.K.; Liang, L.S.; Ying, L.Q.; Jie, L.Q.; Mubarak, N. Pilot study of synthesis of nanocrystalline cellulose using waste biomass via ASPEN plus simulation. Mater. Sci. Energy Technol. 2020, 3, 364–370. [Google Scholar]
  29. Liu, Y.; Yang, X.; Zhang, J.; Zhu, Z. Process Simulation of Preparing Biochar by Biomass Pyrolysis Via Aspen Plus and Its Economic Evaluation. Waste Biomass Valorization 2022, 13, 2609–2622. [Google Scholar] [CrossRef]
  30. Plazas-González, M.; Guerrero-Fajardo, C.A.; Sodré, J.R. Modelling and simulation of hydrotreating of palm oil components to obtain green diesel. J. Clean. Prod. 2018, 184, 301–308. [Google Scholar] [CrossRef]
  31. Cheah, K.W.; Yusup, S.; Singh, H.K.G.; Uemura, Y.; Lam, H.L. Process simulation and techno economic analysis of renewable diesel production via catalytic decarboxylation of rubber seed oil–A case study in Malaysia. J. Environ. Manag. 2017, 203, 950–961. [Google Scholar] [CrossRef] [PubMed]
  32. Braden, D.J.; Henao, C.A.; Heltzel, J.; Maravelias, C.C.; Dumesic, J.A. Production of liquid hydrocarbon fuels by catalytic conversion of biomass-derived levulinic acid. Green Chem. 2011, 13, 1755–1765. [Google Scholar] [CrossRef]
  33. Onwudili, J.A.; Edou, D.J.N. Process modelling and economic evaluation of biopropane production from aqueous butyric acid feedstock. Renew. Energy 2022, 184, 80–90. [Google Scholar] [CrossRef]
  34. Speight, J.G. High Acid Crudes; Gulf Professional Publishing: Houston, TX, USA, 2014. [Google Scholar]
  35. Heidersbach, R. Metallurgy and Corrosion Control in Oil and Gas Production; John Wiley & Sons: Hoboken, NJ, USA, 2018. [Google Scholar]
  36. Twu, C.H.; Coon, J.E.; Bluck, D. Comparison of the Peng−Robinson and Soave−Redlich−Kwong Equations of State Using a New Zero-Pressure-Based Mixing Rule for the Prediction of High-Pressure and High-Temperature Phase Equilibria. Ind. Eng. Chem. Res. 1998, 37, 1580–1585. [Google Scholar] [CrossRef]
  37. Qamar, R.A.; Mushtaq, A.; Ullah, A.; Ali, Z.U. Simulation and Capacity Evaluation of Refinery Flare System and Comparative Analysis of Carbon Capture Technologies. Iran. J. Chem. Chem. Eng. 2022, 41, 328–345. [Google Scholar]
  38. Khan, M.T.M.; Amjad, A.A.; Sheikh, F.U.; Khan, M.Y.; Ali, M.F.; Ellahi, M. Optimized Process Scheme Selection for Nitrogen Removal from Natural Gas and Present Accurate Equation of State Model. In Proceedings of the 3rd International Conference on Chemical Engineering (ICCE2021), Mehran University of Engineering and Technology, Jamshoro, Pakistan, 22–23 September 2021. [Google Scholar]
  39. Nikoo, M.B.; Mahinpey, N. Simulation of biomass gasification in fluidized bed reactor using ASPEN PLUS. Biomass Bioenergy 2008, 32, 1245–1254. [Google Scholar] [CrossRef]
  40. Zapata, R.B.; Agudelo, Y. Use of advanced simulation software Aspen Plus as teaching tool in chemical reaction engineering. Rev. Educ. Ing. 2015, 10, 57–68. [Google Scholar]
  41. De Myttenaere, A.; Golden, B.; Le Grand, B.; Rossi, F. Mean absolute percentage error for regression models. Neurocomputing 2016, 192, 38–48. [Google Scholar] [CrossRef]
  42. De Myttenaere, A.; Golden, B.; Le Grand, B.; Rossi, F. Using the mean absolute percentage error for regression models. In Proceedings of the ESANN 2015 Proceedings, European Symposium on Artificial Neural Networks, Computational Intelligence and Machine Learning, Bruges, Belgium, 22–24 April 2015; p. 113. [Google Scholar]
  43. Ahmad, N.; Ghadi, Y.; Adnan, M.; Ali, M. Load Forecasting Techniques for Power System: Research Challenges and Survey. IEEE Access 2022, 10, 71054–71090. [Google Scholar] [CrossRef]
  44. Fadhil, W.K. Modeling and Simulation of Fcc Risers; University of Technology: Baghdad, Iraq, 2012. [Google Scholar]
  45. Fernandes, J.; Pinheiro, C.; Oliveira, N.; Ribeiro, F.R. Modeling and simulation of an operating industrial fluidized catalytic cracking (FCC) riser. In Proceedings of the 2nd Mercosur Congress on chemical Engineering, Coasta Verde, Brazil, 14–18 August 2005; pp. 1–4. [Google Scholar]
  46. Oloruntoba, A.; Zhang, Y.; Hsu, C.S. State-of-the-Art Review of Fluid Catalytic Cracking (FCC) Catalyst Regeneration Intensification Technologies. Energies 2022, 15, 2061. [Google Scholar] [CrossRef]
  47. Rainhoa, P.; Alizadehb, A.; Ribeiroc, M.; Mckennab, T.F. Pseudo-homogeneous CSTR Simulation of a Fluidized Bed Reactor operating in condensed-mode including Sanchez-Lacombe n-hexane co-solubility effect predictions. J. Eng. Rookies 2014, 1, 58–68. [Google Scholar]
  48. Kashani, A.F.; Abedini, H.; Kalaie, M.R. Steady State Simulation of Two-Gas Phase Fluidized Bed Reactors in Series for Producing Linear Low Density Polyethylene. Sci. Technol. 2011, 24, 301–316. [Google Scholar]
  49. Suying, Z.; Huang, J.; Liang’en, W.; Huang, G. Coupled reaction/distillation process for hydrolysis of methyl acetate. Chin. J. Chem. Eng. 2010, 18, 755–760. [Google Scholar]
  50. Er-rbib, H.; Bouallou, C. Modelling and simulation of methanation catalytic reactor for renewable electricity storage. Chem. Eng. Trans. 2013, 35, 541–546. [Google Scholar]
  51. Pirro, L.; Obradović, A.; Vandegehuchte, B.D.; Marin, G.B.; Thybaut, J.W. Model-based catalyst selection for the oxidative coupling of methane in an adiabatic fixed-bed reactor. Ind. Eng. Chem. Res. 2018, 57, 16295–16307. [Google Scholar] [CrossRef]
  52. Abbas, S.; Dupont, V.; Mahmud, T. Kinetics study and modelling of steam methane reforming process over a NiO/Al2O3 catalyst in an adiabatic packed bed reactor. Int. J. Hydrog. Energy 2016, 42, 2889–2903. [Google Scholar] [CrossRef]
  53. Sinnott, R. Chemical Engineering Design; Elsevier: Amsterdam, The Netherlands, 2014; Volume 6. [Google Scholar]
  54. Sinnott, R. Chemical Engineering Design: Chemical Engineering Volume 6; Elsevier: Amsterdam, The Netherlands, 2005. [Google Scholar]
  55. Kim, S.; Yun, S.-W.; Lee, B.; Heo, J.; Kim, K.; Kim, Y.-T.; Lim, H. Steam reforming of methanol for ultra-pure H2 production in a membrane reactor: Techno-economic analysis. Int. J. Hydrog. Energy 2019, 44, 2330–2339. [Google Scholar] [CrossRef]
  56. Khan, M.N.; Shamim, T. Techno-economic assessment of a plant based on a three reactor chemical looping reforming system. Int. J. Hydrog. Energy 2016, 41, 22677–22688. [Google Scholar] [CrossRef]
  57. Feedstock, E.W. Equipment Design and Cost Estimation for Small Modular Biomass Systems, Synthesis Gas Cleanup, and Oxygen Separation Equipment; National Renewable Energy Laboratory: Golden, CO, USA, 2006. [Google Scholar]
  58. Trippany, O.P.; L’Antigua, A.; Flannagin, M.; Carver, C. Naphtha Toppings Refinery Retrofit in Kirkut, Iraq: AICHE 2021 Design Project. Honors Capstone Projects and Theses, The University of Alabama in Huntsville, Huntsville, Alabama, 2021. [Google Scholar]
  59. ALIBABA. Hzsm5 Zeolite Price. Available online: https://www.alibaba.com/trade/search?fsb=y&IndexArea=product_en&CatId=&tab=all&SearchText=hzsm5+zeolite&isPremium=y&secondFlag=true (accessed on 2 January 2023).
  60. Peters, M.S.; Timmerhaus, K.D. Plant Design and Economics for Chemical Engineers; McGraw-Hill International: Singapore, 2018. [Google Scholar]
  61. Khalil, M.O. Processing of High Tan Crude Oil in Khartoum Refinery. In Proceedings of the 17th Africa OILGASMINE, Khartoum, Sudan, 23–26 November 2015; A Unique Experience. Available online: https://unctad.org/system/files/non-official-document/17OILGASMINE%20Mohamed%20Osman%20Khalil%20S8.pdf (accessed on 4 January 2023).
Figure 1. The sequential step for analyzing a potential commercial-scale process for catalytic decarboxylation of naphthenic acid over the HZSM-5 process.
Processes 11 00507 g001
Figure 2. ASPEN Plus® Flow sheet of a batch reactor process for the catalytic decarboxylation of naphthenic acid over HZSM-5 Process using batch reactor.
Processes 11 00507 g002
Figure 3. The flowsheet of semi-regenerative process of catalytic decarboxylation.
Processes 11 00507 g003
Figure 4. Fluidized-bed reactor unit.
Processes 11 00507 g004
Figure 5. The flowsheet of fluidized-bed plant in ASPEN Plus®.
Processes 11 00507 g005
Figure 6. The flowsheet of semi-regenerative process plant in ASPEN Plus®.
Processes 11 00507 g006
Figure 7. The batch reactor mole fraction vs time.
Processes 11 00507 g007
Figure 8. Change of reactants and products flow rate with reactor length.
Processes 11 00507 g008
Figure 9. Comparison between KRC current corrosion solutions and catalytic decarboxylation process cost.
Processes 11 00507 g009
Table 1. The properties of Al-Fula crude oil.
PropertiesResult
Density @ 15 °C, kg/m3927.5
Specific gravity0.9283
API°20.93
Viscosity @ 100 °C, mm2/s38.07
Pour point, °C−1
Carbon residue, m%4.41
Water content, m%0.50
Salt content as NaCl mg/L3.6
Acid number, mg KOH/g6.5
Sulfur, m%0.127
Table 2. Published literature on catalytic decarboxylation of simulation of acids.
Oil FeedstockCatalystSimulation ToolReactor TypeReference
Palm oilNiMo/γAl2O3ASPEN Plus®Equilibrium reactor[30]
Rubber seed oilMetal catalystASPEN Hysys®Packed bed reactor[31]
Camelina oil-ASPEN Plus®-[17]
Levulinic acidRuRe/C catalystASPEN Plus®Packed bed reactor[32]
Butyric acid-ASPEN Hysys®-[33]
Table 3. TBP (liquid volume basis) and API gravity curve of Al-Fula crude oil.
Percent DistilledTemperature (°C)API Gravity
2.19053
2.497038
9.7124029
11.9437023
73.850018
Table 4. Catalyst properties.
PropertyValues
Bulk density0.77 g/cm3
Si/AL ratio70
Surface area300m2/g
Pore volume0.18 cm3/g
Pore size25 Å
Table 5. The simulation results of semi-regenerative process and fluidized-bed reactor.
Semi-Regenerative ProcessFluidized-Bed ReactorUnits
Fixed-Bed Reactor 1Fixed-Bed Reactor 2Fixed-Bed Reactor 3
Residence time2114h
Height888-m
Diameter101010-m
Volume6286286282392m3
Weight of catalyst0.52118kg/h
Table 6. Fluidized-bed reactor unit equipment list.
DescriptionNumberCost ($)
Reactors
Reactor vessel14,795,925
Stripper (part of reactor)1included with reactor
Regenerator vessel1included with reactor
Combustor (part of regenerator)1included with reactor
Total 4,795,925
Cyclones
Reactor cyclones4438,362
Regenerator cyclones101,196,611
Total 1,634,973
Columns, Vessels, and Tanks
Riser1included with reactor
Fresh catalyst storage drum1103,074
Spent catalyst storage drum1103,074
Total 206,148
Compressors and Blowers
Combustion air compressor13,893,828
Reactor vent silencer120,140
Total fluidized-bed reactor unit 10,551,016
Table 7. Scenario 1 fluidized-bed plant total capital cost.
NameInstalled Cost [$]
Fluidized-bed reactor10,551,016 [57]
Fire heater113,923 [58]
Vacuum pump12,911 [58]
Total purchased cost10,677,850
Fixed capital cost37,671,458
Working capital cost6,647,904
Total capital cost44,319,362
Table 8. Scenario 2 semi-regenerative process total capital cost.
NameNumberInstalled Cost [$]
Fixed-bed reactor 3238,985 [58]
Fire heater3113,923 [58]
Vacuum pump 12,911 [58]
Total purchased cost 1,071,636
Fixed capital cost 3,780,731
Working capital cost 667,187
Total capital cost 4,447,919
Table 9. Annual operating cost.
Fluidized-Bed PlantSemi-Regenerative Process
1Raw material cost2,106,000 409,500
2Utility cost34,476,000 344,761
3Miscellaneous material188,357 18,903
Variable cost36,770,357773,164
4 Maintenance 1,883,572 189,036
5 Operating labor 124,800 124,800
6 Laboratory cost 24,960 24,960
7 Supervision 24,960 24,960
8 Plant overheads 62,400 62,400
9 Capital charges 3,767,145 378,073
10 Insurance 376,714 37,807
11 Local taxes 753,429 75,614
12 Royalties 376,714 37,807
Fixed cost7,394,697955,459
13Sales expenses, general overheads, and research and development1,104,12643,215
Annual operating cost45,269,1801,771,839
Disclaimer/Publisher’s Note: The statements, opinions and data contained in all publications are solely those of the individual author(s) and contributor(s) and not of MDPI and/or the editor(s). MDPI and/or the editor(s) disclaim responsibility for any injury to people or property resulting from any ideas, methods, instructions or products referred to in the content.

