1. Introduction
Accident and emergency care services are provided at various severity levels in emergency departments (EDs). These departments are complicated systems because of unpredictability, and there is no default structure to boost productivity. Overcrowding and workloads can lead to long waiting times, postponed acute treatments, and lengthened hospital stays. Recently, some researchers and practitioners added more effective methods to the Six Sigma methodology to improve its effectiveness. Combining Lean’s continuous improvement with creative techniques increases the execution of improvement initiatives in complex environments such as the healthcare sector.
Overcrowding in emergency departments (EDs) is a serious problem in lots of nations [
1]. The effect of crowding at the pediatric emergency department (ED) is without a doubt visible, as most of the pediatric research has proven, expanding sepsis antibiotic treatment time. The crowding effect additionally tends to delay fracture remedy, similar to bronchial allergy treatment [
2,
3].
During times of overcrowding, ED practitioners may try to avoid hospital admission due to a lack of inpatient bed availability [
4], therefore ED crowding affects the emergency patients’ healthcare outcomes [
5]. Patients who are not admitted to hospital after attending an emergency department because of crowding are at risk for adverse events, that are adjusted for important characteristics of patients, shift, and hospital [
6]. Crowding was associated with an increased hazard for hospitals for pediatric patients in mixed emergency departments [
7]. Studies showed how the increase in patient mortality is associated with emergency department overcrowding [
8].
The Princess Rahma Pediatric Hospital (PRPH) in Irbid is a pediatric referral hospital for Jordan’s four northern governorates (Irbid, Ajloun, Jerash, and Mafraq), serving nearly 25% of the country’s population [
9]. The hospital’s current capacity is around 120 beds, with only eight critical care and 31 incubator unit beds, which is insufficient to fulfill the rapidly rising refugee and Jordanian population’s needs. The inflow of refugees and the Coronavirus disease (COVID-19) pandemic placed substantial pressure on PRPH operations, resulting in a regular full occupancy rate, in terms of physician assessment and laboratory processing. This pressure is immediately identified by the fact that many patients are usually waiting for certain services, such as physical assessments and laboratory testing, which implies that they will have to wait a long time and that the system will be inefficient. These concerns could jeopardize the health and safety of patients requiring rapid assistance, particularly in the emergency room of the ED. The sole reason for this research is to illustrate how the DMAIC-DES integrated methodology can improve the performance of the process and thus productivity at the Pediatric Hospital Emergency Department. In fact, this research responds to the following questions: first, what is the impact of using the Six-Sigma DMAIC approach on the waiting time and overall efficiency of the system? Second, how does the number of resources correlate to waiting time, system capacity, and process output. Third, what are the optimal recommended numbers of resources at each process stage?
In this study, an integrated approach combining the discrete event simulation (DES) and Six-Sigma DMAIC methodology was used to reduce patient waiting times, alleviate overcrowding, and improve the overall system efficiency of PRPH’s emergency department, which leads to the rapid service diagnosis of the patient.
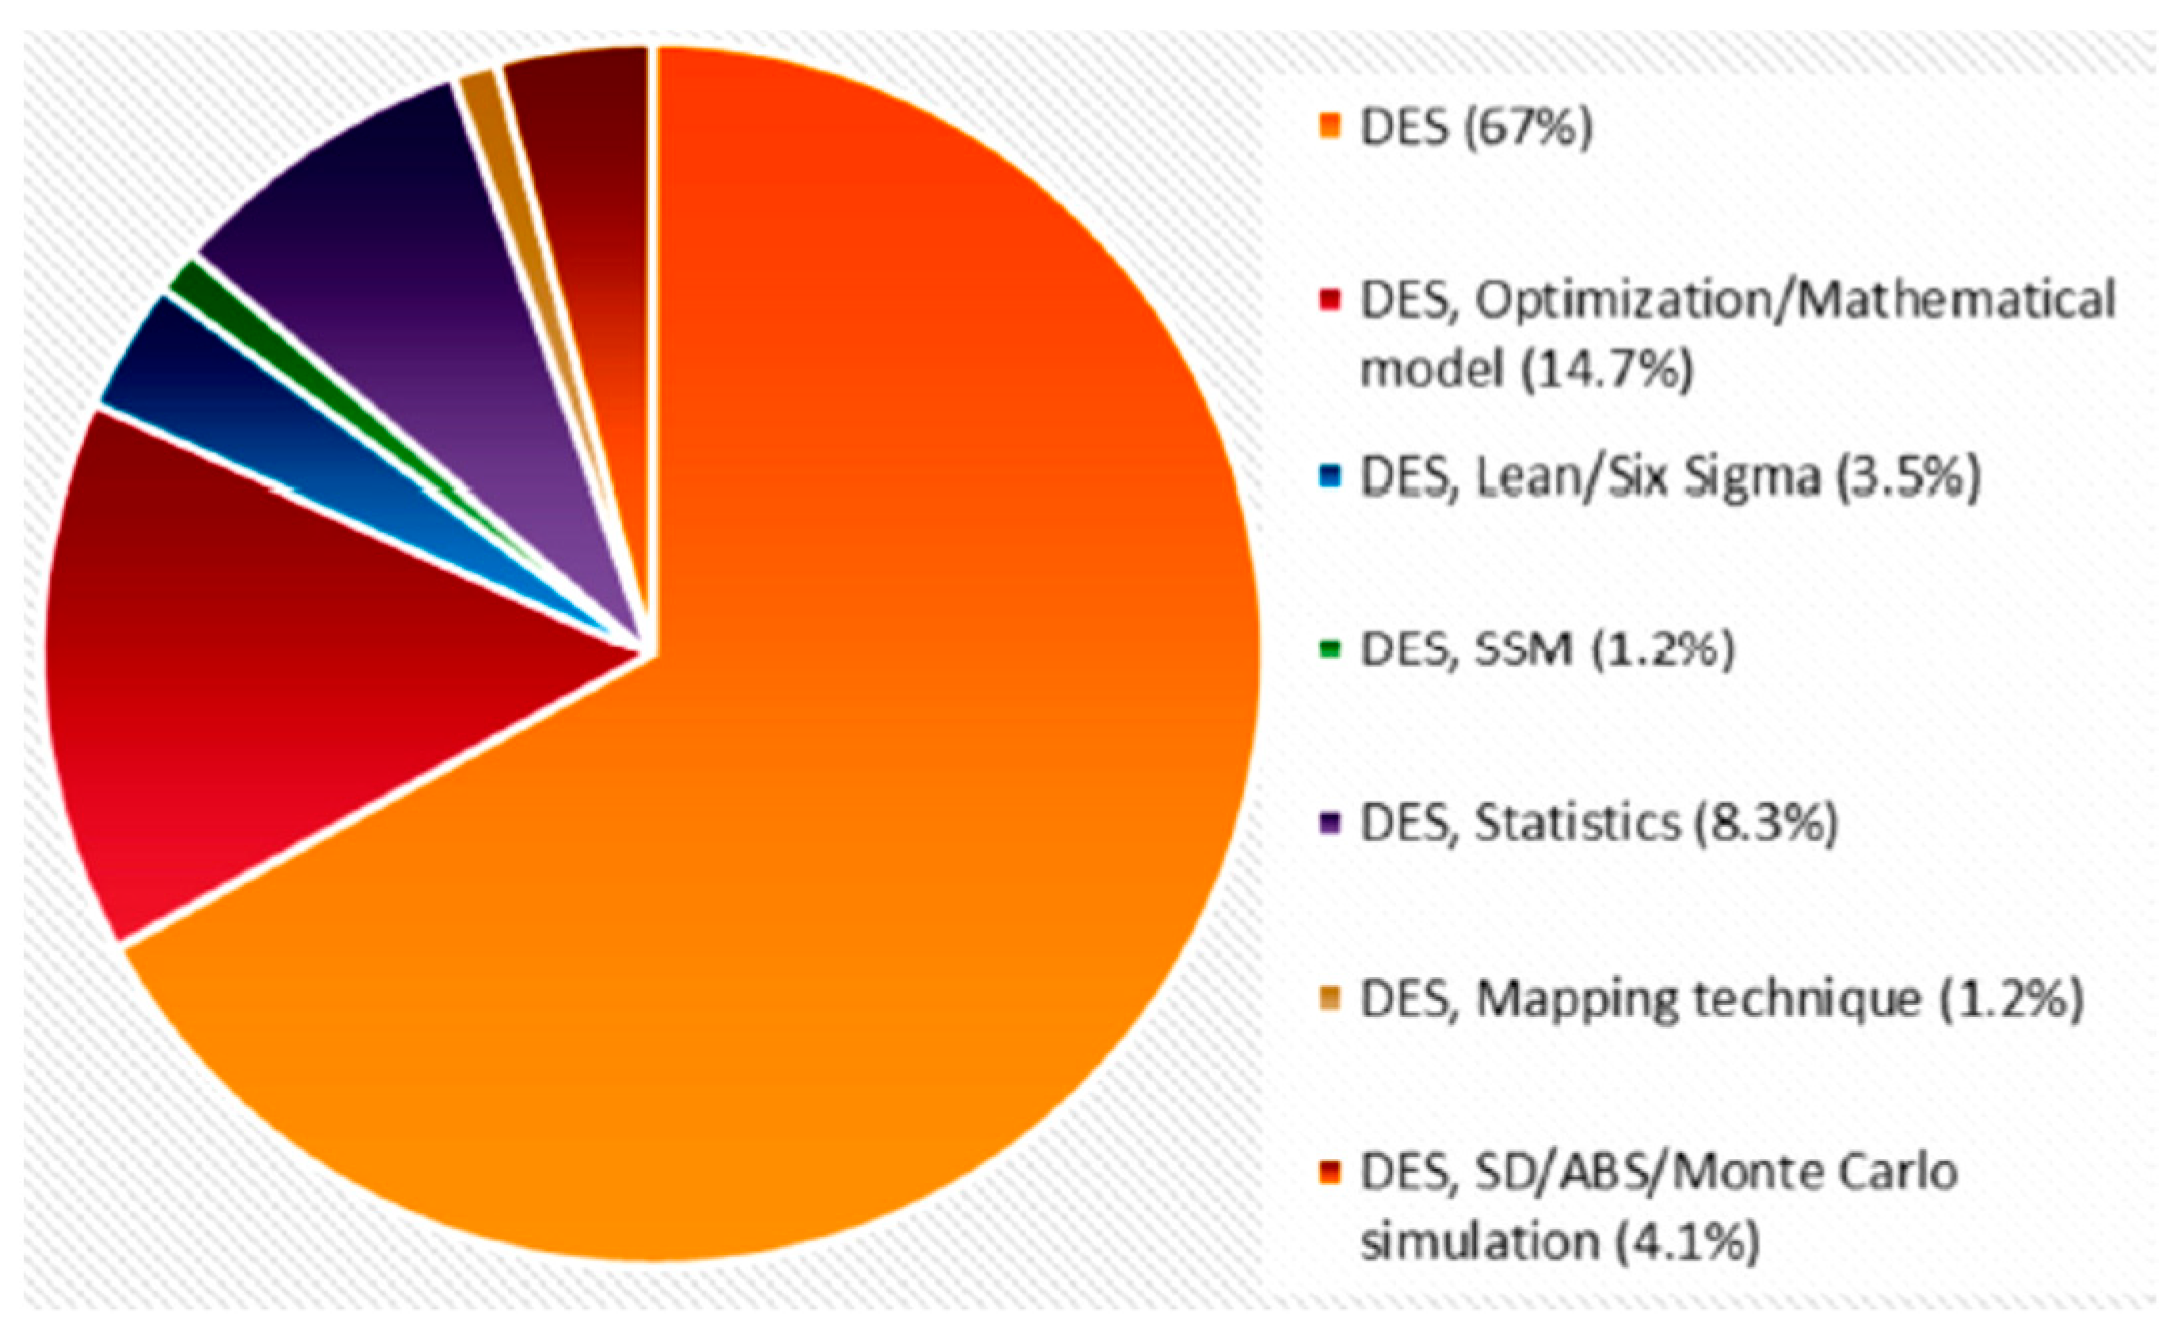
Many researchers have used simulation modeling, particularly DES, to reduce the waiting time in hospitals. DES applications are sometimes paired with operations research, optimization models, Lean Six Sigma, a soft systems methodology, statistics and probability theory, mapping strategies, system dynamics, agent-based simulations, or Monte Carlo simulations [
10];
Figure 1 shows the percentages of the approaches followed to address healthcare systems.
The following is a summary of the most important studies conducted on the use of DES and the Six-Sigma DMAIC approach in improving emergency departments’ performance.
1.1. Discrete-Event Simulation
Srinivas et al. [
11] suggested a simulation model to improve emergency department performance in hospitals in the United States that are experiencing issues, such as a shortage of doctors and beds to reduce patient waiting times. The results showed a 20% reduction in waiting time and a 20% increase in ED resource efficiency. Wang et al. [
12] suggested a simulation model for the emergency department of the Lexington Hospital in the United States. The project is based on constructing a simulation model to evaluate patient flow in the emergency department, reduce patient stay duration, and detect essential processes to improve ED performance. Bedoya-Valencia and Kirac [
13] developed a new technique to increase the performance and efficiency of emergency departments in hospitals in the United States by reducing patient flow traffic. The experiment was centered on supplying the appropriate number of nurses, doctors, and doctor assistants, as well as leveling utilization among them to shorten their stay.
Baril et al. [
14] conducted a study on patient discontent in the emergency departments of Quebec hospitals in Canada, they investigated the factors that contributed to patient delays, which resulted in an increase in the patient’s length of stay in the emergency department. They developed a model based on the length of stay of ambulatory patients using discrete-event simulation and then used the design of experiments (DOE) to examine the data. Komashie and Mousavi [
15] investigated the use of discrete event simulation to simulate the processes and operations of emergency departments in London hospitals. They designed the model so that it would be easy for managers to grasp and identify the factors that contribute to patient service delays. Arena software was used by Duguay and Chetouane [
16] to simulate the emergency department of Dr. Georges L. Dumont Hospital in Moncton, New Brunswick, Canada. The goal was to reduce patient waiting time while simultaneously improving the quality of services offered and the efficiency of the system.
Aliyu et al. [
17] presented an Arena simulation model that provides a better appointment system and schedule for patients, reducing patient waiting time while increasing doctor use, their approach was implemented in the outpatient clinic of a Doha Hospital. Uriate et al. [
18] presented a novel approach for healthcare in a Swedish emergency department, their methodology was used to conduct a system improvement analysis. They provided decision-makers with a set of almost optimal solutions and design criteria that considerably decreased the emergency department length of stay (LOS) and waiting times. The application of telemedicine to disaster response was presented by Wei Xiong et al. [
19], who also evaluated a regional telemedicine hub that could create a distributed surge capacity by connecting existing healthcare and telecom infrastructures to external expertise via regional telemedicine networks. Vile et al. [
20] offered a strategy for the emergency department (ED) at a major UK hospital that was unable to reach the core ED performance target to admit or discharge 95 percent of patients within four hours of arrival by creating a DES model. De Boeck et al. [
21] examined prioritizing tests and boarding patients in a hospital emergency department; three static control policies were compared: one for boarding patients (first come, first served), one for non-boarding patients (always prioritizing non-boarding patients over boarding patients), and one for dynamic measures (threshold values and priority accumulation). The DES models by Rachuba et al. [
22] can be used to predict the number of hospital admissions if emergency departments use high-sensitivity troponin in serial and single testing procedures. They utilized acute trust data from Southwest England to calculate the benefits. Zeinali et al. [
23] created a DES model that was integrated with appropriate meta modes and applied to an ED in Iran to reduce the total average patient waiting time under budget and capacity restrictions. The proposed strategy resulted in a 48 percent reduction in total patient waiting time. Lim et al. [
24] developed a new technique in which physicians and their delegates in the ED are depicted as interacting pseudo-agents. This technique was tested in an Ontario hospital emergency department and compared with standard tactics that ignored such interactions.
Feng et al. [
25] solved a multi-objective medical resource allocation problem by integrating a non-dominated sorting genetic algorithm II (NSGA II) and multi-objective computing budget allocation (MOCBA) for a DES model of ED flow inspired by the Taiwan Hospital example. Choon et al. [
26] built and used a DES model for ED flow at Singapore General Hospital to assess the effect of various operational strategies on two performance indicators, namely time to first consultation (TFC) and turnaround time (TT). Gül and Guneri [
27] conducted a case study using the DES model of an ED unit at a provincial university hospital in Turkey. They demonstrated that simple modifications in shift hours and resource allocation can result in significant improvements in LOS and throughput. Peng et al. [
28] developed a DES model of the emergency department to simulate and predict the effect of a physician in triage intervention on the waiting time and length of stay of ED patients for the current COVID-19 pandemic, in emergency care in Canada. Jat and Rafique [
29] used DES to examine several mass causality incident response regimes in hospitals in Lahore, Pakistan and found that they were effective. DES techniques were integrated with a DOE method in the study conducted by Atlan and Donmez [
30]. The results were used to generate results that could not be obtained through the mathematical modeling of healthcare problems. Valipoor et al. [
31] used historical ED data and expert estimations to develop a discrete-event simulation model to test their hypotheses. They investigated the potential consequences of initiating care and boarding patients in the hallway care rather than in the exam rooms, as well as the addition of a dedicated triage space for patients who arrive by emergency medical services (EMS triage) to reduce hallway congestion and wait times.
1.2. Six-Sigma DMAIC and DES Methodology Implementations
Many authors have used the Six-Sigma DMAIC methodology to improve ED performance. Habidin et al. [
32] explored Lean Six Sigma tools and strategies for resolving problems and obstacles in Malaysian emergency units. Aiming to reduce overcrowding in EDs, Hossain et al. [
33] used the Six Sigma DMAIC methodology and discrete event simulation (DES) to guide improvement decisions, focusing on medical equipment utilization and the impact of changing medical equipment technology on patients’ wait times and their satisfaction with the service provided. Hossain et al. examined the advantages of implementing quality improvement approaches in Egypt’s healthcare system, which differs greatly from those of other industrialized nations. Owad et al. [
34] provided an integrated lean methodology for improving patient flow in emergency departments by identifying the underlying causes of patient flow problems and providing a lean patient flow strategy. The methodology combines the ‘voice of the process,’ the ‘voice of the customer,’ and the ‘voice of the staff’ to identify non-value-added tasks inside the ED process. This integration enabled the hospital’s emergency department to model, assess, and enhance work and process flow. Bal et al. [
35] increase the efficiency of emergency departments (EDs) by reducing overcrowding and patient waiting times. An innovative hybrid methodology consisting of a combination of lean techniques and discrete event simulation models was used to obtain the results; with the assistance of emergency department staff, value stream mapping (VSM) was implemented as a lean technique.
Furterer [
36] used the Lean Six Sigma DMAIC technique to improve throughput, as evidenced by a 30% reduction in patient duration of stay over three months and a reduction in patients departing without treatment from 6.5 to 0.3 percent. Additionally, patient satisfaction increased by 24 percent to 89.9 percent, allowing the emergency department to reach a national maximum of 1% of hospitals. A simulation technique is used to lower the likelihood that it will not meet the system’s specifications, to improve system performance, to avoid under- or overusing resources, and to get rid of unforeseen bottlenecks [
37]. The Six Sigma DMAIC technique employs both qualitative and quantitative methods to build knowledge of the processes. These include process mapping, control charts, failure mode analysis, and statistical process control (SPC) [
38]. Due to the stochastic nature of the ED process, combining Six Sigma DMAIC—the simulation technique offers a dynamic platform to capture its dynamic and complex aspects and forecast the effects of prospective improvement [
39]. As for the limitations of using the proposed methodology, DMAIC seems to be inappropriate for ill-structured problems where human dynamics, subjective perceptions, and individual values play a significant role [
40]. Moreover, it is claimed that DMAIC is particularly inappropriate for situations with tight task content [
41].
The most recent articles in Lean tools, whose primary focus was on developing countries and the healthcare systems there, are included in
Table 1, as follows.
This study promotes the dissemination of the concept of flexible management and the culture of continuous improvement. This paper has adopted an appropriate analytical approach that contributed to reaching proposed solutions to some of the challenges facing work. This research is designed based on a case study research strategy, not a surveys strategy. Researchers and quality practitioners acknowledge the importance of the Six Sigma philosophy, as well as the DMAIC steps in enhancing the quality of healthcare services. Discrete-event simulation models are frequently employed to raise the standards on patient care delivery’s primary performance indicators. Even though research into the combination of simulations and Six Sigma is expanding, there is still little empirical proof of its efficiency. As a result, this study added a modified research direction by fusing methodologies to carry out quality improvement projects. In fact, adding DES to the Six Sigma toolkit of quality improvement techniques may suggest a novel strategy improvement procedure within the health care services.
The structure of this paper is as follows.
Section 1 presents the introduction and associated background information.
Section 2 provides illustrations of the proposed approach design and simulation model. The analysis and discussion of the simulation results for the current and modified models take up most of
Section 3. In
Section 4, conclusions and future work are addressed.
2. Materials and Methods
This section outlines the study methodology, including the six-sigma DMAIC processes used to reduce wait times at PRPH’s emergency department.
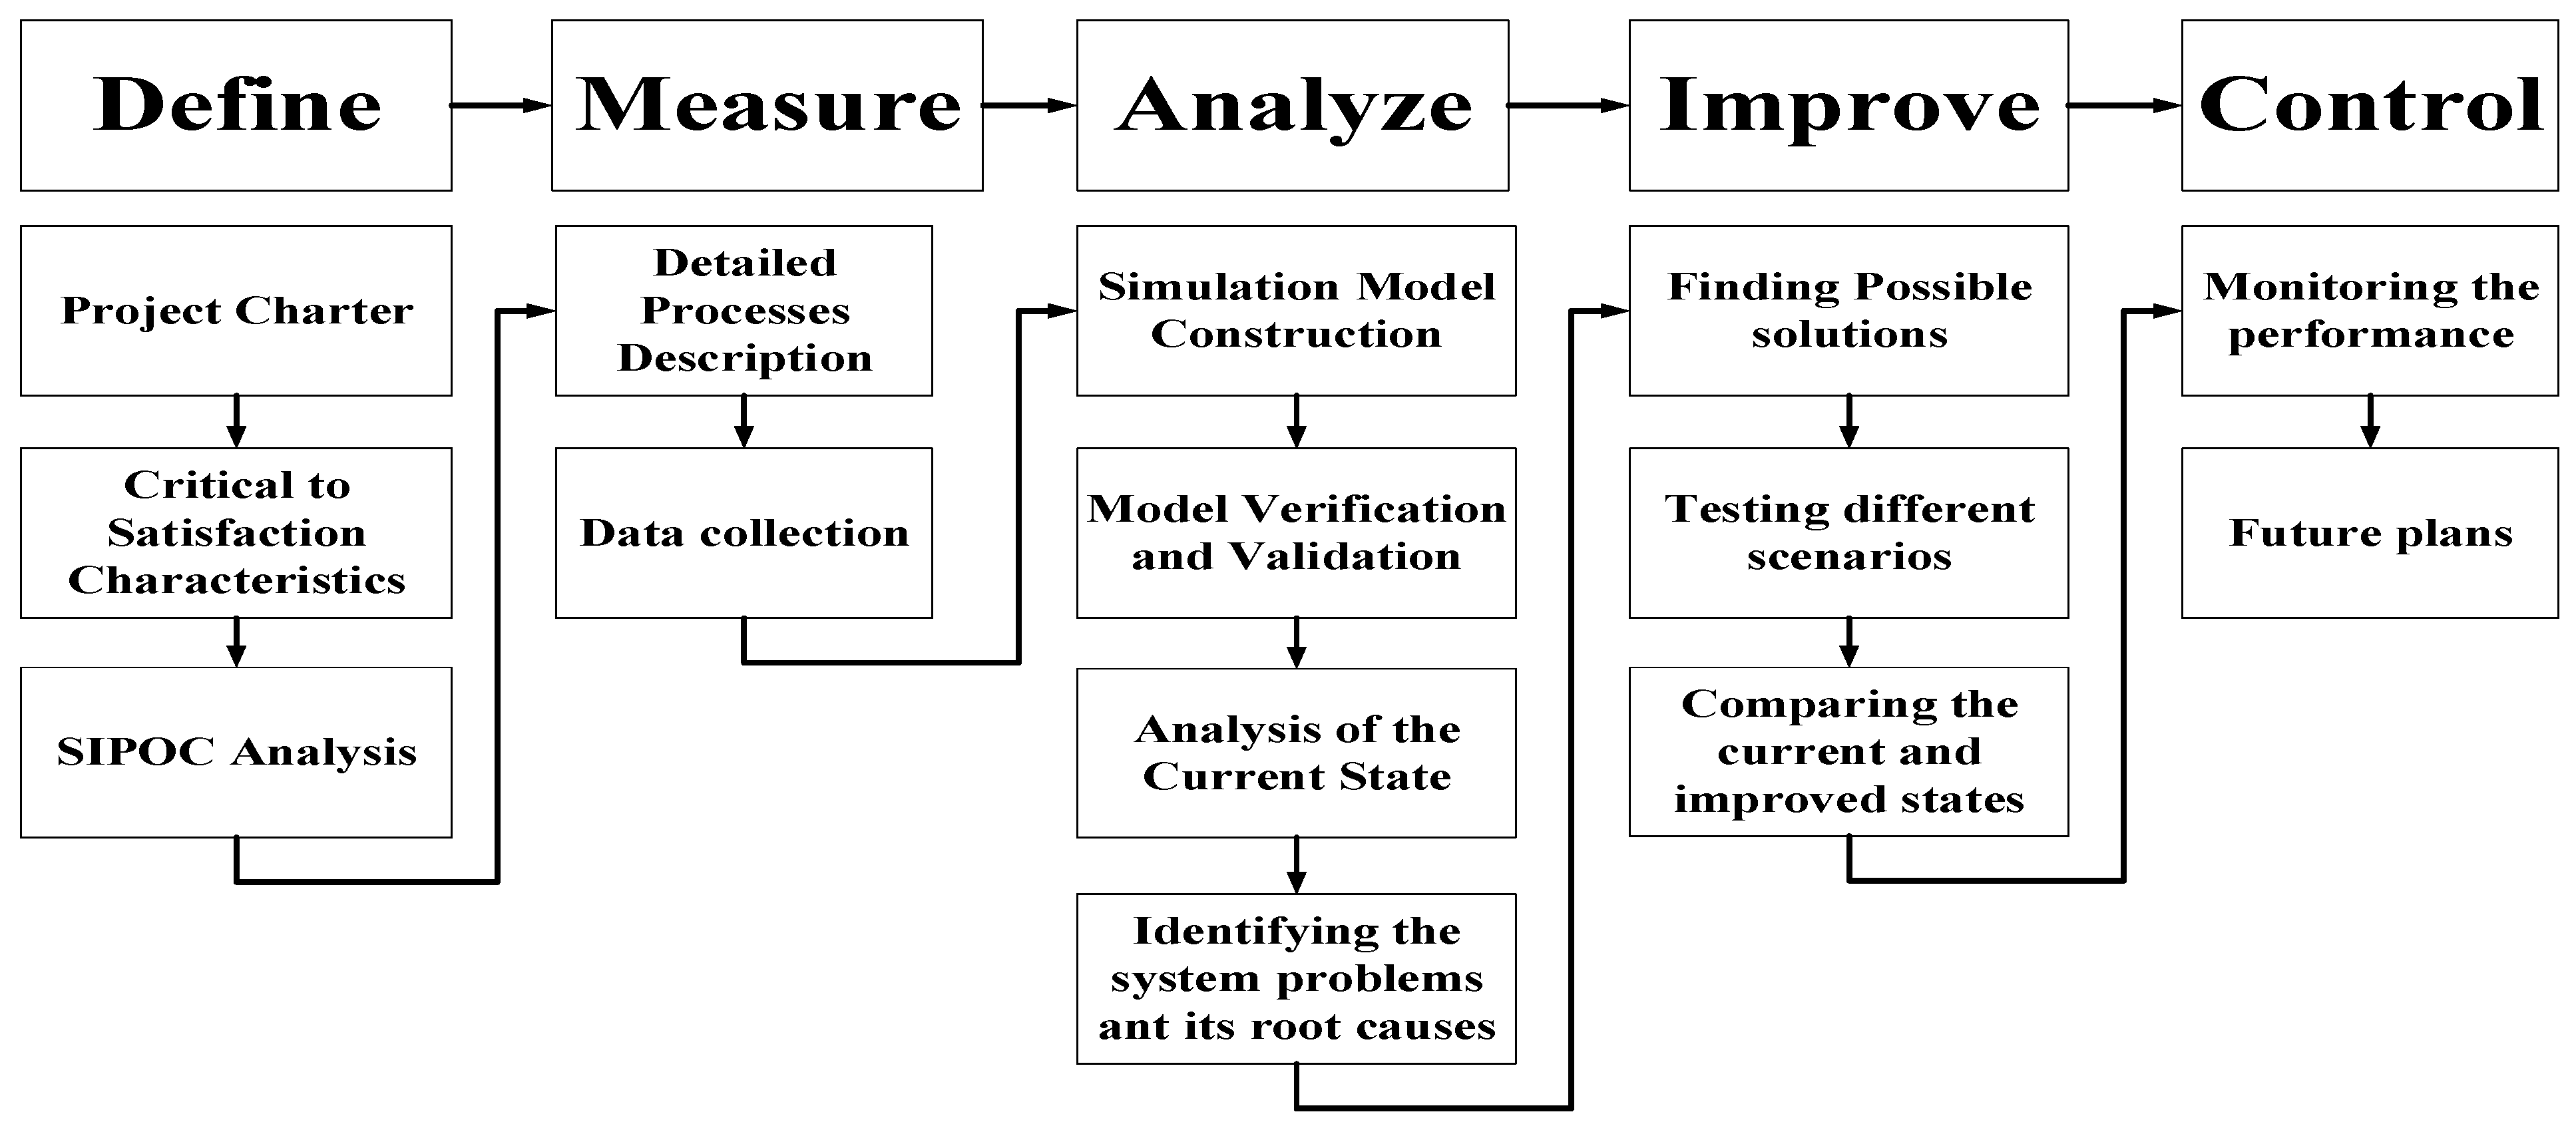
The integrated approach between the simulation and the DMAIC technique employed in this study is depicted in
Figure 2.
2.1. DMAIC Methodology
This section explains how the DMAIC technique was applied to the ED of the PRPH case study in five stages. This section will go over the first two stages of the DMAIC technique in depth.
2.1.1. Define Phase
The “Define” phase is when you define the ED’s problems, the improvement project’s objectives, the scope of the project, and the critical to satisfaction characteristics. At the “Define” phase, the project charter, critical to satisfaction characteristics, and SIPOC (supplier, input, process, output, and customers) analysis were all completed.
Table 2 presents the project charter, which comprises a project overview, problem definition, objectives, and scope. The characteristics crucial to satisfaction are listed in
Table 3 along with their definitions. Key process indicators (KPI’s) were selected based on the reviewed literature.
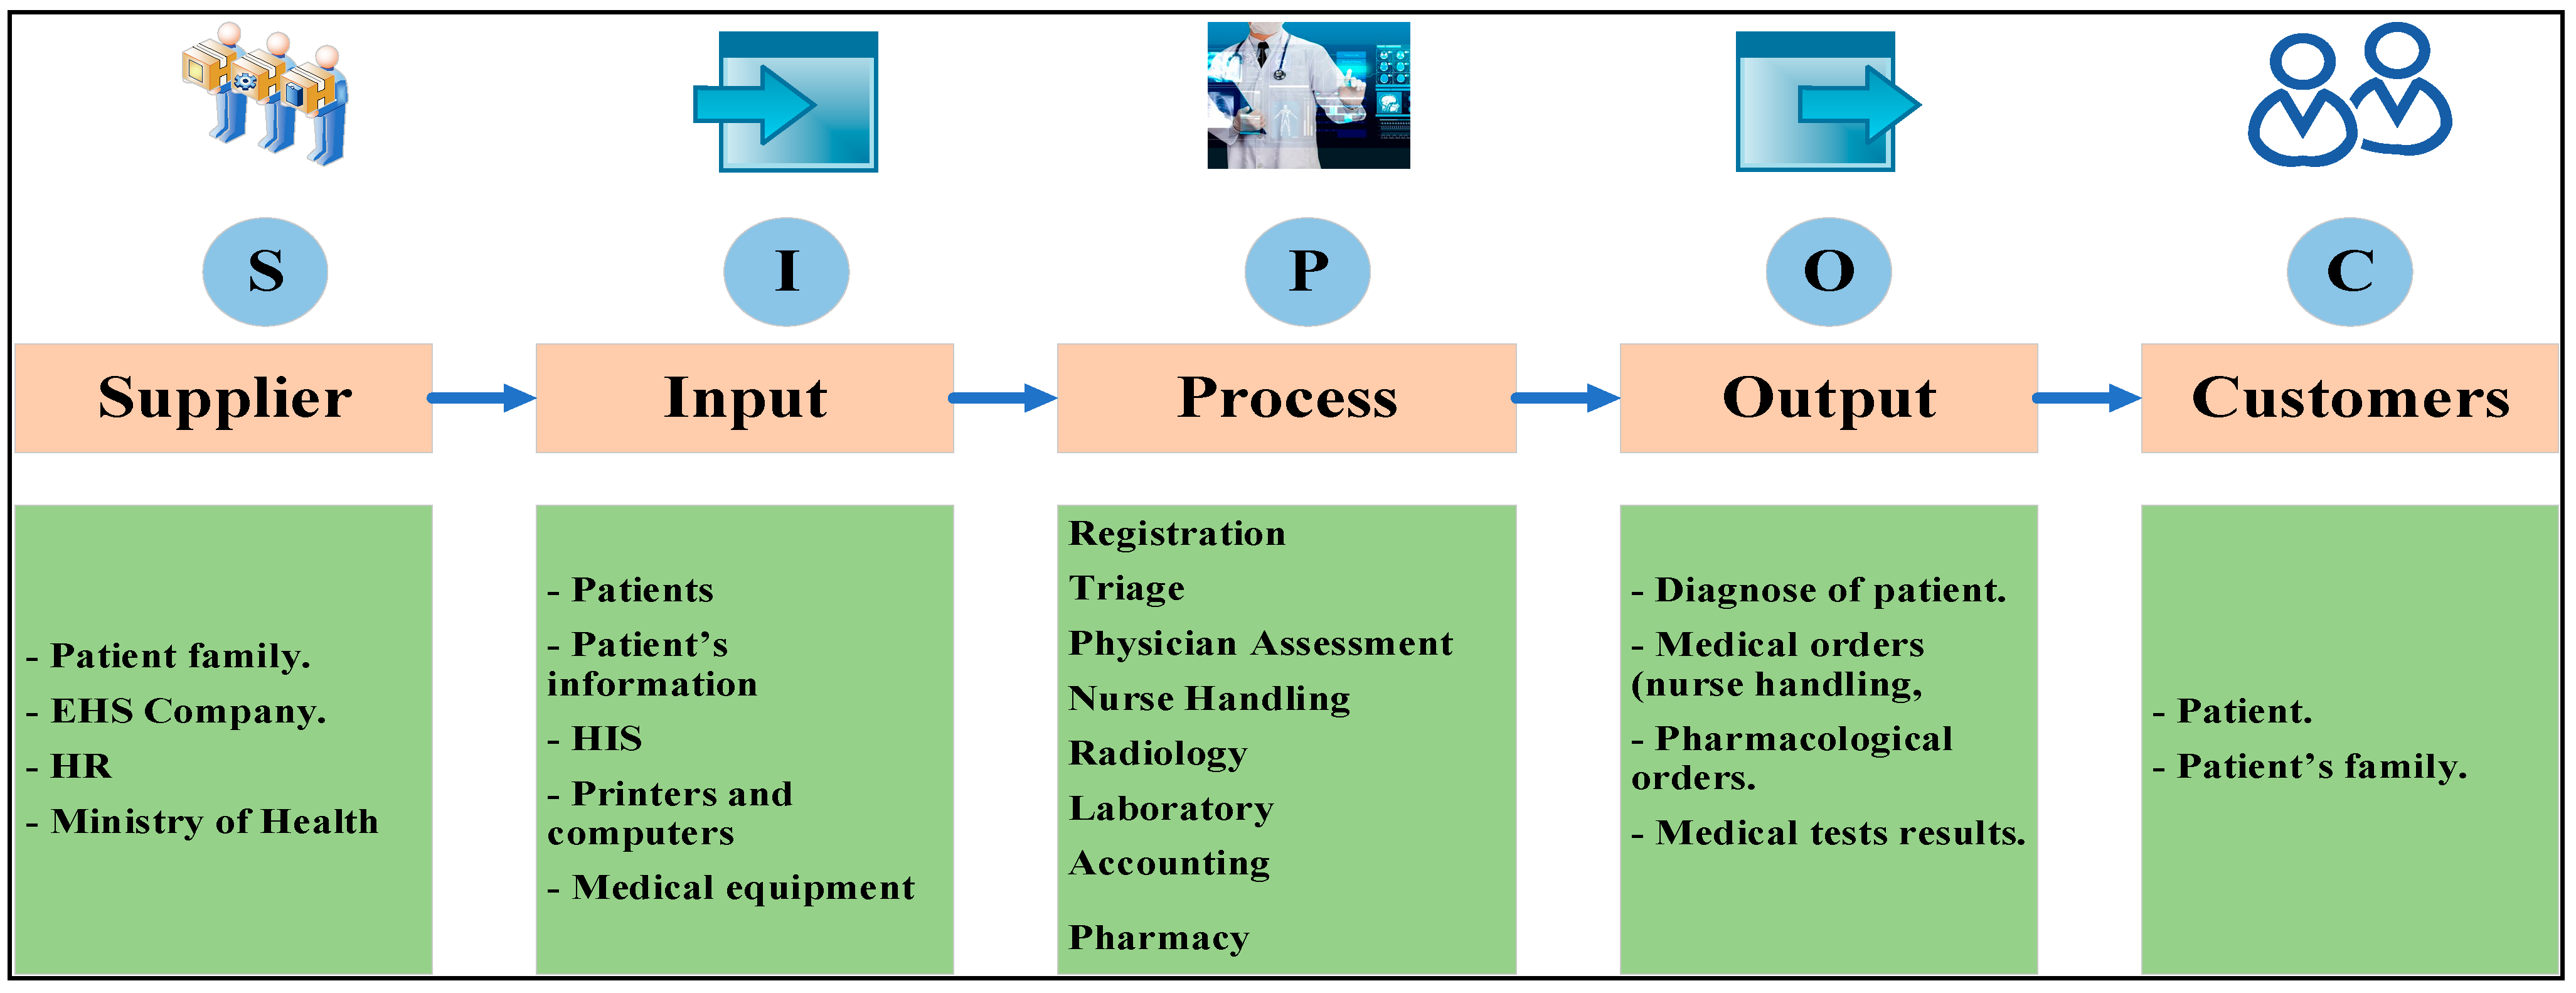
The SIPOC analysis is illustrated in
Figure 3 to understand the system, including details about the supplier, inputs, processes, outputs, and PRPH’s emergency department system customers.
2.1.2. Measure Phase
The “Measure” phase gathered all data required to develop a simulation model and conduct root cause analysis.
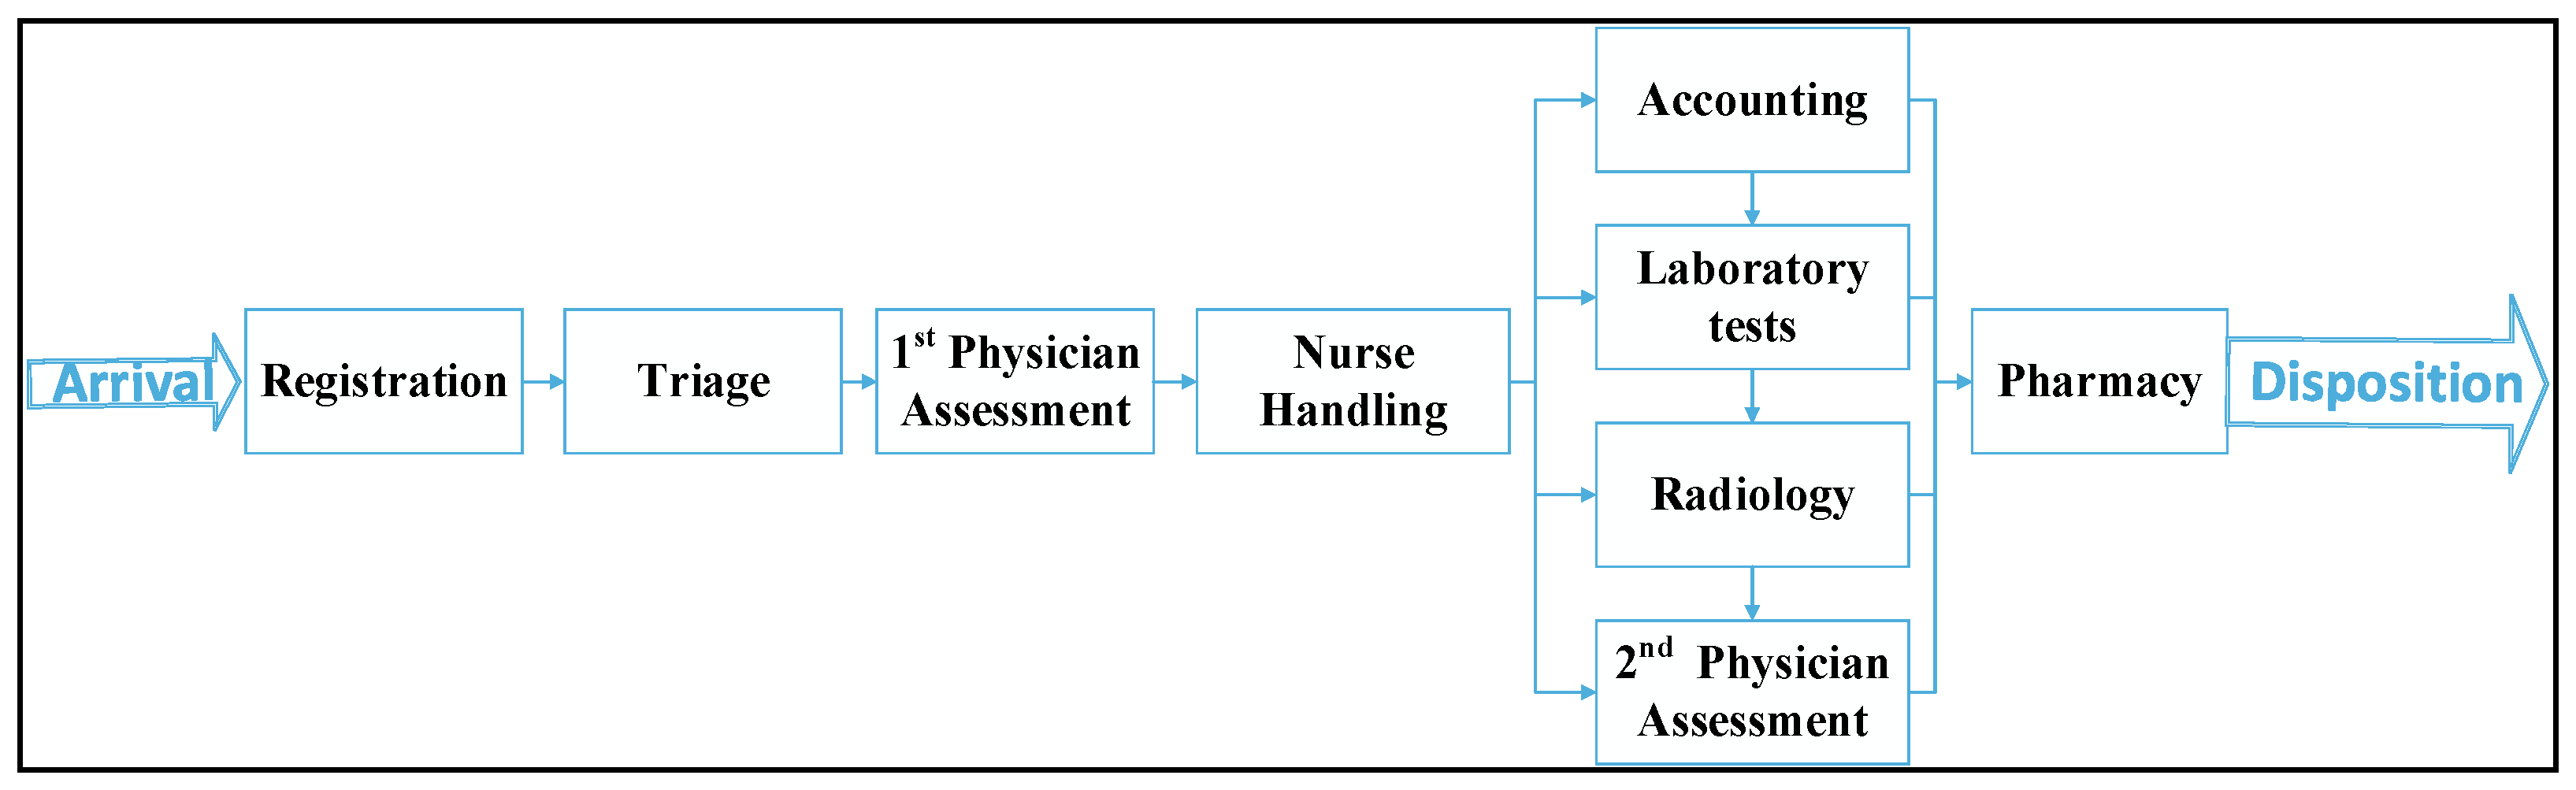
Figure 4 shows the high-level flow diagram of the system process. This flow chart illustrates the processes and their sequences in the ED, and how they are dependent on each other. Therefore, experimentation during the measurement and analysis phase is easier.
Patients progress through these procedures in a sequence determined by their physician ‘appraisal of their condition’. To determine the length of time required for each procedure (service time), a stopwatch was used for each process, and its duration was recorded for each patient during the observation period, which spanned multiple days and shifts.
Table 4 presents the number of patients who came to PRPH’s emergency department during the period from 1 July 2020 until 31 August 2020 and their acuity level index as taken from hospital records.
Physicians and nursing rooms were immediately assigned to patients with acuity levels 1 and 2. As can be seen from the table above, these incidents accounted for 2.02% of all reported incidents. They were excluded from the study because they were not awaiting participation. To be examined by a doctor, patients with an acuity level index of 3–5 must wait in line. First come, first served (FCFS) scheduling was used to enter these cases into the physician’s room.
2.2. Simulation Model, Parameters, and Scenarios
DES was used to test several alternatives to the problems identified in the “Analyze” phase. Arena software was used to model the process. This subsection contains the constructed model, as well as model verification and results validation.
2.2.1. Model Construction
Arena Rockwell (the 16th version) software was used to create the simulation model. With the flexible and effective Arena software, analysts produce animated simulation models that accurately reflect virtually any system. Arena software uses an object-oriented design for the creation of graphical models. Additionally, Arena process analyzer can be used to rate scenarios and choose the best one.
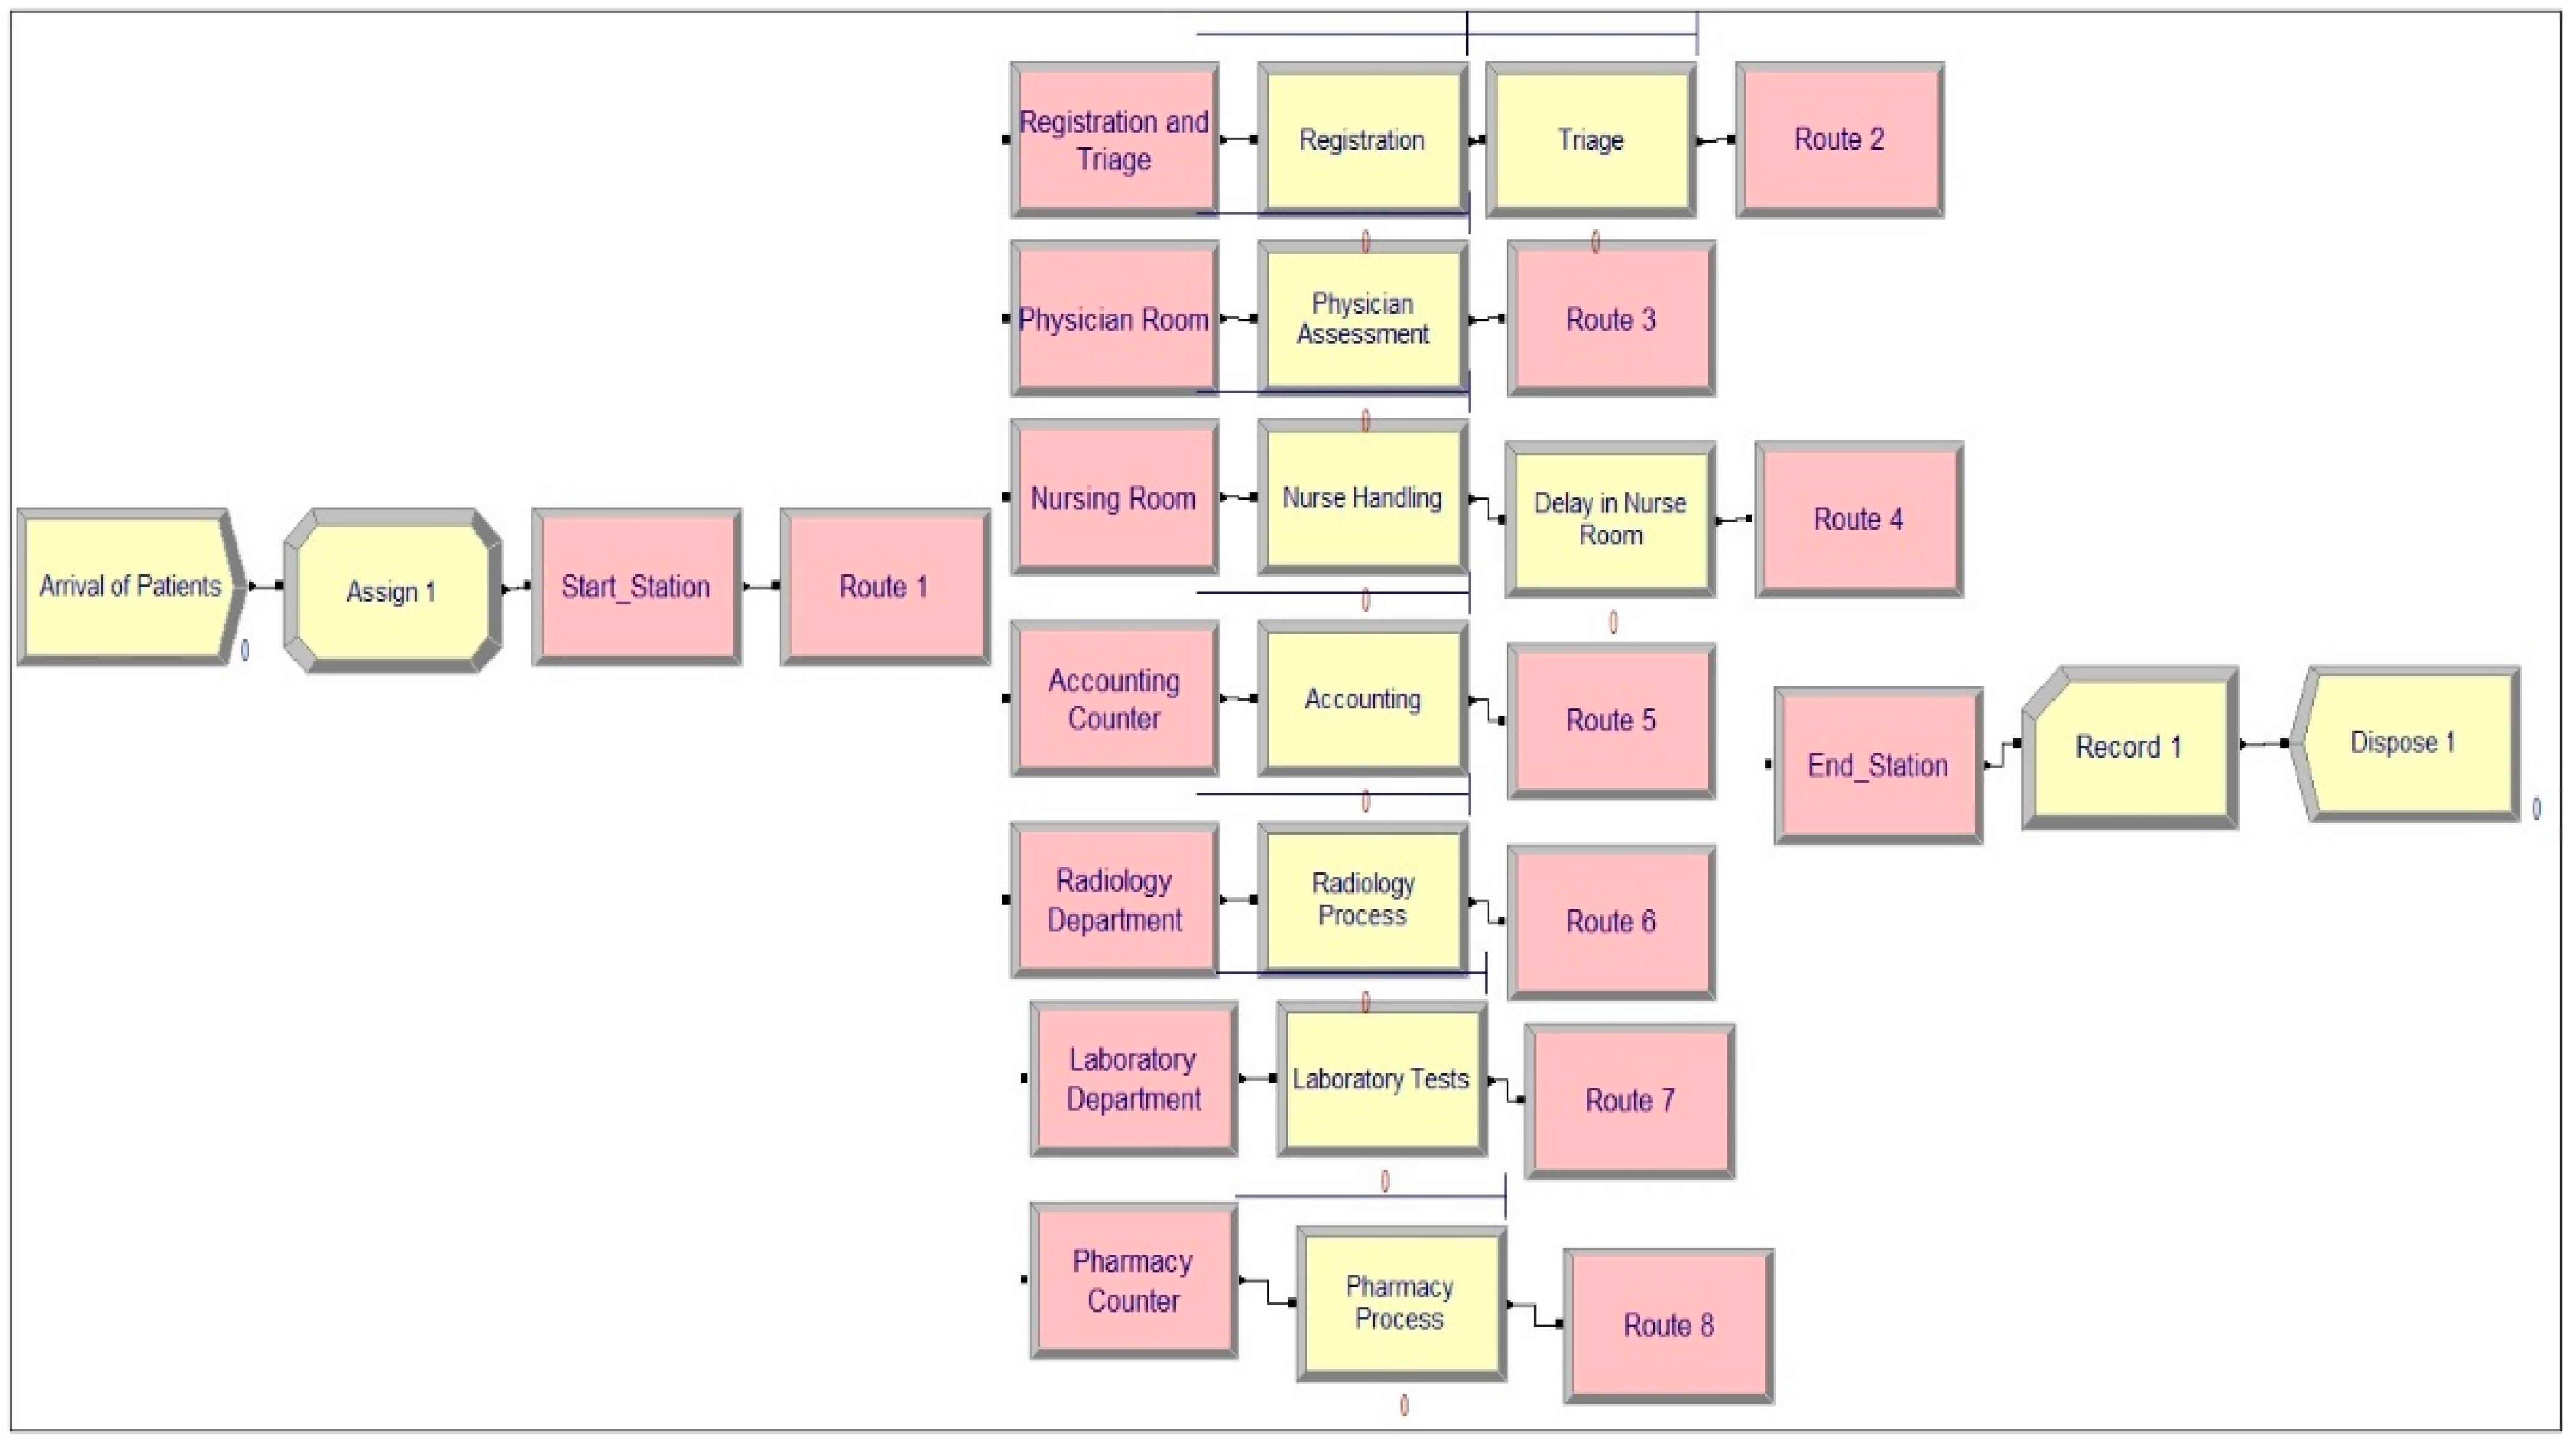
Figure 5 shows a snapshot of the constructed simulation model for PRPH’s emergency department in the Arena software. To model physical systems, Arena Rockwell Software uses a concept known as a station to designate specific places. Stations can be viewed as places where many processes take place.
Nine processes occurred in the PRPH’s emergency department. To represent a process in Arena, the action type of the process (delay, seize delay, seize delay release, or delay release), resources used to conduct the process, and the delay type with its value must be specified (service time). The following section covers resources and available quantities. Each process was monitored to determine the service time. The data points of each process were then fitted using Arena’s input analyzer to obtain the optimum statistical distribution describing its service time. Each process is listed in
Table 5, along with its action type and service time distribution.
A delay in the nursing room represents the time spent taking intravenous or nebulizer medication, as it requires time to be taken by the patient. Entities often compete for services from resources, such as staff, equipment, tools, or space in a limited storage area. An entity seizes units of a resource when available and releases it (or them) when the service/process is finished. The details of the resources available in the PRPH emergency department, as observed during the data collection phase, are shown in
Table 6.
As patients (entities) undergo different combinations of processes based on the physician assessment of their state, the concept of stations and sequences is used in the design of the PRPH emergency department model. It begins with witnessing the physician’s assessment process. Each patient’s journey was recorded, as well as the number of patients who followed each path, to determine the likelihood that patients would follow specific paths. It has been discovered that any patient who arrives at the PRPH’s emergency department can take one of nine paths.
Figure 6 shows the pathways (sequences) and their probabilities.
2.2.2. Model Verification and Validation
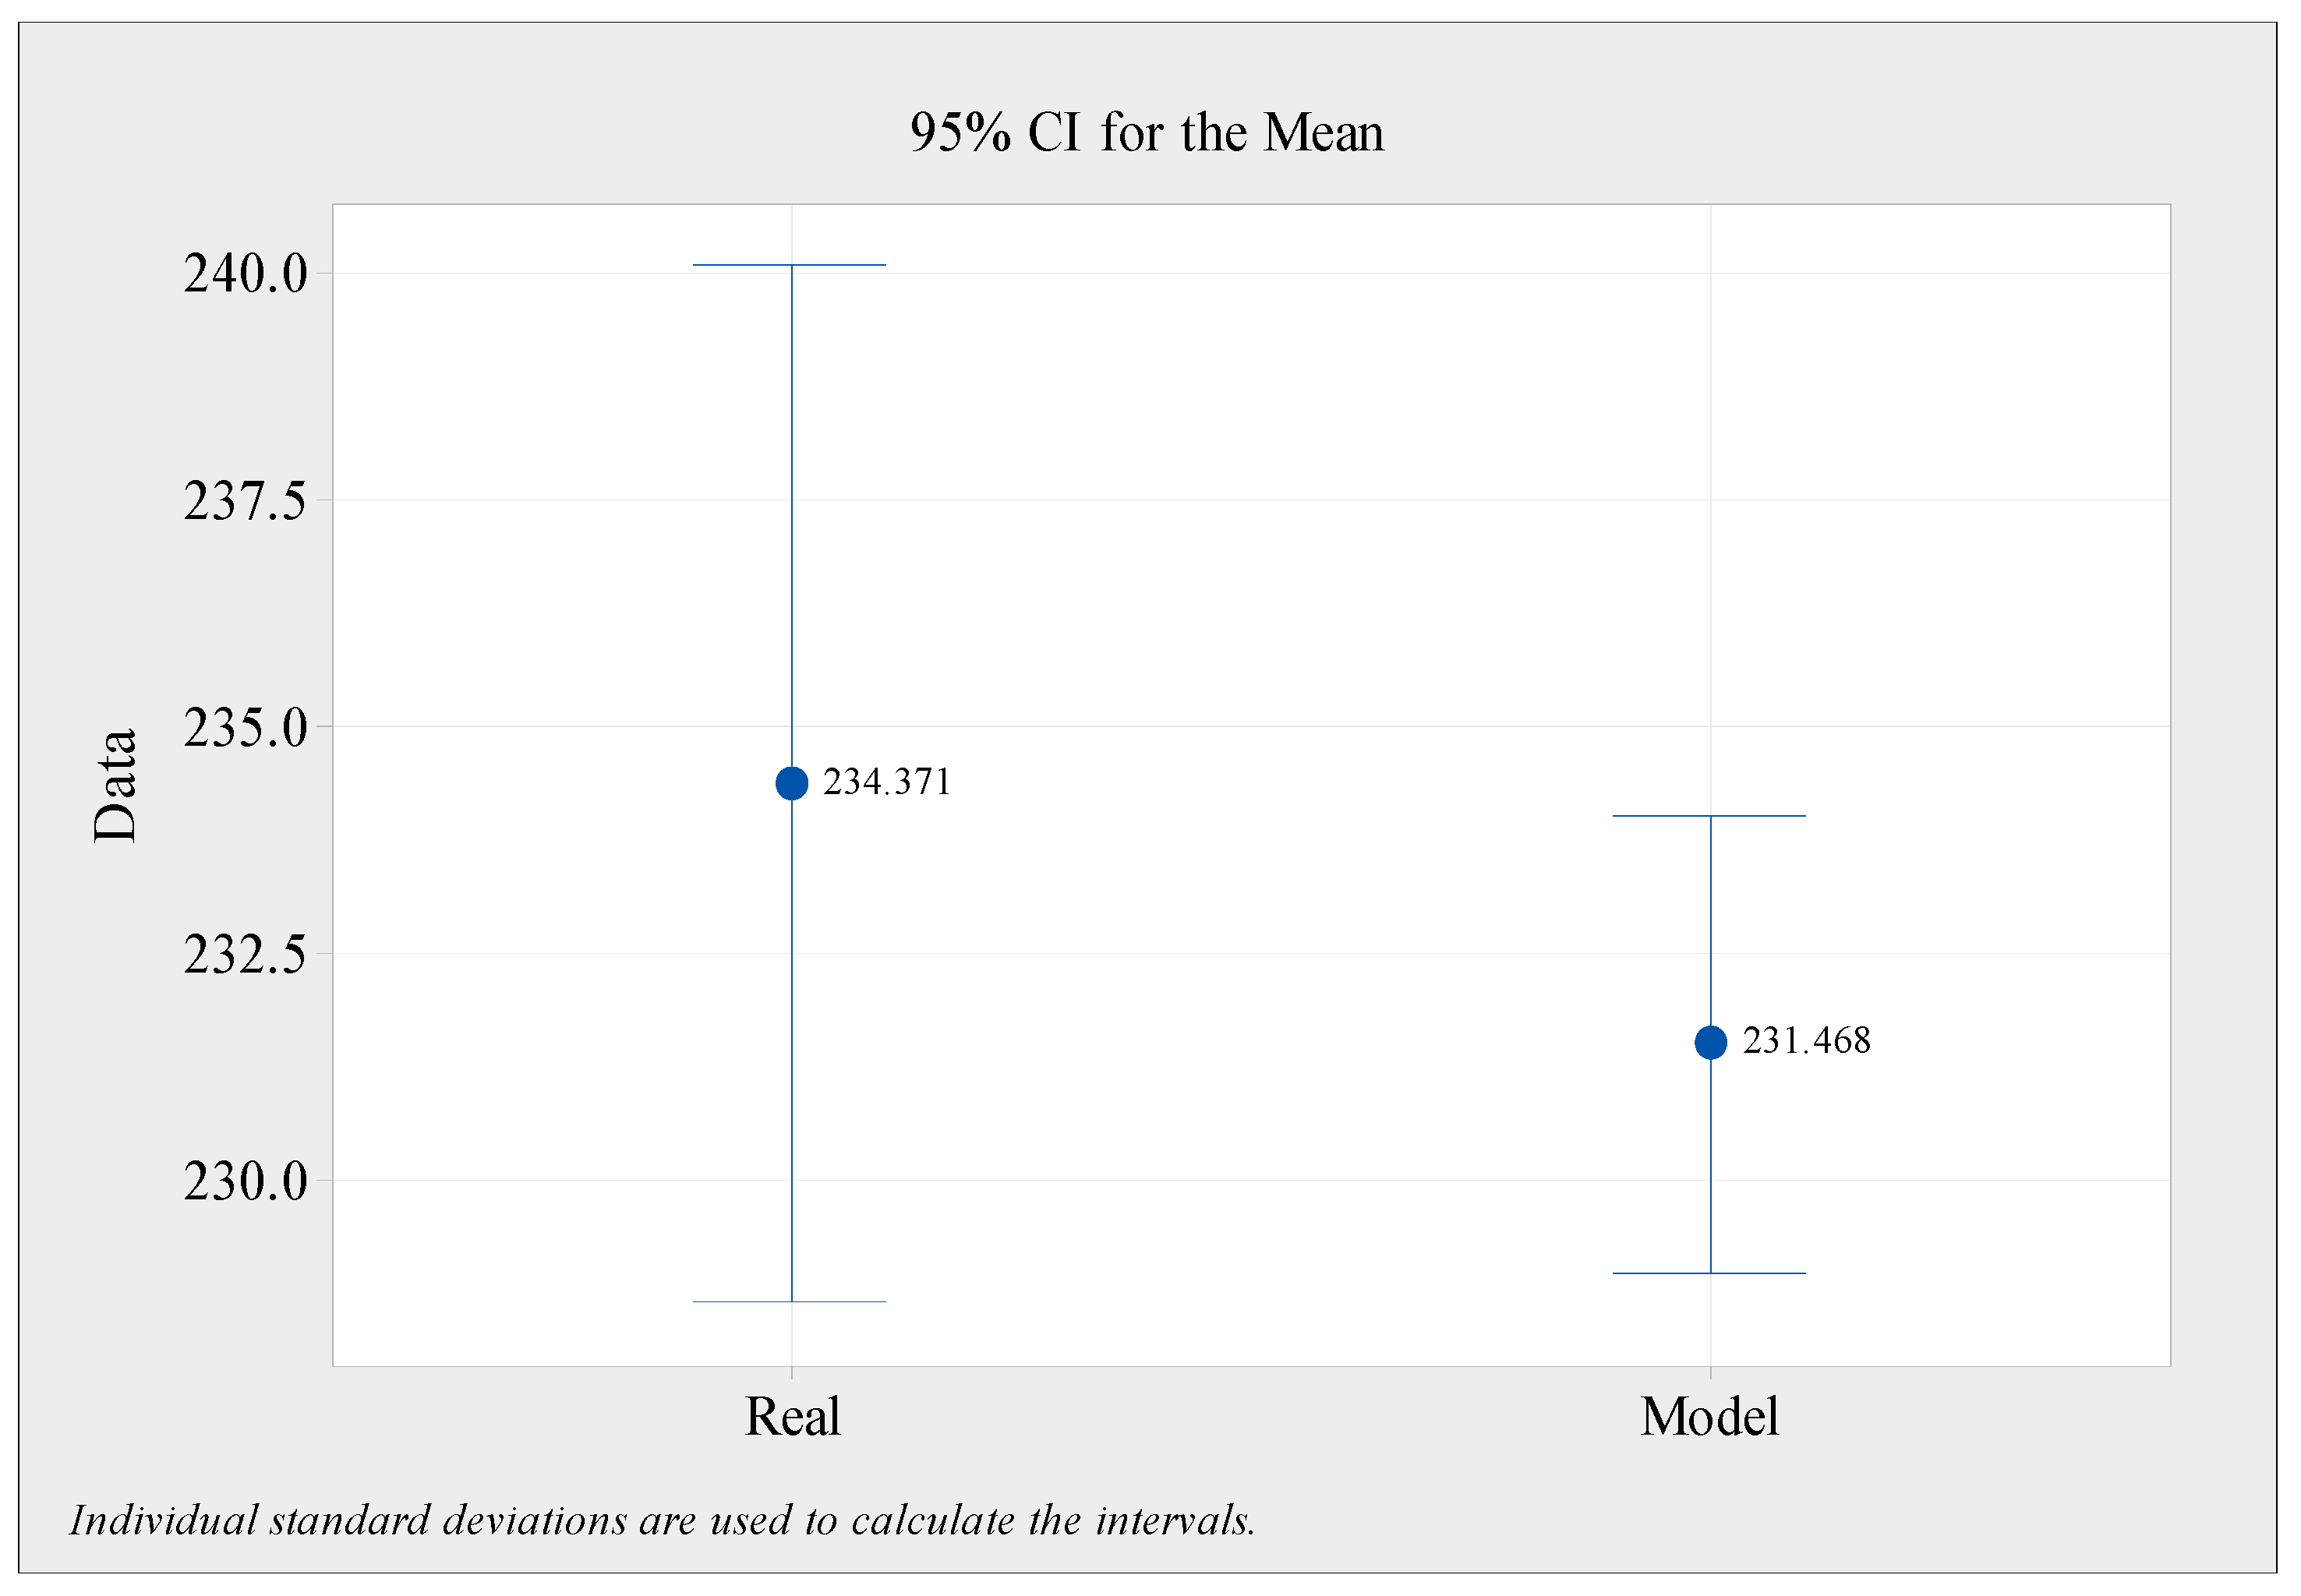
Model verification was conducted using a series of interviews with various individuals. The model was run in the presence of the hospital’s quality assurance department staff and one of the study’s physicians. There are long waits at the doctor’s office and laboratory, as well as the overall logic of the model that they observe and report on. A total of 62 replications of the model were performed, each lasting 24 h. Consequently, it can be concluded that the proposed model was tested and validated by comparing the two outputs from the simulation model with the real outputs of the PRPH emergency department. The daily average number of patients serviced by the system and the average time each patient spends in the system are the system’s first two outputs (length of stay).
Figure 7 shows a statistical comparison of the daily numbers of patients in the existing and simulated models. The two-tailed
p-value for the real model was 0.355, with a mean of 2.90, and a two-tailed
p-value of 2.90. Consequently, this difference is not regarded as statistically significant according to traditional standards. Furthermore, the simulation model findings showed that the average length of stay for each patient was 129.79 min. For a sample of 150 patients examined over many days and shifts, the average length of stay was 126.5 min. There was a 2.6 percent inaccuracy, indicating that the model accurately depicted a real system.
3. Results and Discussion
This section focuses mainly on the “analyze” and “improve” phases of the DMAIC methodology by analyzing the current and improved models’ simulation results. The first part of this section provides a detailed analysis of the performance of the current system to identify its problems. The second part measures the performance of the system after applying the improvements.
3.1. Current State
This section analyzes the system’s current state performance and identifies the root causes and alternative solutions to improve the waiting time and resource usage of the ED system.
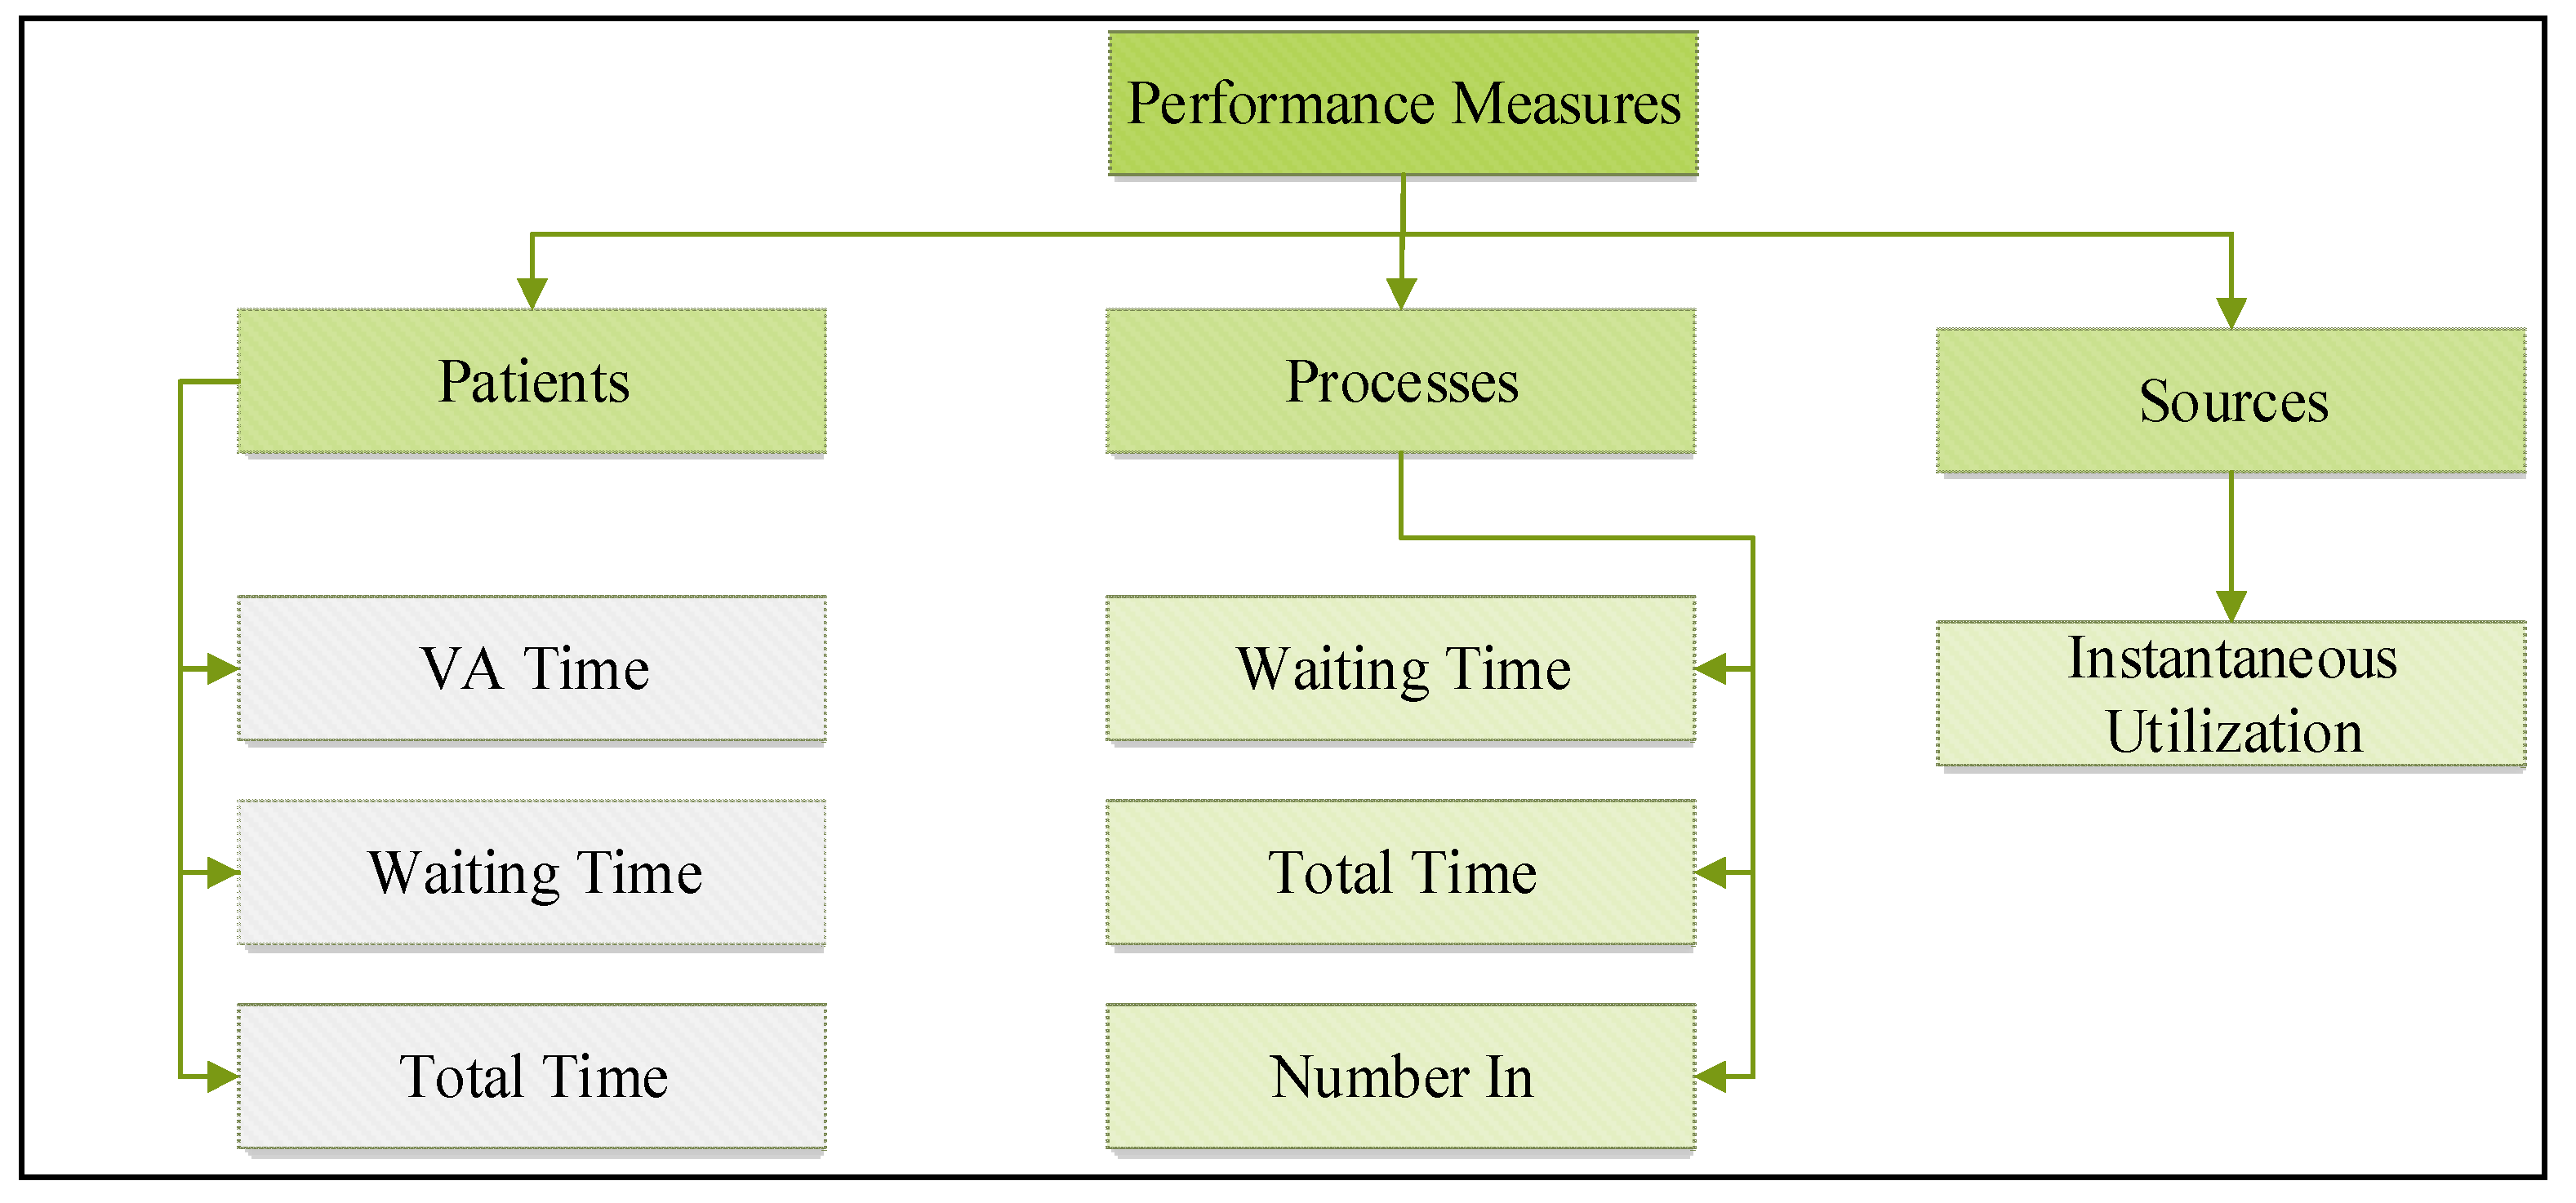
Figure 8 illustrates the performance metrics used to evaluate the performance of the current state.
3.1.1. Patients’ Time and Quantities Analysis
This subsection examines the length of time a patient spends in the system and the number of patients treated by the present state system to ascertain the system’s capabilities and identify areas for improvement. The distribution of the patient time throughout the system in the current state is presented in
Table 7. The average waiting time for a patient in the system is approximately 74.94 min, which is considered excessive in emergency rooms and may be harmful to patient health. Therefore, it is necessary to eliminate this non-value-added time.
The average number of patients progressing inside the ED per day is approximately 24. Therefore, attempting to reduce this considerable pick-up time (PUT) may reduce ED overcrowding, leading to enhanced patient safety, throughput, and satisfaction.
3.1.2. Processes Analysis
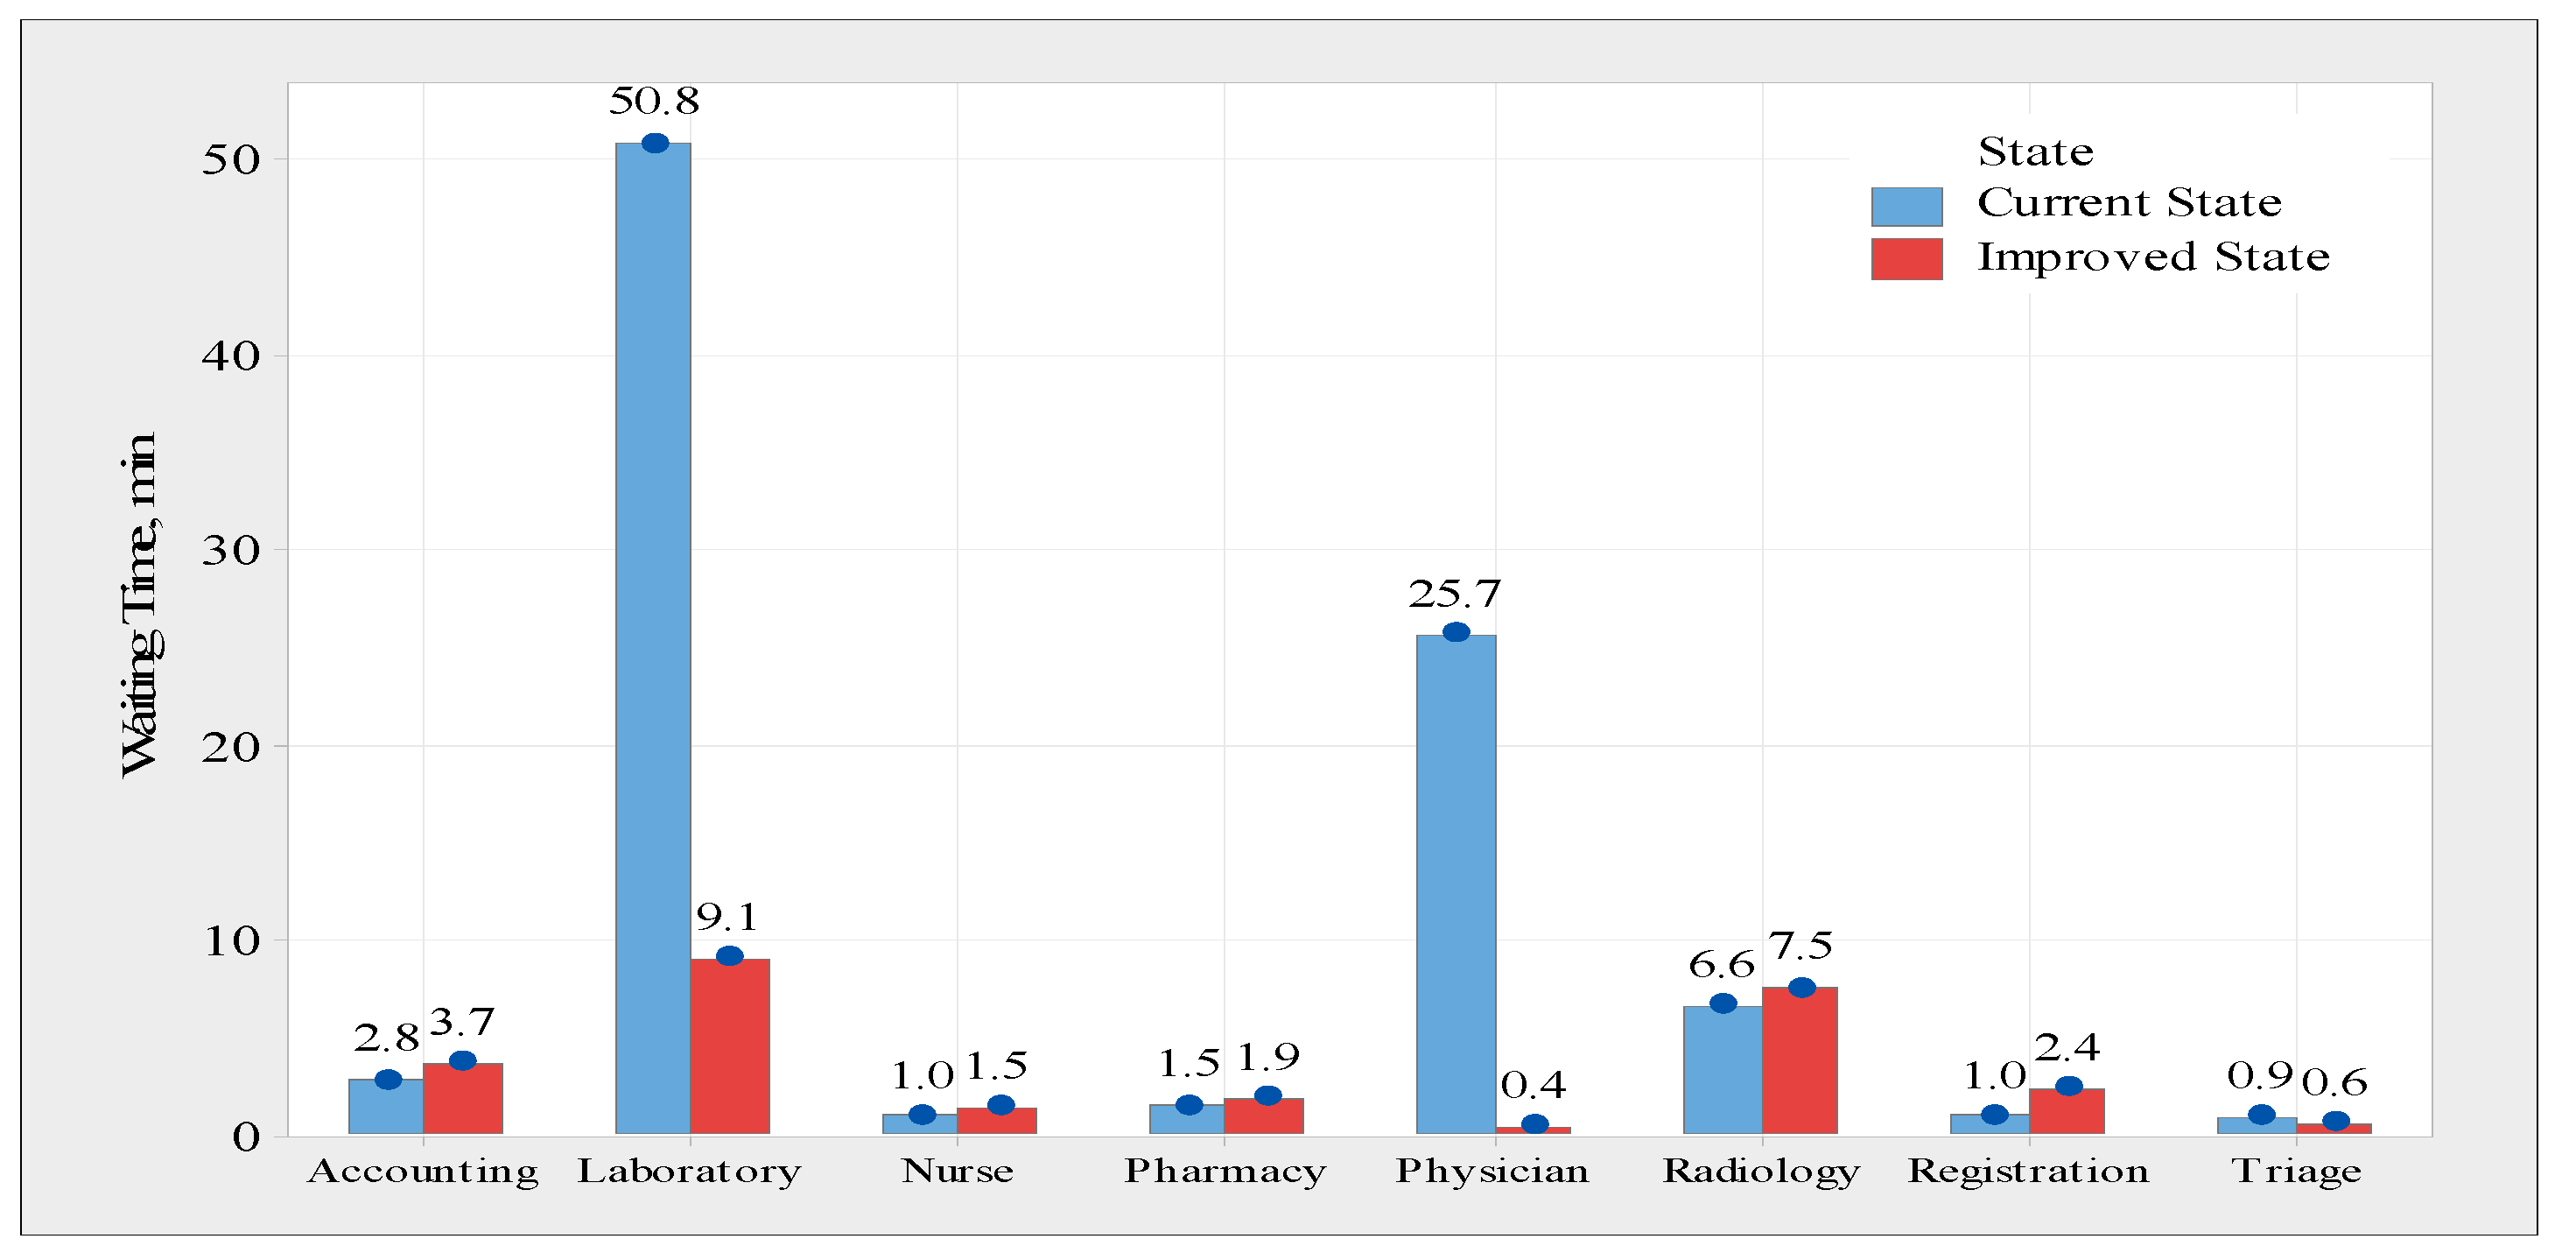
Each step in the PRPH emergency department system was analyzed in terms of the number of patients served and the time spent in each process to gain a better understanding of the system and identify potential causes for system performance improvement. Based on the average waiting time per procedure,
Figure 9 compares the existing and improved states, and it can be observed that the average waiting time for both the laboratory and physician assessment processes is significantly reduced. However, the laboratory procedure has had its waiting time decrease from 50.8 min to around 9.1 min, and the physician assessment process has had its waiting time cut from 25.7 min to less than one minute. The average waiting time in the other process, on the other hand, does not differ statistically significantly from the first.
Four different scenarios are tested to see the effect of changing the resources configuration on the performance of each process. These scenarios are based on the suggested solutions in the resource’s limitation at the physician assessment process and the laboratory process.
Table 8 shows the difference between the current state and the suggested scenarios.
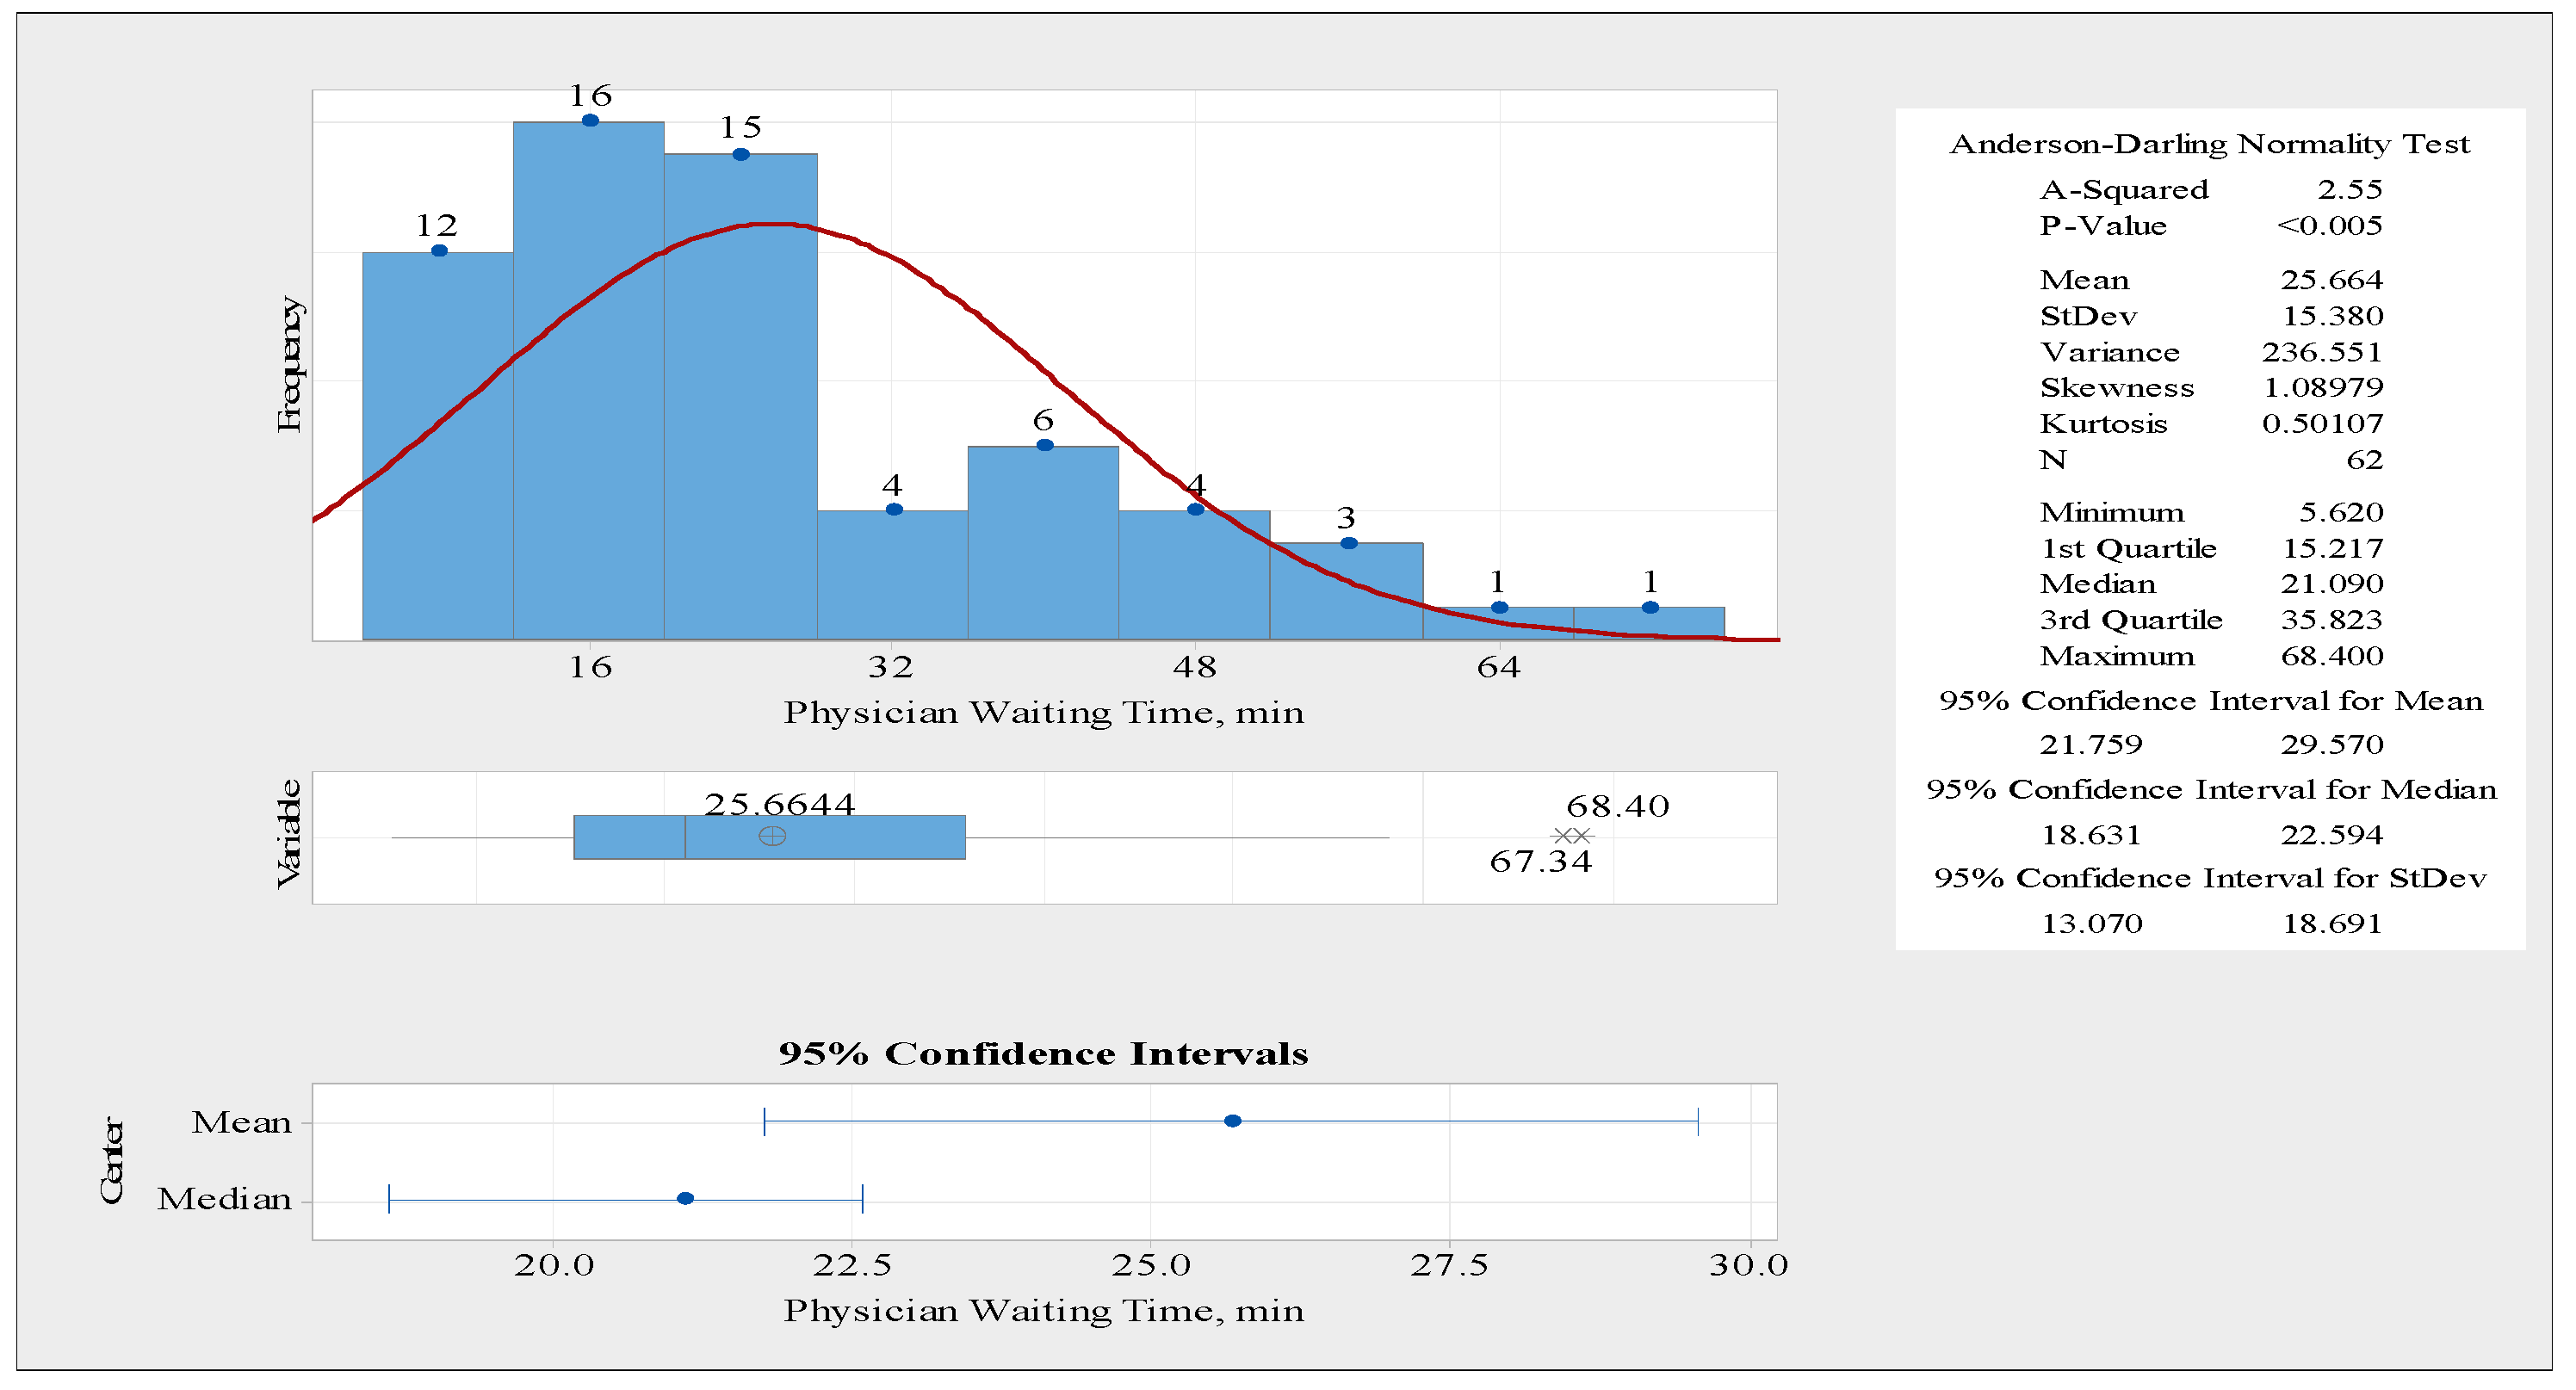
A comparison analysis for the waiting time of physician assessment of the current state of the system, as well as the improved state, was presented as follows. A statistical summary for the waiting time of physician assessment process was carried out using Minitab statistical software. The summary for the physician assessment process is shown in
Figure 10. The waiting time data distributions are not normally distributed because the
p-value is less than 0.05. Furthermore, the standard deviation was a little bit high at 15.38 min for the physician assessment process. Therefore, it is essential to decrease the variability of the waiting time for a better-quality service.
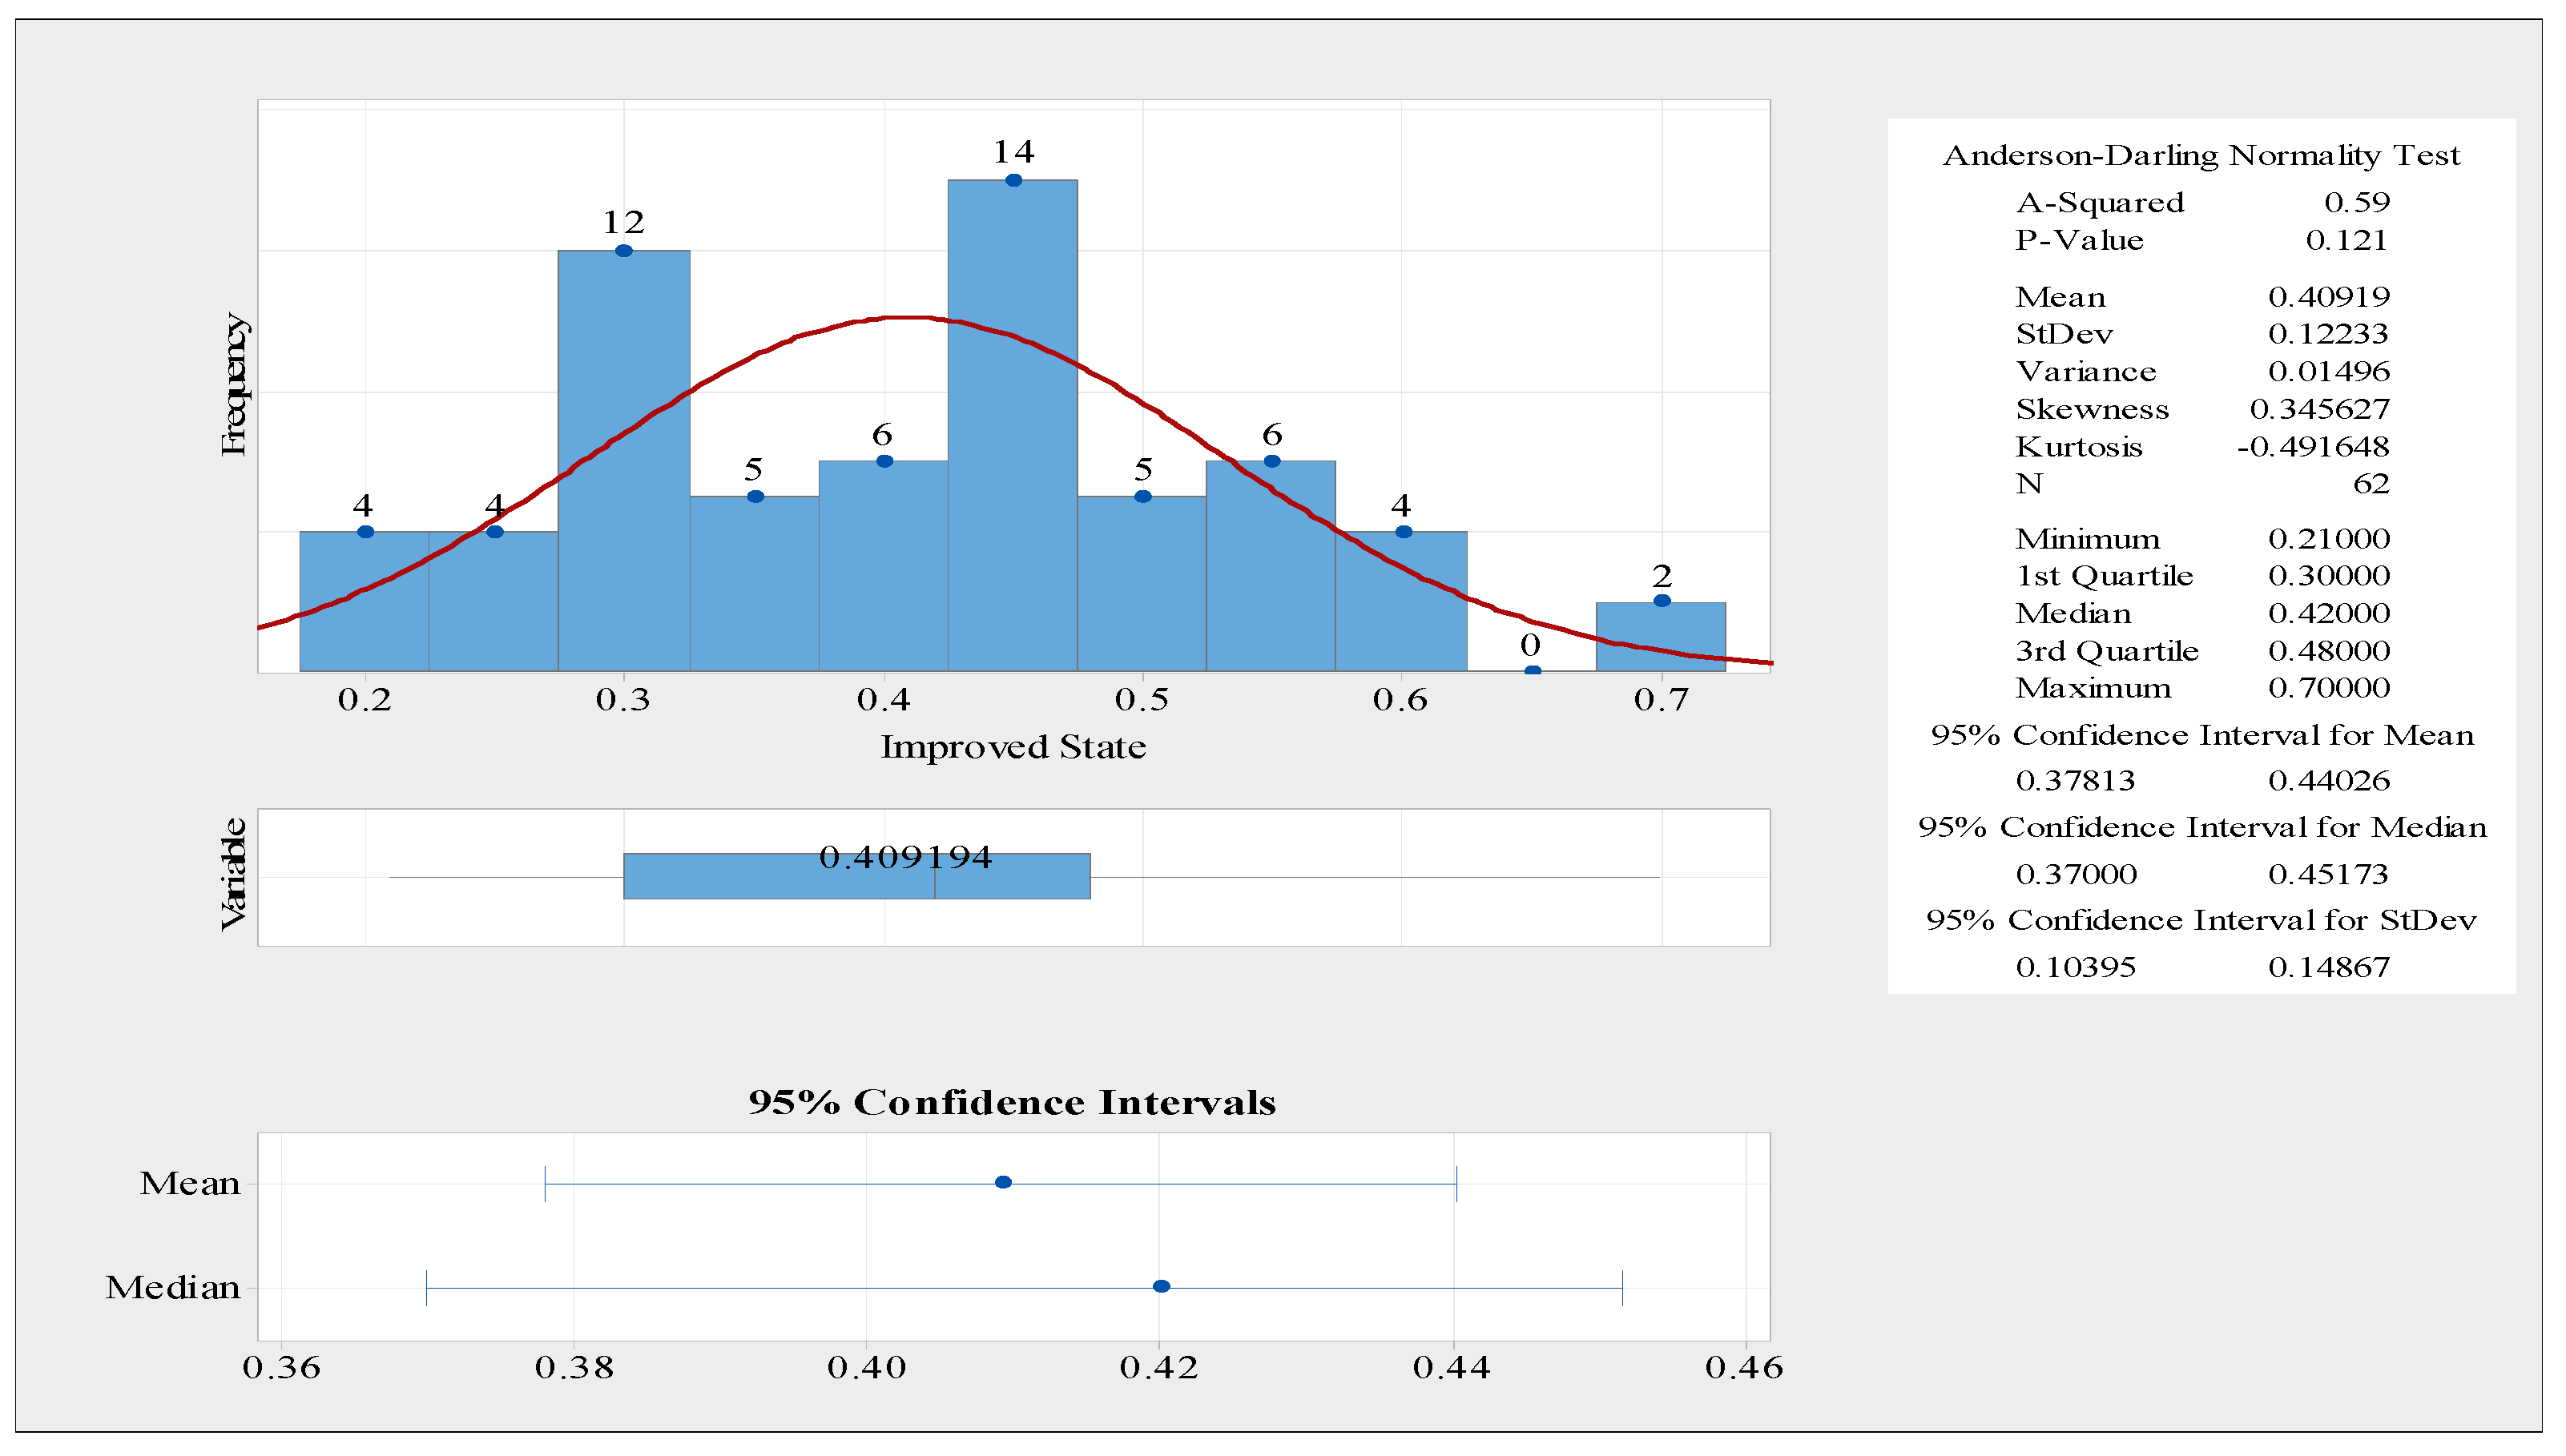
Figure 11 illustrates a statistical summary for the physician waiting time in the improved state. The distribution of the waiting time data is normal because the
p-value is more than 5%. Furthermore,
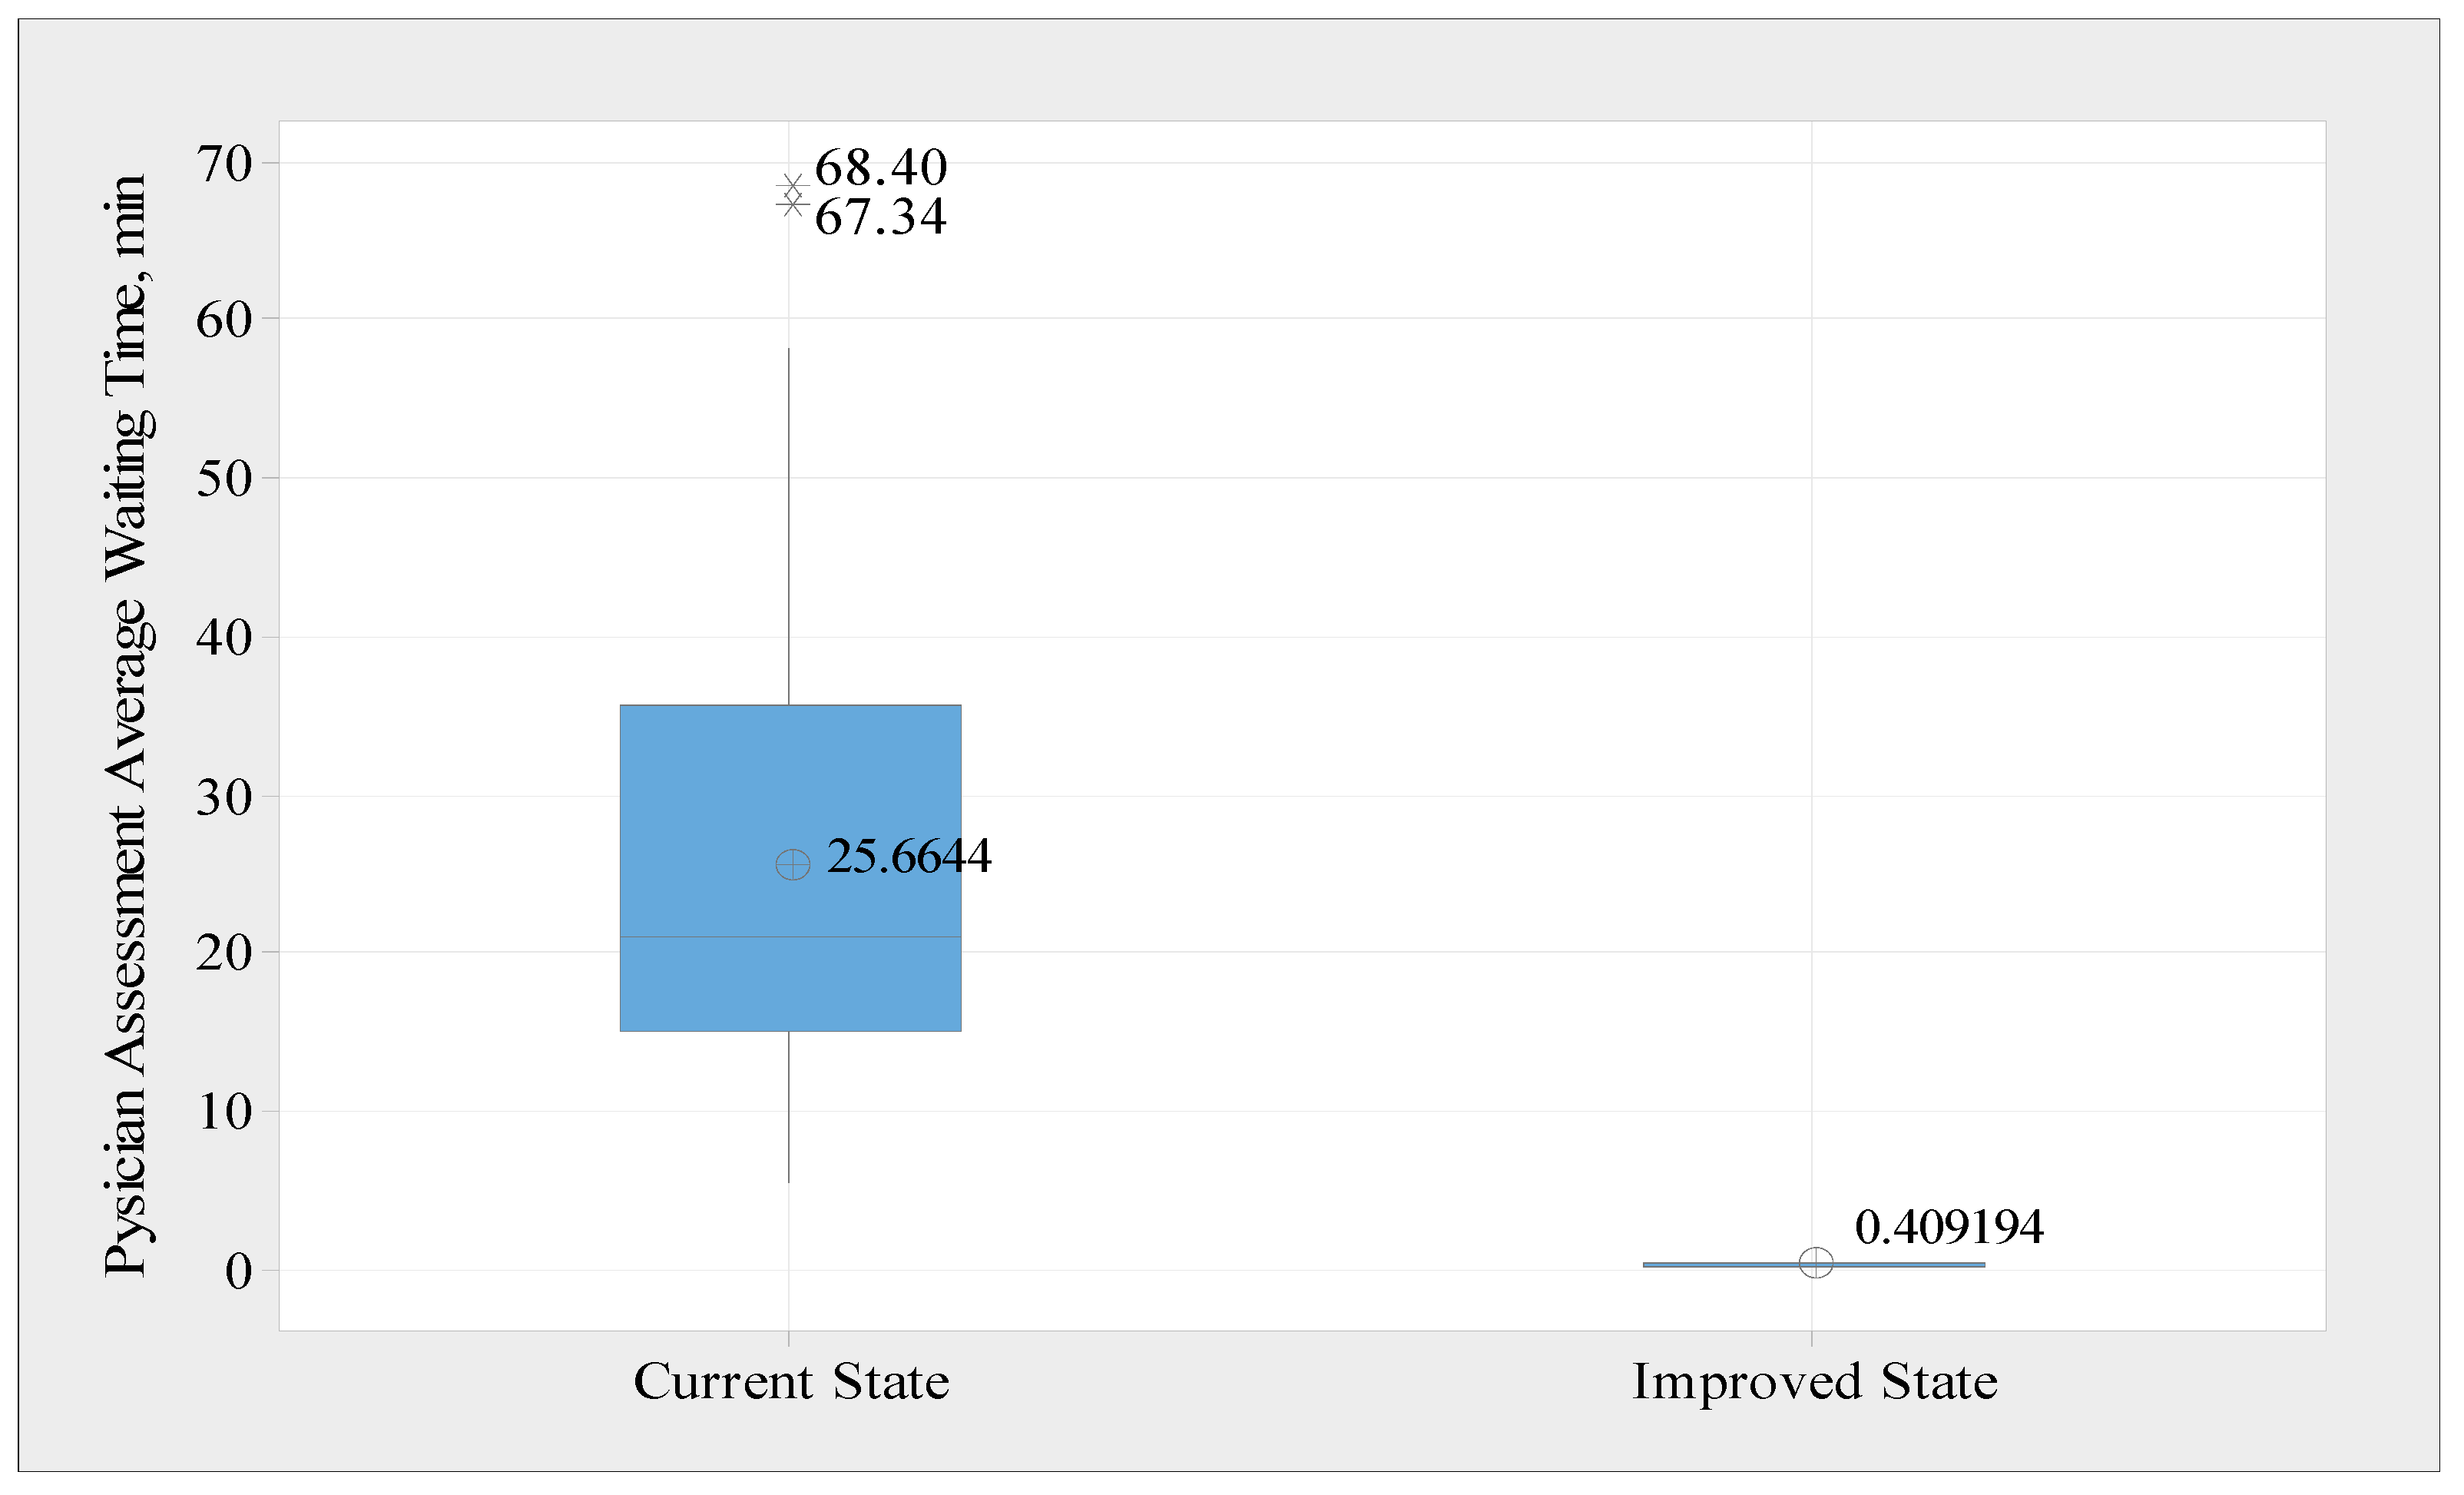
Figure 12 presents box plots for the average waiting time in the current state and improved state to show the variability. The mean value for the waiting time was reduced from 25.66 min to around 0.41 min. Moreover, the standard deviation was reduced from 15.38 min to 0.12 min, which means that this process waiting time variability is enhanced. Therefore, better-quality service is achieved.
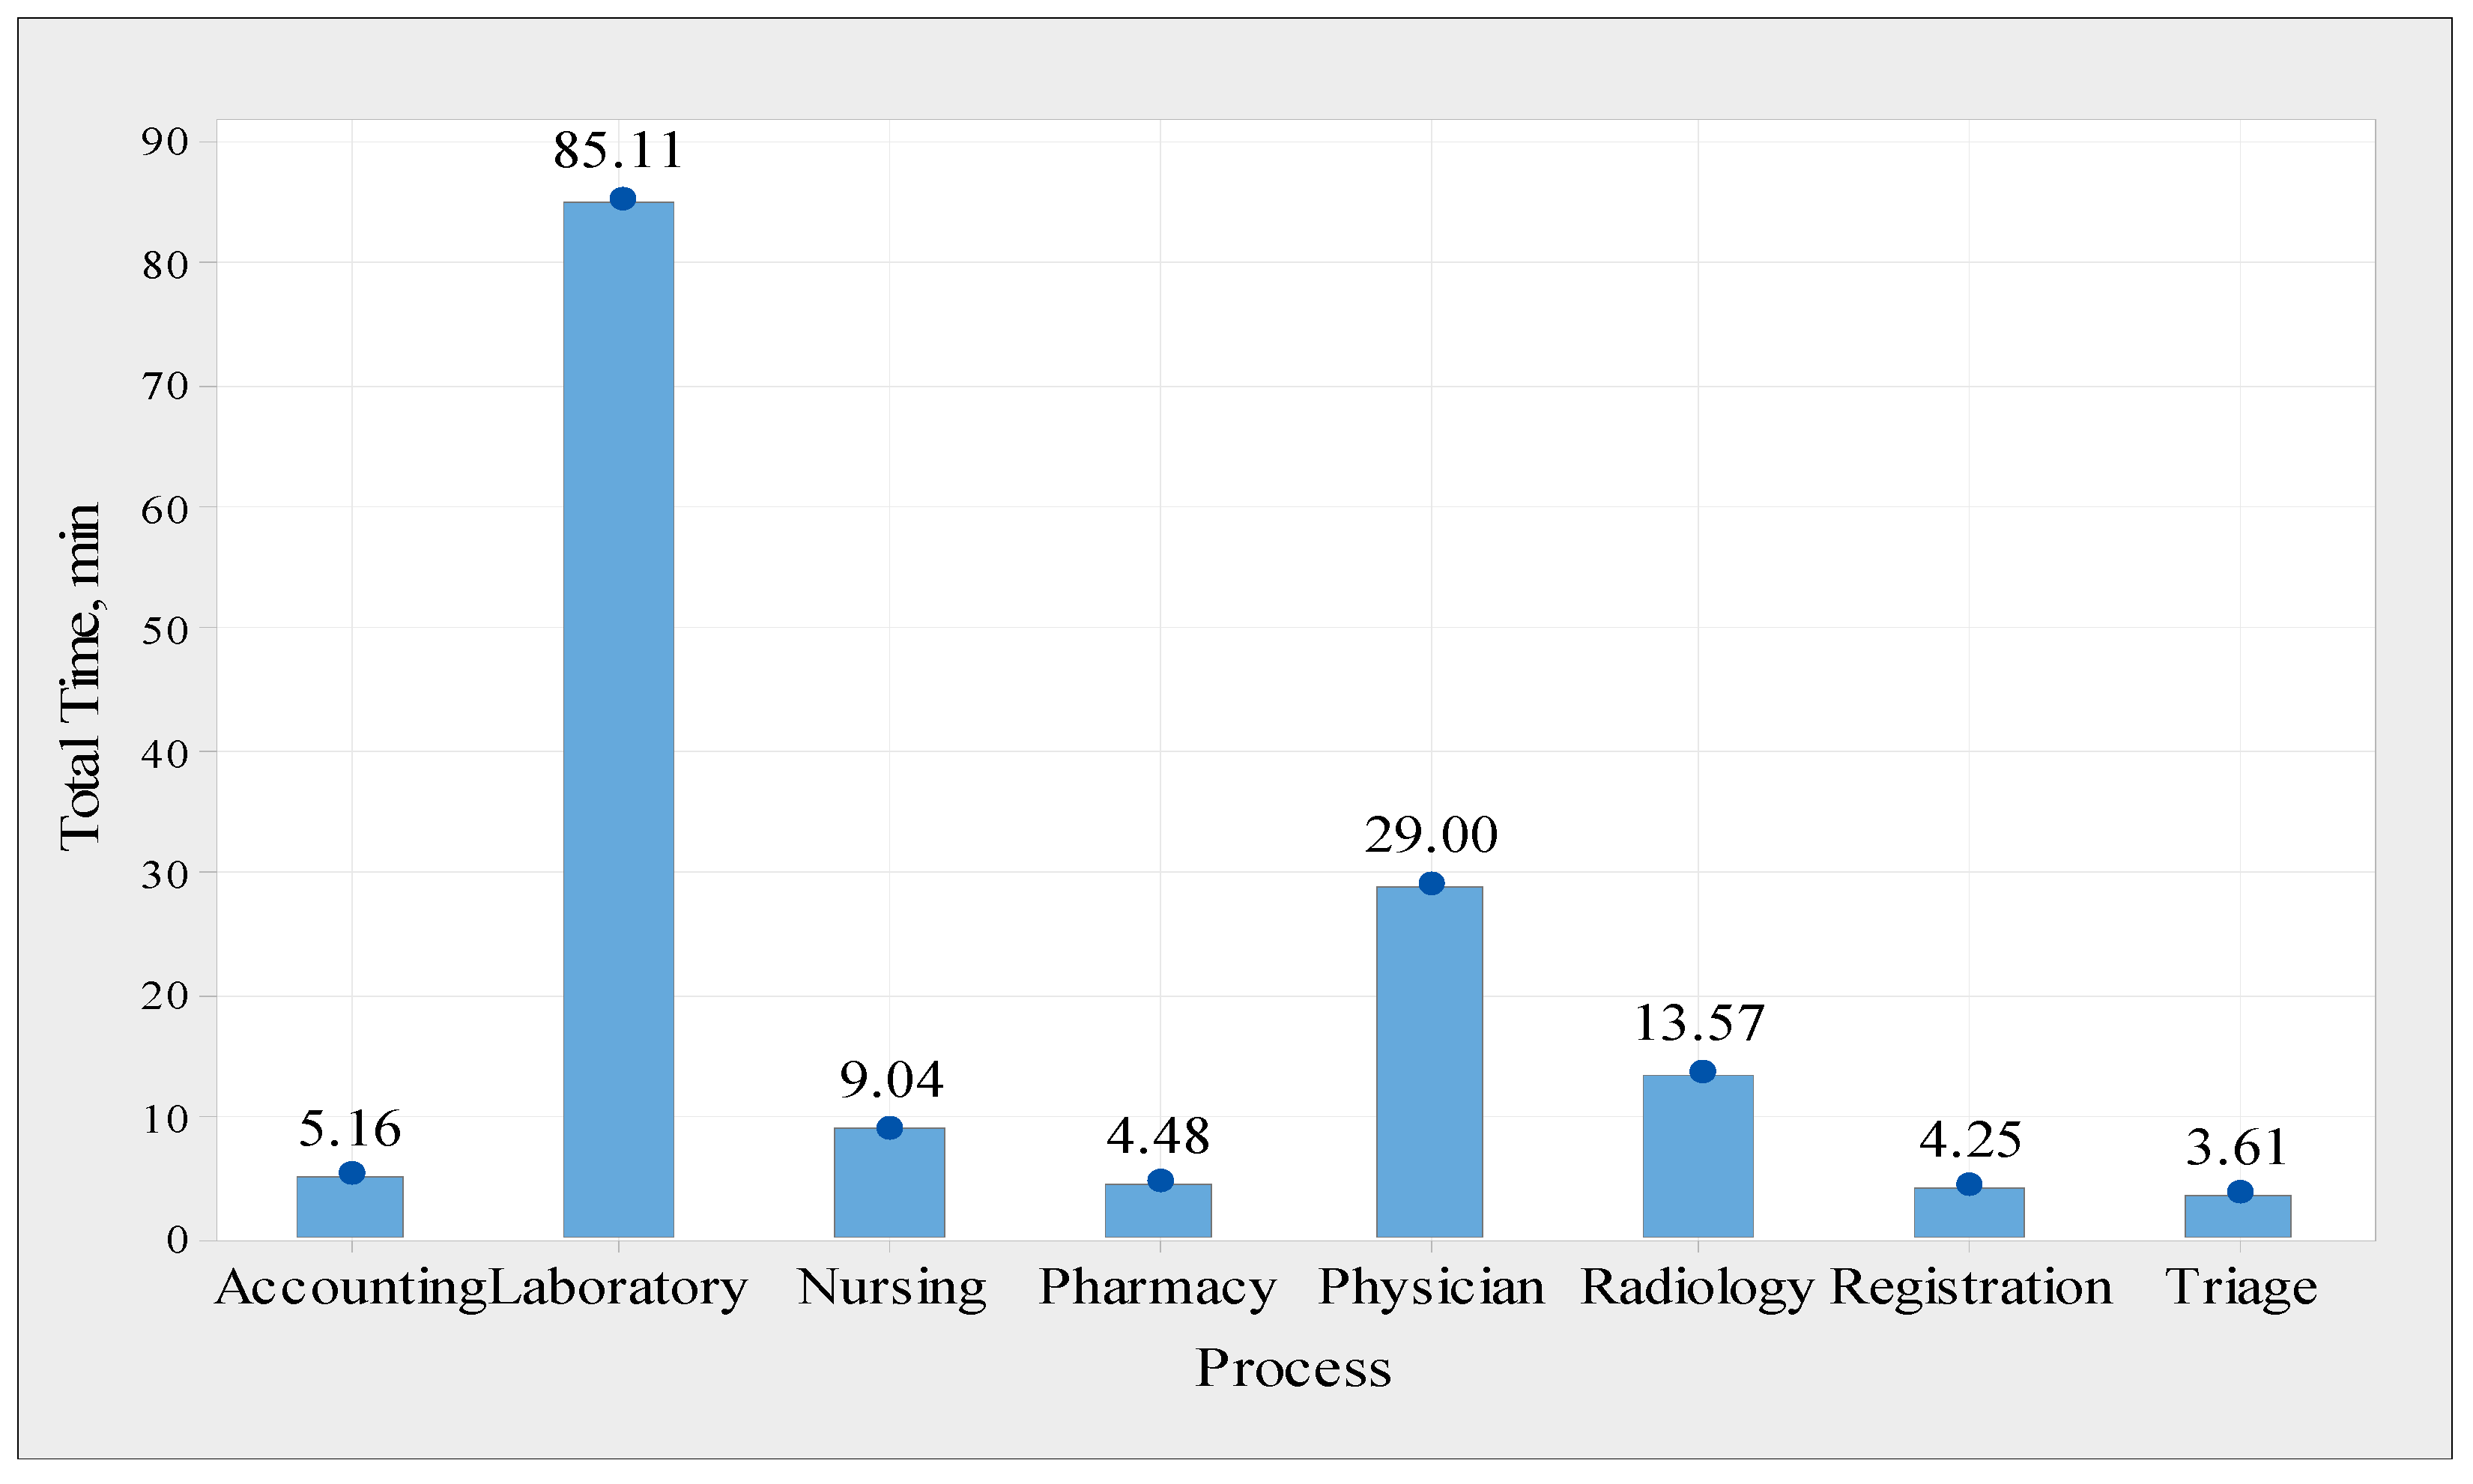
The average total time spent by a patient in each process is the sum of the average time and the average waiting time. The average total time spent by each patient in each step is shown in
Figure 13, which was obtained from the Arena simulation model. For instance, the physician assessment process takes an average total time of 29 min, which includes 3.33 min of value-added time and 25.66 min of waiting time. The total time values were used to calculate the efficiency of the process cycle. The efficiency of a process cycle is defined as the average time spent adding the value divided by the average total time spent. This metric indicates the efficiency of each process, which is a critical parameter for evaluating the system performance. Thus, the process cycle efficiency values were calculated and are presented in
Figure 14, using the Arena simulation model for 62 replicates. The data indicate that the physician assessment process is the least efficient (11.5 percent); this is a result of the lengthy wait time associated with this step. Additionally, other operations, such as accounting, laboratory, and radiology, are inefficient, achieving 45.2 percent, 40.3 percent, and 51.4 percent efficiency, respectively. However, the nurse-handling procedure showed the highest efficiency (88.9%). This is considered efficient because the time spent on non-value-added activities is relatively short.
The number of patients entering each process is critical for analyzing the performance of each process. In addition, it was used to calculate the cumulative time for each process. The number in process was taken from the Arena simulation model and is listed in
Table 9. As noted previously, the average daily influx of patients into the system is approximately 262. On average, approximately 405 patients underwent a physician assessment procedure. A patient may engage in the physician evaluation process at various points during the process, such as before performing a laboratory test. Additionally, the accounting method is conceptually identical to the physician assessment process. However, some processes have a lower entry rate than the system average because not all patients are required to enter all procedures. For example, not all patients undergo radiography.
The performance measures of each process are analyzed to understand the current situation and identify the factors that affect the performance of each process.
3.1.3. Analysis of Resource Usage and Root Cause Analysis
This subsection examines the utilization of each resource using instantaneous utilization as the resource usage analysis metric. These numbers were obtained from the Arena model and are shown in
Figure 15. It was demonstrated that immediate physician and laboratory usage was slightly higher than average, at approximately 91.6% and 86.6%, respectively. However, this is not ideal for registration and pharmacy processes. There are two significant problems in the system, including the following. Firstly, there is a shortage of resources in physician assessment and laboratory processes because the waiting time is very long, and the efficiency is very low. Secondly, there are excessive resources in the registration process. The causes of variability in the service and waiting times of each process are listed in
Table 10; these causes were determined through the following two ways: first, the observation was conducted for more than two months of data gathering in the ED; second, the literature was surveyed on common responses from different discussions with the employees.
3.2. Improve Phase
It is necessary to increase physician assessment and laboratory process resources and reduce registration process resources. Moreover, different possible solutions are suggested to reduce service and waiting time variability according to the identified root causes.
Table 11 lists possible solutions.
3.2.1. Analysis of the Improved State
This subsection compares the current and upgraded states of the ED’s processes and resources. The average time, waiting time, total time, number in, number out, and number of PUT are compared in
Table 12. The average waiting time decreased from 74.94 min to 20.24 min, which is a considerable improvement. In addition, the number of patients undergoing processing was reduced from 24 to 14, thereby reducing ED crowding.
Figure 14 shows a comparison between the existing and improved states based on the process cycle efficiency. The efficiency of the process cycle was also improved for the laboratory, physician assessment, and triage processes, among others. However, all other processes experienced a modest decrease in efficiency, except for registration. The efficiency of the registration process decreased from 76.5 percent to 56.5 percent, mostly because of a reduction in the resources of the registration process. The overall efficiency and performance of the system, on the other hand, are not severely impacted by this drop in efficiency. Doctors’ assessments have improved from 11.5 percent to 89.1 percent in efficiency, while laboratory assessments have improved from 40.3 percent to 70.8 percent in efficiency, according to the report.
Figure 15 illustrates the resource use for each process under both conditions using data from Arena software. A decrease in the use of laboratory and physician assessment processes is common, as these processes receive additional resources. However, because of fewer resources, the resource consumption of the registration process increased from 39.5 percent to 58.7 percent. However, a resource utilization rate of less than 60% enables the system to be more adaptable and capable of handling increased rates or unexpected spikes in demand.
3.2.2. Control Phase
This phase strives to ensure that the study’s improvements are sustainable, maintain a high-quality standard, and accomplish their objectives. The following points may assist in maintaining the required level of quality in the emergency department under study.
Implementing the recommendations: after applying the recommended changes to resource configuration, it is crucial to develop monitoring plans to assign the required resources. Therefore, process control and monitoring should be conducted regularly, which should be the duty of the quality assurance department at the PRPH.
Worker’s training: workers in the PRPH emergency department should be updated with new technologies and knowledge. In addition, training workers on best practices in each process and dealing with patients and their families are important tasks.
Plans: the ED needs to be proactive and plan to overcome future problems, such as unexpected patient arrivals. For example, it is worth using prediction models/tools to forecast future demands to take proactive action.
4. Conclusions and Future Work
The implementations of the Six Sigma DMAIC methodology combined with discrete event simulation gave a structured framework for defining the project goals, comprehending the current situation, analyzing the data to find the root causes, evaluating statistically significant improvements, and putting a control plan into place to maintain improvements at the pediatric hospital emergency department. With the use of DES, we were able to quantify the levels of improvement that may be expected from the various solutions put up, providing the PRPH administration with a range of options. In fact, the overall waiting time was shortened by about 73%.
The purpose of this research was to combine DES with Six Sigma DMAIC methodology to decrease patient wait times, minimize congestion, and improve procedures and overall system efficiencies in PRPH’s emergency department. To enhance patient safety, throughput, and resource usage, four scenarios were examined and analyzed using simulation models. As a result, the third scenario, which includes the addition of one physician and one laboratory technician, and the elimination of one registrar, strikes an ideal balance between resource efficiency and usage.
The proposed model reduces the average waiting time from 74.94 min to 20.24 min. In addition, the system became more efficient, increasing its overall average efficiency from 37.91 percent to 69.54 percent. Additionally, this decrease in waiting time resulted in a decrease in the number of patients admitted to the ED at one time from 24 to 14, thereby alleviating overcrowding. Both laboratory and physician assessment processes accelerated significantly. The laboratory process’s wait time has decreased from 50.8 min to about 9.1 min, and the physician evaluation process’s wait time has been cut from 25.7 min to less than one minute. The average waiting time for the other processes, on the other hand, is not significantly different. Physicians are the major resource and healthcare system bottlenecks. However, there is only one physician, and this single resource performs any task that the physician requests, authorizes, or performs. However, the number of patients admitted to the ED was far greater than the number of patients who received prompt assistance or attention. Therefore, improvement ideas must focus on physician assessment. Thus, the quantity of resources allocated to the physician assessment process should be adjusted daily, according to the number of patients admitted to the ED. This research is based on a single case study conducted in a Pediatric Hospital Emergency Department in Jordan; thus, generalizing the specific findings of this study is limited. However, the approach adopted, and the insights gained from this study, can be extensively applicable.
This study’s findings can be enhanced further by employing optimization models for multiple-period scheduling of patients in emergency rooms and intensive care units. These scheduling and sequencing optimization models may be of significant use for decision makers and planners in facilitating coordination among available hospital resources to offer high-quality services.
Author Contributions
Conceptualization, M.Z.M., M.D.A.-T. and S.H.A.-N.; data curation, M.Z.M. and M.D.A.-T.; formal analysis, S.H.A.-N.; investigation, S.H.A.-N.; methodology, M.Z.M., M.D.A.-T. and S.H.A.-N.; project administration, M.Z.M. and M.D.A.-T.; resources, M.Z.M., M.D.A.-T. and S.H.A.-N.; software, S.H.A.-N.; supervision, M.Z.M. and M.D.A.-T.; validation, M.Z.M. and S.H.A.-N.; visualization, M.Z.M. and M.D.A.-T.; writing—original draft, M.Z.M. and S.H.A.-N.; writing—review and editing, M.Z.M., M.D.A.-T. and S.H.A.-N. All authors have read and agreed to the published version of the manuscript.
Funding
This research received no external funding.
Institutional Review Board Statement
Not applicable.
Informed Consent Statement
Informed consent was obtained from all subjects involved in the study.
Data Availability Statement
The datasets generated during and/or analyzed during the current study are available from the corresponding author on reasonable request.
Conflicts of Interest
The authors declare no conflict of interest.
References
- Salway, R.; Valenzuela, R.; Shoenberger, J.; Mallon, W.; Viccellio, A. Emergency department (ED) overcrowding: Evidence-based answers to frequently asked questions. Rev. Méd. Clín. Condes 2017, 28, 213–219. [Google Scholar] [CrossRef]
- Kennebeck, S.S.; Timm, N.L.; Kurowski, E.M.; Byczkowski, T.L.; Reeves, S.D. The Association of Emergency Department Crowding and Time to Antibiotics in Febrile Neonates. Acad. Emerg. Med. 2011, 18, 1380–1385. [Google Scholar] [CrossRef] [PubMed]
- Sills, M.R.; Fairclough, D.; Ranade, D.; Kahn, M.G. Emergency Department Crowding Is Associated with Decreased Quality of Care for Children with Acute Asthma. Ann. Emerg. Med. 2011, 57, 191–200.e7. [Google Scholar] [CrossRef]
- Michelson, K.A.; Monuteaux, M.C.; Stack, A.M.; Bachur, R.G. Pediatric Emergency Department Crowding Is Associated with a Lower Likelihood of Hospital Admission. Acad. Emerg. Med. 2012, 19, 816–820. [Google Scholar] [CrossRef]
- Shenoi, R.P.; Ma, L.; Jones, J.; Frost, M.; Seo, M.; Begley, C.E. Ambulance Diversion as a Proxy for Emergency Department Crowding: The Effect on Pediatric Mortality in a Metropolitan Area. Acad. Emerg. Med. 2009, 16, 116–123. [Google Scholar] [CrossRef] [PubMed]
- Guttmann, A.; Schull, M.J.; Vermeulen, M.J.; Stukel, T.A. Association between waiting times and short term mortality and hospital admission after departure from emergency department: Population based cohort study from Ontario, Canada. BMJ 2011, 342, d2983. [Google Scholar] [CrossRef]
- Cha, W.C.; Shin, S.D.; Cho, J.S.; Song, K.J.; Singer, A.J.; Kwak, Y.H. The Association Between Crowding and Mortality in Admitted Pediatric Patients From Mixed Adult-Pediatric Emergency Departments in Korea. Pediatr. Emerg. Care 2011, 27, 1136–1141. [Google Scholar] [CrossRef]
- Richardson, D.B. Increase in patient mortality at 10 days associated with emergency department overcrowding. Med. J. Aust. 2006, 184, 213–216. [Google Scholar] [CrossRef]
- USAID. Princess Rahma Pediatric Hospital Expansion. 2021. Available online: https://2017-2020.usaid.gov/jordan/fact-sheets/princess-rahma-pediatric-hospital-expansion (accessed on 3 April 2021).
- Vázquez-Serrano, J.I.; Peimbert-García, R.E.; Cárdenas-Barrón, L.E. Discrete-Event Simulation Modeling in Healthcare: A Comprehensive Review. Int. J. Environ. Res. Public Health 2021, 18, 12262. [Google Scholar] [CrossRef]
- Srinivas, S.; Nazareth, R.P.; Ullah, S. Modeling and analysis of business process reengineering strategies for improving emergency department efficiency. Simulation 2021, 97, 3–18. [Google Scholar] [CrossRef]
- Wang, R.; Wu, N.C.; Yu, X.L. Design of Digital Aerial Photography System for Unmanned Aerial Vehicle Based on Wireless Sensor Network. Jordan J. Mech. Ind. Eng. 2020, 14, 25–36. [Google Scholar]
- Bedoya-Valencia, L.; Kirac, E. Evaluating alternative resource allocation in an emergency department using discrete event simulation. Simulation 2016, 92, 1041–1051. [Google Scholar] [CrossRef]
- Baril, C.; Gascon, V.; Vadeboncoeur, D. Discrete-event simulation and design of experiments to study ambulatory patient waiting time in an emergency department. J. Oper. Res. Soc. 2019, 70, 2019–2038. [Google Scholar] [CrossRef]
- Komashie, A.; Mousavi, A. Modeling Emergency Departments Using Discrete Event Simulation Techniques. In Proceedings of the 37th Conference on Winter Simulation Conference, Orlando, FL, USA, 4 December 2005; p. 5. [Google Scholar]
- Baia Medeiros, D.T.; Hahn-Goldberg, S.; Aleman, D.M.; O’Connor, E. Planning capacity for mental health and addiction services in the emergency department: A discrete-event simulation approach. J. Healthc. Eng. 2019, 2019, 8973515. [Google Scholar] [CrossRef]
- Aliyu, A.I.; Sulaiman, T.A.; Yusuf, A. Modeling and simulation analysis of health care appointment system using ARENA. Int. J. Sci. Appl. Inf. Technol. 2015, 4, 1–7. [Google Scholar]
- Uriarte, A.G.; Zúñiga, E.R.; Moris, M.U.; Ng, A.H. How can decision makers be supported in the improvement of an emergency department? A simulation, optimization and data mining approach. Oper. Res. Health Care 2017, 15, 102–122. [Google Scholar] [CrossRef]
- Xiong, W.; Bair, A.; Sandrock, C.; Wang, S.; Siddiqui, J.; Hupert, N. Implementing Telemedicine in Medical Emergency Response: Concept of Operation for a Regional Telemedicine Hub. J. Med. Syst. 2012, 36, 1651–1660. [Google Scholar] [CrossRef]
- Vile, J.L.; Allkins, E.; Frankish, J.; Garland, S.; Mizen, P.; Williams, J.E. Modelling patient flow in an emergency department to better understand demand management strategies. J. Simul. 2017, 11, 115–127. [Google Scholar] [CrossRef]
- De Boeck, K.; Carmen, R.; Vandaele, N. Needy boarding patients in emergency departments: An exploratory case study using discrete-event simulation. Oper. Res. Health Care 2019, 21, 19–31. [Google Scholar] [CrossRef]
- Rachuba, S.; Salmon, A.; Zhelev, Z.; Pitt, M. Redesigning the diagnostic pathway for chest pain patients in emergency departments. Health Care Manag. Sci. 2018, 21, 177–191. [Google Scholar] [CrossRef]
- Zeinali, F.; Mahootchi, M.; Sepehri, M.M. Resource planning in the emergency departments: A simulation-based metamodeling approach. Simul. Model. Pract. Theory 2015, 53, 123–138. [Google Scholar] [CrossRef]
- Lim, M.E.; Worster, A.; Goeree, R.; Tarride, J. Simulating an emergency department: The importance of modeling the interactions between physicians and delegates in a discrete event simulation. BMC Med. Inform. Decis. Mak. 2013, 13, 59. [Google Scholar] [CrossRef] [PubMed]
- Feng, Y.-Y.; Wu, I.-C.; Chen, T.-L. Stochastic resource allocation in emergency departments with a multi-objective simulation optimization algorithm. Health Care Manag. Sci. 2017, 20, 55–75. [Google Scholar] [CrossRef] [PubMed]
- Choon, O.H.; Dali, Z.; Beng, P.T.; Magdalene, C.P.Y. Uncovering effective process improvement strategies in an emergency department using discrete event simulation. In Operational Research for Emergency Planning in Healthcare: Volume 1; The OR Essentials Series; Palgrave Macmillan: London, UK, 2016; pp. 139–163. [Google Scholar] [CrossRef]
- Gul, M.; Guneri, A.F. A computer simulation model to reduce patient length of stay and to improve resource utilization rate in an emergency department service system. Int. J. Ind. Eng. 2012, 19, 221–231. [Google Scholar]
- Peng, Q.; Yang, J.; Strome, T.; Weldon, E.; Chochinov, A. Evaluation of physician in triage impact on overcrowding in emergency department using discrete-event simulation. J. Proj. Manag. 2020, 5, 211–226. [Google Scholar] [CrossRef]
- Jat, M.N.; Rafique, R.A. Mass-Casualty Distribution for Emergency Healthcare: A Simulation Analysis. Int. J. Disaster Risk Sci. 2020, 11, 364–377. [Google Scholar] [CrossRef]
- Atalan, A.; Dönmez, C.C. Optimizing experimental simulation design for the emergency departments. Braz. J. Oper. Prod. Manag. 2020, 17, 1–13. [Google Scholar] [CrossRef]
- Valipoor, S.; Hatami, M.; Hakimjavadi, H.; Akçalı, E.; Swan, W.A.; De Portu, G. Data-Driven Design Strategies to Address Crowding and Boarding in an Emergency Department: A Discrete-Event Simulation Study. HERD Health Environ. Res. Des. J. 2020, 14, 161–177. [Google Scholar] [CrossRef]
- Habidin, N.F.; Yahya, N.Z.; Ramli, M.F.S. Using LSS DMAIC in improving emergency department waiting time. Int. J. Pharm. Sci. Rev. Res. 2015, 35, 151–155. [Google Scholar]
- Hussein, N.A.; Abdelmaguid, T.F.; Tawfik, B.S.; Ahmed, N.G. Mitigating overcrowding in emergency departments using Six Sigma and simulation: A case study in Egypt. Oper. Res. Health Care 2017, 15, 1–12. [Google Scholar] [CrossRef]
- Al Owad, A.; Samaranayake, P.; Karim, A.; Ahsan, K.B. An integrated lean methodology for improving patient flow in an emergency department—Case study of a Saudi Arabian hospital. Prod. Plan. Control. 2018, 29, 1058–1081. [Google Scholar] [CrossRef]
- Bal, A.; Ceylan, C.; Taçoğlu, C. Using value stream mapping and discrete event simulation to improve efficiency of emergency departments. Int. J. Health Manag. 2017, 10, 196–206. [Google Scholar] [CrossRef]
- Furterer, S.L. Applying Lean Six Sigma methods to reduce length of stay in a hospital’s emergency department. Qual. Eng. 2018, 30, 389–404. [Google Scholar] [CrossRef]
- Moon, Y.B. Simulation modelling for sustainability: A review of the literature. Int. J. Sustain. Eng. 2017, 10, 2–19. [Google Scholar] [CrossRef]
- Jirasukprasert, P.; Garza-Reyes, J.A.; Soriano-Meier, H.; Rocha-Lona, L. A case study of defects reduction in a rubber gloves manufacturing process by applying Six Sigma principles and DMAIC problem solving methodology. In Proceedings of the 2012 International Conference on Industrial Engineering and Operations Management, Istanbul, Turkey, 3–6 July 2012; pp. 3–6. [Google Scholar]
- Arafeh, M.; Barghash, M.A.; Haddad, N.; Musharbash, N.; Nashawati, D.; Al-Bashir, A.; Assaf, F. Using Six Sigma DMAIC Methodology and Discrete Event Simulation to Reduce Patient Discharge Time in King Hussein Cancer Center. J. Healthc. Eng. 2018, 2018, 3832151. [Google Scholar] [CrossRef]
- Mingers, J.; Rosenhead, J. Problem structuring methods in action. Eur. J. Oper. Res. 2004, 152, 530–554. [Google Scholar] [CrossRef]
- De Mast, J.; Lokkerbol, J. An analysis of the Six Sigma DMAIC method from the perspective of problem solving. Int. J. Prod. Econ. 2012, 139, 604–614. [Google Scholar] [CrossRef]
- Rathi, R.; Vakharia, A.; Shadab, M. Lean six sigma in the healthcare sector: A systematic literature review. Mater. Today Proc. 2022, 50, 773–781. [Google Scholar] [CrossRef]
- Tlapa, D.; Franco-Alucano, I.; Limon-Romero, J.; Baez-Lopez, Y.; Tortorella, G. Lean, Six Sigma, and Simulation: Evidence from Healthcare Interventions. Sustainability 2022, 14, 16849. [Google Scholar] [CrossRef]
- Samanta, A.K.; Varaprasad, G.; Gurumurthy, A. Implementing lean six sigma in health care: A review of case studies. Int. J. Lean Six Sigma 2022. ahead-of-print. [Google Scholar] [CrossRef]
- McDermott, O.; Antony, J.; Bhat, S.; Jayaraman, R.; Rosa, A.; Marolla, G.; Parida, R. Lean Six Sigma in Healthcare: A Systematic Literature Review on Challenges, Organisational Readiness and Critical Success Factors. Processes 2022, 10, 1945. [Google Scholar] [CrossRef]
- Trakulsunti, Y.; Antony, J.; Edgeman, R.; Cudney, B.; Dempsey, M.; Brennan, A. Reducing pharmacy medication errors using Lean Six Sigma: A Thai hospital case study. Total. Qual. Manag. Bus. Excel. 2022, 33, 664–682. [Google Scholar] [CrossRef]
- Peimbert-García, R.E.; Gutiérrez-Mendoza, L.M.; García-Reyes, H. Applying Lean Healthcare to Improve the Discharge Process in a Mexican Academic Medical Center. Sustainability 2021, 13, 10911. [Google Scholar] [CrossRef]
Figure 1.
Frequencies of DES approaches used in applied research papers. Source: adapted from [
10].
Figure 1.
Frequencies of DES approaches used in applied research papers. Source: adapted from [
10].
Figure 2.
The integrated methodology used in this research.
Figure 2.
The integrated methodology used in this research.
Figure 3.
SIPOC Analysis.
Figure 3.
SIPOC Analysis.
Figure 4.
General process flow chart.
Figure 4.
General process flow chart.
Figure 5.
The constructed model using Arena software.
Figure 5.
The constructed model using Arena software.
Figure 6.
The paths of patients flow in PRPH’s emergency department with its associated probabilities.
Figure 6.
The paths of patients flow in PRPH’s emergency department with its associated probabilities.
Figure 7.
Comparison between the actual and simulated model in the number of patients served by the system.
Figure 7.
Comparison between the actual and simulated model in the number of patients served by the system.
Figure 8.
The performance measure for the current state performance evaluation.
Figure 8.
The performance measure for the current state performance evaluation.
Figure 9.
Comparison between the current state and improved state regarding the waiting time per process.
Figure 9.
Comparison between the current state and improved state regarding the waiting time per process.
Figure 10.
Summary report for the physician waiting time in the current state.
Figure 10.
Summary report for the physician waiting time in the current state.
Figure 11.
Summary report for the physician waiting time in the improved state.
Figure 11.
Summary report for the physician waiting time in the improved state.
Figure 12.
Comparison between the current state and improved state regarding the waiting time variability for the physician assessment process.
Figure 12.
Comparison between the current state and improved state regarding the waiting time variability for the physician assessment process.
Figure 13.
Bar chart of the average total time for the current state model.
Figure 13.
Bar chart of the average total time for the current state model.
Figure 14.
Comparison between the current state and improved state regarding the process cycle efficiency.
Figure 14.
Comparison between the current state and improved state regarding the process cycle efficiency.
Figure 15.
Comparison between the current state and improved state regarding instantaneous utilization.
Figure 15.
Comparison between the current state and improved state regarding instantaneous utilization.
Table 1.
Lean tools in healthcare in developing countries.
Table 1.
Lean tools in healthcare in developing countries.
| Reference | Authors and Year | Main Findings |
|---|
| [42] | Rathi, et al. (2022) | This study conducts a systematic review of the Lean Six Sigma research projects that have been carried out in the healthcare industry. It was shown that whereas most studies targeted management processes, very few studies were devoted to enhancing medical processes. |
| [43] | Tlapa, et al. (2022) | Healthcare services have seen an increase in dual interventions that combine Lean, Six Sigma, and simulation modeling in the Industry 4.0 age. This systematic review, which emphasizes evidence-based practice, intends to assess the effects of these dual interventions on healthcare services and offer insights into the paradigms and tools that yield the most effective outcomes. |
| [44] | Samanta, et al. (2022) | Lean Six Sigma (LSS) technique is used by healthcare organizations to improve performance in terms of cost, quality, and productivity. To grasp the intricacies of implementation and determine future research paths, this paper reviews case studies describing the adoption of LSS in healthcare organizations. |
| [45] | McDermott, et al. (2022) | The purpose of this article is to discuss the difficulties, crucial success factors (CSFs), readiness criteria, and most popular tools and deployment methods for Lean Six Sigma (LSS) in the healthcare industry. This study shows how LSS has been successfully implemented in the healthcare industry. |
| [46] | Trakulsunti, et al. (2022) | This study looks at how Lean Six Sigma can be used to decrease inpatient pharmacy dispensing errors in a public hospital in Thailand. Such a case study can raise hospital administrators’ and medical directors’ understanding of Lean Six Sigma and its advantages in terms of medication avoidance and reduction. |
| [47] | Peimbert, et al. (2022) | This paper describes the application of Lean in a public academic medical center in Mexico. The time needed to discharge patients from the Internal Medicine Department was to be significantly improved. This non-experimental intervention study used a time study, value-added/non-value-added analysis, to measure, analyze, and enhance the process flow. |
Table 2.
Project charter.
Table 2.
Project charter.
| Project Overview | This project focuses on simulating PRPH’s emergency department and using six-sigma tools to improve patient waiting time. |
| Problem Definition | The long waiting time in the PRPH’s emergency department, which restricts the urgent cases’ quick service. |
| Project Goals | - -
Improve waiting time (the non-value-added time that the patients experience in their visit to the ED). - -
Enhance system efficiency (ratio of value-added time to the LOS). - -
Enhance process efficiency (ratio of value-added time to the total time in the process). - -
Improve utilization of resources (the usage percentage of the resources per day in the ED). - -
Reduce patient’s length of stay (the time that the patient stays inside the ED from arrival until discharge).
|
| Project Scope | Within PRPH’s emergency department, all processes will be included (registration, triage, physician assessment, nurse handling, radiology, laboratory tests, accounting, and pharmacy). |
Table 3.
Critical to satisfaction characteristics.
Table 3.
Critical to satisfaction characteristics.
| Title | Description (Definition) |
|---|
| Patient’s Waiting Time | The time spent by the patient without being processed (non-value-added time) |
| Patient’s Length of Stay | The total time patient spends in the emergency department from arrival until discharge, including service and waiting times |
| Overcrowding in the ED | Number of patients receiving treatment in the hospital emergency department |
Table 4.
Number of patients who came to PRPH’s emergency department with their acuity level index.
Table 4.
Number of patients who came to PRPH’s emergency department with their acuity level index.
Acuity Level
Index | 1 | 2 | 3 | 4 | 5 | Total |
|---|
| Description | Life
threatening | Urgent | Serious | Medium
serious | Unserious | |
| # of patients | 30 | 263 | 4285 | 7117 | 2836 | 14,531 |
| % of the total | 0.21% | 1.81% | 29.49% | 48.98% | 19.51% | 100% |
Table 5.
Processes with their action type and service time distribution.
Table 5.
Processes with their action type and service time distribution.
| Process | Action Type | Service Time Distribution (in Minutes) |
|---|
| Registration | Seize delay release | 0.5 + GAMM (0.863, 3.19) |
| Triage | Seize delay release | 0.5 + 10 (BETA (3.91, 14.1)) |
| 1st Physician assessment | Seize delay release | 13 (BETA (1.77, 4.11)) |
| Nurse handling | Seize delay release | 1.5 + 17 (BETA (1.83, 2.92)) |
| Delay in nurse room | Delay | Based on sequence |
| Accounting | Seize delay release | 0.5 + WEIB (2.06, 2.7) |
| Radiology | Seize delay release | EXPO (7.01) |
| Laboratory tests | Seize delay release | CONT (0.09, 15, 0.75, 33, 1, 105) |
| 2nd Physician assessment | Seize delay release | LOGN (2.35, 1.35) |
| Pharmacy | Seize delay release | EXPO (3) |
Table 6.
The resources available in PRPH’s emergency department details.
Table 6.
The resources available in PRPH’s emergency department details.
| Resource | Process/es That Performed | Available Units
per Shift |
|---|
| A | B | C |
|---|
| Registrar | Registration | 1 | 2 | 2 |
| Triage Nurse | Triage | 1 | 1 | 1 |
| Physician | 1st and 2nd Physician Assessment | 1 | 1 | 1 |
| Nurse | Nurse Handling | 2 | 2 | 2 |
| Accountant | Accounting | 1 | 1 | 1 |
| Radiologist | Radiology | 1 | 1 | 1 |
Laboratory Technician and
Device | Laboratory Tests | 3 | 3 | 3 |
| Pharmacist | Pharmacy | 1 | 1 | 1 |
Table 7.
Patient’s time in the system in the current state.
Table 7.
Patient’s time in the system in the current state.
| Time | Value-Added Time | Wait Time | Transfer Time | Total Time |
|---|
| Average | 45.75 min | 74.94 min | 9.1 min | 129.79 min |
Table 8.
The configuration of resources in the proposed scenarios.
Table 8.
The configuration of resources in the proposed scenarios.
| Resources | Physician | Registration | Laboratory | Radiology |
|---|
| | Shift | A | B | C | A | B | C | A | B | C | A | B | C |
| Scenario | |
| Current state | 1 | 1 | 1 | 1 | 2 | 2 | 3 | 3 | 3 | 1 | 1 | 1 |
| 1 | 2 | 2 | 2 | 1 | 1 | 1 | 4 | 4 | 3 | 1 | 1 | 1 |
| 2 | 2 | 2 | 2 | 1 | 1 | 1 | 4 | 4 | 3 | 2 | 2 | 1 |
| 3 | 2 | 2 | 2 | 1 | 1 | 1 | 4 | 4 | 4 | 1 | 1 | 1 |
| 4 | 2 | 2 | 2 | 1 | 2 | 2 | 4 | 4 | 4 | 1 | 1 | 1 |
Table 9.
Number of patients who enter and discharge from the system.
Table 9.
Number of patients who enter and discharge from the system.
| Process | Number in | Number out | Ratio (out/in) |
|---|
| Accounting | 423.5 | 422.26 | 1.00 |
| Laboratory | 120.47 | 108.45 | 0.90 |
| Nursing | 191.77 | 190.5 | 0.99 |
| Pharmacy | 194.58 | 193.85 | 1.00 |
| Physician | 404.74 | 395.19 | 0.98 |
| Radiology | 107 | 105.55 | 0.99 |
| Registration | 261.53 | 260.79 | 1.00 |
| Triage | 260.79 | 260.15 | 1.00 |
Table 10.
Causes of variability in the service and waiting times of each process.
Table 10.
Causes of variability in the service and waiting times of each process.
Physician
Assessment
process | |
- 2.
Sometimes, many people in the physician’s room distract the physician’s concentration, which will increase physician assessment service time.
|
- 3.
Medical students are present in the physician’s room.
|
- 4.
The presence of representatives of pharmaceutical companies in the emergency department to promote medicines through the physician.
|
- 5.
The patient’s family wrongly understands the ED job. They come to it in situations that are not urgent and even insignificant.
|
- 6.
The patient’s family comes for a second physician assessment before the laboratory test results are released/ready.
|
- 7.
Conflicts between medical staff and patient’s family in some cases.
|
- 8.
The patient is going back to the physician because medicine is not available in the pharmacy, or the patient’s family cannot read the prescription.
|
| Registration | |
- 2.
Sometimes weakness of internet connections.
|
- 3.
Maintenance and updates of Hakeem Information System.
|
| Triage | |
| Other | |
- 2.
The absence of some employees from their work site when there are no patients led to queue at their stations.
|
Table 11.
Possible solutions to reduce the variability in the service and waiting time.
Table 11.
Possible solutions to reduce the variability in the service and waiting time.
Physician
Assessment
Process | |
- 2.
Preventing the admission of more than one case to the physician at the same time and restricting the admission to one companion for each patient.
|
- 3.
Students should come during off-peak times.
|
- 4.
Patients ask the pharmaceutical company representatives to come to the physician when they are not in the ED.
|
- 5.
It increases people’s awareness about the function of the emergency department/hanging signs at the EDs entrances containing an explanation of the emergency’s purpose and the difference between its job and that of the specialty clinics.
|
- 6.
Educating people about the EDs job reduces disputes.
|
- 7.
The medical staff should have patience.
|
- 8.
Linking the medicine stock in the pharmacy with the Hakeem system so that the physician knows in advance if the medicine is available or not.
|
- 9.
Explain the method of taking medicine clearly to the patient’s family before leaving the physician’s room.
|
| Registration | |
- 2.
It is crucial to provide an excellent quality internet subscription for the ED.
|
- 3.
It is crucial to postpone the maintenance and updating of the system to days or times when there are not many patients.
|
- 4.
Carrying out preventive maintenance for the devices.
|
| Triage | |
| Other | |
- 2.
Increase employees’ commitment to their worksites throughout their working hours.
|
Table 12.
Comparison between the current state and improved state.
Table 12.
Comparison between the current state and improved state.
| State | Average
Time | Wait
Time | Total
Time | Number
in | Number
out | Number
PUT |
|---|
| Current (C) | 45.75 min | 74.94 min | 129.79 min | 262 | 232 | 24 |
| Improved (I) | 46.22 min | 20.24 min | 75.65 min | 262 | 247 | 14 |
| Ratio (I/C) | 1.01 | 0.27 | 0.58 | 1.00 | 1.06 | 0.58 |
| Disclaimer/Publisher’s Note: The statements, opinions and data contained in all publications are solely those of the individual author(s) and contributor(s) and not of MDPI and/or the editor(s). MDPI and/or the editor(s) disclaim responsibility for any injury to people or property resulting from any ideas, methods, instructions or products referred to in the content. |
© 2023 by the authors. Licensee MDPI, Basel, Switzerland. This article is an open access article distributed under the terms and conditions of the Creative Commons Attribution (CC BY) license (https://creativecommons.org/licenses/by/4.0/).


