Abstract
This paper aims to provide an overview of the fundamentals, development, and evolution of residence time distribution (RTD) methodology and its applications to the flow and mixing of fluids (and solid particles) modeling in different systems. A concise literature analysis is followed by a succinct presentation of RTD methodology’s experimental and theoretical foundations and RTD-based mathematical modeling, highlighting its importance. An experimental demonstration of RTD diagnostics on a photochemical reactor is performed to identify the most practical locations for the inlet/outlet pipes (axial or radial) and the photochemical reactor’s ideal working posture (horizontal, vertical, or inclined) and to understand the level of mixing and to determine the fluid flow defects. Using the relevant RTD functions and the corresponding central moments, it was possible to show that short circuits and dead zones occurred in each of the six considered reactor configurations. Following these investigations, design solutions were proposed to achieve a convenient exposure time, proper mixing, and uniform irradiation inside the reactor.
1. Introduction
The flow behavior of materials inside reactors or other flow systems can be studied using residence time distribution (RTD). Processes and systems can experience delays, mixing, and other effects that can be analyzed using RTD, which measures the time it takes for a fluid or solid particle to travel through the system. The method’s fundamental premise is that the individual fluid elements or particles spend different amounts of time inside a reactor or system. The residence times can be statistically examined using probability distribution functions. For the RTD methodology, three main stages may be identified: (i) experimental, (ii) statistical analysis, and (iii) mathematical modeling. In the experimental stage, a tracer material is typically injected into the system, and its concentration is measured as a function of time from its insertion to its complete exit from the system. The resulting concentration-time plot serves as the starting point for the following phase—statistical analysis. Statistical functions (e.g., probability density function, cumulative distribution function) are employed at this stage to assess the experimental data and derive valuable parameters (e.g., mean residence time, variance) to explain the flow and/or mixing behavior. Ideal and non-ideal mathematical models are further developed to simulate, compare, and/or predict fluid flow and mixing and reaction yields (for known kinetics) [1].
RTD technology was initially developed for chemical reactors, but its scope was quickly broadened to include virtually any industry where material flow and/or mixing are involved. Given its foundation and historical evolution, RTD can be called a “mature” method. Nevertheless, it is far from being complete or outdated, with new models and applications reported on a regular basis in the literature.
The current work is structured as follows: (i) a quick overview of the history and uses of RTD methods; (ii) a succinct explanation of the fundamentals of the tracer methodology; (iii) a brief presentation of the main RTD functions and central moments; (iv) a short introduction in RTD based mathematical modeling; and (v) a case study: RTD diagnosis for a photochemical reactor, followed by some practical solutions addressing the position of inlet/outlet reactor pipes.
2. RTD Development: Defining Moments in Time, Representative Works, Current Trends
There is a debate about the implementation of residence time distribution. According to some authors [2,3,4,5], the genuine pioneers of this method were MacMullin and Weber in 1935 [6]. A few authors [7,8] go back in science history to attribute the first attempts to study fluid flow to Irving Langmuir in 1908 [9]. Many others [5,10,11,12] credit Dankwerts, in 1953, with developing the method, as he was the one who devised the mathematical foundation [13]. The RTD approach was improved [14,15,16,17,18], critically analyzed [19,20], revisited [10,21], and reviewed [4,7,22,23] in the 70 years that followed Dankwerts’ study, and its applications were expanded to a wide range of areas. Table S1 presents the historical progress and an analysis of the RTD method.
It is considered that the RTD procedure was fully developed at the end of the 1990s. Moreover, as Dudukovic remarked in his study “Tracer methods in chemical reactors; Techniques and applications” [11], for more than 50 years, the RTD methodology has been covered in standard chemical reaction engineering textbooks (Table S2).
The methodology developed to describe the flow of fluids in chemical reactors has since spread and been used in other fields. It is used nowadays not only to describe fluid flow but also to describe mixing and solid flow. Several reviews written after the 1990s enumerate and highlight the tremendous development of this approach (examples in Table S3).
Over 1600 articles dealing with “residence time distribution” were indexed by the Web of Science Core Collection between 2016 and 2017, according to a review published by Berard et al. [3]. Using the SCOPUS platform and the VOSviewer software version 1.6.19 we conducted a similar bibliometric search (Figure 1) that yielded 464 results for “residence time distribution” search term in title/abstract/keywords for the year 2022 alone. The five significant clusters identified by VOSviewer were residence time distribution, residence time, particle size, retention time, and hydrodynamics.
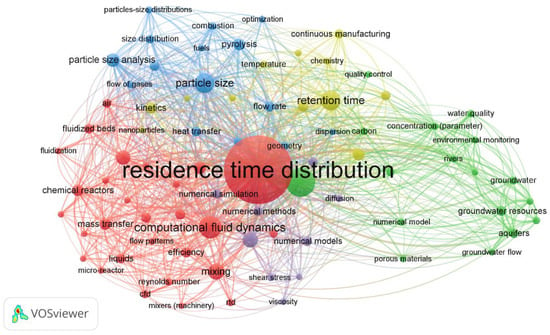
Figure 1.
The bibliometric map for “residence time distribution” for 2022 using SCOPUS.
Nowadays, the applications of RTD go far beyond the mathematical modeling of chemical reactors. The information revealed by statistical residence time analysis has found various applications in different fields. Few examples include: (i) fluids and particulate solids [24] flow and mix through various systems, from small laboratory scale [25] to large industrial applications [26,27], from human body [28] to geological studies [29]; (ii) equipment design—reactors (vessels) sizing [30], reaction yield predictions [31]; (iii) diagnosis and troubleshooting for existing systems [27]; and (iv) experimental validation of software modeling [32,33].
The RTD methodology and the RTD-based mathematical modeling are still developing [34,35,36]. Various authors frequently propose new models in different domains [37,38,39]. Even though powerful computational modeling methods (e.g., computational fluid dynamics—CFD) have been developed since the appearance of RTD, these still require experimental validation, usually performed using tracer experiments [40,41,42].
3. Tracer Methodology Fundamentals
Tracer methodology (Figure 2) is a powerful tool for studying the behavior of fluids and/or particles in complex systems. Although numerous approaches have been suggested throughout the years, there is still a debate on the accuracy of this methodology [10,11,19,43]. The procedure was extensively described by Octave Levenspiel [44]. However, there are still issues related to the type of the tracer, how it is inserted into the flow, the vessel boundaries, and how its signal is detected and eventually converted to finally plot the concentration vs. time curve (the C-curve) [7,45,46,47,48]. In brief, the tracer methodology is an experimental procedure that introduces a known amount of tracer into a system and measures its concentration over time at different points (most commonly at the exit).

Figure 2.
The principle of tracer methodology (pulse input).
3.1. Tracer Selection
Ideally, the tracer should possess similar flow properties to the material of interest and the capacity to be easily measured or detected. Moreover, the tracer must be detectable at very low concentrations, and the measurement technique must be sensitive and accurate. Since the tracer method is applied in various domains [11], including chemical engineering [3], environmental engineering [46], metallurgy [49], hydrology [48], pharmaceutics [5,50], medicine [51], and many others, there is a large variety of tracers such as electrolytes, dyes, stable or radioactive isotopes, [52] and others [3]. Conductivity, fluorescence, color, X-ray emission, or even temperature are among the properties that allow tracer detection, and most of the time, calibration curves are used to convert a specific property into tracer concentration.
The proper selection of the tracer is critical for the accuracy of the data acquisition [53]. For instance, a relatively minor difference between tracer’s and the targeted material density, viscosity, temperature etc., can generate negative or positive buoyancies [54]; a slight difference between tracer particles’ size and density can lead to powder segregation [55]; all these differences can affect the experimental results, and consequently the flow diagnosis. Although inert (non-reactive) tracers and steady flow are generally advised, attempts to study reactive tracers and unsteady flow were also reported [56,57].
3.2. Tracer Insertion
There are four ways to introduce the tracer into a system: (i) as a pulse, when a known amount of tracer is injected as fast as possible (assumed instantaneously); (ii) as a step, when a steady flow with a constant tracer concentration is introduced for a certain amount of time (iii) periodic, following a specific function (e.g., sinusoidal input) and (iv) random, arbitrary [44]. The first two methods are the most popular due to their practical and mathematical simplicity (Figure 3) [3,10,53]. The tracer amount is critical: it should be large enough to reach detection limits while remaining small enough to be injected at once or as quickly as possible.

Figure 3.
System response (dotted line) to pulse and step inputs.
3.3. System Boundaries
The principle of the tracer methodology (pulse input) is presented in Figure 2. To compute the response curve accurately, the injection/detection position should be adequately chosen (Figure 2), and the boundary conditions at both ends of the system must be known (Figure 4) [58].
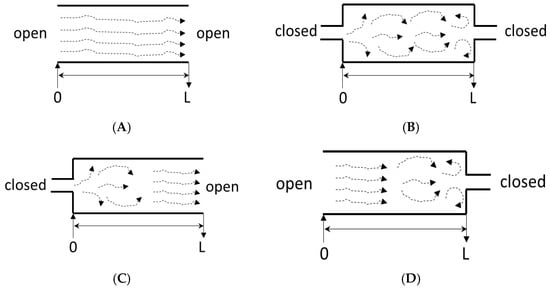
Figure 4.
System boundaries (L denotes the length of the system under consideration) (A): open–open; (B): closed–closed; (C): closed–closed; (D): open–closed.
The fluid flow in an open system is virtually unaffected as it passes through. In contrast, in a closed system, there are some fluctuations in axial dispersion at the system’s inlet and outlet (Figure 4) [3,58].
3.4. Practical Limitations
Even after selecting the proper tracer and detection method, several practical limitations are usually overcome by experiment repetition. The term “instantaneously” is relative and, from a practical point of view, impossible. During step injection, the tracer should be instantaneously and continuously introduced starting at t = 0, while for pulse input, the entire amount of tracer should be instantaneously introduced at t = 0 [3]. The injection time depends on the tracer amount, which directly affects the detection limit, a severe limitation of tracer methodology [59]. The detector response and sensitivity are crucial when conversion to concentration is achieved. The sudden injection causes jet formation that may affect the tracer dispersion and possibly the flow in the analyzed system, inducing perturbations. The relative position of the injection vs. detection points towards the system boundaries may also affect the experimental accuracy [59].
4. RTD Functions and Central Moments
Four functions and four central moments can be used for calculating residence-time distributions (Figure 5). However, only two functions and two central moments (red in Figure 5) are commonly used for simple flow diagnosis.
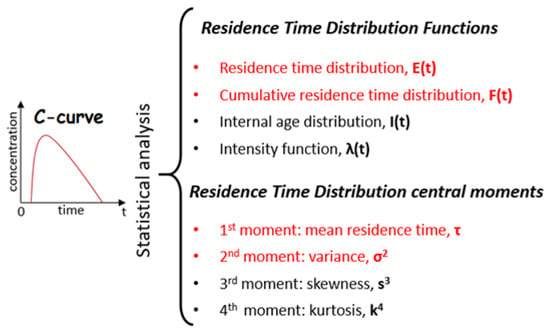
Figure 5.
RTD statistical analysis.
4.1. Residence Time, Space-Time, Mean Residence Time, and Dimensionless Time
The foundation of RTD statistical analysis is the straightforward observation that the fluid elements simultaneously entering a system may spend different periods before leaving the system. From this perspective, the concepts of age, life expectancy, and residence time of a fluid element are easily comprehensible. The existence of fluid populations of a specific age or a certain life expectancy gives meaning to the mean residence time concept. The statistical study of all residence periods at or after a given time provides essential details regarding the fluid flow and mixing intensity within a system.
The nominal holding time or the space-time ts (Equation (1)) is defined as the ratio between the total reactor volume (V, m3) and the volumetric flow rate of the fluid (, m3/s):
It is a common practice to use the dimensionless time (Equation (2)), given by the ratio between the actual time t and the space time [44]:
4.2. The C-Curve: C = f(t)
The C-curve displays the time evolution of the tracer concentration and provides the raw data for RTD investigation. Although often overlooked in RTD presentations, it is the first and most crucial function established exclusively experimentally using the tracer methodology. The precision with which the concentration vs. time dependence is plotted gives the accuracy of the subsequent RTD statistical analysis. For an experienced researcher, the shape of the C-curve can provide acceptable information about some typical flow defects (e.g., short circuits or dead zones). The time the tracer spends inside the vessel can be statistically examined using the RTD functions and their central moments. Based on the results (particular shape of a specific function and/or central moment values), fluid flow and mixing degree knowledge can be derived.
4.3. The E-Curve: E(t)
This function is known as “the residence time distribution” or “exit age distribution”. The exit age distribution considers that different fluid particles may experience different residence times within the system before exiting. It is a function of time, where E(t)∙dt represents the fraction of fluid elements leaving the system of age between t and t + dt (Figure S1), Equation (3). The units of E-curve are [time−1].
According to its definition: . The fraction of fluid elements with residence times less than t1 is given by: .
The E-curve is useful when dealing with flow diagnosis. The shape of the curve reveals essential information about potential flow defects in the analyzed system.
4.4. The F-Curve: F(t)
The fraction of fluid elements with a residence time less than t is defined as the cumulative residence time distribution function F(t). It is also the probability that a fluid element that entered at t = 0 has left the system at or by time t [60]. According to its definition, the equalities presented in Equation (4) are valid. The typical shape of the F-curve is presented in Figure S1.
Since it is defined as a fraction, it is dimensionless. According to its definition: 0 ≤ F(t) ≤ 1. The connections between E-curve and F-curve are given by Equations (5) and (6).
The F-curve is less sensitive to flow defects than the E-curve [1] but provides valuable information about the mixing degree [61].
4.5. The I-Curve: I(t)
The internal age distribution measures the distribution of fluid elements ages inside the system, not on the system’s exit as the exit age distribution. I(t)∙dt represents the fraction of fluid elements within the system, with the age between t and t + dt (Figure S1). I(t) has the same [time−1] units as the E(t) function. There are some connections between the E(t), F(t), and I(t) functions, as shown in Equation (7).
where ts is the space-time (Equation (1)):
The geometry and flow pattern of the system determines the shape of the I-curve, which is an essential tool for comprehending the behavior of fluids inside a system.
4.6. The λ-Curve: λ(t)
The intensity function λ(t) is defined such that λ(t)∙dt indicates the fraction of fluid that will leave the system in the time interval between t and t + dt or, in terms of internal ages, the fraction of fluid elements with zero life expectancy (that will immediately leave the system) [10]. The typical shape of the intensity function is presented in Figure S1. The connections between the λ(t), E(t), and F(t) functions are given by Equation (7). The intensity function allows for minimum and maximum points, frequently related to flow imperfections such as short-circuits and stagnancies. The shape of the λ-curve also provides information about the mixing degree.
4.7. Dimensionless Representation of RTD
Dimensionless time is commonly used in RTD analysis. The representation of RTD functions in terms of ϴ is known as “normalization” (Table 1). The normalization of the RTD functions allows the direct comparison of flow characteristics in different size systems [62].

Table 1.
The “normalized” expressions of the RTD functions.
4.8. The RTD Central Moments
The central moments of the RTD (Table 2) provide supplementary information about the properties of the functions. Rigorously, all moments must be determined for a complete distribution description. Commonly, the first three moments are calculated to reasonably characterize an RTD [62].

Table 2.
Central moments of residence time distribution.
The first moment gives the mean residence time of the fluid elements inside the studied vessel or system. The second moment commonly used, δ2, is taken for the mean and is called variance, or square of the standard deviation [62]. The variance indicates the mixing degree: a higher value indicates intense mixing, while a lower value indicates a lower mixing degree. Skewness, s3, is the third moment of a probability distribution that measures the distribution’s asymmetry. The fourth moment, kurtosis—k4, measures the “peakedness” or “tailedness” of the RTD. A higher kurtosis indicates a sharper peak and a narrower distribution, while a lower kurtosis indicates a flatter peak and a wider distribution.
It is critical to understand that using all functions and central moments is not always necessary. Specific functions and central moments are required, while others are optional, depending on the study’s purpose (e.g., flow diagnosis, reactor design, mixing analysis). For instance, it is not always necessary to calculate the intensity function or the skewness; a simple flow diagnosis does not necessitate such complex modeling as, for example, a second-order reaction in a mechanically stirred (autoclave) reactor.
5. RTD Based Modelling
Over time, a multitude of models were proposed by various authors in an attempt to describe the real fluid flow and/or mixing behavior. Some of these models received general recognition and nowadays represent a standard in the area [1,62,63]. Mathematical modeling uses RTD functions and central moments in conjunction with idealized models to represent fluid flow and mixing in real systems. Mathematical modeling can be extended further by integrating chemical reaction kinetics to forecast conversion and reaction yield.
5.1. The Ideal Flow Models
There are two distinct ideal flow models (Figure 6) that serve as benchmarks for fluid flow modeling: the plug flow (piston flow) and perfectly mixed flow (complete mixing) [10,44]. Each model is founded on a unique set of assumptions.

Figure 6.
Typical representations of ideal flow models: (A): completely mixed, (B): plug flow, (C): laminar flow.
5.1.1. The Plug Flow Model
This model assumes that the fluid’s velocity is constant along any pipe cross-section perpendicular to the pipe’s axis. In addition, it is assumed that the system is completely filled with fluid, the diffusion terms are negligible, the volumetric flow rate is constant, and the radial gradients are ignored. There is no mixing of earlier with later entering fluid, no overtaking, and no backmixing, eddies, or vortexes [44]. All fluid elements flowing through the system have the same residence time.
A particular derivative of the ideal plug flow model is the laminar flow (LF) model (Figure 6) [7]. The fundamental difference between them is the shape of their velocity profiles. The velocity profile for the plug flow model is flat across the cross-section, whereas for LF, the fluid velocity increases steadily towards the center, forming a parabolic velocity profile. As a result, the fluid constituents in an LF have varying residency times: those in the center leave the system first, while those along the wall leave last.
5.1.2. The Complete Mixed Flow
The model assumes that the fluid elements are always perfectly mixed inside the system. Therefore, all properties (e.g., temperature, concentration, density) are uniform inside the reactor at any given time. In addition, it is assumed that the fluid instantly and uniformly mixes with the system’s contents upon entry [44,64] and that the properties inside the system are identical to those in the outlet flow.
5.2. The Ideal Mixing Models
Although fluid flow and fluid mixing cannot be considered separately in real-world systems, two ideal mixing models were proposed for modeling purposes: the segregation model and the maximum mixedness model (Figure 7).

Figure 7.
Typical representation of the segregation and maximum mixedness models: (A): segregation model; (B): maximum mixedness model.
5.2.1. The Segregation Model
According to this model, the fluid elements move and travel independently through the system. As a result of the hypothetical boundaries that separate fluid elements, a chemical reaction can only occur inside the molecules of a fluid element and not between molecules of two distinct elements. A fluid exhibiting complete or total segregation is called a macrofluid [62].
5.2.2. The Maximum Mixedness Model
There are no boundaries among the fluid elements. In fact, there are no fluid elements. The fluid molecules, regardless of their age inside the system, are perfectly mixed, and there is no segregation at all. Such a fluid is also known as a microfluid [62].
5.2.3. The Earliness and Lateness of Mixing
Another aspect that relates to the fluid flow and mixing models is the timing of mixing (the earliness or lateness of the mixing). A single stream’s fluid elements may mix as they enter the system or later as they pass through it. The timing of mixing is crucial for systems with multiple streams (such as two reactant streams entering a chemical reactor). Gorzalski et al. [65] proposed a suggestive visual representation of earliness and lateness of mixing for a two-stream system (Figure 8).
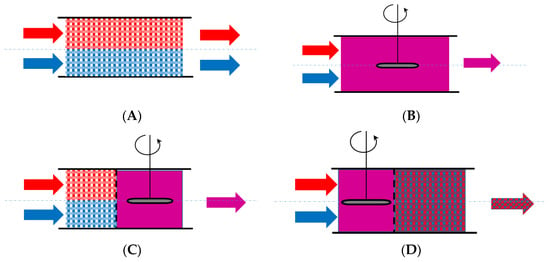
Figure 8.
Typical representations for ideal earliness or lateness of mixing: (A): perfect segregation; (B): perfect (instantaneous) mixing; (C): early segregation, late mixing; (D): early mixing, late segregation.
5.3. Flow and Mixing in Real Systems—Non-Ideal Flow
In real systems (non-ideal flow), the fluid may have complex flow patterns or exhibit mixing that is not uniform or predictable [66]. Compared to ideal models, the fluids behave differently for many reasons (such as the vessel’s geometry, the type, size, location of the inlet and outlet pipes, the mixer type, the fluids’ properties, and the fluid flow rate). The mixing degree is also affected by non-ideal flow. Some of these deviations from ideality are particularly recognized and acknowledged, such as dead zones, stagnant regions, back-mixing, short-circuits (bypasses), and preferential flows (channeling) [66].
Although the terms “dead zone” and “stagnant region” are sometimes used interchangeably in fluid flow systems, they typically refer to slightly different concepts (Figure 9). A dead zone is a portion of the system that is not filled, also known as a free volume, while a stagnant region is a part of the system where the fluid is rather stationary. Because the fluid is only slightly moving or not moving in this region, it is also known as the “dead zone”.

Figure 9.
Typical representations of flow defects.
Short-circuiting or bypassing occurs when flow elements cross the system quickly, resulting in uneven mixing and short residence times. The most common cause of this undesired flow defect is incorrect inlet–outlet pipe placement.
Preferential flow or channeling typically occurs when fluids flow through solid beds (e.g., catalysts, packed columns). The fluid follows the minimal resistance pathway. Systems of fluids with significant variations in the fluid’s properties (e.g., viscosity, density) may also exhibit preferential flow patterns.
5.4. Dimensionless Numbers: Péclet, Bodenstein, Damköhler
The Péclet (Pe) number is the ratio between convective and diffusive transport rates (Table S4). It determines whether a system’s mass transport is dominated by convection or diffusion. If Pe << 1, the mass transfer occurs mainly by the diffusion mechanism; if Pe >> 1, the mass transfer occurs mainly by the convection mechanism; if Pe = 1, both mechanisms contribute equally to mass transfer. Fogler [62] defines two Pe numbers, one to characterize the reactor—the reactor Pe (Per) and one to characterize the fluid—the fluid Pe (Pef). The Pef is commonly used in literature as the Péclet number Pe. When the characteristic length is the reactor length, and the diffusion is mainly axial, the Per is referred to as the Bodenstein number (Table S4)—typical for reactive systems [62].
Bodenstein number (Bo) is defined similarly to Per, yet the values of the Bo number usually refer only to the axial mixing intensity (backmixing). Higher Bo numbers indicate reduced axial mixing, while lower Bo numbers indicate higher mixing degrees.
Damköhler number (Da) is the ratio between reaction and convection rates [62]. If Da >> 1, the reaction rate is higher than the transport rate (the reaction is instantaneous), while if Da << 1, the time required to travel through the system exceeds the time required to complete the reaction. The expression of the Damköhler number depends on the reaction order, just as the expression of the reaction rate depends upon the reaction order (Equation (9)).
where k represents the specific reaction rate, n represents the overall reaction order, and represents the initial concentration of the reactant A.
5.5. Non-Ideal Flow and Mixing Models
According to Fogler [62] the non-ideal flow models can be grouped into two categories: (i) one parameter models, which include the tank-in-series model (Figure S2 and Table S5) and axial dispersion model including its boundaries (Figure 4) combinations (the parameter is Dax) and (ii) two parameters models, where the reactor is modeled using combinations of ideal reactors (e.g., the Cholette–Cloutier model associate a perfectly mixed tank with a dead zone and a by-pass region). Ravi [67] proposed a third group: zero model parameters (including complete segregation and maximum mixedness models).
Rodrigues [10] proposed two classes of models. First, the compartment models, where the actual models are various combinations of seven basic concepts called “nuclei”, which includes a perfectly mixed system, a plug flow system, a laminar flow system (Figure 6), and a recycle region, a by-pass region, a dead zone, and a stagnant region (Figure 9). The second category includes the dispersion models, considering axial and/or radial dispersion, backmixing, and open/closed boundaries.
The complete segregation model considers a plug-flow reactor equipped with an external evacuation system (Figure S2). The evacuation arrangement is designed so that fluid elements of different ages are not mixed until they leave the system.
The maximum mixedness model considers a plug-flow reactor equipped with an external feed system (Figure S2). The fluid particles of zero age are instantaneously mixed (as they enter the system) with fluid particles of different ages introduced upstream.
A brief description of some of the most widely held flow models is presented in Table S5.
5.6. Guidelines for Building Models for Non-Ideal Flow and Mixing Systems
Choosing a suitable model is not always an easy task. The fluids’ (and sometimes particulate solids) flow and mixing behavior depend on many factors, such as the physicochemical properties (e.g., density, viscosity), the vessel geometry, the flow rate, and the size of the analyzed system. The model selection process becomes even more complex when one or more chemical reactions occur [68]. Bodner et al. proposed 10 simple rules for tackling mathematical modeling in general [69]. A model can never be completely precise or completely imprecise. When proposing a model, it is critical to stay goal-oriented, gather all pertinent data, identify crucial and insignificant details, and avoid oversimplifying or overcomplicating the model. Fogler [62] suggests some specific guidelines to follow when developing models for non-ideal flowing systems: (i) the model goal should be “calculated” as RTD data + model + kinetics = prediction; (ii) the processes that occur in the non-ideal system must be described physically, chemically, and mathematically with reasonable accuracy; (iii) the model must be mathematically accessible; and (iv) the model should not have more than two variable parameters, except the complex systems, were more independent parameters can be identified. The last recommendation is made because an equation with more than two variables can easily fit experimental data, reducing the modeling step to curve fitting.
6. Practical Application: RTD Diagnosis of Photochemical Reactor
6.1. Problem Statement
The design of photoreactors, either homogeneous (photochemical) or heterogeneous (photocatalytic), is slightly more complicated than the design of conventional reactors [70,71]. In addition to the factors analyzed for the design of conventional chemical reactors, the design of photochemical reactors must take into account several specific factors: the radiation emission, absorption, scattering, and transmission; the radiation energy contribution to thermal balance; the photon balance and the kinetic effects of the absorbed radiation [72,73,74]. Great efforts have been made to develop a standard methodology for photoreactors modeling, design, and scale-up [71,75], and a few distinct classes of photoreactors were acknowledged [75,76,77,78,79].
Among all types of photoreactors, annular photochemical reactors are the most frequently used to perform photochemically enhanced advanced oxidation processes [80,81]. The reactors in this category consist of a vessel in which one or more UV lamps are located in various positions, usually parallel with the vessel axis of symmetry, to irradiate the reaction mass as uniformly as possible. Adequate materials (e.g., quartz), having good UV transparency and mechanical resistance, are used to protect the lamps.
There are two crucial aspects to consider while designing an annular photochemical reactor: the homogeneity of the radiation field and the reactor hydrodynamics [82,83,84]. The number and arrangement of the lamps inside the reactor equally affect the radiation intensity [80] and the mass reaction hydrodynamics [85,86,87]. In a real-life reactor, from practical considerations, the number of lamps is quite limited, from 1 up to 7, and rarely 10 [88]. The arrangement follows the corresponding geometrical shape (e.g., equilateral triangle, square, pentagon, hexagon, and so on) or circularly, with or without a central lamp, to produce a uniform irradiation field [86]. In computer-simulated analysis, the number of lamps can grow significantly from 1 to 63 [84].
Additional issues that significantly affect the flow pattern inside the reactor, besides the lamp’s number and arrangement, are the inlet/outlet geometry and relative position towards the reactor’s axe of symmetry [87,89,90,91,92]. Several technical solutions exist regarding the inlet/outlet position and geometry [83]. The most common positions are: (i) parallel with the central axis of symmetry, through the reactor lid; (ii) sideways feeding, perpendicular to the axe of symmetry, through the reactor wall); and (iii) tangential on the reactor wall, through the lid or reactor wall. Recent studies [83,89] show that the tangential positioning of inlet/outlet pipes promotes a specific helical movement of the fluid around the irradiation source, increasing reactor performance due to a more effective UV exposure.
The photochemical reactor (PHR) under study is equipped with four UV-C lamps protected with quartz sleeves and designed to function horizontally, vertically, or at various inclination angles. Axial or radial (wall tangent) inlets and outlets may be used for filling and/or emptying the reactor.
This experimental study aimed to determine the optimal working position and most practical location for inlet/outlet pipes using the RTD approach. Obtaining data on the degree of mixing and fluid flow was another objective.
6.2. Materials and Methods
6.2.1. Tracer Method
The insertion of the tracer was done using the pulse procedure, as described in Section 3.2. A sodium chloride solution of 20% mass concentration was used as a tracer, and the response was collected with a WTW conductivity meter Cond 315i.
6.2.2. Reactor Geometry and Working Position
The PHR under study belongs to the tubular reactors category, with 1.6. length/diameter ratio (L/D). The quartz sleeves’ outer diameter is 45 mm.
The PHR was designed to be operated horizontally, vertically, or at various inclination angles. For this particular study, three operating positions were considered: horizontal, vertical, and inclined at a 45° angle (Figure 10).
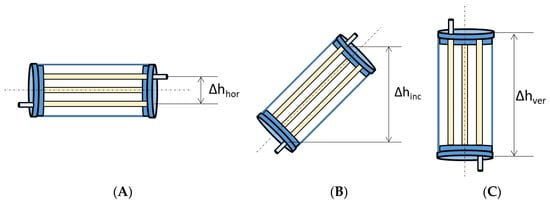
Figure 10.
Working reactor positions: (A): horizontal, (B): inclined (45°), and (C): vertical.
6.2.3. UV-Lamp Arrangement
The PHR is equipped with four UV-C lamps protected with quartz sleeves with an inner diameter of 39 mm. Three lamps are placed as an equilateral triangle, while the fourth is positioned centrally, having the same axe of symmetry as the reactor. With this arrangement, the lamps can be used in three configurations, of one, three, or four lamps simultaneously, as presented in Figure 11A. In this manner, the intensity of the irradiation can be modulated when necessary. Moreover, the lamps can be exchanged and/or replaced without stopping the process (Figure 11B) [93].

Figure 11.
The UV-C lamps configuration schemes: (A): one lamp on, three lamps on, four lamps on; (B): four lamps on at the actual reactor.
6.2.4. Inlet/Outlet Type
This study used two different arrangements of inlet and outlet pipes: (i) axial, parallel with the central axis of symmetry of the PHR, and (ii) radial, tangent to the reactor wall (Figure 12). The inner diameter of inlet and outlet pipes, either axial or radial, is 12 mm.
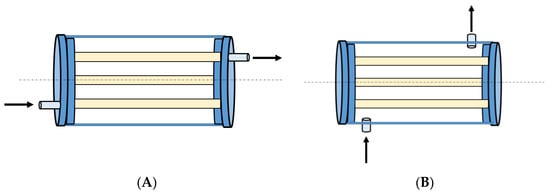
Figure 12.
(A): Axial (through the lids); (B): radial (through the walls) inlet/outlet.
6.3. Results and Discussions
6.3.1. Characteristics and Profiles of RTD Functions
The C-Curve
The C-curve displays the time evolution of the tracer concentration and provides the raw data for RTD investigation. The contour of the C-curve is always identical to the contour of the E-curve. Therefore, the transformations generated by changing the inlet and outlet positions are evident by looking at the C-curves alone, without any supplementary data analysis (Figure 13A,B). The occurrence of flow defects, short-circuits or channeling and dead or stagnant zones, are indicated by the sharp peaks at the very beginning of the curves (short-circuits) and of the long tails at the end of the curves (dead zones). Although the shapes of the curves are different (Figure 13A,B), the presence of both short-circuits and dead zones is unquestionable, regardless of the reactor operating position and/or the inlet/outlet type.
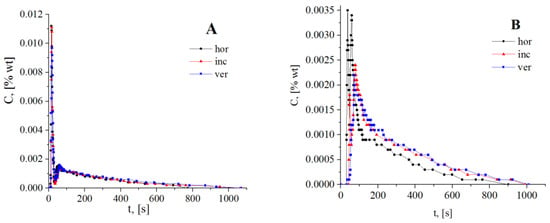
Figure 13.
The C-curves: (A): axial inlet/outlet, (B): radial inlet/outlet, with reactor operated horizontally, inclined, and vertically.
The RTD Functions
The plug flow reactor is the ideal reactor commonly used for modelling an annular photochemical reactor [94,95,96]. The representative RTD functions from Figure 14 for PHR operated horizontally clearly indicate a noticeable deviation from the ideal plug flow model for both inlet/outlet types.
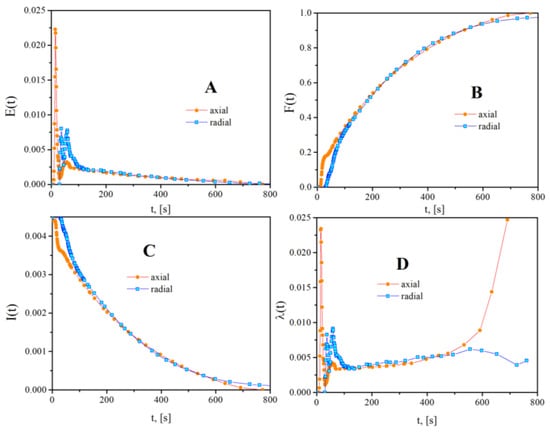
Figure 14.
Profiles of RTD functions, axial vs. radial inlet/outlet, reactor operated horizontally. (A): E-curve; (B): F-curve; (C): I-curve; (D): λ-curve.
In order to highlight the influence of reactor working position and inlet/outlet type on the fluid flow through the PHR, two of the main RTD functions, residence time distribution (E) and cumulative residence time distribution (F) were plotted as functions of time (t) and/or as a function of dimensionless time (θ) and further analyzed. In addition, the first and second moments of residence time distribution, usually known as the mean residence time, respectively, the variance, were determined for each working position and inlet/outlet type.
Space Time, First and Second Central Moments
The space-time value, as determined by Equation (1), was 270.3 s for all experiments conducted. The values of the first two central moments and the corresponding standard deviation for all six reactor configurations considered in the current study are presented in Table 3.

Table 3.
The first and second central moments of residence time distribution.
By comparing the values of space-time and mean residence time, which are equal for ideal flowing systems [62,97], some information related to the presence of short circuits or dead zones can be attained. If , a part of the fluid rapidly leaves the vessel (short-circuit or channeling). If , a part of the fluid stays longer inside the reactor (dead zones or stagnancies). However, the use of only the first moment can be misleading since its value can be significantly affected by measurement errors: (i) the presence of internal dead zones (the reactor is not entirely filled with fluid); (ii) the density differences between the tracer and the analyzed fluid; (iii) the tracer tendency to adsorb on the surfaces inside the vessel [44]. Therefore, as it indicates the spread of the distribution around the mean, it is recommended that the values of the second moment go along with those of the first moment [62]. For example, the value for the inclined-operated reactor (Table 3) is very close to the actual space-time (274.06 vs. 270.3 s). However, the flow pattern is far from the ideal plug flow, as revealed by the RTD functions (Figure 15) and confirmed by the corresponding value (Table 3).
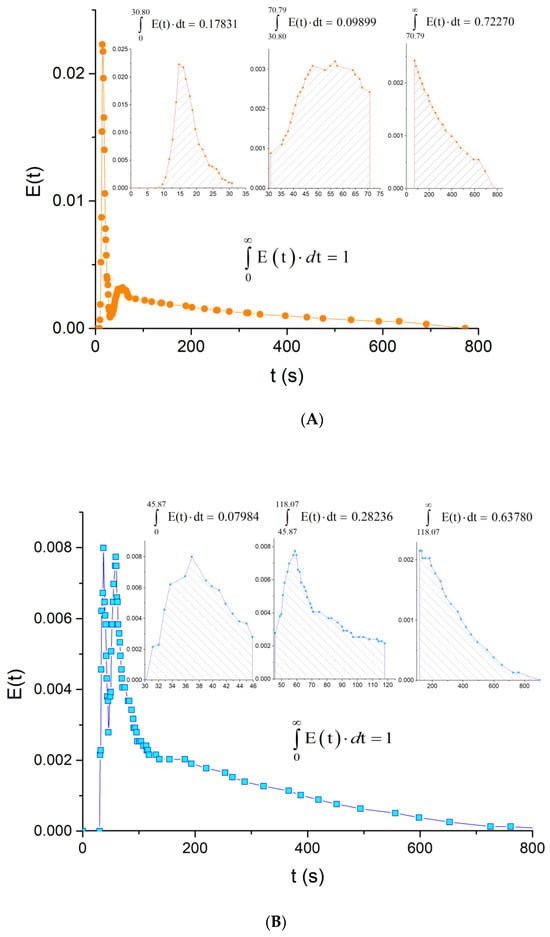
Figure 15.
E-curve analysis, reactor operated horizontally. (A): axial inlet/outlet, (B): radial inlet/outlet.
The E-Curve Analysis
The analysis of E-curve allows a relative quantification of the residence time distribution [62]. The E-curve for the axial inlet (Figure 15A) shows that 17.8% of the material has spent 30.8 or less than 30.8 s in the reactor. Note that no signal was recorded in the case of radial inlet during this time. The area under the second peak corresponds to approximately 10% of the material that has resided in the reactor between 30.8 and 70.79 s. The remaining 72.27% of the materials (the area under the tail) reside somewhere between 70.79 and 772 s. The area under the E-curve for the radial inlet (Figure 15B) can also be divided into three regions: 7.98%, 28.24%, and 63.78%.
Even if the shape of the E-curves is very different at the beginning, the presence of short-circuits manifests for both reactor configurations, and after 120 s (Figure 16), the amount of material that spent 2 or less than 2 min in the reactor is very similar (around 38%).
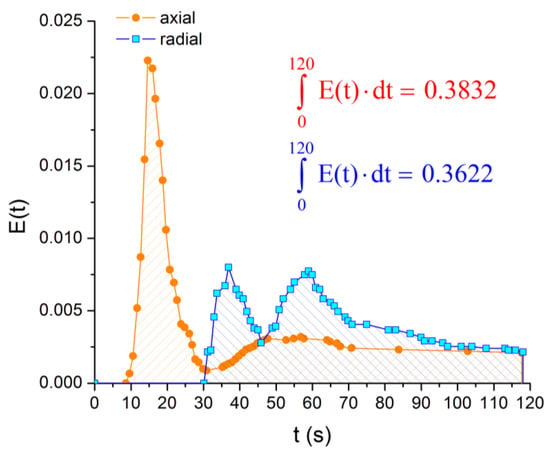
Figure 16.
E-curve analysis, reactor operated horizontally: axial vs. radial inlet/outlet—short circuits evidence.
The F-Curve Analysis
The shape of F-curve provides a series of information related to the fluid flow through the reactor. It depends on the relative time required by various elements (portions) of fluid to flow through the vessel (the distribution of residence times). Therefore, the term “mixing” is not related to chemical homogeneity but to the age distribution of material in the reactor and outgoing stream [13]. The experimental F-curve profile indicates complete mixing for all six reactor configurations.
The degree of departure from perfect mixing is given by the area between the experimental and theoretical curves (Figure 17A,B). If the area is above the theoretical curve, it indicates the presence of a stagnant region (dead zone). The area under the F-curve between θ = 0 and θ = 1 is called “hold-back” (H)—the surface A1 in Figure 18. The sum of A1 and A2 areas from Figure 18 represents the degree of departure from the ideal mixing. The critical values of H are 0 for piston flow, 1/e for complete mixing, and approximately 1 if most of the vessel space is dead zone [13]. A high hold-back indicates that a significant part of the vessel volume is occupied by material already reacted. At the same time, the reactant passes rapidly through the reactor by a short-circuit route [13].
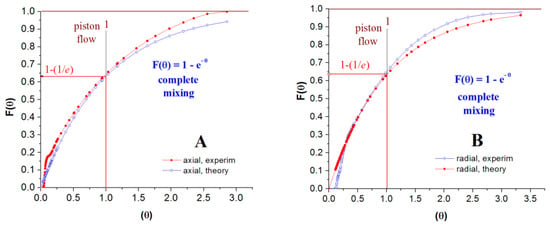
Figure 17.
F-curve analysis, reactor operated horizontally. (A): axial inlet/outlet, (B): radial inlet/outlet.
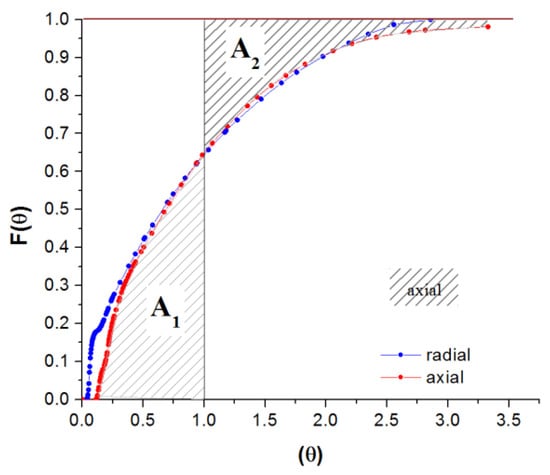
Figure 18.
F-curve analysis, reactor operated horizontally, axial vs. radial inlet/outlet: hold-back.
6.3.2. Influence of Reactor Position
The influence of the reactor operating position is minor, as revealed by the profiles of the E-curves and confirmed by the increasing values of the mean residence time. The differences produced seem more significant for the axial inlet/outlet (Figure 19A–C) than for the radial inlet/outlet (Figure 19D–F). These alterations are related to the density difference between the sodium chloride tracer and the water inside the reactor. Higher density generates negative buoyancy; changing the reactor position increases the relative height to be climbed by the tracer (Figure 10) and is shown to cause the delay, as indicated by the values of the mean residence time.
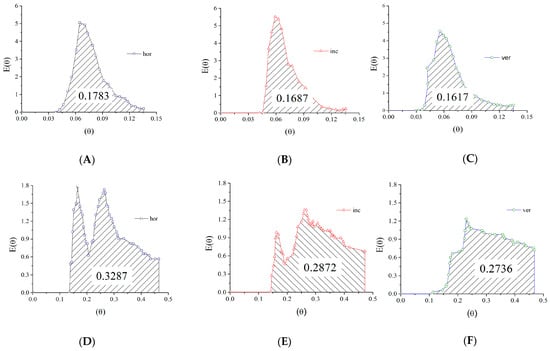
Figure 19.
E-curve analysis on the short-circuit region for different reactor positions: (A): horizontal reactor with axial inlet; (B): 45° inclined reactor with axial inlet; (C): vertical reactor with axial inlet; (D): horizontal reactor with radial inlet; (E): 45° inclined reactor with radial inlet; (F): vertical reactor with radial inlet.
Further analysis of the E-curves on the short-circuiting corresponding peak shows that the amount of fluid that flows through a short circuit slightly decreases with the increase of the inclination angle (e.g., 17.83% < 16.87% < 16.17% for axial inlet/outlet). The alterations are small enough to confirm the hypothesis that the density differences cause them and can be easily associated with the inequalities among the relative height.
6.3.3. Influence of Inlet/Outlet Type
Regardless of the reactor operating position, changing the inlet/outlet type significantly affects the flow pattern inside the reactor. The relative length to be traveled by the tracer through the reactor is longer when the jet is following a spiral path from the inlet to the outlet compared to when the jet is following a straight route from the inlet to the outlet, and consequently generates the differences between the mean residence times on axial vs. radial inlet/outlet (Table 3). Regardless of the inlet/outlet type, the quartz sleeves act like baffles. However, for the radial inlet, the baffles are oriented almost perpendicularly to the flow, while for the axial inlet, the baffles are nearly parallel with it. Since the flow pattern differs, the position of dead zones and short-circuits differs. The radial inlet/outlet stimulates a specific helical movement of the fluid that may shift the dead zone in the central area of the reactor, surrounded by the four quartz sleeves. As for the axial inlet/outlet, the location of dead zones is typically at the opposite “corners” of the reactor.
6.3.4. Practical Decisions following RTD Diagnosis
Due to the constructive particularities of the annular photochemical reactors, flow defects such as short circuits and dead zones cannot be avoided by changing the reactor operating position or the inlet/outlet type. It was found that the reactor position has less or no significant influence on the flow pattern, while the inlet/outlet position is critical. Changing the reactor position modifies the relative height to be climbed by the tracer while changing the inlet/outlet type modifies the pathway and the relative length to be traveled by the tracer. The radial inlet/outlet stimulates a specific helical movement of the fluid around the quartz sleeves.
Based on the current investigation results and recent literature reports [87,98], the following design and operation recommendations were made:
- (i)
- The PHR should be equipped with a recirculation pump that can be used to adjust the UV exposure time and to improve the mixing of chemical species;
- (ii)
- The radial inlet/outlet is recommended for several reasons: (1) it promotes the development of a helical motion of the fluid around the UV lamps, increasing the relative length to be traveled by the fluid inside the reactor and consequently increasing the UV exposure time; (2) the location of dead-zones tends to be shifted from the reactor’s “corners” to its central region, among the quartz sleeves, which increase both the exposure time and the intensity of the irradiation field for the fluid trapped in the stagnant region; (3) due to the flow orientation, the quartz sleeves act like baffles, improving the mixing inside the reactor;
- (iii)
- The reactor operating position should be horizontal since it does not significantly influence the UV-C exposure time or irradiation intensity. However, when specific reagents are used, the reactor position may be adjusted to consider their buoyancy;
- (iv)
- To diminish the effect of short-circuiting or channeling, it is recommended to use lower flow rates, possibly in the region of semi-turbulent jets.
7. Conclusions
Residence time distribution is a versatile method that can characterize vessel hydrodynamics to reveal design flows (e.g., dead zones, stagnancies, by-passes, preferential flows) and estimate the mixing degree. The statistical processing of fluid element residence times using typical RTD functions, combined with mathematical modeling of ideal and non-ideal flow and reaction kinetics, allows conversion and yield predictions. That makes RTD analysis an indispensable tool for chemical reactor design. Moreover, the method has several applications in other fields (e.g., anatomy, geology, metallurgy). An RTD analysis was performed on a photochemical reactor to prove the method’s utility. The analysis revealed the presence of short-circuits and dead zones. A series of design decisions related to the reactor’s inlet/outlet orientation and the reactor’s working position were made after the RTD diagnosis. These modifications affect the reactor’s hydrodynamic, which directly influences the photo-chemical process efficiency due to the: (i) increase of the residence time (which means prolonging the exposure to UV irradiation); (ii) mixing intensification (that improves the catalyst dispersion).
Supplementary Materials
The supporting information can be downloaded at: https://www.mdpi.com/article/10.3390/pr11123420/s1. References [99,100,101,102,103,104,105,106,107,108,109,110,111,112,113,114,115,116,117,118,119,120,121,122,123,124,125,126,127,128,129,130,131,132,133,134,135,136,137,138,139,140,141,142,143,144,145,146,147,148,149,150,151,152] are cited in the supplementary materials.
Author Contributions
Conceptualization, G.D.S. and M.T.N.; methodology, E.N.D.; validation, G.D.S. and A.C.P.; formal analysis, M.T.N.; writing—original draft preparation, M.T.N., E.N.D. and G.D.S.; writing—review and editing, E.N.D. and A.C.P.; visualization, A.C.P.; supervision, M.T.N.; funding acquisition, E.N.D. All authors have read and agreed to the published version of the manuscript.
Funding
This research was funded by “Program 4: Fundamental and Frontier Research—Exploratory Research Projects” financed by UEFISCDI (project no. PCE 58/2021).
Data Availability Statement
Data is available upon request.
Conflicts of Interest
The authors declare no conflict of interest.
References
- Levenspiel, O. Chemical Reaction Engineering; John Wiley & Sons: Hoboken, NJ, USA, 1998. [Google Scholar]
- Guo, X.; Fan, Y.; Luo, L. Residence time distribution on flow characterisation of multichannel systems: Modelling and experimentation. Exp. Therm. Fluid Sci. 2018, 99, 407–419. [Google Scholar] [CrossRef]
- Bérard, A.; Blais, B.; Patience, G.S. Experimental methods in chemical engineering: Residence time distribution—RTD. Can. J. Chem. Eng. 2020, 98, 848–867. [Google Scholar] [CrossRef]
- Naor, P.; Shinnar, R. Representation and Evaluation of Residence Time Distributions. Ind. Eng. Chem. Fundam. 1963, 2, 278–286. [Google Scholar] [CrossRef]
- Bhalode, P.; Tian, H.; Gupta, S.; Razavi, S.M.; Roman-Ospino, A.; Talebian, S.; Singh, R.; Scicolone, J.V.; Muzzio, F.J.; Ierapetritou, M. Using residence time distribution in pharmaceutical solid dose manufacturing—A critical review. Int. J. Pharm. 2021, 610, 121248. [Google Scholar] [CrossRef] [PubMed]
- Mac Mullin, R.B. The Theory of Short Circuiting in Continuous-Flow Mixing Vessels in Series and the Kinetics of Chemical Reactions in Such Systems. Trans. Amer. Inst. Chem. Eng. 1935, 31, 409–458. [Google Scholar]
- Nauman, E.B. Residence Time Theory. Ind. Eng. Chem. Res. 2008, 47, 3752–3766. [Google Scholar] [CrossRef]
- Aris, R. Some Problems in the Analysis of Transient Behavior and Stability of Chemical Reactors. In Chemical Reaction Engineering; Advances in Chemistry; American Chemical Society: Washington, DC, USA, 1974; Volume 109, pp. 578–629. [Google Scholar]
- Langmuir, I. The velocity of reactions in gases moving through heated vessels and the effect of convection and diffusion. J. Am. Chem. Soc. 1908, 30, 1742–1754. [Google Scholar] [CrossRef]
- Rodrigues, A.E. Residence time distribution (RTD) revisited. Chem. Eng. Sci. 2021, 230, 116188. [Google Scholar] [CrossRef]
- Duduković, M.P. Tracer Methods in Chemical Reactors. Techniques and Applications. In Chemical Reactor Design and Technology: Overview of the New Developments of Energy and Petrochemical Reactor Technologies. Projections for the 90’s; de Lasa, H.I., Ed.; Springer: Dordrecht, The Netherlands, 1986; pp. 107–189. [Google Scholar]
- Gibilaro, L.G. Residence time distributions in regions of continuous flow systems. Chem. Eng. Sci. 1979, 34, 697–702. [Google Scholar] [CrossRef]
- Danckwerts, P.V. Continuous flow systems. Distribution of residence times. Chem. Eng. Sci. 1953, 2, 1–13. [Google Scholar] [CrossRef]
- Zwietering, T.N. The degree of mixing in continuous flow systems. Chem. Eng. Sci. 1959, 11, 1–15. [Google Scholar] [CrossRef]
- Danckwerts, P.V. The effect of incomplete mixing on homogeneous reactions. Chem. Eng. Sci. 1958, 8, 93–102. [Google Scholar] [CrossRef]
- Buffham, B.A.; Kropholler, H.W. The washout curve, residence-time distribution, and F curve in tracer kinetics. Math. Biosci. 1970, 6, 179–184. [Google Scholar] [CrossRef]
- Gibilaro, L.G. Mean residence times in continuous flow systems. Nature 1977, 270, 47–48. [Google Scholar] [CrossRef]
- Nauman, E.B. Residence time distribution theory for unsteady stirred tank reactors. Chem. Eng. Sci. 1969, 24, 1461–1470. [Google Scholar] [CrossRef]
- Shinnar, R. Residence-time distributions and tracer experiments in chemical reactor design: The power and usefulness of a “wrong” concept. Revce 1993, 9, 97. [Google Scholar] [CrossRef]
- Awasthi, R.C.; Vasudeva, K. On mean residence times in flow systems. Chem. Eng. Sci. 1983, 38, 313–319. [Google Scholar] [CrossRef]
- Gottschalk, T.; Dehling, H.G.; Hoffmann, A.C. Danckwerts’ law for mean residence time revisited. Chem. Eng. Sci. 2006, 61, 6213–6217. [Google Scholar] [CrossRef]
- Nauman, E.B. Residence time distributions and micromixing. Chem. Eng. Commun. 1981, 8, 53–131. [Google Scholar] [CrossRef]
- Nauman, E.B. Chapter 1. Residence Time Distributions. In Handbook of Industrial Mixing; Paul, E.L., Atiemo-Obeng, V.A., Kresta, S.M., Eds.; John Wiley & Sons: Hoboken, NJ, USA, 2003; pp. 1–17. [Google Scholar]
- Gao, Y.; Muzzio, F.J.; Ierapetritou, M.G. A review of the Residence Time Distribution (RTD) applications in solid unit operations. Powder Technol. 2012, 228, 416–423. [Google Scholar] [CrossRef]
- Lv, H.; Wang, J.; Shu, Z.; Qian, G.; Duan, X.; Yang, Z.; Zhou, X.; Zhang, J. Residence time distribution and heat/mass transfer performance of a millimeter scale butterfly-shaped reactor. Chin. Chem. Lett. 2023, 34, 107710. [Google Scholar] [CrossRef]
- Odidi, M.D.; Fagan-Endres, M.A.; Harrison, S.T.L. Residence Time Distribution Analysis of Drip-Irrigated Beds—The Effect of Material and Fluid Properties with Implications for Heap Leaching Practice. Minerals 2023, 13, 267. [Google Scholar] [CrossRef]
- Wetchagarun, S.; Tippayakul, C.; Petchrak, A.; Sukrod, K.; Khoonkamjorn, P. A study of residence time distribution using radiotracer technique in the large scale plant facility. J. Phys. Conf. Ser. 2017, 860, 012015. [Google Scholar] [CrossRef]
- Eskey, C.J.; Wolmark, N.; McDowell, C.L.; Domach, M.M.; Jain, R.K. Residence Time Distributions of various Tracers in Tumors: Implications for Drug Delivery and Blood Flow Measurement. JNCI J. Natl. Cancer Inst. 1994, 86, 293–299. [Google Scholar] [CrossRef] [PubMed]
- Leray, S.; Engdahl, N.B.; Massoudieh, A.; Bresciani, E.; McCallum, J. Residence time distributions for hydrologic systems: Mechanistic foundations and steady-state analytical solutions. J. Hydrol. 2016, 543, 67–87. [Google Scholar] [CrossRef]
- Guo, J.; Liu, Y.; Zhao, S.; Li, H.; Li, W.; Xia, J.; Wu, J.; Zhang, J. Effects of stator and rotor geometry on inline high shear mixers: Residence time distribution, flow, and energy consumption. Chem. Eng. J. 2023, 452, 139235. [Google Scholar] [CrossRef]
- Dittrich, C.J.; Mutsers, S.M.P. On the residence time distribution in reactors with non-uniform velocity profiles: The horizontal stirred bed reactor for polypropylene production. Chem. Eng. Sci. 2007, 62, 5777–5793. [Google Scholar] [CrossRef]
- Aparicio-Mauricio, G.; Rodríguez, F.A.; Pijpers, J.J.H.; Cruz-Díaz, M.R.; Rivero, E.P. CFD modeling of residence time distribution and experimental validation in a redox flow battery using free and porous flow. J. Energy Storage 2020, 29, 101337. [Google Scholar] [CrossRef]
- Rivas, J.; Sadino-Riquelme, M.C.; Garcés, I.; Carvajal, A.; Donoso-Bravo, A. Spatial and Temporal Validation of a CFD Model Using Residence Time Distribution Test in a Tubular Reactor. Computation 2020, 8, 94. [Google Scholar] [CrossRef]
- Simcik, M.; Ruzicka, M.C.; Mota, A.; Teixeira, J.A. Smart RTD for multiphase flow systems. Chem. Eng. Res. Des. 2012, 90, 1739–1749. [Google Scholar] [CrossRef][Green Version]
- Zhang, B.; Cui, Y.; Luo, J.; Wang, J.; Liao, B.; Tang, C. Evaluation and improvement of residence time distribution analysis methods. J. Hydrol. 2023, 620, 129531. [Google Scholar] [CrossRef]
- Gyürkés, M.; Tacsi, K.; Pataki, H.; Farkas, A. Residence Time Distribution-Based Smith Predictor: An Advanced Feedback Control for Dead Time–Dominated Continuous Powder Blending Process. J. Pharm. Innov. 2023. [Google Scholar] [CrossRef]
- Ding, C.; Lei, H.; Chen, S.; Zhang, H.; Zhao, Y.; Zou, Z. Challenge of Residence Time Distribution Curve in Tundish for Continuous Casting of Steel. Steel Res. Int. 2022, 93, 2200187. [Google Scholar] [CrossRef]
- Hurley, S.; Tantuccio, A.; Escotet-Espinoza, M.S.; Flamm, M.; Metzger, M. Development and Use of a Residence Time Distribution (RTD) Model Control Strategy for a Continuous Manufacturing Drug Product Pharmaceutical Process. Pharmaceutics 2022, 14, 355. [Google Scholar] [CrossRef] [PubMed]
- Safaei, H.; Falamaki, C.; Sohrabi, M. Applying a new approach to predict the residence time distribution in impinging streams reactors. Energy Sources Part A Recovery Util. Environ. Eff. 2023, 45, 9569–9576. [Google Scholar] [CrossRef]
- Goswami, S.; Kshirsagar, V.S.; Aswini, V.; Sharma, V.K.; Samantray, J.S.; Gupta, R.; Pawar, P.M.; Pant, H.J. Evaluation of mixing performance and validation of CFD simulations in baffled anaerobic digesters using radiotracer technique. Appl. Radiat. Isot. 2023, 192, 110570. [Google Scholar] [CrossRef]
- Mayer, F.; Cserjan-Puschmann, M.; Haslinger, B.; Shpylovyi, A.; Sam, C.; Soos, M.; Hahn, R.; Striedner, G. Computational fluid dynamics simulation improves the design and characterization of a plug-flow-type scale-down reactor for microbial cultivation processes. Biotechnol. J. 2023, 18, 2200152. [Google Scholar] [CrossRef]
- Carreño-López, F.; Moreno-Casas, P.A.; Scott, F.; Iza, J.; Sierra-Pallares, J.; Muñoz, R.; Vergara-Fernández, A. A convenient method to validate the gas flow of a CFD-CT simulation applied on a packed bed used in gas biofiltration through residence time distributions. Chem. Eng. J. 2023, 451, 138795. [Google Scholar] [CrossRef]
- Levenspiel, O. Mixed models to represent flow of fluids through vessels. Can. J. Chem. Eng. 1962, 40, 135–138. [Google Scholar] [CrossRef]
- Levenspiel, O. Chapter 1. The Tracer Method. In Tracer Technology: Modeling the Flow of Fluids; Springer Science & Business Media: Berlin/Heidelberg, Germany, 2011; Volume 96, pp. 1–4. [Google Scholar]
- Sebastian Escotet-Espinoza, M.; Moghtadernejad, S.; Oka, S.; Wang, Y.; Roman-Ospino, A.; Schäfer, E.; Cappuyns, P.; Van Assche, I.; Futran, M.; Ierapetritou, M.; et al. Effect of tracer material properties on the residence time distribution (RTD) of continuous powder blending operations. Part I of II: Experimental evaluation. Powder Technol. 2019, 342, 744–763. [Google Scholar] [CrossRef]
- Sarkar, M.; Sangal, V.K.; Pant, H.J.; Sharma, V.K.; Bhunia, H.; Bajpai, P.K. Application of tracer technology in wastewater treatment processes: A review. Chem. Eng. Commun. 2023, 210, 16–33. [Google Scholar] [CrossRef]
- Khatoon, B.; Kamil, S.; Babu, H.; Siraj Alam, M. Experimental analysis of Cascade CSTRs with step and pulse inputs. Mater. Today Proc. 2022, 78, 40–47. [Google Scholar] [CrossRef]
- Stephenson, R.; Sheridan, C. Review of experimental procedures and modelling techniques for flow behaviour and their relation to residence time in constructed wetlands. J. Water Process Eng. 2021, 41, 102044. [Google Scholar] [CrossRef]
- Wang, Z.; Yang, Z.; Wang, X.; Yue, Q.; Xia, Z.; Xiao, H. Residence Time Distribution (RTD) Applications in Continuous Casting Tundish: A Review and New Perspectives. Metals 2022, 12, 1366. [Google Scholar] [CrossRef]
- Peterwitz, M.; Jodwirschat, J.; Loll, R.; Schembecker, G. Tracking raw material flow through a continuous direct compression line Part I of II: Residence time distribution modeling and sensitivity analysis enabling increased process yield. Int. J. Pharm. 2022, 614, 121467. [Google Scholar] [CrossRef] [PubMed]
- Kim, I.-Y.; Park, S.; Kim, Y.; Kim, H.-J.; Wolfe, R.R. Tracing metabolic flux in vivo: Basic model structures of tracer methodology. Exp. Mol. Med. 2022, 54, 1311–1322. [Google Scholar] [CrossRef] [PubMed]
- Pant, H.J. Applications of the radiotracers in the industry: A review. Appl. Radiat. Isot. 2022, 182, 110076. [Google Scholar] [CrossRef]
- Torres, A.P.; Oliveira, F.A.R. Residence time distribution studies in continuous thermal processing of liquid foods: A review. J. Food Eng. 1998, 36, 1–30. [Google Scholar] [CrossRef]
- Grayman, W.M.; Rossman, L.A.; Deininger, R.A.; Smith, C.D.; Arnold, C.N.; Smith, J.F. Mixing and aging of water in distribution system storage facilities. J. -AWWA 2004, 96, 70–80. [Google Scholar] [CrossRef]
- Razavi, S.M.; Román-Ospino, A.D.; Bhalode, P.; Scicolone, J.; Callegari, G.; Dubey, A.; Koolivand, A.; Krull, S.; Tian, G.; Xu, X.; et al. Selection of an appropriate tracer to measure the residence time distribution (RTD) of continuous powder blending operations. Powder Technol. 2023, 429, 118864. [Google Scholar] [CrossRef]
- Robinson, B.A.; Tester, J.W.; Brown, L.F. Reservoir Sizing Using Inert and Chemically Reacting Tracers. SPE Form. Eval. 1988, 3, 227–234. [Google Scholar] [CrossRef]
- Sierra-Pallares, J.; Méndez, C.; García-Carrascal, P.; Castro, F. Spatial distribution of mean age and higher moments of unsteady and reactive tracers: Reconstruction of residence time distributions. Appl. Math. Model. 2017, 46, 312–327. [Google Scholar] [CrossRef]
- Kashid, M.N.; Renken, A.; Kiwi-Minsker, L. (Eds.) Chapter 3. Real Reactors and Residence Time Distribution (RTD). In Microstructured Devices for Chemical Processing; Wiley-VCH Verlag GmbH & Co.: Weinheim, Germany, 2014; pp. 89–128. [Google Scholar]
- Wojewódka, P.; Aranowski, R.; Jungnickel, C. Residence time distribution in rapid multiphase reactors. J. Ind. Eng. Chem. 2019, 69, 370–378. [Google Scholar] [CrossRef]
- Missen, R.W. Mims C.A., Saville B.A. Introduction to Chemical Reaction Engineering and Kinetics; John Wiley & Sons: New York, NY, USA, 1999. [Google Scholar]
- Danckwerts, P.V. Continuous flow systems. Distribution of residence times. Chem. Eng. Sci. 1995, 50, 3857–3866. [Google Scholar] [CrossRef]
- Fogler, H.S. Elements of Chemical Reaction Engineering; Prentice Hall: Upper Saddle River, NJ, USA, 2016. [Google Scholar]
- Li, S.; Xin, F.; Li, L. Reaction Engineering; Butterworth-Heinemann: Oxford, UK, 2017. [Google Scholar]
- Liu, S. Chapter 4—Batch Reactor. In Bioprocess Engineering, 2nd ed.; Liu, S., Ed.; Elsevier: Amsterdam, The Netherlands, 2017; pp. 139–178. [Google Scholar]
- Gorzalski, A.S.; Harrington, G.W.; Coronell, O. Assessing flow segregation and mixing by modeling residual disinfectant conversion. AWWA Water Sci. 2019, 1, e1154. [Google Scholar] [CrossRef]
- Levenspiel, O.; Bischoff, K.B. Patterns of Flow in Chemical Process Vessels. In Advances in Chemical Engineering; Drew, T.B., Hoopes, J.W., Vermeulen, T., Eds.; Academic Press: Cambridge, MA, USA, 1964; Volume 4, pp. 95–198. [Google Scholar]
- Ravi, R. Chapter 2—Flow Characteristics of Reactors—Flow Modeling. In Coulson and Richardson’s Chemical Engineering, 4th ed.; Ravi, R., Vinu, R., Gummadi, S.N., Eds.; Butterworth-Heinemann: Oxford, UK, 2017; pp. 103–160. [Google Scholar]
- Yablonsky, G.S.; Constales, D.; Marin, G.B. A new approach to diagnostics of ideal and non-ideal flow patterns: I. The concept of reactive-mixing index (REMI) analysis. Chem. Eng. Sci. 2009, 64, 4875–4883. [Google Scholar] [CrossRef]
- Bodner, K.; Brimacombe, C.; Chenery, E.S.; Greiner, A.; McLeod, A.M.; Penk, S.R.; Vargas Soto, J.S. Ten simple rules for tackling your first mathematical models: A guide for graduate students by graduate students. PLoS Comput. Biol. 2021, 17, e1008539. [Google Scholar] [CrossRef]
- Rizzuti, L.; Brucato, A. Photochemical Reactors Engineering Fundamentals. In Photocatalysis and Environment: Trends and Applications; Schiavello, M., Ed.; Springer: Dordrecht, The Netherlands, 1988; pp. 623–636. [Google Scholar]
- Sambiagio, C.; Noël, T. Flow photochemistry: Shine some light on those tubes! Trends Chem. 2020, 2, 92–106. [Google Scholar] [CrossRef]
- Alfano, O.M.; Cassano, A.E. Photoreactor Modeling: Applications to Advanced Oxidation Processes. Int. J. Chem. React. Eng. 2008, 6, 1–19. [Google Scholar] [CrossRef]
- Van Gerven, T.; Mul, G.; Moulijn, J.; Stankiewicz, A. A review of intensification of photocatalytic processes. Chem. Eng. Process. Process Intensif. 2007, 46, 781–789. [Google Scholar] [CrossRef]
- Bonfield, H.E.; Knauber, T.; Lévesque, F.; Moschetta, E.G.; Susanne, F.; Edwards, L.J. Photons as a 21st century reagent. Nat. Commun. 2020, 11, 804. [Google Scholar] [CrossRef] [PubMed]
- Zondag, S.D.A.; Mazzarella, D.; Noël, T. Scale-Up of Photochemical Reactions: Transitioning from Lab Scale to Industrial Production. Annu. Rev. Chem. Biomol. Eng. 2023, 14, 283–300. [Google Scholar] [CrossRef] [PubMed]
- Oppenländer, T. Photochemical Purification of Water and Air: Advanced Oxidation Processes (AOPs)-Principles, Reaction Mechanisms, Reactor Concepts; John Wiley & Sons: Hoboken, NJ, USA, 2007. [Google Scholar]
- de Lasa, H.; Serrano, B.; Salaices, M. (Eds.) Novel Photocatalytic Reactors for Water and Air Treatment. In Photocatalytic Reaction Engineering; Springer: Boston, MA, USA, 2005; pp. 17–47. [Google Scholar]
- Kowalska, E.; Rau, S. Photoreactors for Wastewater Treatment: A Review. Recent Pat. Eng. 2010, 4, 242–266. [Google Scholar] [CrossRef]
- McCullagh, C.; Skillen, N.; Adams, M.; Robertson, P.K.J. Photocatalytic reactors for environmental remediation: A review. J. Chem. Technol. Biotechnol. 2011, 86, 1002–1017. [Google Scholar] [CrossRef]
- Coenen, T.; Van de Moortel, W.; Logist, F.; Luyten, J.; Van Impe, J.F.M.; Degrève, J. Modeling and geometry optimization of photochemical reactors: Single- and multi-lamp reactors for UV–H2O2 AOP systems. Chem. Eng. Sci. 2013, 96, 174–189. [Google Scholar] [CrossRef]
- Alfano, O.M.; Cassano, A.E. Scaling-Up of Photoreactors: Applications to Advanced Oxidation Processes. In Advances in Chemical Engineering; de Lasa, H.I., Serrano Rosales, B., Eds.; Academic Press: Cambridge, MA, USA, 2009; Volume 36, pp. 229–287. [Google Scholar]
- Mukherjee, P.S.; Ray, A.K. Major Challenges in the Design of a Large-Scale Photocatalytic Reactor for Water Treatment. Chem. Eng. Technol. 1999, 22, 253–260. [Google Scholar] [CrossRef]
- Ray, A.K.; Beenackers, A.A.C.M. Development of a new photocatalytic reactor for water purification. Catal. Today 1998, 40, 73–83. [Google Scholar] [CrossRef]
- Wols, B.A.; Harmsen, D.J.H.; van Remmen, T.; Beerendonk, E.F.; Hofman-Caris, C.H.M. Design aspects of UV/H2O2 reactors. Chem. Eng. Sci. 2015, 137, 712–721. [Google Scholar] [CrossRef]
- Gandhi, V.N.; Roberts, P.J.W.; Kim, J.-H. Visualizing and Quantifying Dose Distribution in a UV Reactor Using Three-Dimensional Laser-Induced Fluorescence. Environ. Sci. Technol. 2012, 46, 13220–13226. [Google Scholar] [CrossRef]
- Xu, C.; Rangaiah, G.P.; Zhao, X.S. A computational study of the effect of lamp arrangements on the performance of ultraviolet water disinfection reactors. Chem. Eng. Sci. 2015, 122, 299–306. [Google Scholar] [CrossRef]
- Moreira, F.C.; Bocos, E.; Faria, A.G.F.; Pereira, J.B.L.; Fonte, C.P.; Santos, R.J.; Lopes, J.C.B.; Dias, M.M.; Sanromán, M.A.; Pazos, M.; et al. Selecting the best piping arrangement for scaling-up an annular channel reactor: An experimental and computational fluid dynamics study. Sci. Total Environ. 2019, 667, 821–832. [Google Scholar] [CrossRef] [PubMed]
- Coenen, T.; Logist, F.; Van de Moortel, W.; Luyten, J.; Van Impe, J.; Degrève, J. Geometry optimization of photochemical reactors for advanced oxidation processes. In Computer Aided Chemical Engineering; Kraslawski, A., Turunen, I., Eds.; Elsevier: Amsterdam, The Netherlands, 2013; Volume 32, pp. 829–834. [Google Scholar]
- Moreira, R.M.; Pinto, A.M.F.; Mesnier, R.; Leclerc, J.-P. Influence of inlet positions on the flow behavior inside a photoreactor using radiotracers and colored tracer investigations. Appl. Radiat. Isot. 2007, 65, 419–427. [Google Scholar] [CrossRef] [PubMed]
- Poliński, M.; Stęgowski, Z. Influence of Inlet Positions on the Flow Behavior Inside a Photoreactor. In Proceedings of the Information Technology and Computational Physics, Krakow, Poland, 18–20 December 2016; Springer: Cham, Switzerland, 2017; pp. 217–232. [Google Scholar]
- Peres, J.C.G.; Silvio, U.d.; Teixeira, A.C.S.C.; Guardani, R.; Vianna, A.d.S., Jr. Study of an Annular Photoreactor with Tangential Inlet and Outlet: I. Fluid Dynamics. Chem. Eng. Technol. 2015, 38, 311–318. [Google Scholar] [CrossRef]
- Peres, J.C.G.; Tambani, P.C.; Teixeira, A.C.S.C.; Guardani, R.; Vianna, A.d.S., Jr. Study of an Annular Photoreactor with Tangential Inlet and Outlet. II. The UV/H2O2 Reactive Flow. Chem. Eng. Technol. 2019, 42, 316–326. [Google Scholar] [CrossRef]
- Suditu, G.D.; Nechita, M.T.; Puițel, A.C.; Drăgoi, E.N. Wastewater Treatment System by Photo-Sono-Chemical Methods. Patent Application RO/135064/A2/30.06.2021, 30 June 2021. [Google Scholar]
- Lawryshyn, Y.A.; Cairns, B. UV disinfection of water: The need for UV reactor validation. Water Supply 2003, 3, 293–300. [Google Scholar] [CrossRef]
- Sahle-Demessie, E.; Bekele, S.; Pillai, U.R. Residence time distribution of fluids in stirred annular photoreactor. Catal. Today 2003, 88, 61–72. [Google Scholar] [CrossRef]
- Malayeri, M.; Lee, C.-S.; Haghighat, F.; Klimes, L. Modeling of gas-phase heterogeneous photocatalytic oxidation reactor in the presence of mass transfer limitation and axial dispersion. Chem. Eng. J. 2020, 386, 124013. [Google Scholar] [CrossRef]
- Levenspiel, O. Chapter 2. The Mean and Variance of a Tracer Curve. In Tracer Technology: Modeling the Flow of Fluids; Levenspiel, O., Ed.; Springer: New York, NY, USA, 2012; pp. 5–10. [Google Scholar]
- Espíndola, J.C.; Cristóvão, R.O.; Araújo, S.R.F.; Neuparth, T.; Santos, M.M.; Montes, R.; Quintana, J.B.; Rodil, R.; Boaventura, R.A.R.; Vilar, V.J.P. An innovative photoreactor, FluHelik, to promote UVC/H2O2 photochemical reactions: Tertiary treatment of an urban wastewater. Sci. Total Environ. 2019, 667, 197–207. [Google Scholar] [CrossRef]
- Danckwerts, P.V. Local residence-times in continuous-flow systems. Chem. Eng. Sci. 1958, 9, 78–79. [Google Scholar] [CrossRef]
- Danckwerts, P.V.; Jenkins, J.W.; Place, G. The distribution of residence-times in an industrial fluidised reactor. Chem. Eng. Sci. 1954, 3, 26–35. [Google Scholar] [CrossRef]
- Danckwerts, P.V.; Wilson, R.A.M. Flow-visualization by means of a time-reaction. J. Fluid Mech. 1963, 16, 412–416. [Google Scholar] [CrossRef]
- Zwietering, T.N. A backmixing model describing micromixing in single-phase continuous-flow systems. Chem. Eng. Sci. 1984, 39, 1765–1778. [Google Scholar] [CrossRef]
- Bischoff, K.B.; McCracken, E.A. Tracer tests in flow systems. Ind. Eng. Chem. 1966, 58, 18–31. [Google Scholar] [CrossRef]
- Bischoff, K.B. Mixing and contacting in chemical reactors. Ind. Eng. Chem. 1966, 58, 18–32. [Google Scholar] [CrossRef]
- Cholette, A.; Cloutier, L. Mixing efficiency determinations for continuous flow systems. Can. J. Chem. Eng. 1959, 37, 105–112. [Google Scholar] [CrossRef]
- Chiang, D.; Cholette, A. Internal age and residence time distributions of a fluid in non-ideal stirred tanks in series. Can. J. Chem. Eng. 1971, 49, 484–487. [Google Scholar] [CrossRef]
- Cholette, A.; Blanchet, J.; Cloutier, L. Performance of flow reactors at various levels of mixing. Can. J. Chem. Eng. 1960, 38, 1–18. [Google Scholar] [CrossRef]
- Cloutier, L.; Cholette, A. Effect of various parameters on the level of mixing in continuous flow systems. Can. J. Chem. Eng. 1968, 46, 82–88. [Google Scholar] [CrossRef]
- Levenspiel, O.; Lai, B.W.; Chatlynne, C.Y. Tracer curves and the residence time distribution. Chem. Eng. Sci. 1970, 25, 1611–1613. [Google Scholar] [CrossRef]
- Levenspiel, O.; Smith, W.K. Notes on the diffusion-type model for the longitudinal mixing of fluids in flow. Chem. Eng. Sci. 1995, 50, 3891–3896. [Google Scholar] [CrossRef]
- Levenspiel, O.; Turner, J.C.R. The interpretation of residence-time experiments. Chem. Eng. Sci. 1970, 25, 1605–1609. [Google Scholar] [CrossRef]
- Levenspiel, O.; Bischoff, K.B. Backmixing in the Design of Chemical Reactors. Ind. Eng. Chem. 1959, 51, 1431–1434. [Google Scholar] [CrossRef]
- Shinnar, R. On the behaviour of liquid dispersions in mixing vessels. J. Fluid Mech. 1961, 10, 259–275. [Google Scholar] [CrossRef]
- Zvirin, Y.; Shinnar, R. Interpretation of internal tracer experiments and local sojourn time distributions. Int. J. Multiph. Flow 1976, 2, 495–520. [Google Scholar] [CrossRef]
- Buffham, B.A. Impulse Response of Infinite and Semi-Infinite Sequences of Identical Stirred Tanks with Backflow. Ind. Eng. Chem. Fundam. 1969, 8, 428–430. [Google Scholar] [CrossRef]
- Buffham, B.A. On the residence-time distribution for a system with velocity profiles in its connections with the environment. Chem. Eng. Sci. 1972, 27, 987–991. [Google Scholar] [CrossRef]
- Buffham, B.A. Mean residence times in steady-flow and some non-flow systems. Nature 1978, 274, 879–880. [Google Scholar] [CrossRef]
- Buffham, B.A. Internal and external residence-time distributions. Chem. Eng. Commun. 1983, 22, 105–107. [Google Scholar] [CrossRef]
- Buffham, B.A. Residence-time distributions in regions of steady-flow systems. Nature 1985, 314, 606–608. [Google Scholar] [CrossRef]
- Buffham, B.A.; Gibilaro, L.G. A generalization of the tanks-in-series mixing model. AIChE J. 1968, 14, 805–806. [Google Scholar] [CrossRef]
- Buffham, B.A.; Gibilaro, L.G. A unified time delay model for dispersion in flowing media. Chem. Eng. J. 1970, 1, 31–36. [Google Scholar] [CrossRef]
- Buffham, B.A.; Kropholler, H.W. Tracer kinetics: Some general properties, the mean residence time and applications to phase and chemical equilibria. Chem. Eng. Sci. 1973, 28, 1081–1089. [Google Scholar] [CrossRef]
- Buffham, B.A.; Mason, G. Holdup and dispersion: Tracer residence times, moments and inventory measurements. Chem. Eng. Sci. 1993, 48, 3879–3887. [Google Scholar] [CrossRef]
- Buffham, B.A.; Nauman, E.B. On the limiting form of the residence-time distribution for a constant-volume recycle system. Chem. Eng. Sci. 1975, 30, 1519–1524. [Google Scholar] [CrossRef]
- Gibilaro, L.G. On the residence time distribution for systems with open boundaries. Chem. Eng. Sci. 1978, 33, 487–491. [Google Scholar] [CrossRef]
- Nauman, E.B. Residence times and cycle times in recycle systems. Chem. Eng. Sci. 1974, 29, 1883–1888. [Google Scholar] [CrossRef]
- Nauman, E.B. Mixing in Polymer Reactors. J. Macromol. Sci. Part C 1974, 10, 75–112. [Google Scholar] [CrossRef]
- Nauman, E.B. Residence time distributions in systems governed by the dispersion equation. Chem. Eng. Sci. 1981, 36, 957–966. [Google Scholar] [CrossRef]
- Nauman, E.B. Reactions and residence time distributions in motionless mixers. Can. J. Chem. Eng. 1982, 60, 136–140. [Google Scholar] [CrossRef]
- Nauman, E.B. On residence time and trajectory calculations in motionless mixers. Chem. Eng. J. 1991, 47, 141–148. [Google Scholar] [CrossRef]
- Martin, A.D. Interpretation of residence time distribution data. Chem. Eng. Sci. 2000, 55, 5907–5917. [Google Scholar] [CrossRef]
- Burrows, L.J.; Stokes, A.J.; West, J.R.; Forster, C.F.; Martin, A.D. Evaluation of different analytical methods for tracer studies in aeration lanes of activated sludge plants. Water Res. 1999, 33, 367–374. [Google Scholar] [CrossRef]
- Leclerc, J.; Claudel, S.; Lintz, H.; Potier, O.; Antoine, B. Theoretical interpretation of residence-time distribution measurements in industrial processes. Oil Gas Sci. Technol. 2000, 55, 159–169. [Google Scholar]
- Claudel, S.; Fonteix, C.; Leclerc, J.P.; Lintz, H.G. Application of the possibility theory to the compartment modelling of flow pattern in industrial processes. Chem. Eng. Sci. 2003, 58, 4005–4016. [Google Scholar] [CrossRef]
- Haag, J.; Gentric, C.; Lemaitre, C.; Leclerc, J.-P. Modelling of Chemical Reactors: From Systemic Approach to Compartmental Modelling. Int. J. Chem. React. Eng. 2018, 16. [Google Scholar] [CrossRef]
- Schmidt, L.D. The engineering of Chemical Reactions; Oxford University Press: New York, NY, USA, 2005. [Google Scholar]
- Nauman, E.B. Chemical Reactor Design, Optimization, and Scaleup; John Wiley & Sons: Hoboken, NJ, USA, 2008. [Google Scholar]
- Fogler, H.S. Essentials of Chemical Reaction Engineering; Pearson Education: London, UK, 2010. [Google Scholar]
- Green, D.W.; Southard, M.Z. Perry’s Chemical Engineers’ Handbook; McGraw-Hill Education: New York, NY, USA, 2019. [Google Scholar]
- Ravi, R.; Vinu, R.; Gummadi, S.N. Coulson and Richardson’s Chemical Engineering: Volume 3A: Chemical and Biochemical Reactors and Reaction Engineering; Butterworth-Heinemann: Oxford, UK, 2017. [Google Scholar]
- Swaine, D.E.; Daugulis, A.J. Review of Liquid Mixing in Packed Bed Biological Reactors. Biotechnol. Progress 1988, 4, 134–148. [Google Scholar] [CrossRef]
- Ramaswamy, H.S.; Abdelrahim, K.A.; Simpson, B.K.; Smith, J.P. Residence time distribution (RTD) in aseptic processing of particulate foods: A review. Food Res. Int. 1995, 28, 291–310. [Google Scholar] [CrossRef]
- Ganjyal, G.; Hanna, M. A Review on Residence Time Distribution (RTD) in Food Extruders and Study on the Potential of Neural Networks in RTD Modeling. J. Food Sci. 2002, 67, 1996–2002. [Google Scholar] [CrossRef]
- Sheoran, M.; Chandra, A.; Bhunia, H.; Bajpai, P.K.; Pant, H.J. Residence time distribution studies using radiotracers in chemical industry—A review. Chem. Eng. Commun. 2018, 205, 739–758. [Google Scholar] [CrossRef]
- Reis, M.H.; Varner, T.P.; Leibfarth, F.A. The Influence of Residence Time Distribution on Continuous-Flow Polymerization. Macromolecules 2019, 52, 3551–3557. [Google Scholar] [CrossRef]
- Cherkasov, N.; Adams, S.J.; Bainbridge, E.G.A.; Thornton, J.A.M. Continuous stirred tank reactors in fine chemical synthesis for efficient mixing, solids-handling, and rapid scale-up. React. Chem. Eng. 2023. [Google Scholar] [CrossRef]
- Patrick, R.H., Jr.; Klindera, T.; Crynes, L.L.; Cerro, R.L.; Abraham, M.A. Residence time distribution in three-phase monolith reactor. AIChE J. 1995, 41, 649–657. [Google Scholar] [CrossRef]
- Bachmann, P.; Bück, A.; Tsotsas, E. Experimental investigation and correlation of the Bodenstein number in horizontal fluidized beds with internal baffles. Powder Technol. 2017, 308, 378–387. [Google Scholar] [CrossRef]
- Shadpoor, S.; Pirouzi, A.; Hamze, H.; Mazaheri, D. Determination of Bodenstein number and axial dispersion of a triangular external loop airlift reactor. Chem. Eng. Res. Des. 2021, 165, 61–68. [Google Scholar] [CrossRef]
- Pietsch, S.; Schönherr, M.; Kleine Jäger, F.; Heinrich, S. Measurement of Residence Time Distributions in a Continuously Operated Spouted Bed. Chem. Eng. Technol. 2020, 43, 804–812. [Google Scholar] [CrossRef]
- Mason, D.R.; Piret, E.L. Continuous Flow Stirred Tank Reactor Systems. Ind. Eng. Chem. 1950, 42, 817–825. [Google Scholar] [CrossRef]
- Li, S. Chapter 5—Residence Time Distribution and Flow Models for Reactors. In Reaction Engineering; Li, S., Ed.; Butterworth-Heinemann: Boston, MA, USA, 2017; pp. 213–263. [Google Scholar]
Disclaimer/Publisher’s Note: The statements, opinions and data contained in all publications are solely those of the individual author(s) and contributor(s) and not of MDPI and/or the editor(s). MDPI and/or the editor(s) disclaim responsibility for any injury to people or property resulting from any ideas, methods, instructions or products referred to in the content. |
© 2023 by the authors. Licensee MDPI, Basel, Switzerland. This article is an open access article distributed under the terms and conditions of the Creative Commons Attribution (CC BY) license (https://creativecommons.org/licenses/by/4.0/).