Article

Data-Driven Investigation of Inflation Concerns Caused by COVID-19 Pandemic in the U.S.

1
American Scholars, Philadelphia, PA 19111, USA
2
Department of Chemical and Biological Engineering, Villanova University, Villanova, PA 19085, USA
*
Author to whom correspondence should be addressed.
Processes 2023, 11(11), 3217; https://doi.org/10.3390/pr11113217
Submission received: 11 September 2023 / Revised: 19 October 2023 / Accepted: 9 November 2023 / Published: 13 November 2023
(This article belongs to the Section Biological Processes and Systems)

Abstract

:
While the end of the COVID-19 pandemic was declared in May 2023, it is necessary to analyze data collected by the Household Pulse Survey (HPS) to understand Americans’ perceptions of inflation during the COVID-19 pandemic. A total of 574,265 samples were analyzed with ANOVA, Tukey’s Multiple Comparison tests, and dominance analysis to explore disparities in expense difficulty across various demographic and socioeconomic groups. Results revealed significant racial disparities, with Black individuals facing the most challenges, followed by mixed-race, White, and Asian respondents. Transgender individuals encountered the highest hurdles among genders. Separated individuals experienced the most financial challenges based on marital status, while renters struggled more than homeowners regarding property status. Geographical variances revealed that the District of Columbia experienced the simplest challenges while Mississippi faced the most difficult ones. Dominance analysis highlighted household income and education levels as pivotal factors and indicated an inverse correlation between total household income and expense difficulty among low-income households. Disparities arose when oil and gas prices decreased, while the difficulty of paying full energy bills did not follow that trend. The most substantial discrepancy was observed between people’s difficulty with expenses and CPI data, which implied questions about the accuracy of CPI in reflecting consumer trends. Future research that considers additional variables would be helpful to gain a more comprehensive understanding of individuals’ perceptions of inflation during the COVID-19 pandemic.

1. Introduction

In spring 2020, the U.S. was hit hard by COVID-19, with increasing deaths and exacerbating unemployment and food insecurities [1]. Swift lockdowns and travel bans triggered a historic economic shock that was reflected by the real GDP plummeting by 32% in the second quarter of 2020 [2]. Amid travel declines and telework surges, consumer spending patterns shifted remarkably, with a 34% reduction in credit card expenditures [3]. Unemployment surged as 22 million workers filed claims within the four weeks after COVID-19 was officially announced in the U.S. [4]. Global inflation risks heightened due to supply chain disruptions and financial uncertainties [5]. Supply chains saw backlogs rise and supplier delivery times change, alongside a shift towards durable goods consumption [6]. This study aims to provide a thorough investigation of existing socioeconomic and economic data from American households on inflation caused by the COVID-19 pandemic. This study was organized into the following sections. The Introduction section reviews the relevant literature, and the Materials and Methods section details data extraction and preprocessing, along with ANOVA analysis, Tukey’s Multiple Component tests, and dominance analysis. The Results section presents perceptions of inflation from various demographic and socioeconomic groups, influential factors on people’s perception of inflation, and comparisons of people’s perception of inflation with public economic data. Major findings and limitations are presented in the Discussion section.
While the pandemic gave rise to an economic crisis of unparalleled size by simultaneously causing a demand shock, a supply shock, and a financial shock [7], it significantly changed people’s lives. After the coronavirus was announced as a global pandemic, the U.S. Census Bureau designed the Household Pulse Survey (HPS) to collect data on the socioeconomic and economic impacts of the pandemic on American households. It provides accurate sample coverage of the broader low-income population since it is derived from representative home samples [8]. Household Pulse Survey data have been widely studied for the impact of COVID-19 on mental health [9,10,11,12,13], vaccination preference [14,15,16,17,18], food security [12,19,20], job security [11,21], consumer behaviors [3,22,23], and financial instability [10,12,24]. Specifically, a substantial surge in depression and anxiety symptoms due to the pandemic was reported, with a dramatic rise in the U.S. [9]. Disparities were reported in mental health, with minorities, lower-income individuals, the young, and females experiencing higher rates of depression and anxiety [13]. This disparity is echoed in the concerning levels of food insecurity among families with children, even those with kids in school [25]. The pandemic has exacerbated mental health challenges, particularly in states with more COVID-19 cases, due to social isolation, financial strain, pre-existing psychiatric disorders, lower occupational prestige, food insufficiency, and housing concerns [12,21]. Globally, factors contributing to food insecurity were found to include but not limited to single-woman-headed households, minority representation, and lower education levels, with children in poverty-stricken households at heightened risk [25]. Loss of employment income during the pandemic has significantly affected the mental well-being of adults, with higher household income associated with lower anxiety and depression risk, while age and gender have emerged as influential factors [21,26]. Black and Latinx respondents reported the highest percentages of job losses at 65% and 75%, respectively [8]. Other disadvantaged groups have this disparity in employment instability as well. Women in the service industries suffered unexpected layoffs as a result of the gendered division of labor, and those who remained in the workforce were subjected to unstable working circumstances [27]. Female workers, particularly Latinx women, young adult workers, immigrant workers, and those with less education, were disproportionately impacted by COVID-19-related job losses. In October 2020, unemployment among low-wage workers worsened by 19% compared with a 1.2% improvement for high-wage workers during the same time [1,28].
The economic problem caused by the pandemic is primarily rooted in decreased consumption that affected lower and middle-class families and small business owners [4,28]. Concerns about persistently high inflation have surfaced and reached significant levels [29]. Generational differences have emerged in financial challenges caused by job loss, wage cuts, and hiring freezes. This impacted mental health, especially among younger adults, women, those with less education, unmarried individuals, and minorities [3,11]. Affordable housing decreased amid rising inflation, which in turn impacted low- and middle-income households [30]. Healthcare saw frontline worker shortages due to the pandemic’s impact [30]. Pandemic-induced high inflation has led to stress, particularly among women, black, and Hispanic respondents, with gender disparities noted in those reporting multiple inflation hardships [24]. Non-cisgender individuals faced employment, food, and housing insecurities driven by socioeconomic factors and discrimination [31]. Latino communities, including undocumented immigrants, have faced severe hardships during the pandemic, including food insufficiency, housing concerns, and mental health issues [12]. Low-income individuals and families faced disproportionate economic hardships during the pandemic [8]. Government interventions, such as stimulus payments and other economic relief packages, have significantly contributed to poverty reduction and lower depression and anxiety [10,32]. In particular, economic impact payments contributed to a decrease in food insufficiency [1]. Enhanced child benefits were implemented globally to aid families [9]. Government policies, such as the CARES Act, significantly contributed to poverty reduction [33]. Mortgage relief measures were introduced during the pandemic [26]. Non-profits experienced wage pressure, though federal funding helped stabilize their finances [30].
While the U.S. government took action to control inflation, inflation was driven by global supply disruptions, foreign trade policy changes, and regulations, threatening market turbulence [4,7]. The lockdown policies during COVID-19 cut off the upstream, midstream, and downstream industries. Even one country’s shutdown affects the entire global supply chain. The recovery of the global supply chain is essential to managing inflation [7]. The most widely used method for evaluating inflation is the consumer price index (CPI), which considers price changes (i.e., with greater price changes indicating higher inflation). However, consumer spending patterns following the pandemic have been largely disrupted, putting a greater emphasis on food and less on the transportation and services sector, which could, in turn, change the CPI weights [34]. The pandemic disrupted consumer spending patterns, influencing the consumer price index (CPI) calculation and potentially underestimating inflation [34].
As described above, extensive research has been conducted regarding the impact of the COVID-19 pandemic on the U.S. economy. However, the majority of these studies were conducted while the pandemic was ongoing. Consequently, there exists a temporal gap between existing research and the conclusion of the federal COVID-19 Public Health Emergency declaration (i.e., 11 May 2023). In addition, inflation concerns have not been well studied for potential discrepancies between people’s feelings relating to inflation and economic data such as CPI. Further, more factors in the Household Pulse Survey, such as food insufficiency, difficulty with energy bills, and difficulty with paying expenses, should be investigated together in further detail to gain a better understanding of the effects of inflation on different population groups.
In order to address the aforementioned knowledge gaps, this study provided a systematic investigation of inflation-related data obtained from the Household Pulse Survey to study people’s perceptions of inflation during the COVID-19 pandemic. In particular, historical survey data were extracted for 25 periods, from August 2021 (i.e., when data for difficulty with paying expenses was first available) to May 2023 (i.e., when the federal COVID-19 PHE declaration ended). Twenty-two variables, including demographic and socioeconomic factors, household information (e.g., household income and household sizes), COVID-related factors (e.g., symptom severeness), and economic-related variables (e.g., types of work, food sufficiently, and difficult with paying expenses), were extracted for each sample. These data were, in turn, used for time profiling and cluster analysis to evaluate similarities and differences between different demographic and socioeconomic groups for the difficulty with paying expenses. ANOVA analysis [35,36,37,38] was further used to test possible significance in these differences, such as expense difficulty between population groups across different states, demographics, and socioeconomic status. The Tukey’s Multiple Component [39,40] test was used to determine where these significant differences lie. The relative importance of different quantitative factors (e.g., age, income, and education level) on inflation concerns was determined through dominance analysis [41,42]. The difficulty with paying expenses for a group associated with the most dominant factor was compared with federal data such as CPI to investigate whether CPI data correctly reflected survey participants’ opinions on inflation. The results from this study should empower policymakers to target specific demographic and socioeconomic groups for financial assistance in the post-COVID era and potential future pandemics.

2. Materials and Methods
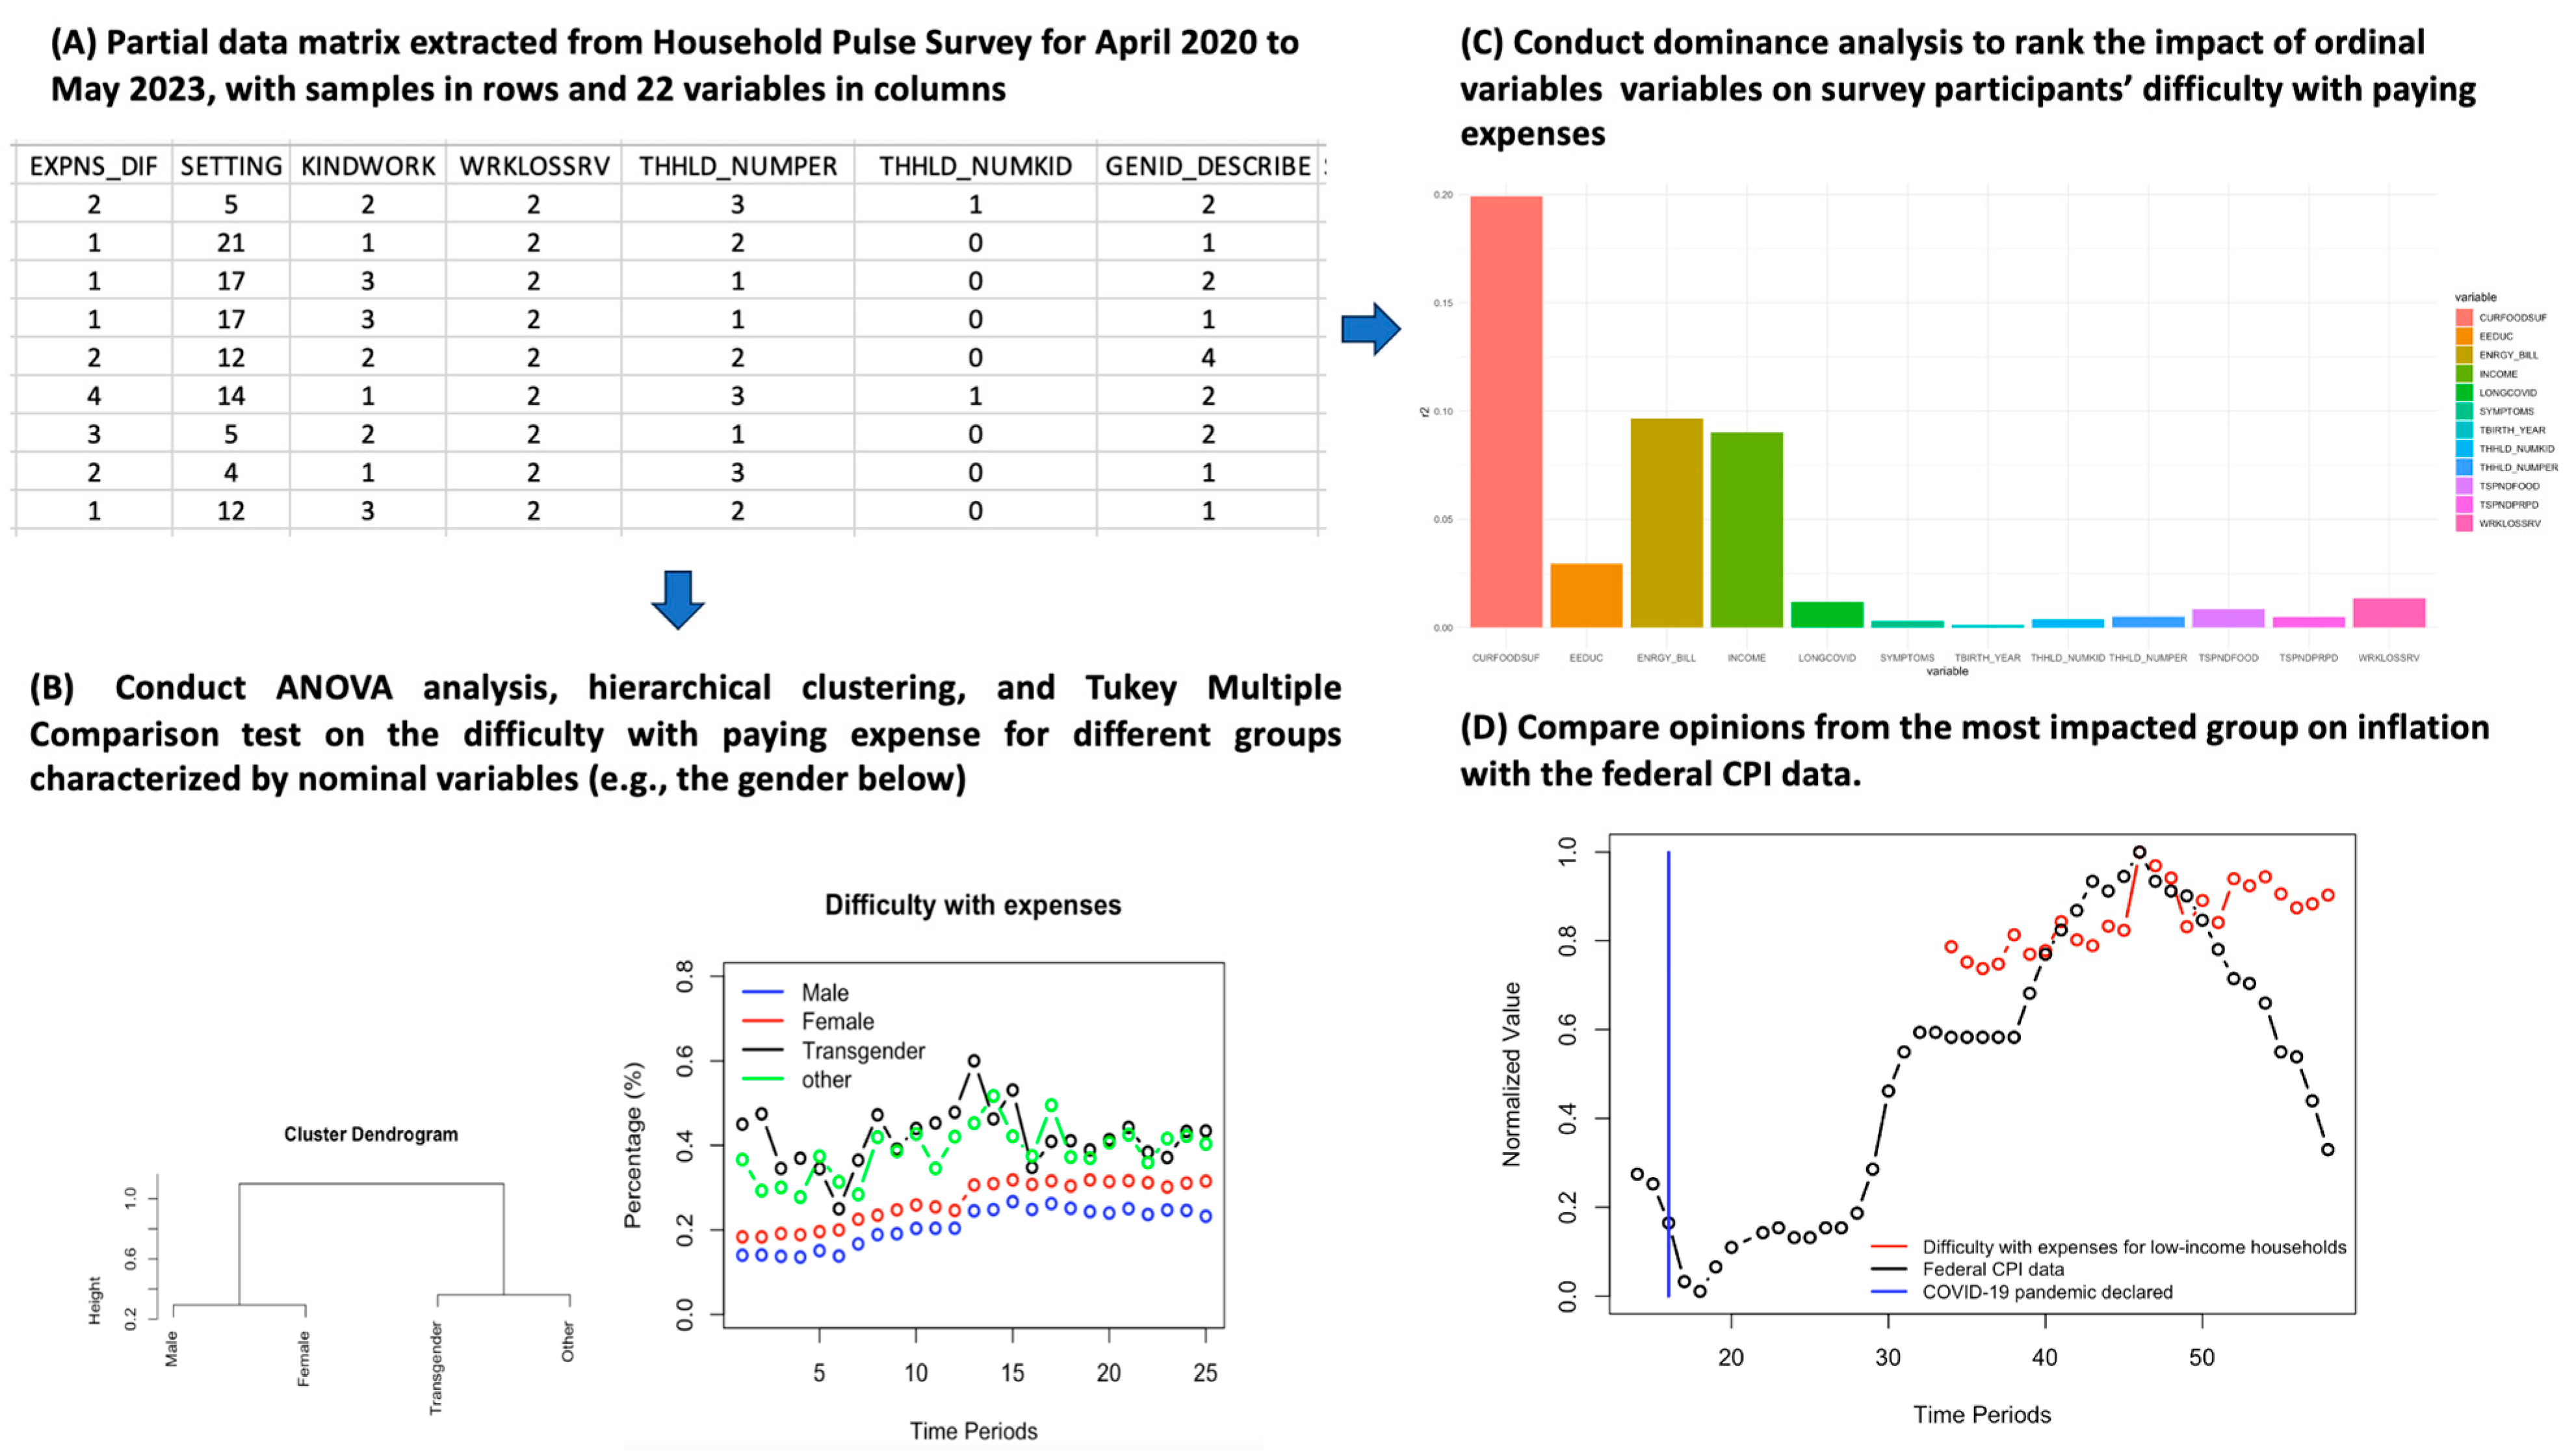
While the details of materials and methods are given in the following subsections, Figure 1 shows the overview of the materials and methods implemented in this work. Historical data from April 2020 to May 2023 was downloaded as *.csv files, extracted, and combined into a data matrix, as shown in Figure 1A. Data provided earlier than April 2020 did not contain the information for difficulty with paying expenses. This is the major reason for the focus on data sampled beginning in April 2020. The extracted data matrix was organized in such a way that each sample is listed in a row with the corresponding variables listed in columns (e.g., gender—represented by GENID_DESCRIBED in Figure 1A). The variables were then separated into nominal variables and ordinal variables. Nominal variables represent categories with no inherent order or ranking, while ordinal variables represent categories with a specific order or ranking. For example, someone who is male, female, or transgender is represented by 1, 2, and 3 as the value for the nominal variable GenderID, but the increase or decrease in assigned numbers has no logical meaning. Nominal variables in this study include the location (i.e., located states), gender identity, sector of employment, marital status, race, business or organization type, sexual orientation, and housing owned or rented (tenure). Time profiles for difficulty with paying expenses were obtained from nominal variables. Based on these profiles, ANOVA analysis was conducted to see whether significant differences existed in the groups of each category (e.g., male, female, and transgender groups in the gender category in Figure 1B) for difficulty with paying expenses. This is followed by hierarchical clustering (Figure 1B), where the proximity of groups in the dendrogram reflects their similarities in dealing with expense challenges. For instance, male participants exhibited closer similarities in difficulty with paying expenses to female participants than to transgender participants. Tukey’s Multiple Comparison test was then used to identify the groups showing significant differences from others (e.g., the female group versus the transgender group in Figure 1B). The null hypothesis is that there is no significant difference between the selected two groups, while the alternative hypothesis is that a significant difference exists (p-value < 0.05).
The ordinal variables include categories with a specific order or ranking, such as difficulty with paying expenses, household food sufficiency, educational attainment, difficulty paying full energy bill, total household income, coronavirus symptom severeness, long coronavirus symptoms, year of birth, total number of people under 18-years-old in household, total number of people in household, household spending on food and groceries, household spending on prepared meals, recent household job loss, and sampling time. Dominance analysis was conducted to rank the impact of these variables (i.e., factors) on survey participants’ difficulty with paying expenses (Figure 1C). The results from the population groups associated with the most influence factors (e.g., total household income in Figure 1D) were normalized to the range of 0 to 1 and compared with the normalized CPI time profile to reflect the difference in those persons’ opinions on inflation and federal CPI data. The normalization was conducted by dividing each profile (e.g., CPI) by the maximum value of the profile (e.g., maximum CPI value for all time periods).

2.1. Materials

The Household Pulse Survey is a short-term experimental survey conducted by the U.S. Census Bureau. It is unique because it provides accurate sample coverage of the broader low-income population [8]. It is designed to deploy data collected on how people’s lives have been impacted by COVID-19. The survey started collecting data on 23 April 2020 and has continued to collect more data in different phases that used two-week or one-month collection and dissemination periods. The current phases are Phase 1 (23 April 2020 to 21 July 2020), Phase 2 (19 August 2020 to 26 October 2020), Phase 3 (28 October 2020 to 29 March 2021), Phase 3.1 (14 April to 5 July 2021), Phase 3.2 (21 July 2021 to 11 October 2021), Phase 3.3 (1 December 2021 to 7 February 2022), Phase 3.4 (2 March to 9 May 2022), Phase 3.5 (1 June 2022 to 8 August 2022), Phase 3.6 (14 September 2022 to 14 November 2022), Phase 3.7 (9 December 2022 to 13 February 2023), and Phase 3.8 (1 March 2023 to 8 May 2023). Phases 3.3 and later continued two-week collection periods but shifted to a two-week on, two-weeks off collection strategy. While this may appear to be an issue, the continuous period indexes were used in order to maintain consistency. Data for difficulty with expenses has been available since 2 August 2021, in Phase 3.2. While extensive research has been conducted on the impact of the COVID-19 pandemic on economics (as shown in the detailed literature review in the Introduction section), this study aims to provide a comprehensive analysis of a complete version of these data for the COVID-19 pandemic. Therefore, the samples studied in this work were extracted from 2 August 2021 to 8 May 2023 (which is very close to the date when the federal COVID-19 PHE declaration ended).
It is crucial to extract these data and store them in the proper format for processing. The variables in the dataset include nominal variables with no inherent order or ranking and ordinal variables, including categories with a specific order or ranking. There are 22 variables selected in this study on the basis of the literature review. They are either demographic/socioeconomic factors or variables relevant to economics. Mental health was not elected as extensive research has been conducted on the impact of economic hardship on mental health (refer to [10,43,44,45,46,47,48,49,50,51,52,53] for examples). Data for difficulty with paying expenses was available earlier than data for the perception of price changes, concerns of price change, and price stress (i.e., 2 August 2021 versus 14 September 2022). All participants agreed that prices have changed, i.e., the perception of price changes is always equal to Yes. There is a high correlation between difficulty with paying expenses and either concern with price change or price stress. Therefore, perception of price changes, concerns of price change, and price stress were not retained on the variable list. Table 1 lists the 22 variables, with nominal variables marked in RED and ordinal variables marked in BLACK. The abbreviations and their meanings were obtained from the Pulse Survey Database [54]
The datasets for the 25 periods (August 2021 to May 2023) were downloaded in the format of *.csv files from the Household Pulse Survey. An R program was created to extract data from *.csv files and compile it into a matrix comprising the 22 variables related to inflation. Only the samples with complete information for all the 22 variables were included in this study. This resulted in 574,265 samples. These samples were organized into a *.csv format, as shown in Figure 1A. In addition to data extracted from the Household Pulse Survey, data were also collected manually from federal websites regarding the consumer price index (CPI), crude oil price, natural gas price, food price, and food insufficiency during the period 10 January 2020, to 30 June 2023. These data were compared with data from the Household Pulse Survey after all data were normalized into the range of 0 to 1 to investigate inflation claims and experiences across socioeconomic groups to federal data. CPI data were collected from the Economic Labor Market Information Bureau and the U.S. Labor Bureau of Statistics. The prices for oil and natural gas were downloaded from references [55,56], respectively. Data for food prices and food insufficiency were obtained from reference [57].

2.2. Methods

R (version R-4.3.1), a common programming language used for statistical data analysis, was utilized to identify significant factors in inflation concerns during the pandemic. R programs were developed to extract 22 inflation-relevant variables from the collected *.csv files into a matrix, with columns for variables and rows for records of people’s responses to questions implied by variables (e.g., as shown in Figure 1A). A data matrix was used in time profiling to show people’s responses in difficulty with paying expenses when comparing various groups of people, specific to traits indicated by the 8 nominal variables, i.e., the location (i.e., located states), gender identity, sector of employment, marital status, race, business or organization type, sexual orientation, housing owned or rented (tenure). Hierarchical clustering analysis [58] was used to identify response similarities between groups. Groups more closely related were in closer proximity on the cluster dendrogram, while more different groups branched off. These characteristics were then compared with the results in time profiling to see if the relationships matched up in both tests.
ANOVA (R command aov) was further used to determine if a difference between groups was statistically significant or simply a result of random chance (i.e., deemed significant if p-value < 0.05). ANOVA analysis was followed by Tukey’s Multiple Comparison, a tool for multiple t-tests, revealing between which groups the relationship was significant. Figure 2 below shows an example of ANOVA analysis for analyzing difficulty with paying expenses between different racial groups. The upper section of Figure 2 shows data for difficulty with paying in each period for the following race groups: White, Black, Asian, and Others. Only data for the first 7 periods are shown in Figure 2 due to space constraints. The specific dates for individual periods can be found on the website of the Household Pulse Survey. The values in the dataset indicate the percentages of each group with difficulty in paying expenses. For example, 0.151368 in the first column and the first row means 15.1368% of White Americans felt difficulty with paying expenses in Period One (2 August–16 August 2021). ANOVA analysis returned a p-value less than 0.05, which indicates a significant difference in these race groups for their difficulty with paying expenses. Tukey’s Multiple Comparison (R command TukeyHSD) tests revealed that each pair shows a significant difference (p-value less than 0.05), except between Others and Black race groups (p-value equal to 0.199).
While ANOVA analysis and Tukey’s Multiple Comparison tests were conducted for nominal variables that represent categories with no inherent order or ranking, dominance analysis was implemented to investigate the impact of ordinal variables that can be quantified by numerical values on the opinions of survey participants for inflation. Dominance analysis is one of the most common methods that compare the relative importance of predictors/input variables in the framework of regression models [42]. For the purpose of illustration, Figure 3 shows the dominance analysis of partial ordinal variables to rank their impacts on people’s view of difficulty in paying expenses (repressed by EXPNS_DIF). Dominance analysis (R command dominanceAnalysis) built one-input linear regression models for each input first and calculated the R2 for each model. For example, the R2 for the linear model EXPNS_DIF = a0 + a1 × INCOME is 0.2 (i.e., the first value in the column for INCOME in Figure 3A). R2 was increased by 0.126 if INCOME is added into the two-input linear regression model EXPNS_DIF = a0 + a1 × EEDUC + a2 × INCOME. This increase in R2 quantified the contribution of adding INCOME into the model with education level (i.e., EEDUC) as the only input. This was repeated to attain the increase in R2 for the other two-input linear regression models with INCOME as one of the two inputs. This step was repeated for three-input and more-input linear regression models. The average increase in R2 due to the addition of INCOME into the linear regression models was quantified in Figure 3B. This value and the values for other inputs in Figure 3B were then used to rank the inputs for their impact on people’s opinions on difficulty with paying expenses.
CPI is a commonly used indicator for inflation that estimates changes in the average price of products using a sample of common household goods and services. Higher CPI indicates greater price change and, therefore, higher inflation. CPI time profiles were normalized into a range of 0 to 1 and compared alongside the normalized value for difficulty with paying expenses for the most impacted groups to determine whether federal inflation estimates using CPI accurately reflect public inflation feeling. Similarly, energy prices, such as prices for oil and natural gas, were compared with people’s opinions on difficulty with paying energy bills indicated by the Household Pulse Survey. Finally, food prices and food sufficiency were compared with food insufficiency for low-income households (from the HPS). Overall, these comparisons evaluated how well official inflation data compares with HPS data and the importance of factors not covered in federal data, such as socioeconomic influences.

3. Results

3.1. Investigation of the Difficulty with Paying Expenses for Different Demographic and Socioeconomic Groups Characterized by Nominal Variables

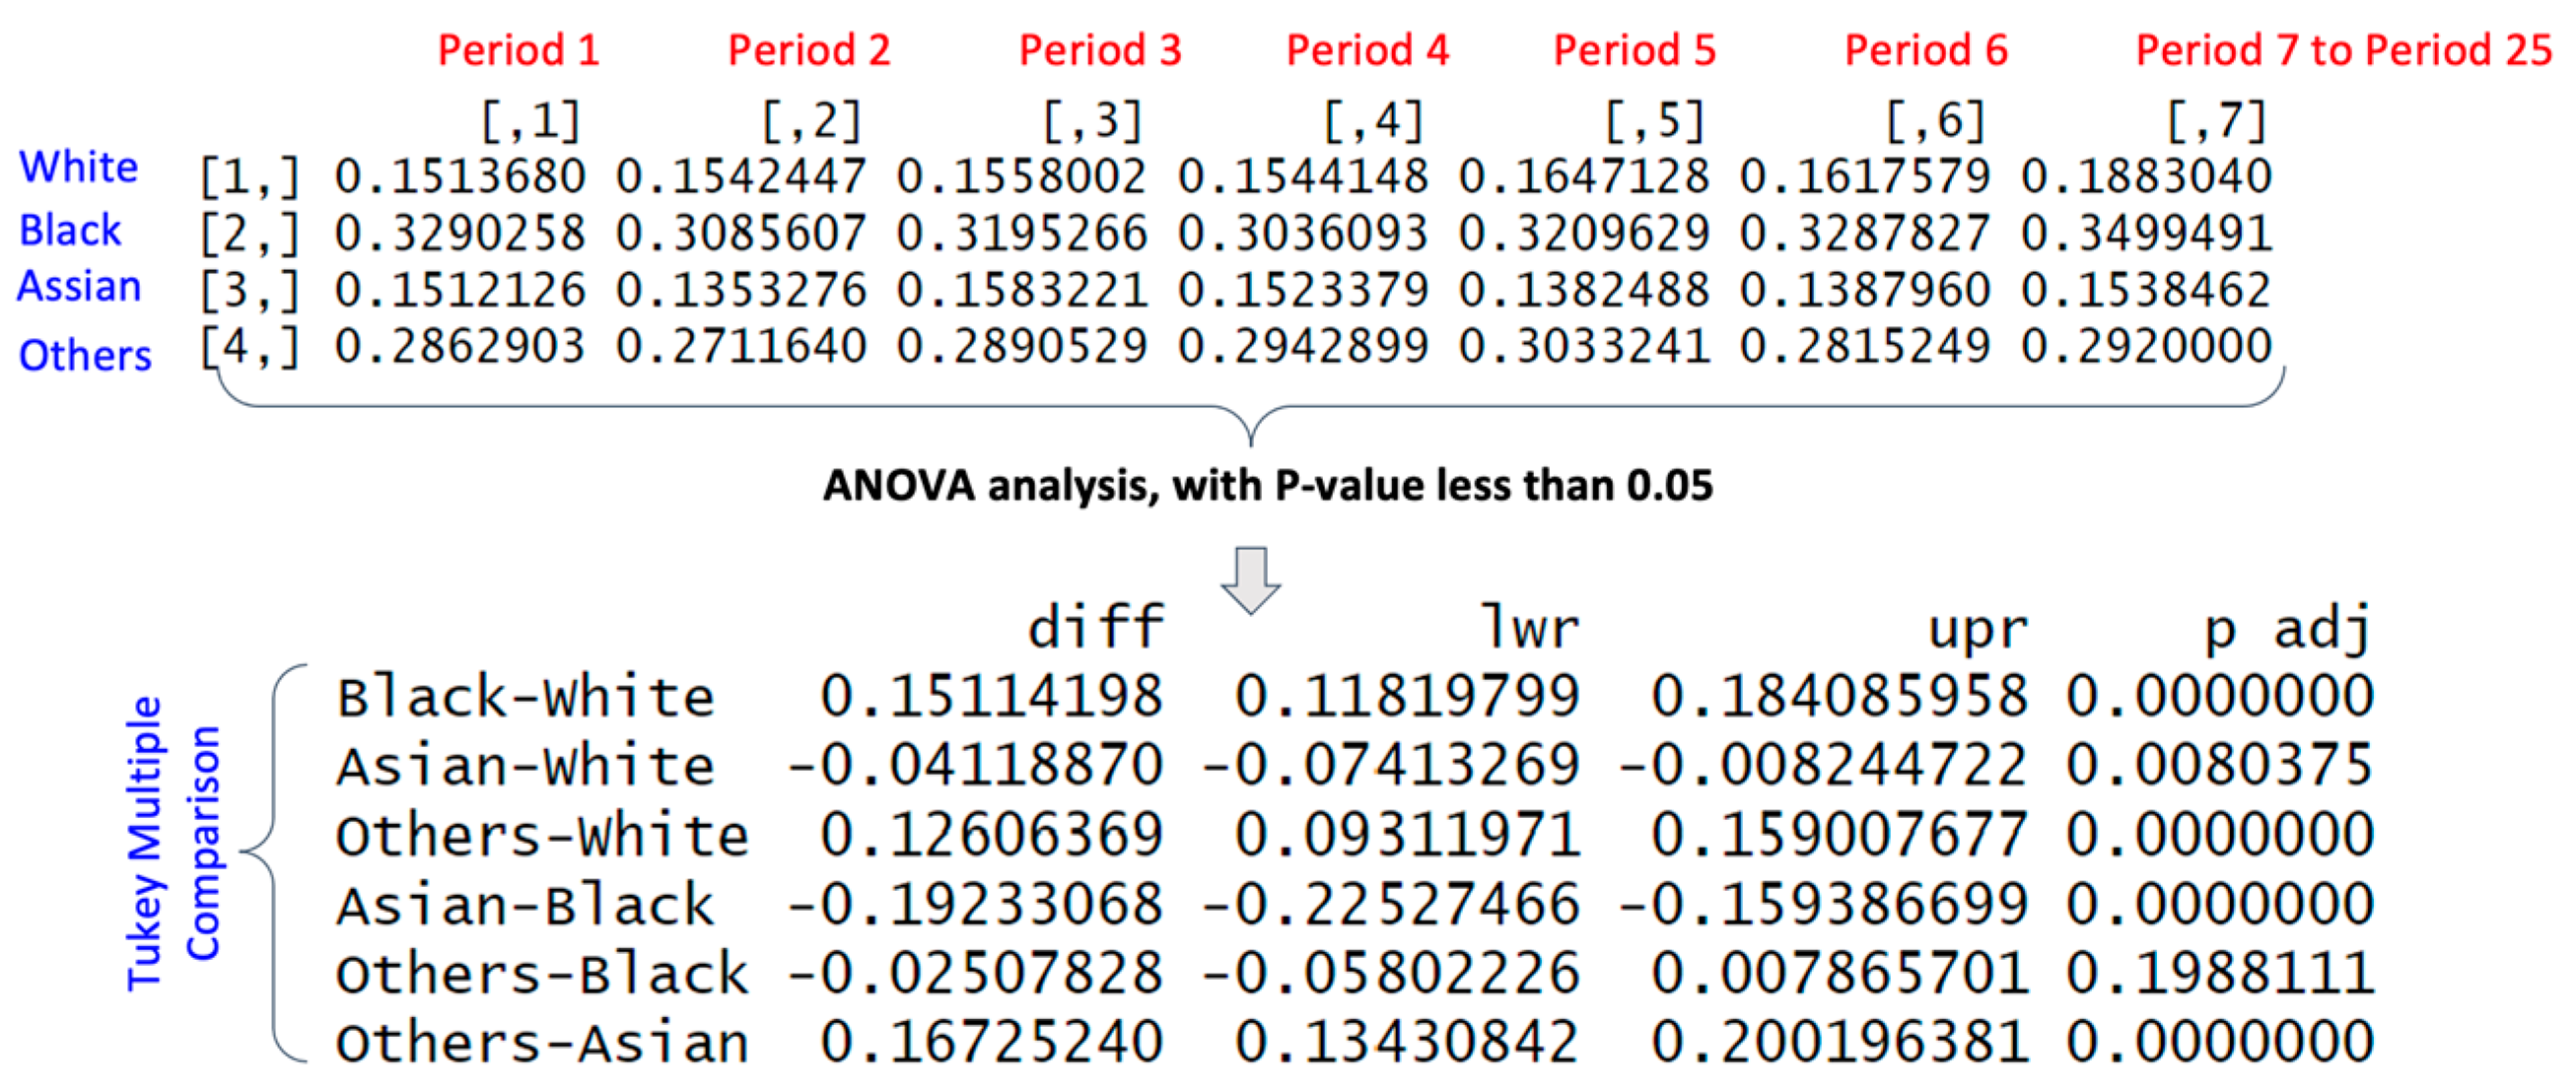
3.1.1. Difficulty with Paying Expenses for Different Races

Figure 4A shows the percentage of survey participants from different race groups expressing difficulty with paying expenses. It seems that the Black group shows more difficulty with expenses, followed by the other group (i.e., mixed races), the White group, and the Asian group. ANOVA analysis indicates that there is a significant difference in these race groups for their difficulty with the expense (p-value < 0.05). Tukey’s Multiple Comparison showed that each pair showed a significant difference (p-value less than 0.05). Based on Figure 4A, the similarity of different race groups in their difficulty with expense is shown in Figure 4B by hierarchical clustering. It seems the White and Asian groups are clustered together, while so are the Black and Other groups.

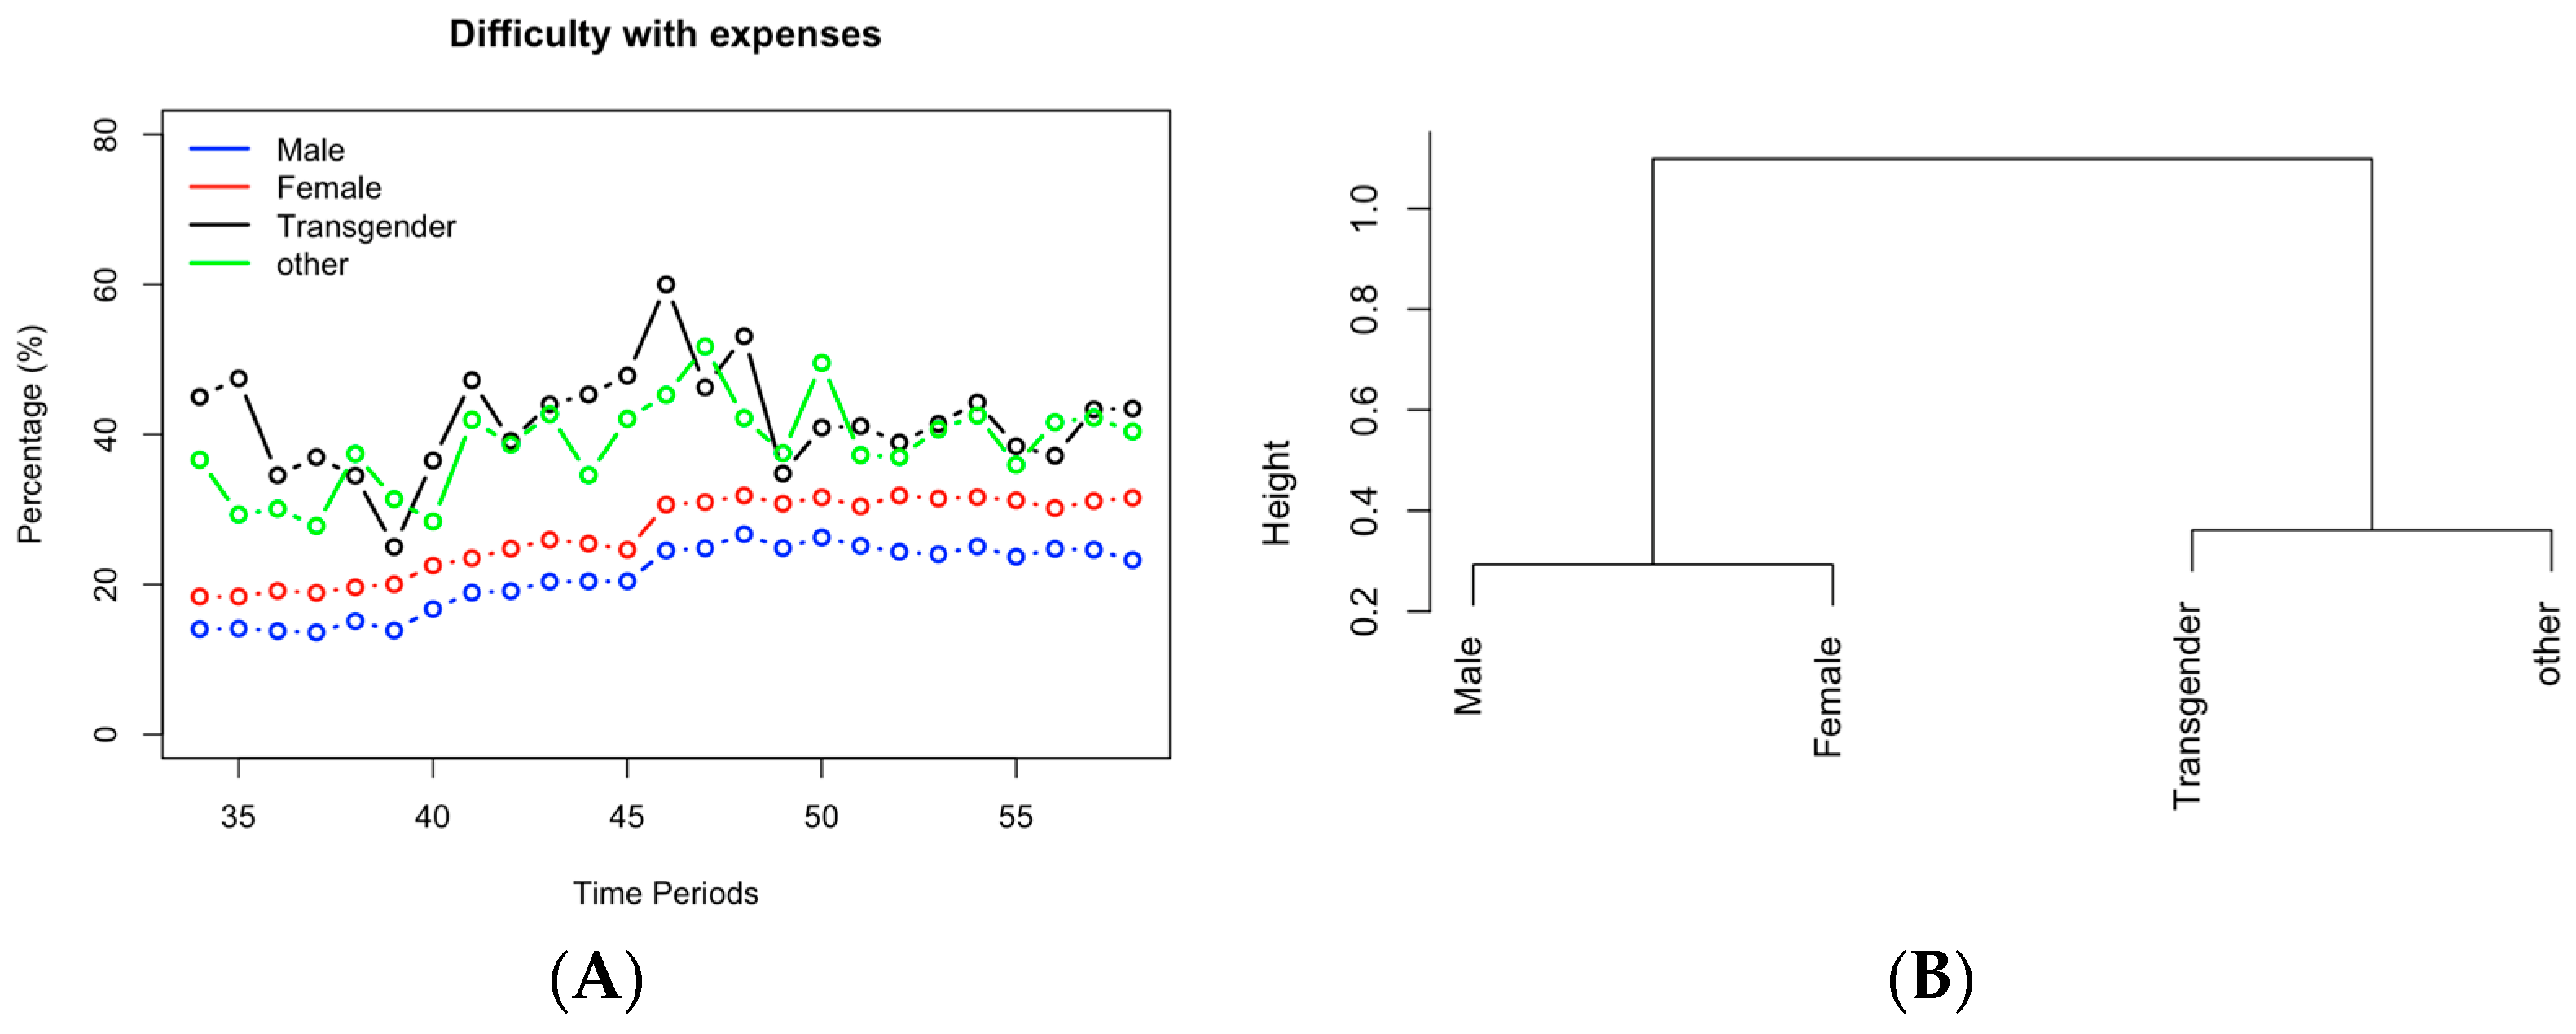
3.1.2. Difficulty with Paying Expenses for Different Genders

Figure 5 shows the difficulty with expenses from the four groups of people consisting of male, female, transgender, and other. The “other” group represents people who selected “Other” as their gender in the Household Pulse Survey. Figure 5A shows that transgender people struggle the most with expenses. That is closely followed by the other group, the female group, and the male group. The ANOVA analysis concludes that there is a significant difference in the different gender groups when it comes to difficulty with expenses (p-value < 0.05). Tukey’s Multiple Comparison test shows that a significant difference was found between different gender groups, with the exception between the other and transgender group (p-value equal to 0.196). This is consistent with the hierarchical clustering results (Figure 5B), which shows that the male and female groups are clustered together while the other and transgender groups are clustered.

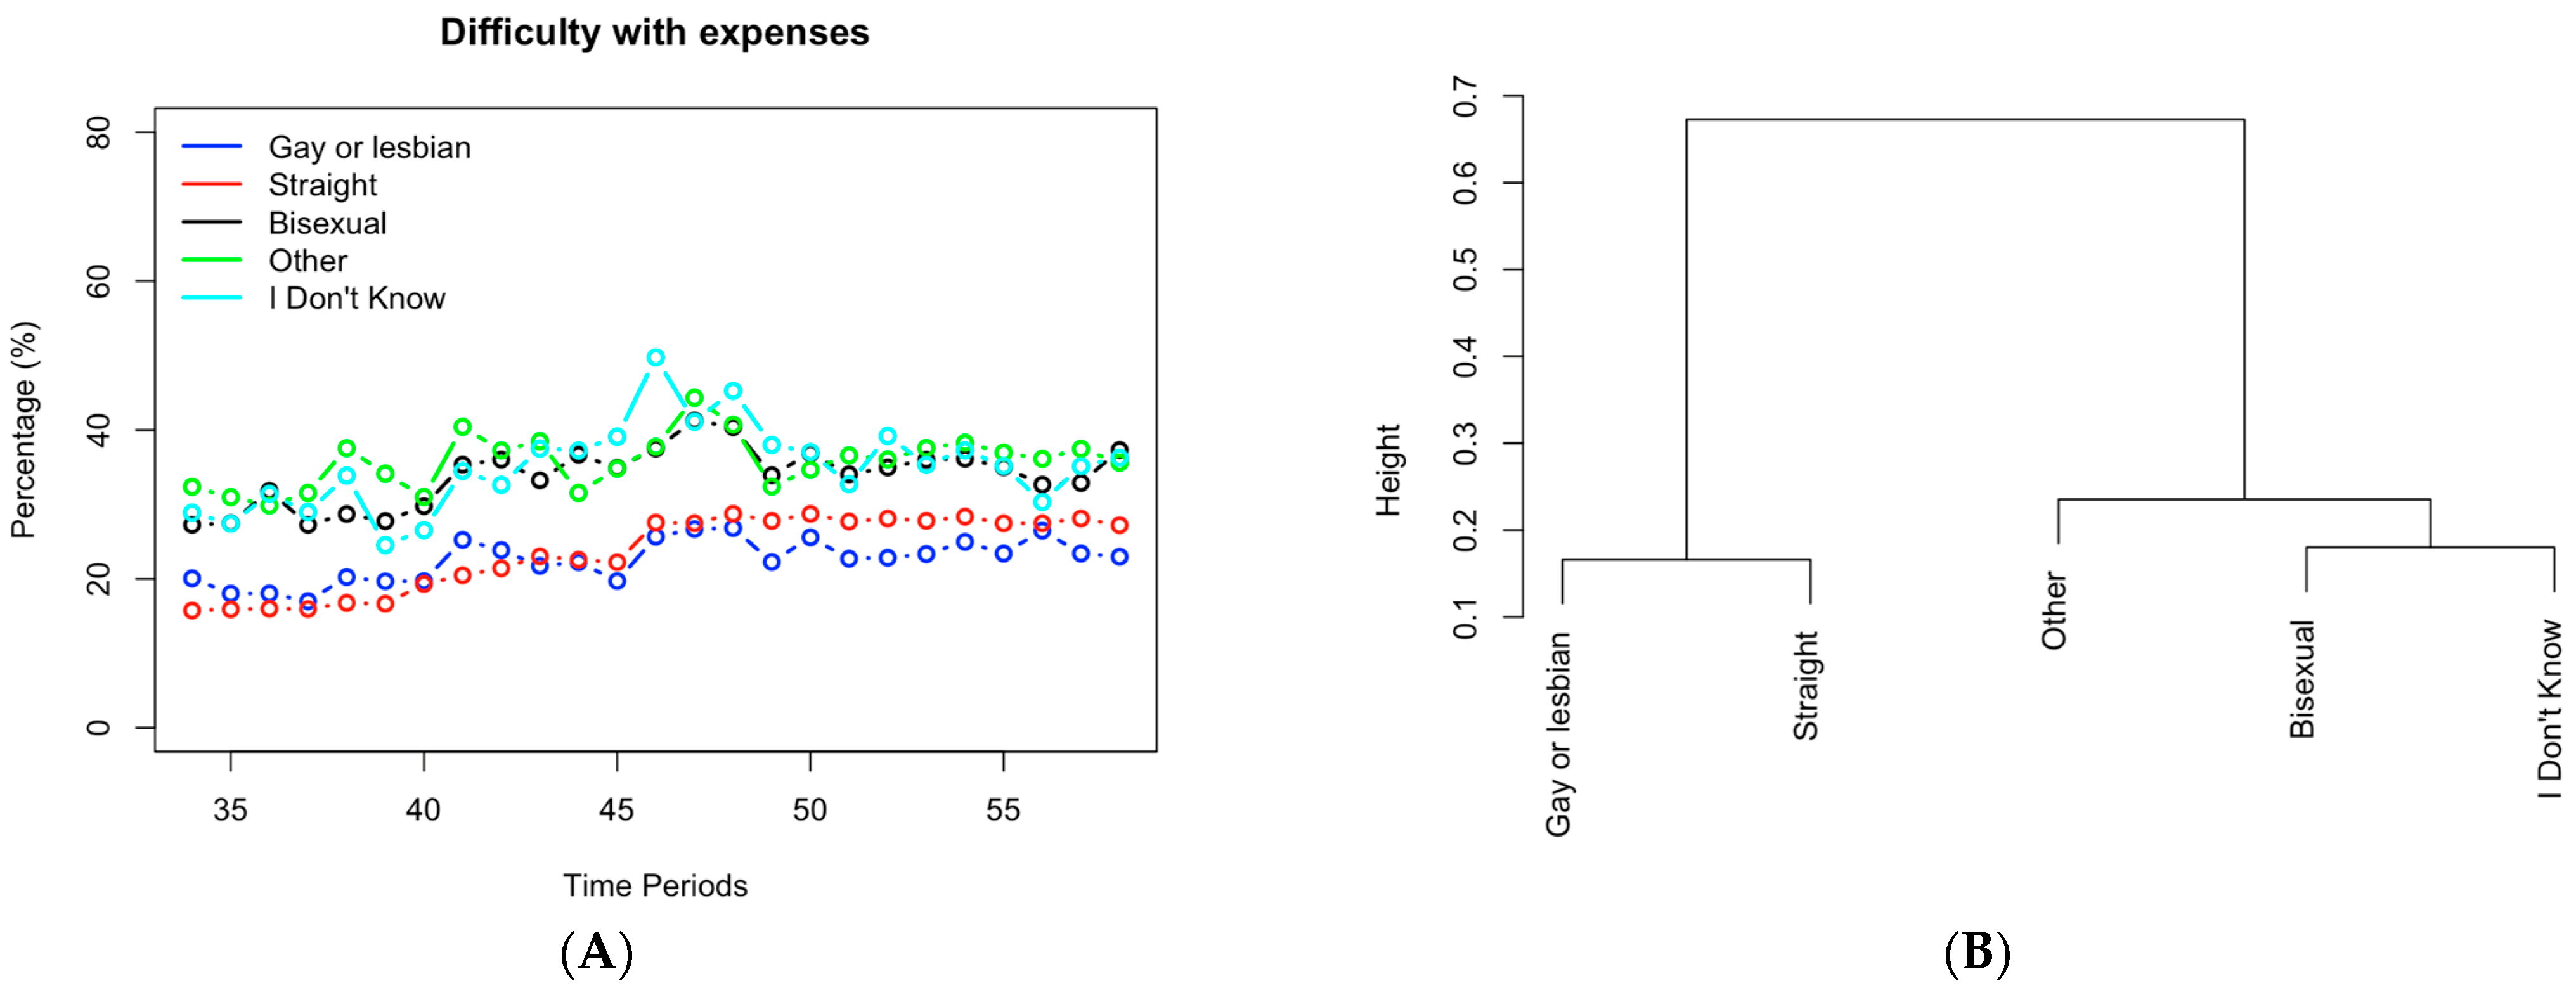
3.1.3. Difficulty with Paying Expenses for Different Sexual Orientations

Figure 6 shows the percentage of gay/lesbian, straight, bisexual, and other people who struggle with difficulty with expenses. The “Other” group shown in Figure 6 represents people who selected “Something else than gay/lesbian, straight and bisexual” as their sexual orientation, while the “I don’t know” group represents those choosing “I don’t know” as their answers. It seems from Figure 6A that the “I don’t know” group struggles the most, followed closely by the other and bisexual groups. The straight and gay or lesbian groups are clustered together in both Figure 6A,B. Through Tukey’s Multiple Comparison test, it seems that the groups clustered together (Gay or lesbian and straight, other and bisexual, and “I don’t know”) do not have a significant difference (p-value > 0.05). A significant difference was indicated between the groups from these two clusters (p-value < 0.05).

3.1.4. Difficulty with Paying Expenses for Different Marital Statuses

It can be seen from Figure 7A that the people who have had the most difficulty with expenses relating to their marital status are the people who have separated, followed by divorced, never married, widowed, and then finally, the people with the least difficulty are the people that are still married. However, a generally upward trend with difficulty with expenses was observed for all of the people regardless of marital status before Period 20. The ANOVA analysis concludes that there is a significant difference between the groups with different marital statuses (p-value < 0.05). Tukey’s Multiple Comparison test confirmed significant differences were observed between the groups with different marital statuses. The clustering diagram in Figure 7B shows the similarity between the marital status groups. Consistent with Figure 7A, the separated group and the married group were separated from the other three marital groups.

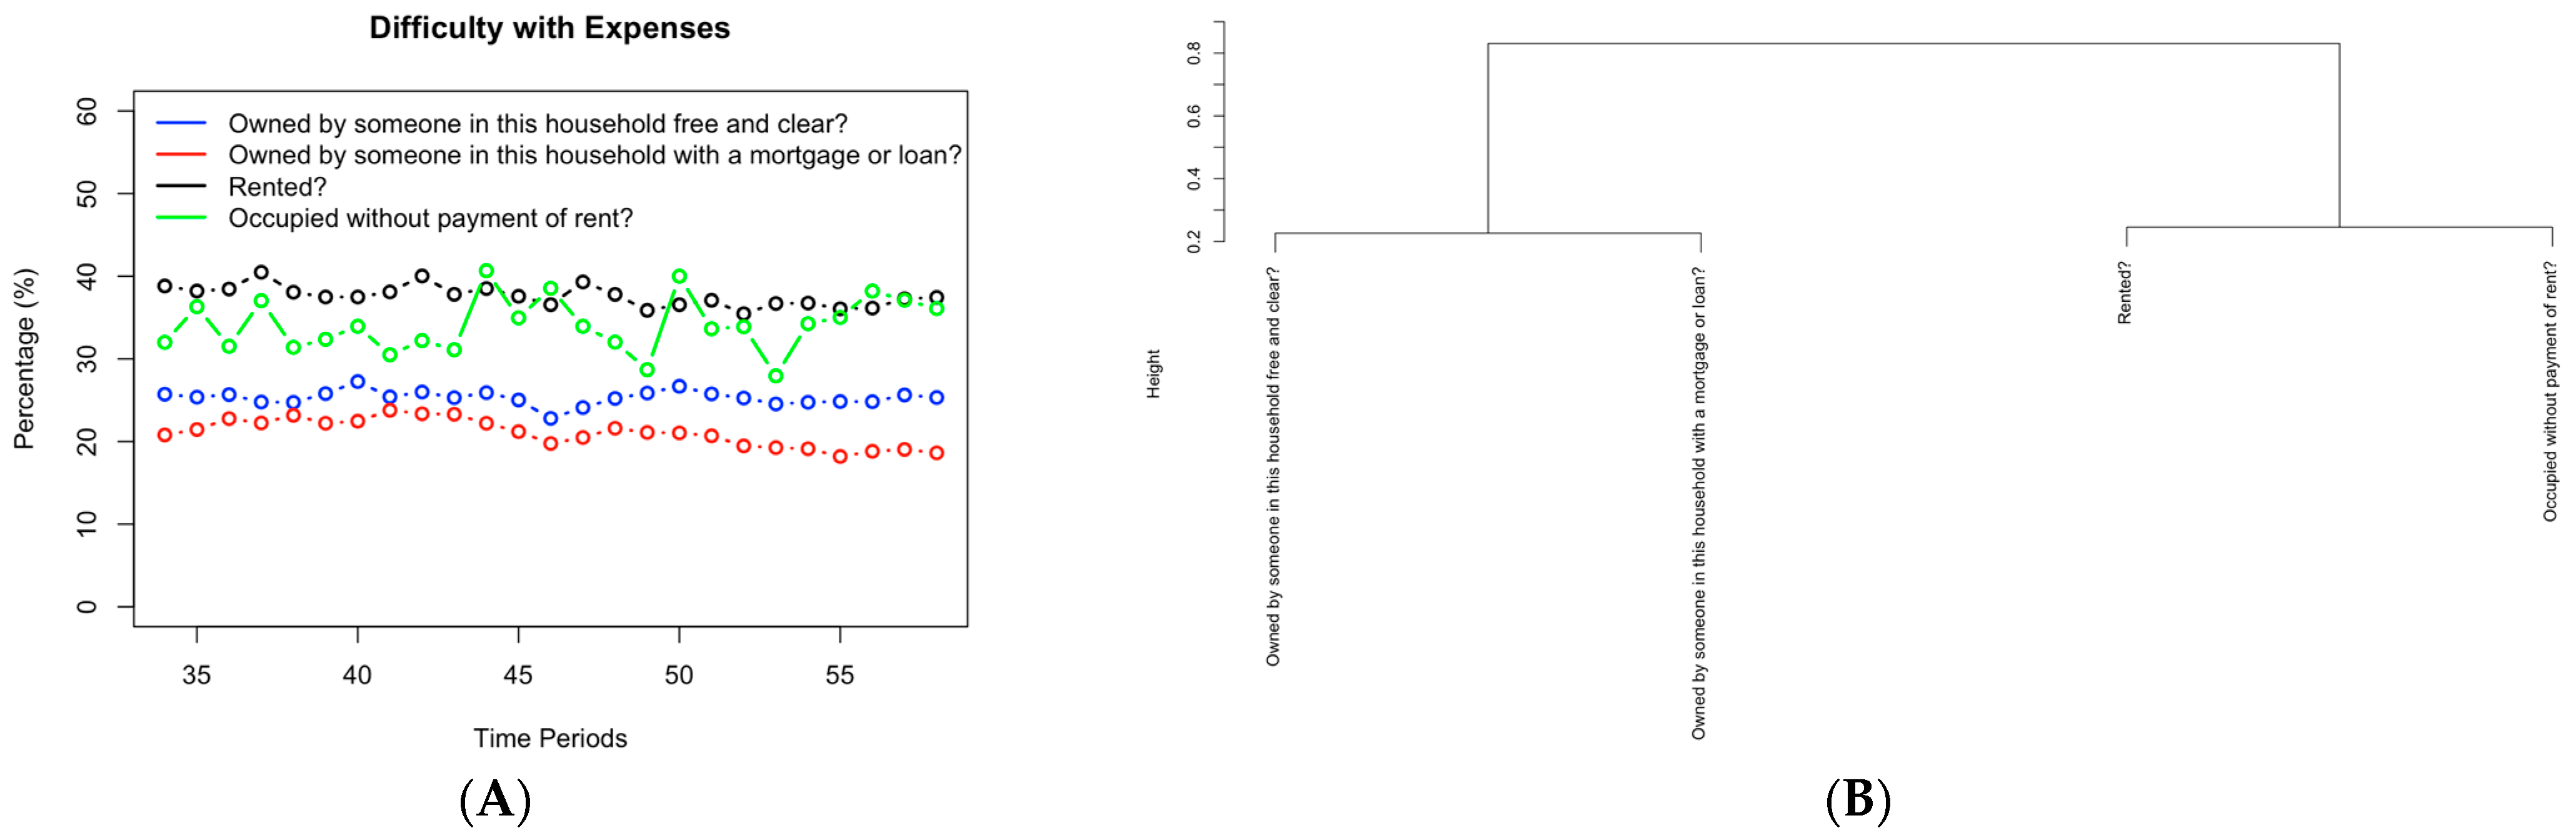
3.1.5. Difficulty with Paying Expenses for Different Property Statuses

It can be seen from Figure 8A that the people who rent have the greatest difficulty with paying expenses. It can also be seen that the people who occupied without payment of rent had the most unstable feeling of difficulty with paying expenses. The people who owned the houses with a clear loan or with a mortgage/loan showed the least difficulty with paying expenses. The clustering diagram in Figure 8B shows that the people who owned with or without a mortgage/loan are clustered into one group, while the people who rent or occupied without rent are clustered into another. The ANOVA analysis and Tukey’s Multiple Comparison test showed that every pair of different property statuses showed significant opinions on difficulty with paying expenses.

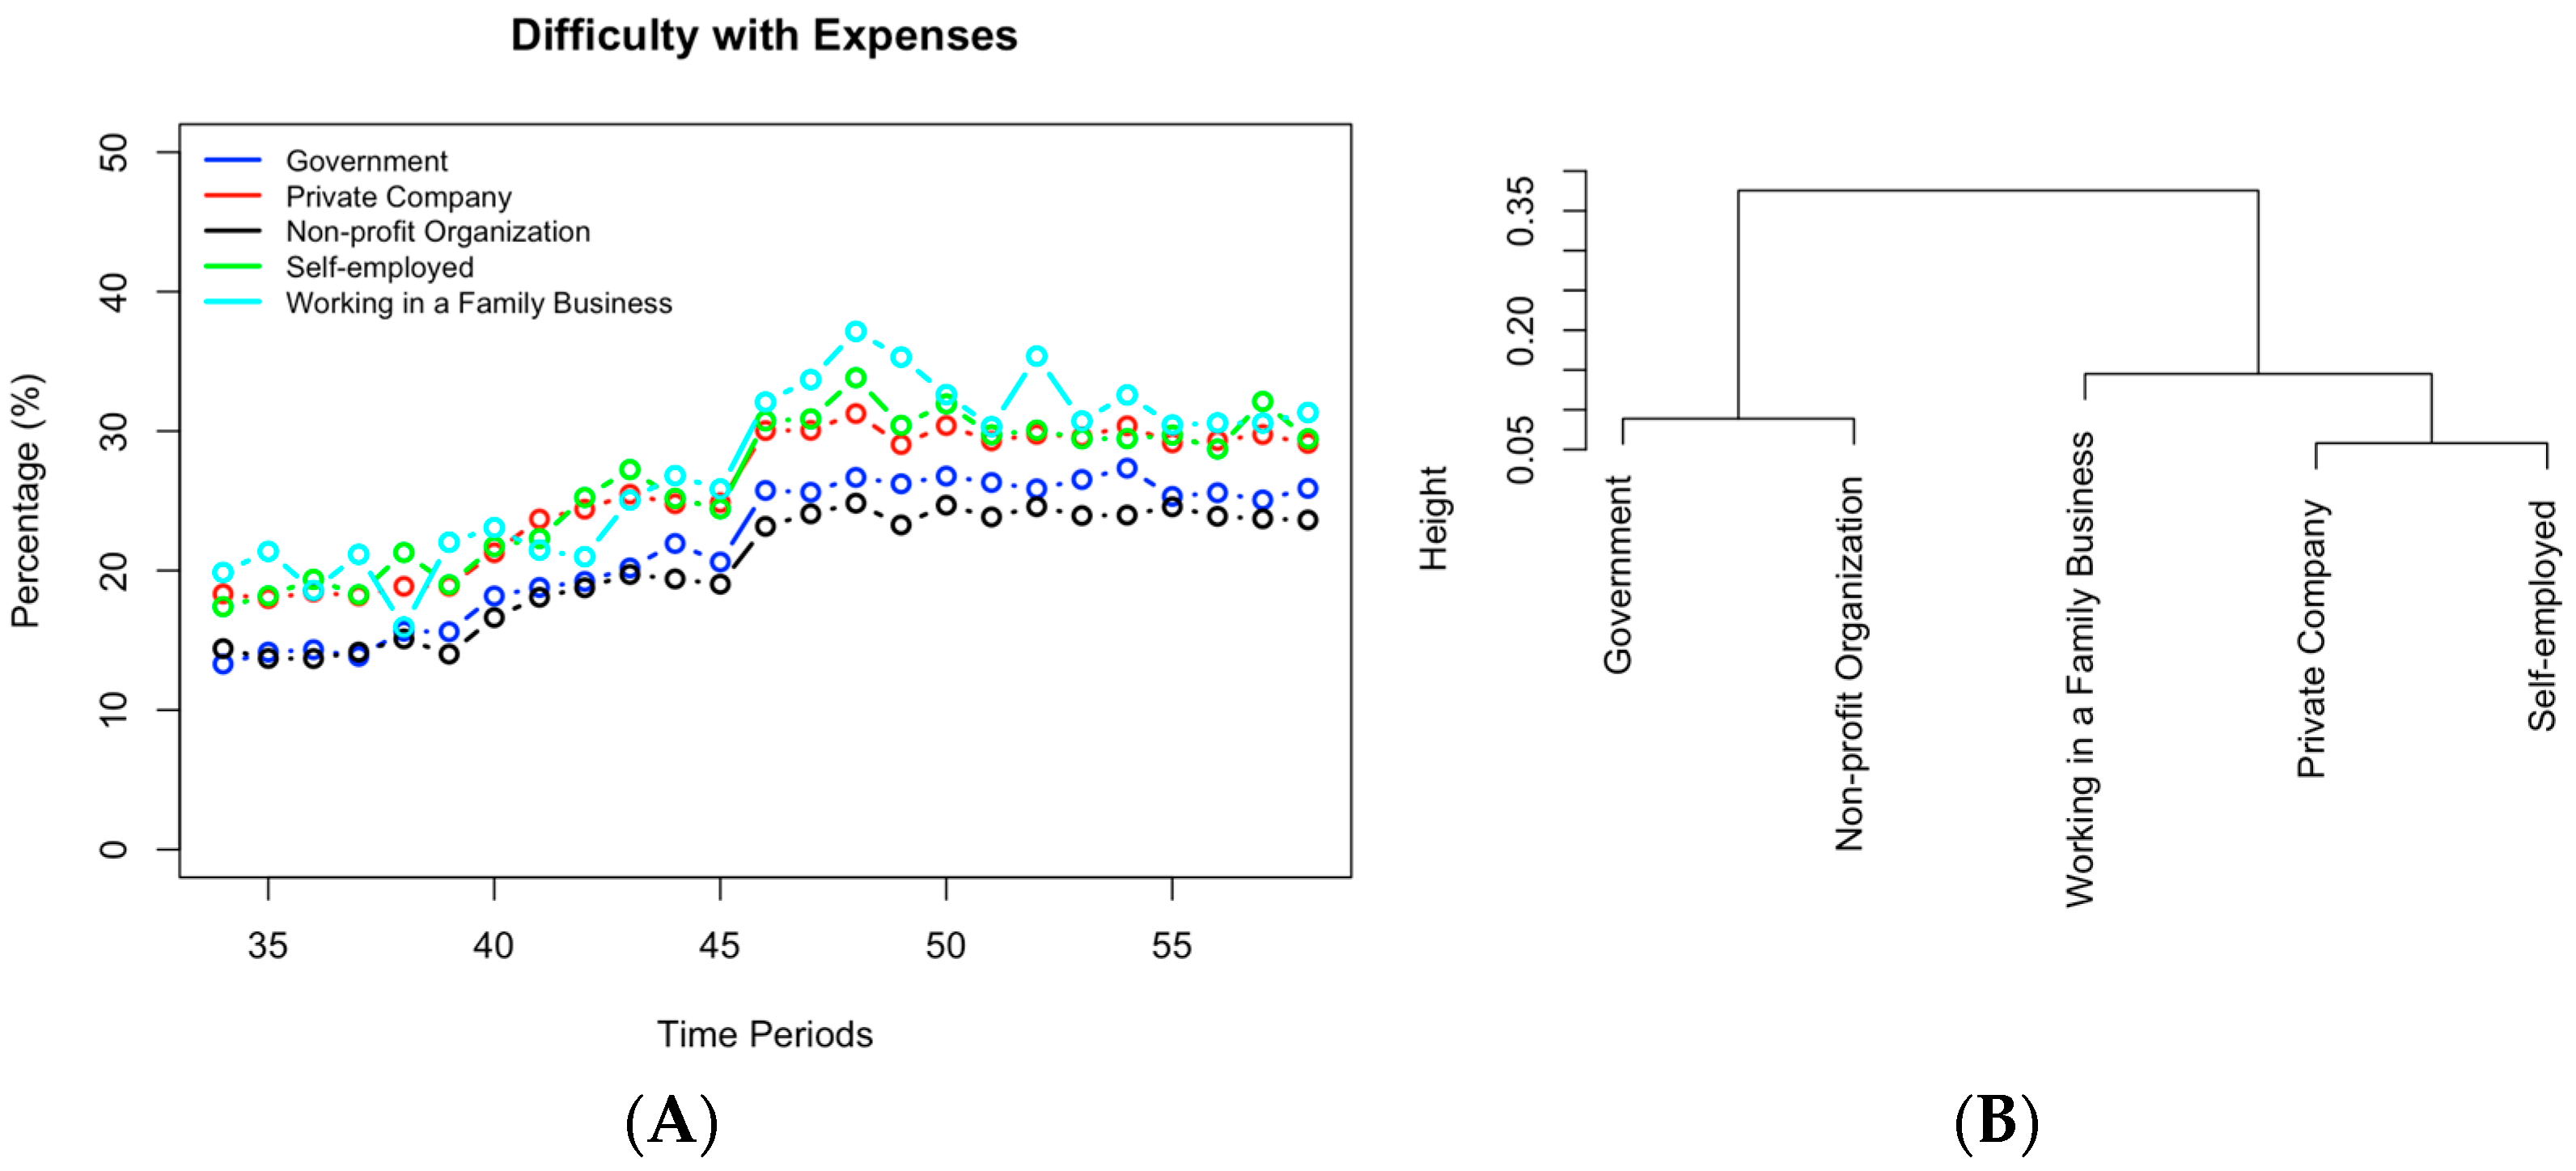
3.1.6. Difficulty with Paying Expenses for Different Sectors of Employment Clusters

It can be seen from Figure 9A that different employment sectors seem to be having similar trends of difficulty with expenses until about Period 45 to Period 48, where those working in a family business had spikes in difficulty with expenses. The ANOVA analysis indicated a significant difference between sectors of employment in their difficulty with expenses (p-value < 0.05). However, according to Tukey’s Multiple Comparison test, some groups did not have a significant difference between them. Such groups included non-profit organizations and government (p-value = 0.86), self-employed and private companies (p-value = 0.99), working in a family business and private company (p-value = 0.76), and working in a family business and self-employed (p-value = 0.94). The results are reflected in Figure 9B, in which government and non-profit organizations are clustered together, and the other three (i.e., working in a family business, private company, and self-employed) stay in the same branch.

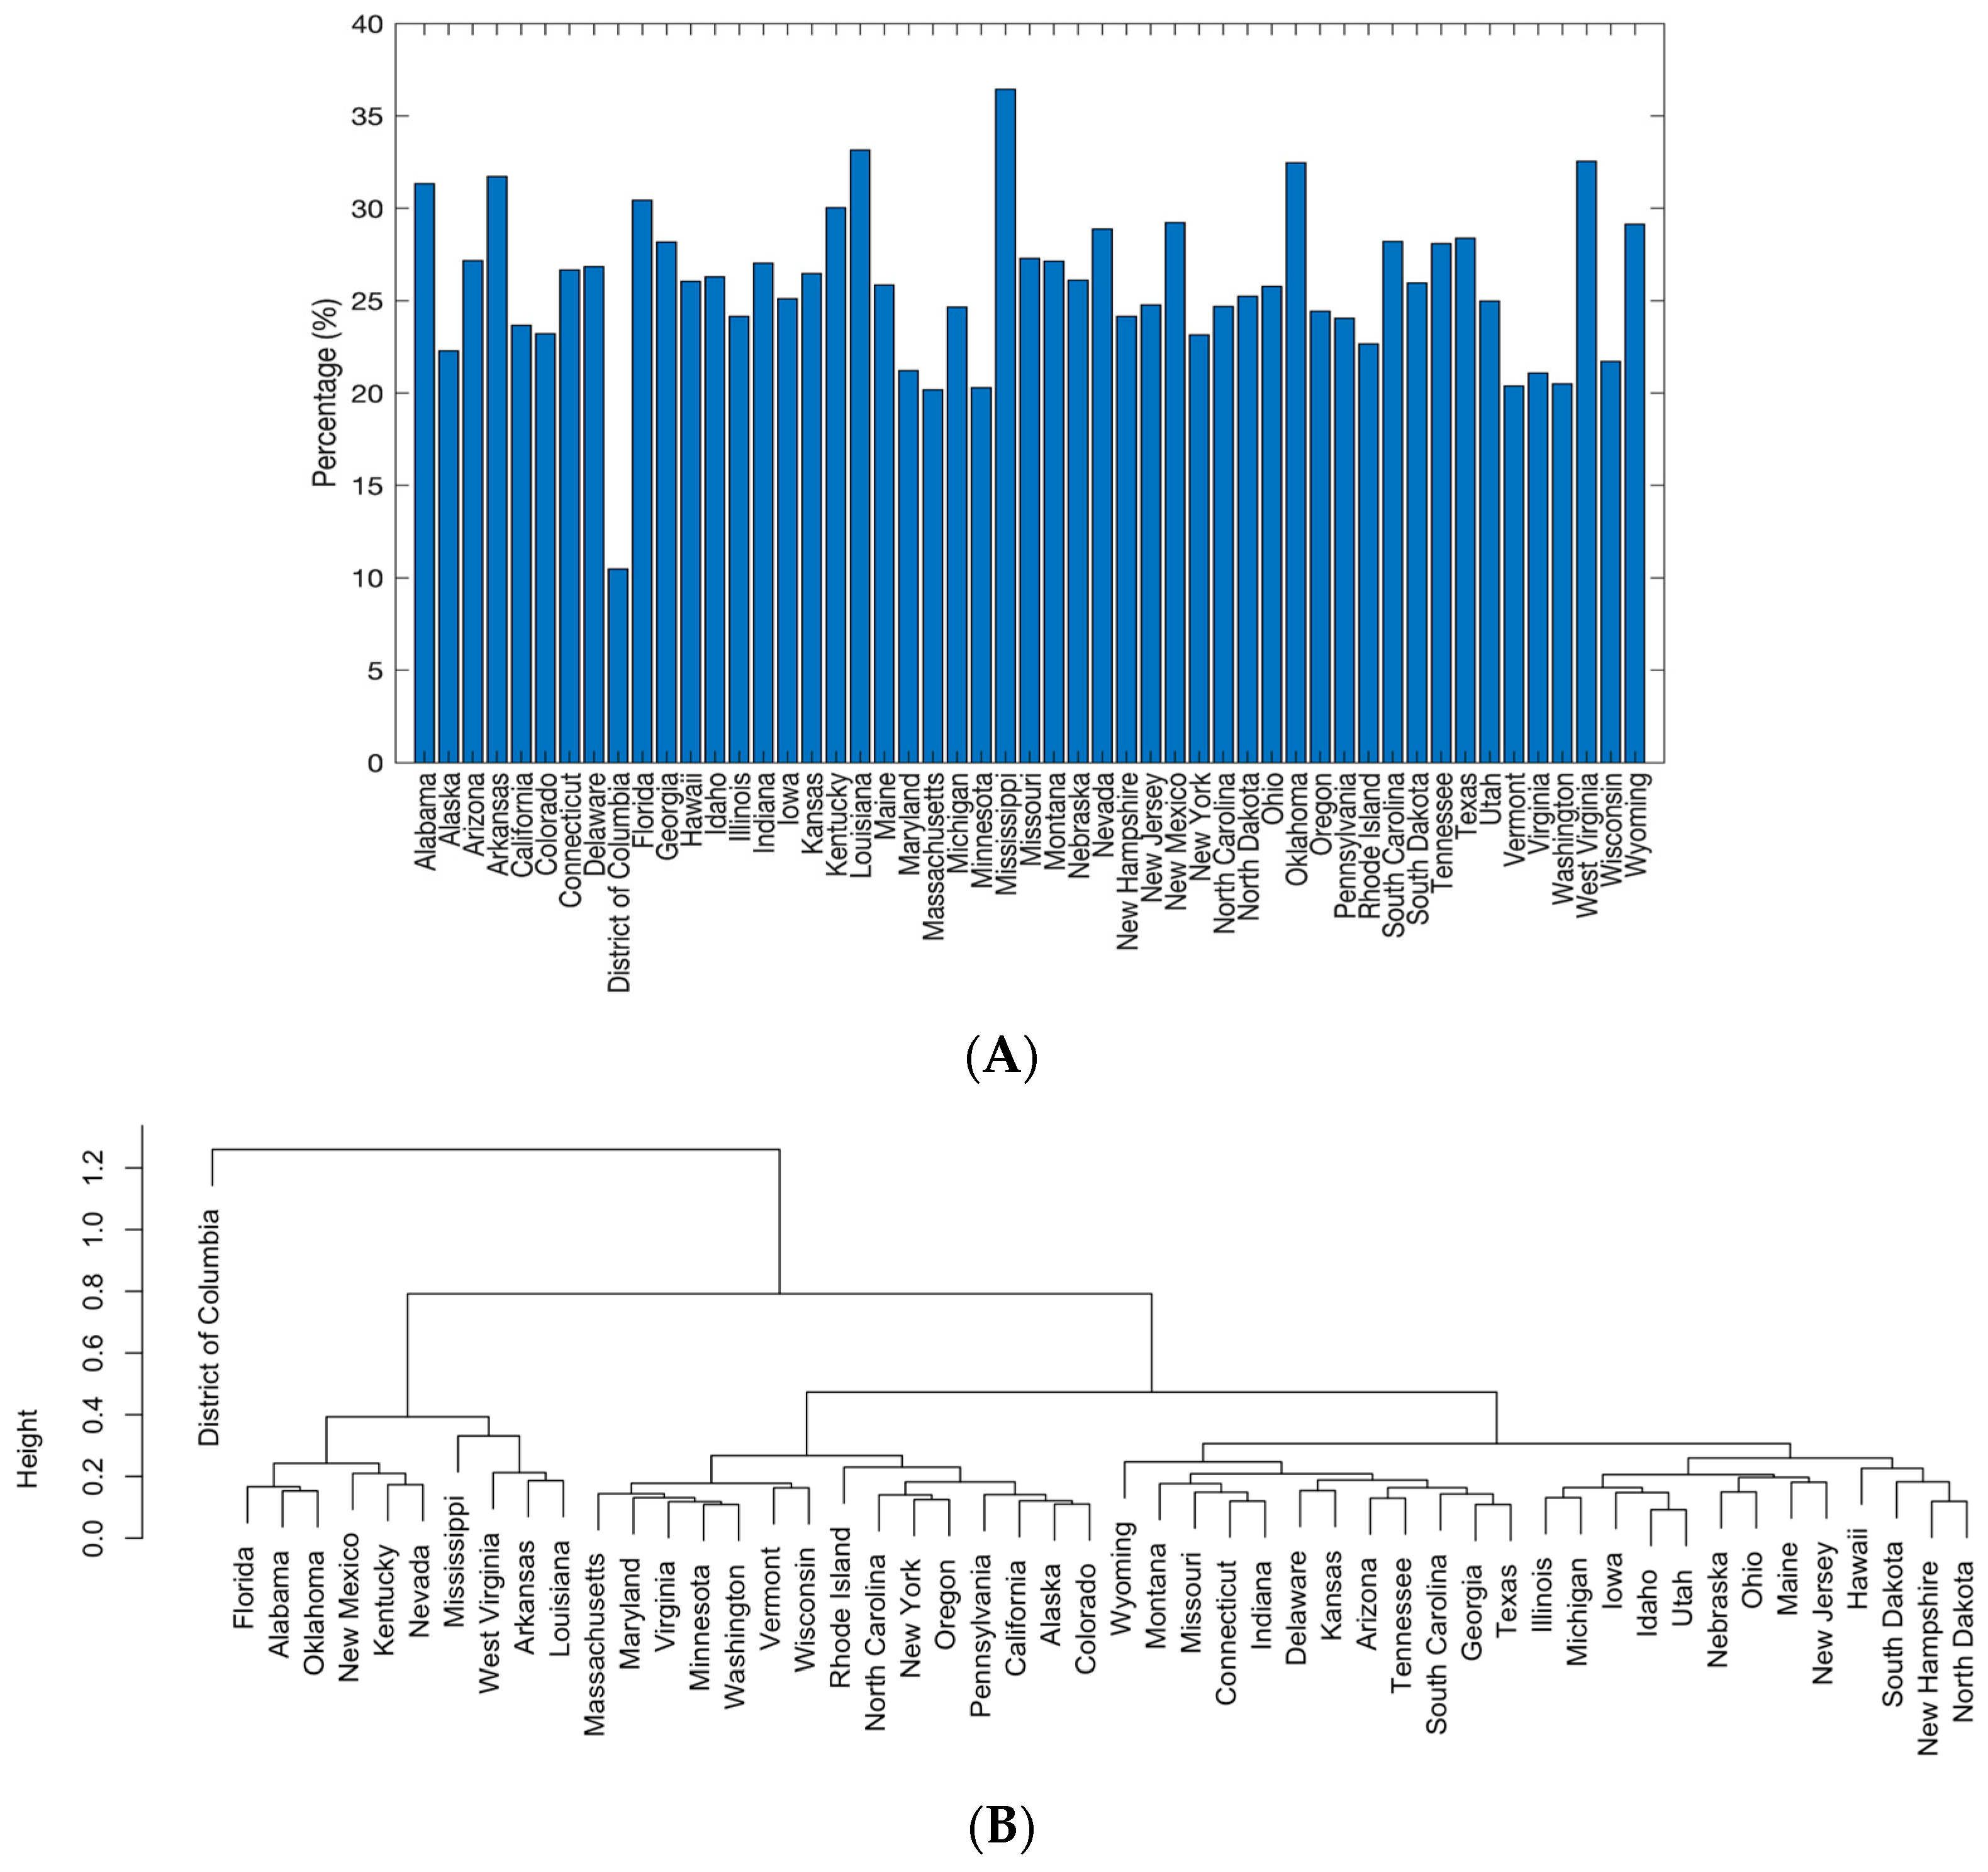
3.1.7. Difficulty with Paying Expenses for People from Different States (Locations)

Since there are 53 states and territories, their time profiles are challenging to distinguish from each other. Therefore, the average percentage over all periods of each state for difficulty with paying expenses was presented in a bar plot in Figure 10A. The similarities in the time profiles of these states are plotted in Figure 10B. ANOVA analysis shows a significant difference in difficulty with expense between states (p-value < 0.05). In Figure 10A, it can be seen that people from the District of Columbia showed the lowest difficulty with paying expenses, supported by Tukey’s Multiple Component tests for the District of Columbia and most states (p-value < 0.05). This is also reflected in Figure 10B, which shows the District of Columbia in its own cluster. The state with the second lowest difficulty with expenses is Massachusetts, shown in Figure 10A, followed by Minnesota, Vermont, Washington, and Virginia, all of which are grouped in a similar cluster indicated in Figure 10B. Also, Figure 10A shows that Mississippi has the highest difficulty with expense, followed by Louisiana, West Virginia, Oklahoma, and Arkansas, which are all clustered in proximity, as shown in Figure 10B. Interestingly, these states are of weaker economies (lower GDP per capita). This may explain why people living in these states were more likely to struggle with expense difficulties during the COVID-19 pandemic. The five states with the highest levels of difficulty with expense mentioned tend to rank lower in GDP per capita, while the states with the five lowest levels of difficulty mentioned in addition to the District of Columbia tend to rank higher in GDP per capita, except for Vermont which falls midrange in GDP per capita.

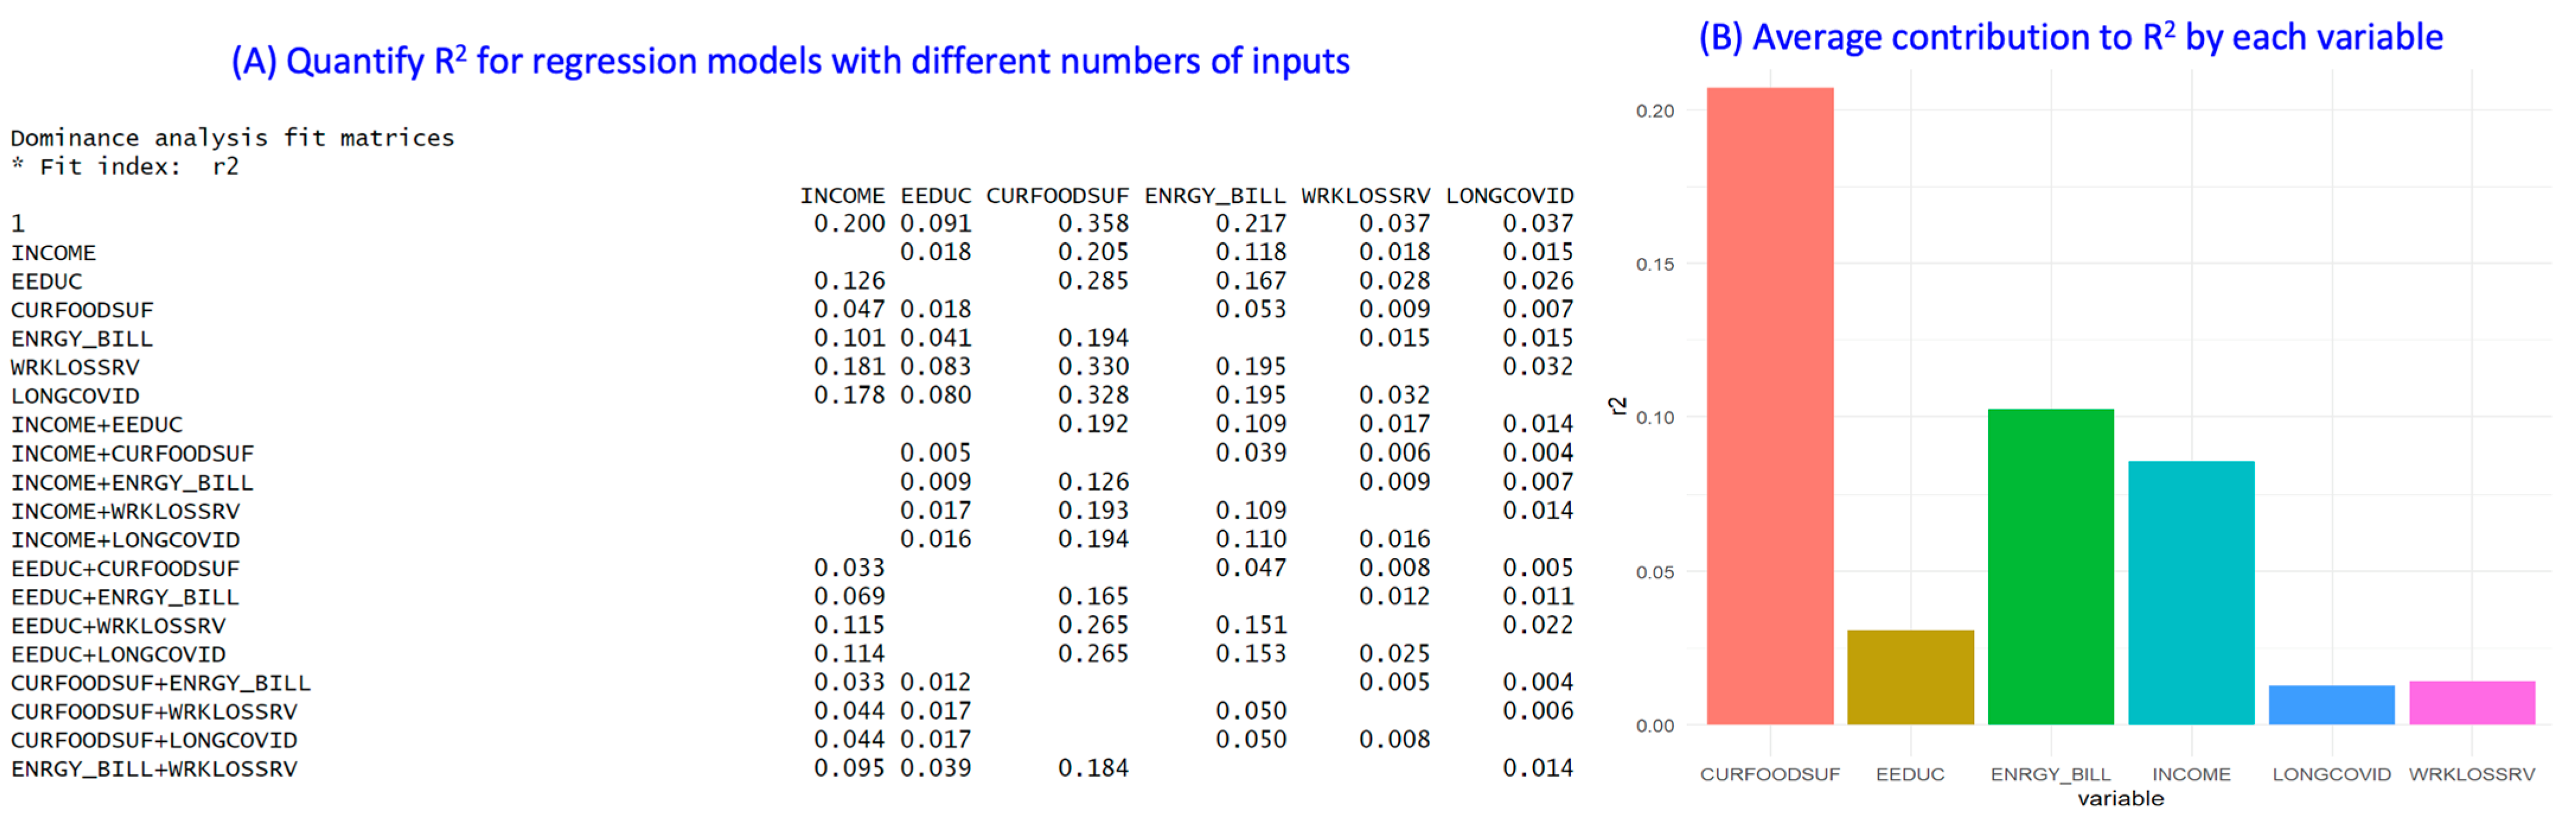
3.2. Investigation of Quantitative Factors Influencing People’s Opinions on Difficulty with the Expense

The difficulty with paying expenses was selected as the output for the dominance analysis, with other 12 ordinal variables as the inputs (i.e., potential factors influencing people’s opinions on difficulty with paying expenses). Figure 11A shows Household food sufficiency (for the last 7 days, represented by CURFOODSUF) as the most important factor influencing people’s difficulty with paying expenses. It is followed by difficulty in paying the full energy bill (represented by ENRGY_BILL), total household income (represented by INCOME), and educational attainment (represented by EEDUC). Food sufficiency is a primary concern when lacking the ability to pay. This may explain its central role in influencing people’s opinion on difficulty with expenses. Struggles with energy bill payments do not come as a surprise when looking at expense difficulties due to their contribution to household expenses. The total household income greatly determines the ability to pay for basic expenses, including food and energy bills. Educational attainment may influence people’s opportunities to find jobs with decent incomes.
Since neither Household food sufficiency nor difficulty paying the full energy bill are demographic and socioeconomic factors, each of them was set as the output for further dominance analysis (Figure 11B,C). It is interesting to see from Figure 11B,C that both total household income and educational attainment, which are the top three and top four factors for influencing people’s difficulty with paying expenses, were the top two factors influencing both people’s food sufficiency and people’s difficulty paying energy bills. With rising prices, people may struggle to pay for things that were once cheaper, and their stagnant wages cannot catch up with the things around them. Individuals will struggle with paying for groceries, causing them to have to find cheaper food options (i.e., food sufficiency). Depending on an individual’s education, their employment status and income level will differ. Persons with lower education may find their jobs more unstable and, therefore, receive lower income.

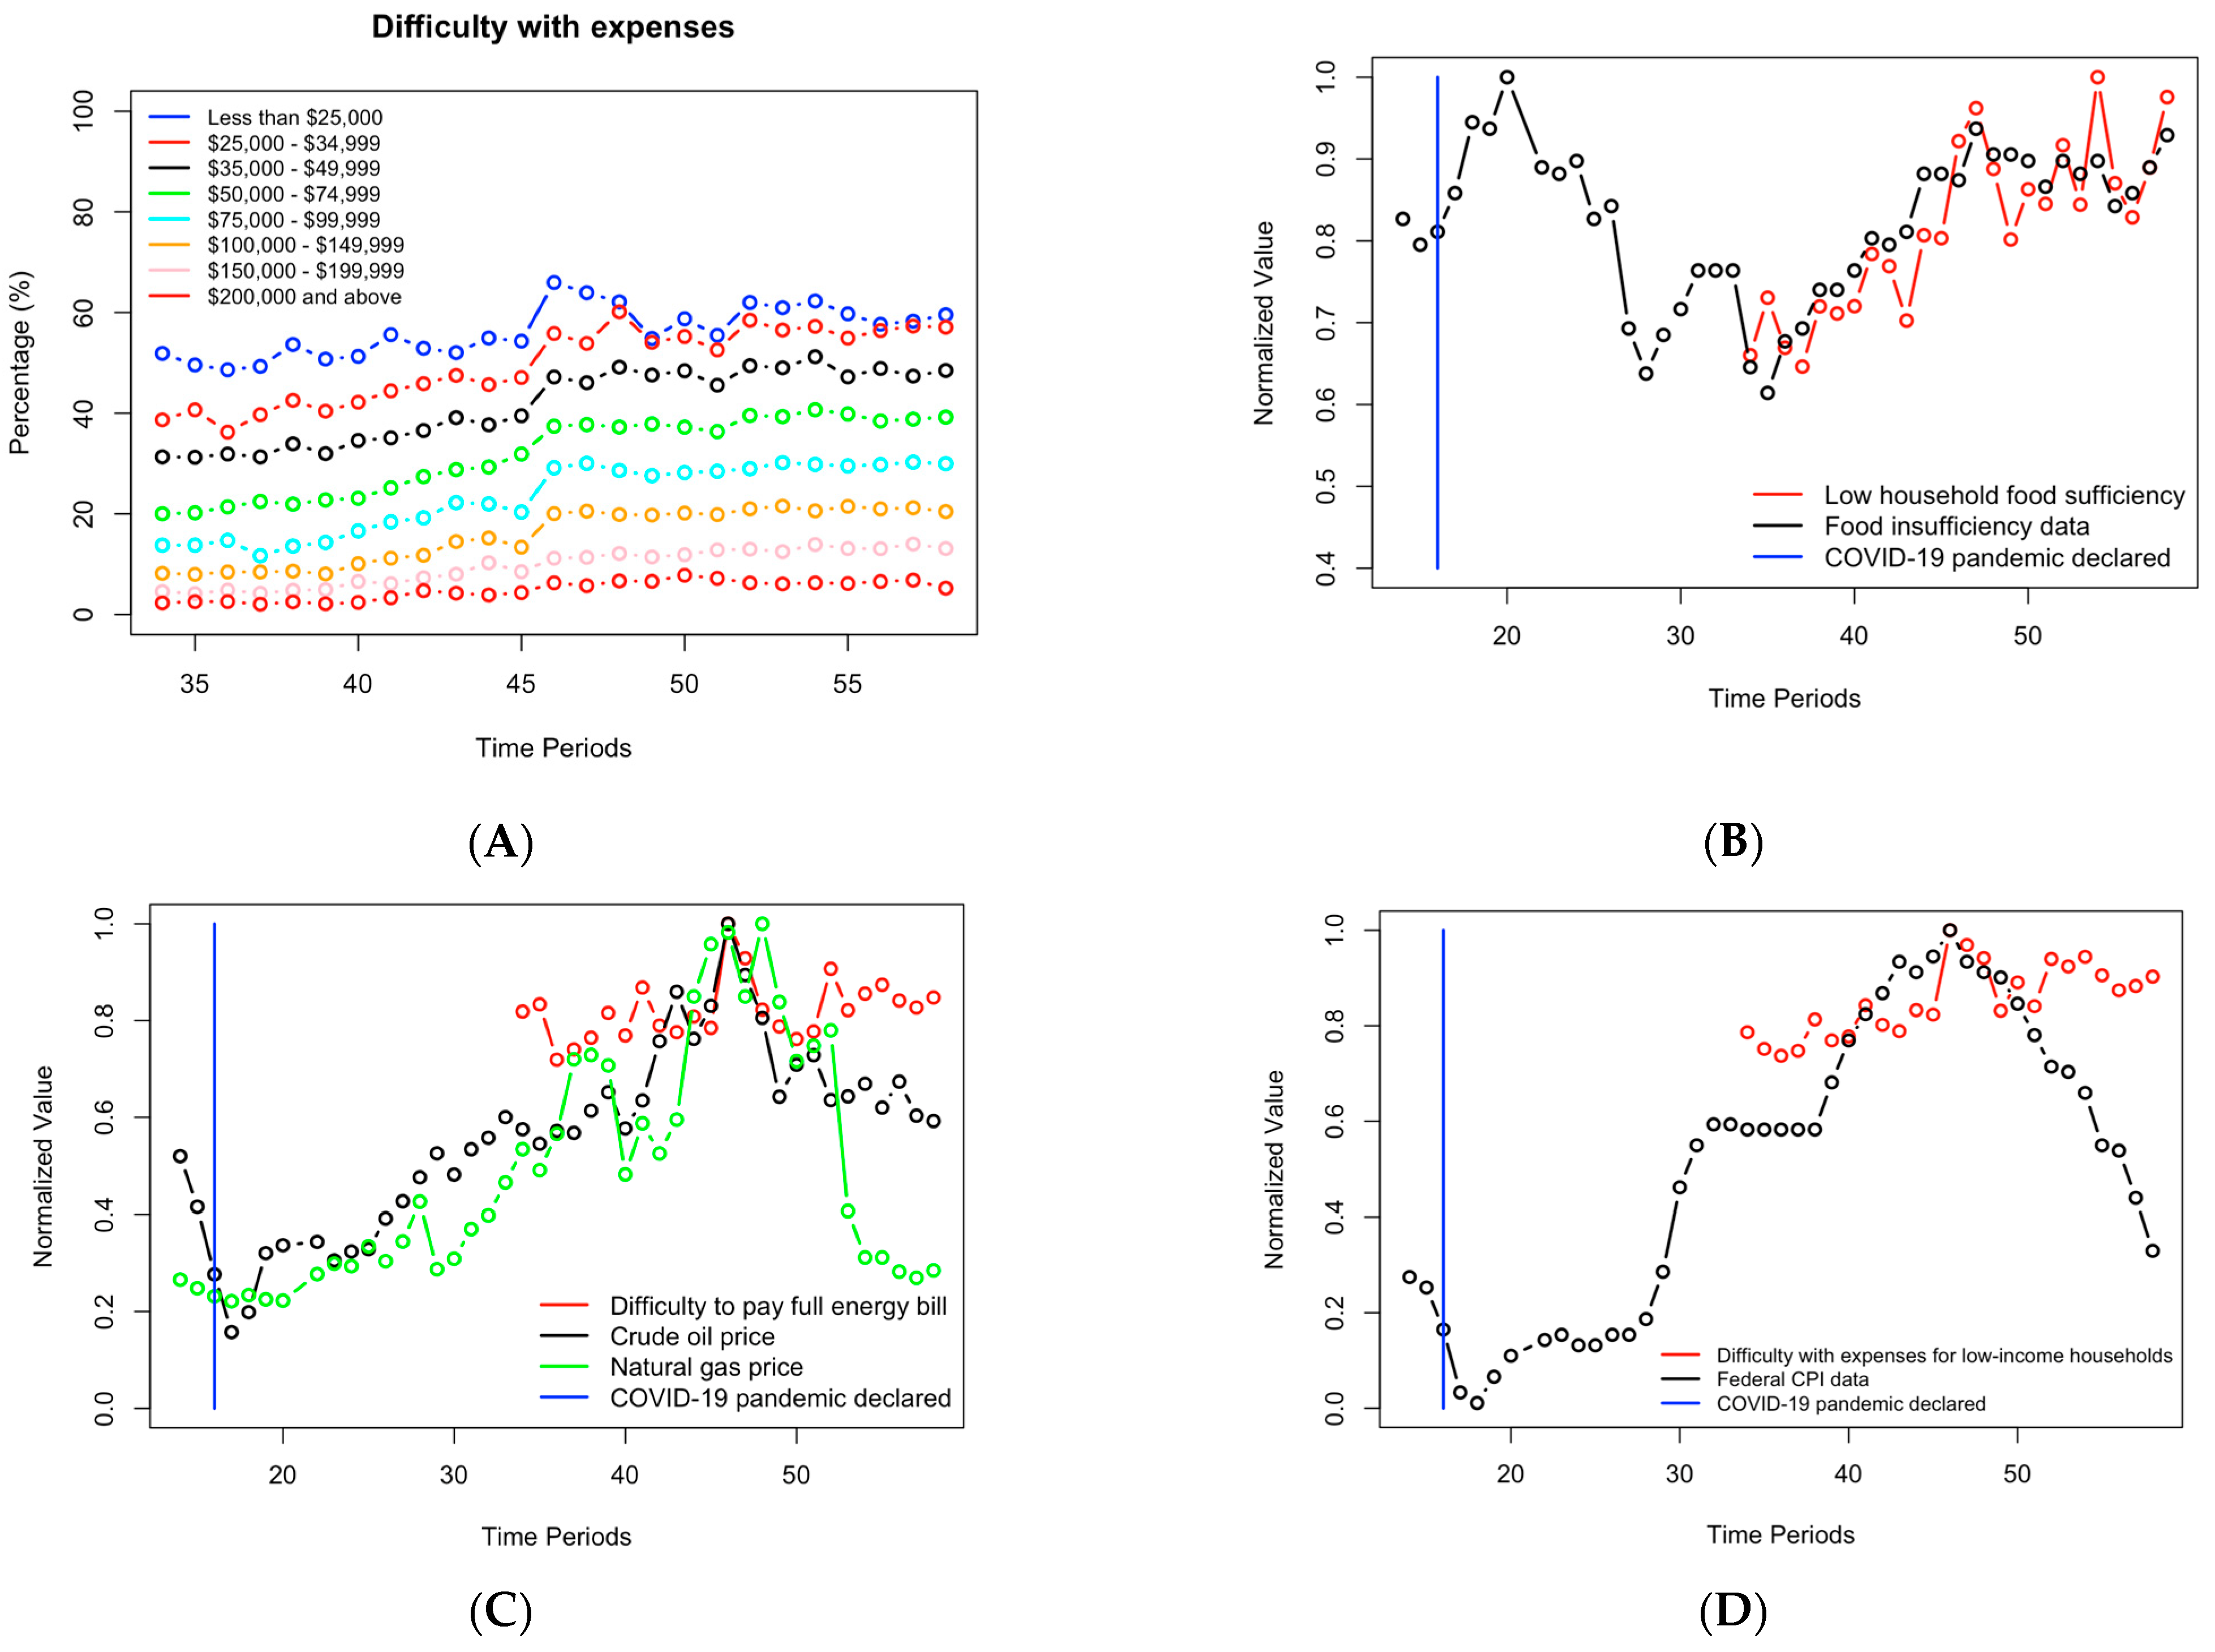
3.3. Comparison of People’s Opinions on Difficulty with Expense to Economic Data

The dominance analysis results indicate that household total income is the major factor that influences people’s opinions on household food sufficiency and difficulty in paying energy bills. The latter two are the most influential factors for people’s feeling of difficulty with paying expenses. When people struggle with food insufficiency, it often indicates financial strain. Higher oil and gas prices increase transportation and energy costs. The financial challenges faced by individuals in affording food, oil, and gas expenses often hinder their ability to meet other essential financial obligations. Therefore, it is necessary to carefully examine the opinions of different household-income groups on difficulty with paying expenses (as shown in Figure 12A). A clear inverse correlation between total household income and people’s difficulty with paying expenses (the average correlation value was −0.89 ± 0.02 over the 25 time periods) was observed. The group with a total household income below $25,000 showed the highest difficulty with paying expenses. Around 49% to 66% of people from this total household income group showed difficulty with paying expenses. The groups with a total household income below or equal to $35,000 contained more than 40% of their populations having difficulty with paying expenses when the COVID-19 pandemic was progressing.
One interesting question to answer is whether these economic data reflect people’s opinions on inflation or economic hardship. Since the lowest income group was identified from Figure 12A as the socioeconomic group mostly impacted by COVID-19, their opinions on difficulty with paying expenses were further compared with published historical economic data, especially food insufficiency data, oil and gas price data, and CPI inflation data. Since these data were presented in different units, they were normalized by their maximum values to a range below one before comparison. Data for difficulty with paying expenses was only available after 2 August 2021 (Period 34), while economic data were plotted since 10 January 2020 to cover the whole COVID-19 pandemic. Figure 12B indicates that people’s feelings about food insufficiency generally matched well with food insufficiency data after 2 August 2021 (Period 34). Both curves reached their maximum values at around the same time, i.e., 13 June 2022 (Period 46).
According to Figure 12C, it seems that after COVID-19 was declared official by the government, prices for both crude oil and natural gas started to accelerate. These prices reached their peak values at around the same time as people’s feeling of difficulty paying full energy bills. While the oil and natural gas prices went down after 13 June 2022, the percentage of low-income households with difficulty paying full energy bills went down slightly for four periods (i.e., four months) and then gradually increased and leveled off. Figure 12D shows that there was an initial drop in CPI after the official declaration of the COVID-19 pandemic, followed by periods of gradual and then sudden increases. Difficulty with expenses for the low-income group had a general upward trend over the course of the COVID-19 pandemic. Similar to Figure 12B,C, difficulty with paying expenses for the low-income group spiked at around the same time that CPI peaked. While difficulty with expenses for the low-income group continued to fluctuate around the same position with a slight upward trend, CPI showed a clear decrease. This suggests that CPI may not always accurately reflect consumer trends.

4. Discussion

4.1. Investigation of Disparities among Nominal Demographic and Socioeconomic Groups on Their Difficulty with Paying Expenses during the COVID-19 Pandemic

People’s opinions on difficulty with paying expenses were analyzed for each of the selected nominal demographic and socioeconomic factors, whose numerical values are not of ranking value (e.g., “1” standing for male and “2” representing female), through ANOVA and Tukey’s tests, to identify disparities among different groups. Among different racial backgrounds, the Black group experienced the highest difficulty, followed by mixed races, White individuals, and Asians. In terms of gender, transgender individuals faced the most difficulty, with the “other” gender category following closely, while males and females shared similarities. The analysis of sexual orientations revealed the “I don’t know” group faced the highest difficulty, emphasizing the vulnerability of individuals with uncertain orientations. Marital status showed a clear pattern, with separated individuals facing the most difficulty. Property status significantly influenced expense difficulty, with renters facing the highest challenges, which implied housing tenure’s financial impact. Employment sectors generally exhibited similar trends in expense difficulty, but family business workers experienced spikes during specific periods. Regarding location, the District of Columbia had the lowest difficulty, while Mississippi had the highest, with correlations to GDP per capita. This highlighted regional economic disparities during the COVID-19 pandemic. These findings underscore the multifaceted nature of expense difficulty. This study provided a systematic analysis of the complete dataset that covered the ending period of the COVID-19 pandemic. Some of the obtained results, such as the findings on the impact of sexual orientation, race, and marital status on people’s difficulty with paying expenses, confirmed those reported in existing studies that were focused on the early or middle stage of COVID-19 pandemic (e.g., for genders [27], for races [59], and marital status [60]). In addition to this, the findings in this study on the location and employment sector disparities provide potential directions for policy considerations prepared for future potential pandemics.

4.2. Identification of Important Ordinal Demographic and Socioeconomic Factors Influencing Expense Difficulty during the COVID-19 Pandemic

Different from nominal factors, ordinal variables represent categories with a specific order or ranking. Twelve ordinal variables were used as inputs in dominance analysis to identify the relative importance of these quantitative factors in influencing people’s perspectives on inflation. Compared with existing studies that were conducted during the COVID-19 pandemic, the quantitative analysis in this study was conducted on obtainable data for the entire pandemic period. Results indicated that food sufficiency and the ability to pay energy bills were the two most significant factors, followed by total household income and education levels, in determining people’s opinions on difficulty with expenses. These may be reflected by worries about upcoming payments in addition to increasing reports of food insecurities as the shutdown continued [8]. Further dominance analysis also indicated that education and income were the most influential factors for food sufficiency and difficulty in paying energy bills. The dominance analyses essentially highlight that low educational attainment and low income are the primary influences for difficulties with expenses in general and lack of food for households. This is consistent with how less educated individuals are among those more likely to be employed in the services sector, especially in the leisure and hospitality sector, which suffered disproportionately from higher rates of job loss due to the pandemic, as well as being more susceptible to wage pressures [32]. Those with low income and low education who already stood precariously on the edge only struggled further with paying off food and energy bills, worsened by the pandemic.

4.3. The Disparities between People’s Opinion on Economic Hardship and Economic Data

To understand the impact of economic factors on people’s perceptions, opinions on expense difficulty were compared with economic data for the first time in this study. Our analysis revealed a correlation between people’s feelings of food insufficiency and actual food insufficiency data. Similarly, oil and gas prices showed trends that aligned with people’s perceptions at the time of reaching the peak values (around 13 June 2022, in Period 46). A disparity was observed after that, as the prices of oil and gas seemed to decrease, but people’s difficulty in paying full energy bills did not decrease. The largest disparity was observed in people’s difficulty in paying expenses and CPI data. While both people’s difficulty with paying expenses and the CPI profile peaked at the same time, following the peak, CPI showed a clear decrease even though difficulty with expenses for the low-income group continued to fluctuate around the same position with a slight upward trend. This study thus provides the first evidence-based comparison between people’s challenges in paying expenses and CPI data. It suggests that CPI, a calculation of the average annual change in prices paid by urban consumers in the United States for a market basket of consumer goods and services, may not always accurately reflect consumer trends. The disparity might stem from the substitution bias, the introduction of new goods, and unmeasured quality changes. In particular, the relative increase in the “food and non-alcoholic beverages” category in comparison to other categories plays a major role in CPI underestimates for inflation compared with COVID-19 inflation estimates [61]. The correlation analysis also demonstrated that low-income households ($25,000–$34,999 or less) had the most difficulty with expenses. Immediately after the lockdowns from the pandemic, prices of food and energy accelerated. Even before the pandemic hit, high percentages of individuals were already struggling with food insecurities, housing precarity, and debts, leaving them even more vulnerable to the effects of COVID-19 [8]. It seems that there is still a high percentage of people struggling even when prices are lowered. This suggests the need for a nuanced understanding of economic indicators when assessing the financial well-being of different socioeconomic groups.

4.4. Practical Implications of the Findings

This study identifies significant disparities in inflation-related challenges among diverse demographic and socioeconomic groups. Vulnerable communities, such as Black individuals and transgender people, faced higher financial difficulties. Policymakers can utilize this information to formulate targeted support strategies to ensure that vulnerable groups receive adequate assistance. By understanding the specific challenges faced by different demographics, policymakers can design tailored financial support programs, such as subsidies, unemployment benefits, or targeted relief funds, to ensure that those most affected by inflation receive the necessary aid. The dominance analysis indicates that household food sufficiency and energy bill payment difficulties are influenced significantly by total household income and education attainment. Lower-income groups face heightened challenges. Policymakers can address this by implementing policies that focus on increasing access to education and job opportunities, as well as initiatives to enhance income stability. While CPI data provide a general overview of inflation, it may not always align perfectly with consumer experiences, as evidenced by the discrepancies noted during specific periods of this study. This underscores the importance of incorporating real-time consumer experiences into economic policymaking. Policymakers can achieve this by establishing mechanisms for continuous feedback from the public.

4.5. Limitation and Future Work

While there are quite a few variables or factors that may be related to inflation in the Household Pulse Survey, not all of them are included in this study. For example, data concerning price changes and the stress of price changes were not included, as data for these variables were not available until one year after data for difficulty with paying expenses (i.e., 14 September 2022, in Phase 3.6 versus 2 August 2021, in Phase 3.2). Data for difficulty with paying expenses were found to be correlated with data for the stress of price changes and concerns of price changes, with Pearson correlation coefficients of 0.63 and 0.50, respectively. Therefore, data for difficulty with paying expenses were selected as the major indicator of inflation. In addition, factors such as mental health, consumer behaviors, supplier delivery time, and foreign countries and policies may also affect people’s opinions on inflation. Since this study was mainly focused on the impact of nominal or ordinal demographic and socioeconomic factors on people’s opinions about inflation, these factors were not incorporated. It would be an interesting research topic for further investigation to integrate these factors and other factors from the Household Pulse Survey for their impact on people’s feelings about inflation due to the COVID-19 pandemic. As for the comparison between people’s feelings and economic data, this study was mainly focused on low-income people. This is because the total household income was identified as the major demographic and socioeconomic factor. It would be beneficial to analyze further the opinions on inflation of people associated with other demographic and socioeconomic factors in the future. CPI was chosen as the major inflation indicator in Figure 12D to compare people’s perceptions of inflation. Other economic indicators, such as unemployment rates, wage growth, or savings rates, can be further included in the comparison, as they may impact people’s opinions on inflation and economic hardship.

5. Conclusions

The COVID-19 pandemic has significantly impacted people’s lives. This study aims to investigate people’s perceptions of inflation and identify the major factors influencing people’s perceptions. This study, for the first time, compares people’s perceptions with economic data such as CPI. In particular, a comprehensive investigation was conducted on 574,265 samples from the Household Pulse Survey for people’s difficulty with paying expenses during the entire COVID-19 pandemic. ANOVA analysis and dominance analysis were implemented to investigate the disparities in expense difficulty among diverse demographic and socioeconomic groups. Notably, Black individuals faced the highest expense difficulty, followed by mixed-race respondents, White individuals, and Asians. Gender-wise, transgender individuals encountered the most challenges. Regarding sexual orientation, the “I don’t know” group reported the greatest difficulty, while straight and gay/lesbian groups had lower levels. Marital status significantly impacted expense difficulty, with separation leading to the most challenges. Property status highlighted renters’ struggles, while homeowners fared better. Employment sectors mostly exhibited similar trends, except for family business workers who experienced spikes. Geographical location influenced difficulty, with the District of Columbia showing the least and Mississippi the most challenge, reflecting GDP per capita disparities. As for dominance analysis, household income and education level emerged as pivotal factors. When examining the opinions of low-income groups, a clear inverse correlation between total household income and expense difficulty was evident. Correlations between people’s feelings of food insufficiency and actual data were found, but disparities emerged as oil and gas prices decreased while the difficulty in paying full energy bills did not. The most significant disparity was observed in people’s difficulty with expenses compared with CPI data. This may imply that CPI may not always accurately reflect consumer trends. Low-income households were particularly vulnerable, with many experiencing difficulties even when prices started to decrease. These findings can be further analyzed by policymakers, economists, and social scientists to understand economic trends and design policies that address the challenges faced by individuals during periods of inflation during the pandemic. This study was limited to 22 inflation-relevant variables from the Household Pulse Survey. A more comprehensive understanding of inflation perceptions could be achieved by including additional variables and factors such as mental health, consumer behaviors, and foreign countries and policies. This study sheds light on the complex relationship between socioeconomic factors, public perceptions, and economic data during the COVID-19 pandemic.

Author Contributions

Conceptualization, Z.H.; methodology, C.Z., J.T., E.J., W.C., A.G. and Z.H.; formal analysis, C.Z., J.T., E.J., W.C., A.G. and Z.H.; data curation, Z.H.; writing—C.Z., J.T., E.J., W.C. and A.G.; writing—review and editing, Z.H. All authors have read and agreed to the published version of the manuscript.

Funding

This research received no external funding.

Data Availability Statement

All the data sets were extracted from the Household Pulse Survey database (https://www.census.gov/programs-surveys/household-pulse-survey/data.html) (accessed on 1 June 2023). The datasets extracted in this study can be provided upon request from readers.

Conflicts of Interest

The authors declare no conflict of interest.

References

  1. Wahdat, A.Z. Economic Impact Payments and Household Food Insufficiency during COVID-19: The Case of Late Recipients. Econ. Disasters Clim. Chang. 2022, 6, 451–469. [Google Scholar] [CrossRef]
  2. Rokhsari, A.; Doodman, N.; Tanha, H. Effects of Coronavirus Pandemic on U.S Economy: D-Vine Regression Copula Approach. Sci. Iran. 2022. [Google Scholar] [CrossRef]
  3. Garner, T.; Safir, A.; Schild, J. Changes in consumer behaviors and financial well-being during the coronavirus pandemic: Results from the U.S. Household Pulse Survey. Mon. Lab. Rev. 2020, 143, 1. [Google Scholar] [CrossRef]
  4. Armantier, O.; Koşar, G.; Pomerantz, R.; Skandalis, D.; Smith, K.; Topa, G.; van der Klaauw, W. How economic crises affect inflation beliefs: Evidence from the COVID-19 pandemic. J. Econ. Behav. Organ. 2021, 189, 443–469. [Google Scholar] [CrossRef]
  5. Banerjee, R.N.; Mehrotra, A.; Zampolli, F. Inflation at risk from COVID-19; Bank for International Settlements: Basel, Switzerland, 2020. [Google Scholar]
  6. Santacreu, A.M.; LaBelle, J. Global Supply Chain Disruptions and Inflation during the COVID-19 Pandemic. Fed. Reserve Bank St. Louis Rev. 2022, 104, 78–91. [Google Scholar] [CrossRef]
  7. Li, C. Inflation in the US during COVID-19 Crisis: Cause, Current Status, and Moving Forward. In Proceedings of the 2021 3rd International Conference on Economic Management and Cultural Industry (ICEMCI 2021), Guangzhou, China, 22–24 October 2021; pp. 2346–2354. [Google Scholar]
  8. Enriquez, D.; Goldstein, A. COVID-19′s Socioeconomic Impact on Low-Income Benefit Recipients: Early Evidence from Tracking Surveys. Socius Sociol. Res. Dyn. World 2020, 6, 2378023120970794. [Google Scholar] [CrossRef]
  9. Park, J.; Kim, S. Child Tax Credit, Spending Patterns, and Mental Health: Mediation Analyses of Data from the U.S. Census Bureau’s Household Pulse Survey during COVID-19. Int. J. Environ. Res. Public Health 2023, 20, 4425. [Google Scholar] [CrossRef]
  10. Louie, P.; Wu, C.; Shahidi, F.V.; Siddiqi, A. Inflation hardship, gender, and mental health. SSM Popul. Health 2023, 23, 101452. [Google Scholar] [CrossRef]
  11. Donnelly, R.; Farina, M.P. How do state policies shape experiences of household income shocks and mental health during the COVID-19 pandemic? Soc. Sci. Med. 2021, 269, 113557. [Google Scholar] [CrossRef]
  12. Cleaveland, C.L.; Frankenfeld, C.L. Household Financial Hardship Factors Are Strongly Associated with Poorer Latino Mental Health During COVID-19. J. Racial Ethn. Health Disparities 2022, 10, 1823–1836. [Google Scholar] [CrossRef]
  13. Wu, M.; Yu, E.; Kodali, A.; Wang, K.; Chen, R.; Song, K.; Wang, V.; Li, S.; Zhong, A.; Liu, D.; et al. Investigating the Economic Impacts of COVID-19 on the Mental Health of Different Demographics. J. Stud. Res. 2021, 10. [Google Scholar] [CrossRef]
  14. Chen, J.; Chen, A.; Shi, Y.; Chen, K.; Zhao, K.H.; Xu, M.; He, R.; Huang, Z. A Systematic Investigation of American Vaccination Preference via Historical Data. Processes 2022, 10, 1665. [Google Scholar] [CrossRef]
  15. Abu Farha, R.K.; Alzoubi, K.H.; Khabour, O.F.; Alfaqih, M.A. Exploring perception and hesitancy toward COVID-19 vaccine: A study from Jordan. Hum. Vaccines Immunother. 2021, 17, 2415–2420. [Google Scholar] [CrossRef]
  16. Kreps, S.; Dasgupta, N.; Brownstein, J.S.; Hswen, Y.; Kriner, D.L. Public attitudes toward COVID-19 vaccination: The role of vaccine attributes, incentives, and misinformation. NPJ Vaccines 2021, 6, 73. [Google Scholar] [CrossRef]
  17. Determann, D.; Korfage, I.J.; Lambooij, M.S.; Bliemer, M.; Richardus, J.H.; Steyerberg, E.W.; de Bekker-Grob, E.W. Acceptance of vaccinations in pandemic outbreaks: A discrete choice experiment. PLoS ONE 2014, 9, e102505. [Google Scholar] [CrossRef]
  18. Kreps, S.E.; Goldfarb, J.L.; Brownstein, J.S.; Kriner, D.L. The relationship between US adults’ misconceptions about COVID-19 vaccines and vaccination preferences. Vaccines 2021, 9, 901. [Google Scholar] [CrossRef]
  19. Alderman, H.; Gilligan, D.O.; Hidrobo, M.; Leight, J.; Ramani, G.V.; Taffesse, A.S.; Tambet, H. Impact Evaluation of the Strengthen PSNP4 Institutions and Resilience (SPIR) Development Food Security Activity (DFSA): Endline Report; International Food Policy Research Institute: Washington, DC, USA, 2021. [Google Scholar]
  20. Porter, C.; Hittmeyer, A.; Favara, M.; Scott, D.; Sánchez, A. The evolution of young people’s mental health during COVID-19 and the role of food insecurity: Evidence from a four low-and-middle-income-country cohort study. Public Health Pract. 2022, 3, 100232. [Google Scholar] [CrossRef]
  21. Huato, J.; Chavez, A. Household Income, Pandemic-Related Income Loss, and the Probability of Anxiety and Depression. East. Econ. J. 2021, 47, 546–570. [Google Scholar] [CrossRef] [PubMed]
  22. Keke, Y.; Dida, S.; Sugiyana, D.; Suryana, A. Determining the influence of Consumer Behaviour in using Co-Branded Card during Pandemic-COVID19. Rev. Int. Geogr. Educ. Online 2021, 11. [Google Scholar] [CrossRef]
  23. Braholli, A. An Investigation of Consumer Behavior in Online Trade during the COVID-19 Pandemic: A Case Study. Qual. Access Success 2022, 23, 45–58. [Google Scholar] [CrossRef]
  24. Wu, C.; Louie, P.; Bierman, A.; Schieman, S. Assessment of Sociodemographics and Inflation-Related Stress in the US. JAMA Netw. Open 2023, 6, e2313431. [Google Scholar] [CrossRef] [PubMed]
  25. Morales, D.X.; Morales, S.A.; Beltran, T.F. Racial/Ethnic Disparities in Household Food Insecurity during the COVID-19 Pandemic: A Nationally Representative Study. J. Racial Ethn. Health Disparities 2021, 8, 1300–1314. [Google Scholar] [CrossRef] [PubMed]
  26. Neymotin, F.; Forgey, F. Government Stimulus and Mortgage Payments during COVID-19: Evidence from the US Census Household Pulse Survey. J. Hous. Res. 2023, 32, 66–80. [Google Scholar] [CrossRef]
  27. Madgavkar, A.; White, O.; Krishnan, M.; Mahajan, D.; Azcue, X. COVID-19 and Gender Equality: Countering the Regressive Effects; McKinsey Global Institute: Washington, DC, USA, 2020. [Google Scholar]
  28. Fox, J.; Bartholomae, S. Household finances, financial planning, and COVID-19. Financ. Plan. Rev. 2020, 3, e1103. [Google Scholar] [CrossRef]
  29. Higgins, M. Investors Can Temper Their Inflation Fears: Post-COVID Inflation is Unlikely to Resemble the Great Inflation of 1968 to 1982. SSRN Electron. J. 2021. [Google Scholar] [CrossRef]
  30. Klesta, M. Inflation Adds Burden to Households Already Struggling to Cope with Lingering Effects of the Pandemic, and the Tight Job Market Challenges Hiring and Retention in Some Sectors: Findings From the Community Issues Survey 2022. 2022. Available online: https://www.clevelandfed.org/publications/community-issues-and-insights/ii-20220519-community-issues-and-insights-survey-results (accessed on 1 June 2023).
  31. Carpenter, C.S.; Lee, M.J.; Nettuno, L. Economic outcomes for transgender people and other gender minorities in the United States: First estimates from a nationally representative sample. South. Econ. J. 2022, 89, 280–304. [Google Scholar] [CrossRef]
  32. Barnes, M.; Bauer, L.; Edelberg, W. 11 Facts on the Economic Recovery from the COVID-19 Pandemic; Hamilton Project Economic; Brookings: Washington, DC, USA, 2021. [Google Scholar]
  33. CBPP. Robust COVID Relief Achieved Historic Gains against Poverty and Hardship, Bolstered Economy. 2022. Available online: www.cbpp.org (accessed on 1 June 2023).
  34. Reinsdorf, M. COVID-19 and the CPI: Is Inflation Underestimated? SSRN Electron. J. 2021. [Google Scholar] [CrossRef]
  35. Gelman, A. Analysis of variance—Why it is more important than ever. Ann. Statist. 2005, 33, 1–53. [Google Scholar] [CrossRef]
  36. McHugh, M.L. Multiple comparison analysis testing in ANOVA. Biochem. Med. 2011, 21, 203–209. [Google Scholar] [CrossRef]
  37. Simkus, J. ANOVA (Analysis Of Variance): Definition, Types, and Examples; Simply Scholar Ltd.: London, UK, 2022. [Google Scholar]
  38. Zwanenburg, G.; Hoefsloot, H.C.; Westerhuis, J.A.; Jansen, J.J.; Smilde, A.K. ANOVA-principal component analysis and ANOVA-simultaneous component analysis: A comparison. J. Chemom. 2011, 25, 561–567. [Google Scholar] [CrossRef]
  39. Minitab. What Is Tukey’s Method for Multiple Comparisons? Minitab LLC: State College, PA, USA, 2022. [Google Scholar]
  40. Hsu, J.C.; Peruggia, M. Graphical Representations of Tukey’s Multiple Comparison Method. J. Comput. Graph. Stat. 1994, 3, 143–161. [Google Scholar] [CrossRef]
  41. Azen, R.; Budescu, D.V. The dominance analysis approach for comparing predictors in multiple regression. Psychol. Methods 2003, 8, 129–148. [Google Scholar] [CrossRef] [PubMed]
  42. Budescu, D.V. Dominance analysis: A new approach to the problem of relative importance of predictors in multiple regression. Psychol. Bull. 1993, 114, 542–551. [Google Scholar] [CrossRef]
  43. Friedman, C. Financial hardship experienced by people with disabilities during the COVID-19 pandemic. Disabil. Health J. 2022, 15, 101359. [Google Scholar] [CrossRef] [PubMed]
  44. Kim, Y.; Murphy, J. Mental Health, Food Insecurity, and Economic Hardship among College Students during the COVID-19 Pandemic. Health Soc. Work. 2023, 48, 124–132. [Google Scholar] [CrossRef]
  45. Sultana, M.S.; Khan, A.H.; Hossain, S.; Islam, T.; Hasan, M.T.; Ahmed, H.U.; Li, Z.; Khan, J.A.M. The Association between Financial Hardship and Mental Health Difficulties among Adult Wage Earners during the COVID-19 Pandemic in Bangladesh: Findings from a Cross-Sectional Analysis. Front. Psychiatry 2021, 12, 635884. [Google Scholar] [CrossRef]
  46. Gonzalez, M.R.; Brown, S.A.; Pelham, W.E.; Bodison, S.C.; McCabe, C.; Baker, F.C.; Baskin-Sommers, A.; Dick, A.S.; Dowling, G.J.; Gebreselassie, S.; et al. Family Well-Being during the COVID-19 Pandemic: The Risks of Financial Insecurity and Coping. J. Res. Adolesc. 2023, 33, 43–58. [Google Scholar] [CrossRef]
  47. Kim, B.; Kim, D.H.; Jang, S.-Y.; Shin, J.; Lee, S.G.; Kim, T.H. Family economic hardship and adolescent mental health during the COVID-19 pandemic. Front. Public Health 2022, 10, 904985. [Google Scholar] [CrossRef]
  48. Sujan, M.H.; Tasnim, R.; Islam, S.; Ferdous, M.; Haghighathoseini, A.; Koly, K.N.; Pardhan, S. Financial hardship and mental health conditions in people with underlying health conditions during the COVID-19 pandemic in Bangladesh. Heliyon 2022, 8, e10499. [Google Scholar] [CrossRef]
  49. Trógolo, M.A.; Moretti, L.S.; Medrano, L.A. A nationwide cross-sectional study of workers’ mental health during the COVID-19 pandemic: Impact of changes in working conditions, financial hardships, psychological detachment from work and work-family interface. BMC Psychol. 2022, 10, 73. [Google Scholar] [CrossRef]
  50. Kim, C.E.; Kim, H.H.-S. Economic precarity and mental health during the COVID-19 pandemic: Findings from the census household pulse survey (2020–2021). Sociol. Spectr. 2022, 42, 195–216. [Google Scholar] [CrossRef]
  51. Kim, D. Financial hardship and social assistance as determinants of mental health and food and housing insecurity during the COVID-19 pandemic in the United States. SSM Popul. Health 2021, 16, 100862. [Google Scholar] [CrossRef] [PubMed]
  52. Yao, H.; Wang, J.; Liu, W. Lockdown Policies, Economic Support, and Mental Health: Evidence From the COVID-19 Pandemic in United States. Front. Public Health 2022, 10, 857444. [Google Scholar] [CrossRef] [PubMed]
  53. Newswire, P.R. The Pandemics within the Pandemic; Parker-University: Dallas, TX, USA, 2020. [Google Scholar]
  54. United States Census Bureau. Household Pulse Survey: Measuring Social and Economic Impacts during the Coronavirus Pandemic; United States Census Bureau: Suitland, MD, USA, 2021. Available online: https://www.census.gov/programs-surveys/household-pulse-survey.html (accessed on 1 June 2023).
  55. Crude Oil Brent US Dollars per Barrel. Available online: https://countryeconomy.com/ (accessed on 1 June 2023).
  56. US Natural Gas Residential Price. Available online: https://ycharts.com/ (accessed on 1 June 2023).
  57. United States Census Bureau. Food Scarcity Percentage of Adults in Households Where There Was Either Sometimes or Often Not Enough to Eat in the Last 7 Days; United States Census Bureau: Suitland, MD, USA, 2021. Available online: https://www.census.gov/data-tools/demo/hhp/#/?periodSelector=14 (accessed on 1 June 2023).
  58. Ran, X.; Xi, Y.; Lu, Y.; Wang, X.; Lu, Z. Comprehensive survey on hierarchical clustering algorithms and the recent developments. Artif. Intell. Rev. 2022, 56, 8219–8264. [Google Scholar] [CrossRef]
  59. Heslin, K.C.; Hall, J.E. Sexual Orientation Disparities in Risk Factors for Adverse COVID-19–Related Outcomes, by Race/Ethnicity—Behavioral Risk Factor Surveillance System, United States, 2017–2019. MMWR. Morb. Mortal. Wkly. Rep. 2021, 70, 149–154. [Google Scholar] [CrossRef]
  60. Kudoh, R.; Komiya, K.; Shinohara, A.; Kageyama, T.; Hiramatsu, K.; Kadota, J.-I. Marital status and post-COVID-19 conditions. Respir. Investig. 2023, 61, 181–185. [Google Scholar] [CrossRef]
  61. Seiler, P. Weighting bias and inflation in the time of COVID-19: Evidence from Swiss transaction data. Swiss J. Econ. Stat. 2020, 156, 13. [Google Scholar] [CrossRef]
Figure 1. Overview of research approaches. The circles in (B) represent the percentages of different gender groups with difficulty to pay the expenses, while the circles in (D) show the normalized values of difficulty with expenses for low-income households and Federal CPI data.
Processes 11 03217 g001
Figure 2. An example for ANOVA analysis and Tukey’s Multiple Comparison test for data for difficulty with paying expenses from different race groups.
Processes 11 03217 g002
Figure 3. An illustrative example of dominance analysis in which difficulty with paying expenses as the output and household food sufficiency (CURFOODSUF), educational attainment (EEDUC), difficulty paying full energy bill (ENRGY_BILL), total household income (INCOME), long-term coronavirus symptom (LONGCOVID), recent household job loss as the inputs (WRKLOSSRV).
Processes 11 03217 g003
Figure 4. (A) the percentage of survey participants from different race groups expressing difficulty with paying expenses; (B) the result of hierarchical clustering of different race groups based on the percentage profiles shown in (A).
Processes 11 03217 g004
Figure 5. (A) the percentage of survey participants from different gender groups expressing difficulty with paying expenses; (B) the result of hierarchical clustering of different gender groups based on the percentage profiles shown in (A).
Processes 11 03217 g005
Figure 6. (A) the percentage of survey participants from different sexual orientations expressing difficulty with paying expenses; (B) the result of hierarchical clustering of different sexual orientations based on the percentage profiles shown in (A).
Processes 11 03217 g006
Figure 7. (A) the percentage of survey participants with different marital statuses expressing difficulty with paying expenses; (B) the result of hierarchical clustering of different marital statuses based on the percentage profiles shown in (A).
Processes 11 03217 g007
Figure 8. (A) the percentage of survey participants with different property statuses expressing difficulty with paying expenses; (B) the result of hierarchical clustering of different property statuses based on the percentage profiles shown in (A).
Processes 11 03217 g008
Figure 9. (A) the percentage of survey participants from different sectors of employment clusters expressing difficulty with paying expenses; (B) the result of hierarchical clustering from different sectors of employment clusters based on the percentage profiles shown in (A).
Processes 11 03217 g009
Figure 10. (A) the percentage of survey participants from different states expressing difficulty with paying expenses; Figure (B), the result of hierarchical clustering of different states.
Processes 11 03217 g010
Figure 11. Dominance analysis to identify key factors: (A) influencing people’s opinions for difficulty with paying expenses; (B) influencing people’s feelings for household food sufficiency; and (C) influencing people’s perceptions of difficulty paying energy bills.
Processes 11 03217 g011aProcesses 11 03217 g011b
Figure 12. (A) difficulty with paying expenses for people from different total household income groups; (B) comparison of the opinions regarding food sufficiency from low-income households to food sufficient data; (C) comparison of the opinions regarding difficulty in paying full energy bills from low-income households to the oil and gas prices; (D) comparison of the opinions regarding difficulty with paying expenses to CPI data.
Processes 11 03217 g012
Table 1. The variables and their abbreviations extracted from the Pulse Survey Database to investigate the opinions of survey participants on the impact of the COVID-19 pandemic on inflation [54].
AbbreviationMeanings of Abbreviations
CURFOODSUFFood sufficiency in the household over the past week: (1) Sufficient supply of desired food types, (2) Adequate supply, though not always preferred food types, (3) Occasional insufficient food, (4) Frequent food shortages
EEDUCLevel of education achieved: (1) Below high school, (2) Partial high school, (3) High school diploma, (4) Some college (without degree or ongoing), (5) Associate’s degree (e.g., AA, AS), (6) Bachelor’s degree, (7) Advanced degree
ENRGY_BILLChallenges in paying the entire energy bill: (1) Almost every month; (2) Some months; (3) 1 or 2 months; (4) Never.
TBIRTH_YEARBirth year: Individuals born prior to 2005.
EXPNS_DIFDifficulty with paying expenses: (1) Not challenging, (2) Slightly challenging, (3) Moderately challenging, (4) Highly challenging.
SYMPTOMSSeverity of COVID-19 symptoms at their worst: (1) No symptoms, (2) Mild symptoms, (3) Moderate symptoms, (4) Severe symptoms.
INCOMEHousehold income (pre-tax): (1) Less than $25,000; (2) $25,000–$34,999; (3) $35,000–$49,999; (4) $50,000–$74,999; (5) $75,000–$99,999; (6) $100,000–$149,999; (7) $150,000–$199,999; (8) $200,000 or more.
LONGCOVIDProlonged COVID-19 or coronavirus symptoms (lasting 3 months or more): (1) Yes, (2) No
THHLD_NUMKIDTotal count of individuals under the age of 18 in the household: (0–40) number of individuals under 18 (whole number)
TSPN FOODAmount spent on food and groceries by the household: $0-$900
TSPN PRPDExpenditure on ready-made meals by the household: $0-$500
THHLD_NUMPERTotal count of individuals in the household: (1–40) number of individuals (whole number)
WRKLOSSRV“Recent job loss in the household: (1) Yes, (2) No
PERIODThe survey’s time period index
MSCurrent marital status: (1) Married; (2) Widowed; (3) Divorced; (4) Separated; (5) Single (Never married)
GENID_DESCRIBEPresent gender identity: (1) Male, (2) Female, (3) Transgender, (4) Other
RRACERace: (1) White, (2) Black, (3) Asian, (4) Other races
SEXUAL_ORIENTATIONSexual orientation: (1) Gay or lesbian, (2) Straight, (3) Bisexual, (4)Other, (5) I don’t know
KINDWORKEmployment sector: (1) Government, (2) Private company, (3) Non-profit organization (including tax-exempt and charitable organizations), (4) Self-employed, (5) Family business
TENUREHousing status: (1) Owned outright by you or a household member? (2) Owned with a mortgage or loan (including home equity loans) by you or a household member? (3) Rented? (4) Occupied without rent payment?
EST_STSurvey participants’ state of residence
Note: Nominal variables that represent categories with no inherent order or ranking are marked in RED.
Disclaimer/Publisher’s Note: The statements, opinions and data contained in all publications are solely those of the individual author(s) and contributor(s) and not of MDPI and/or the editor(s). MDPI and/or the editor(s) disclaim responsibility for any injury to people or property resulting from any ideas, methods, instructions or products referred to in the content.

