


A City Logistics Distribution Model: A Physical Internet Approach


Abstract
:1. Introduction
2. Literature Review
3. Methodology
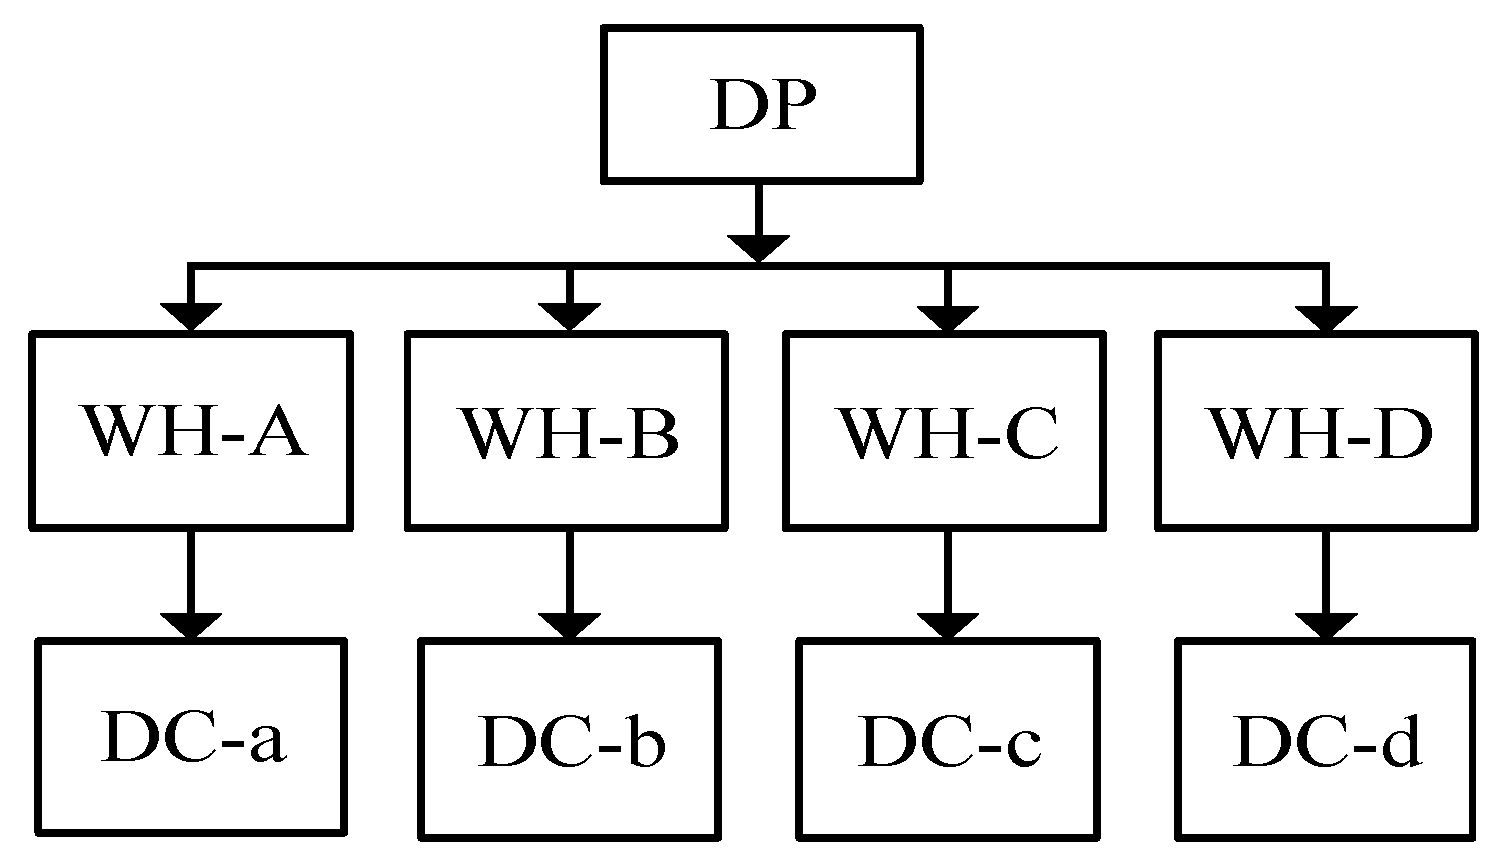
3.1. PI Based Urban Logistical Distribution Model
3.2. Main Factors (PI Distribution)
- (1)
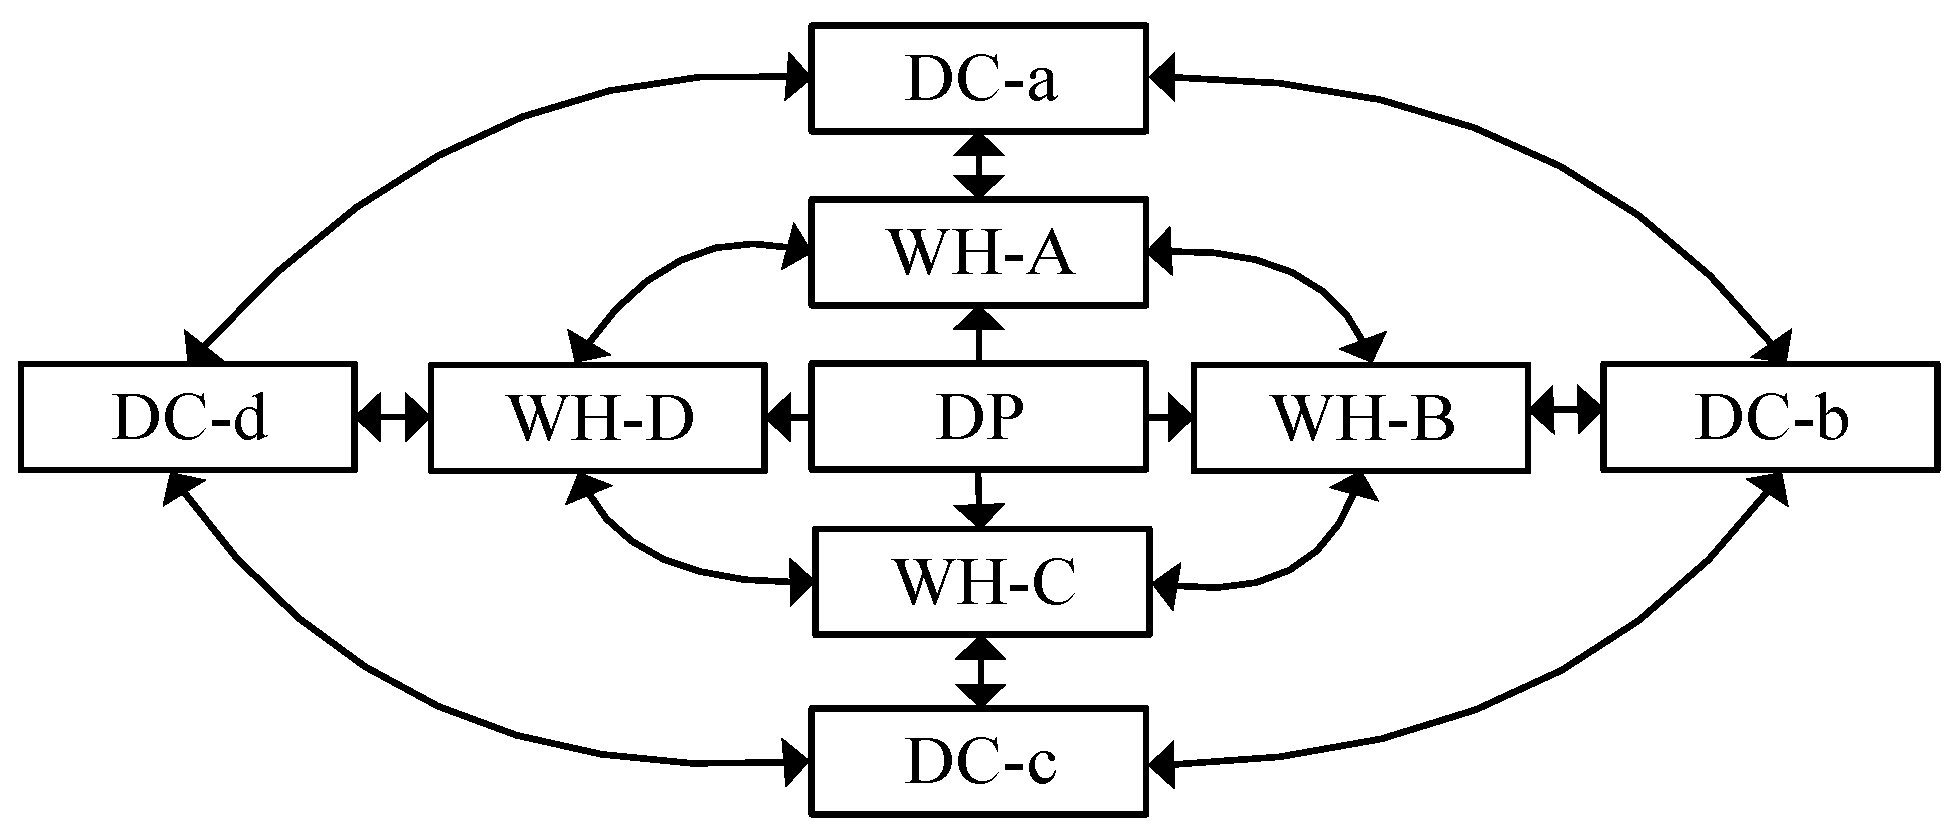
- Infrastructure: The classical logistical network layout gives rise to the layout mode known as the PI infrastructure layout. The introduction of PI does not change the geographical location of the original node facilities. The PI is a revolutionary logistical system that seeks to level the playing field for the logistical network’s traditional centralized hierarchical structure through hierarchy-based development. The biggest differences in PI with a traditional layout are that all nodes are in the network facilities, transportation facilities, and service personnel. The global infrastructure of PI is based on the principles of maximum efficiency within reasonable use. To overcome the initial industrial hurdles, increase distribution efficiency, and reduce distribution costs, PI is incorporated into city logistics.
- (2)
- Distribution route: When Montreuil [29] initially proposed the concept of PI, it was obvious that the complete path in the PI network could be transformed from private network to open network. Due to delivery lead times and transportation cost restrictions, the shortest route is typically considered to be the best distribution route in a traditional logistical network of distribution. However, if distance is the only criterion used to choose the order of goods in the logistical network, which is predetermined at the starting location, then there is a significant loss of flexibility in the logistical system. However, transportation and distribution in the PI environment are more dynamic, and the flexible communication between warehouses and distribution centers at all levels gives a higher degree of freedom in route selection. PI considers the distribution distance and the use of network facilities with equal weightage, which helps to realize the uniform distribution of network traffic and improves the general satisfaction of customers.
- (3)
- Transshipment standard: All goods in the PI network are uniformly packaged in standard intelligent green modular containers. Considering the negative impact of long-distance transportation on society and the environment, the ordered goods often need to go through multi-stage combined transportation in PI. In the process of transit at each transport node for the comparative test and research results of Pan et al. [28] and Yang [19] et al., it can be seen that the best effect is achieved by direct transfer with the source substitution method, which is based on an intuitive and simple standard. Instead of dividing delivery orders or recombining existing containers, PI selects vehicles that meet the transport capacity and are close enough to the transfer node for transferring the goods.
3.3. Symbol Definition (PI Distribution)
3.4. Model Construction (PI Distribution)
4. Simulation and Result Analysis
Discussion of Results
- (1)
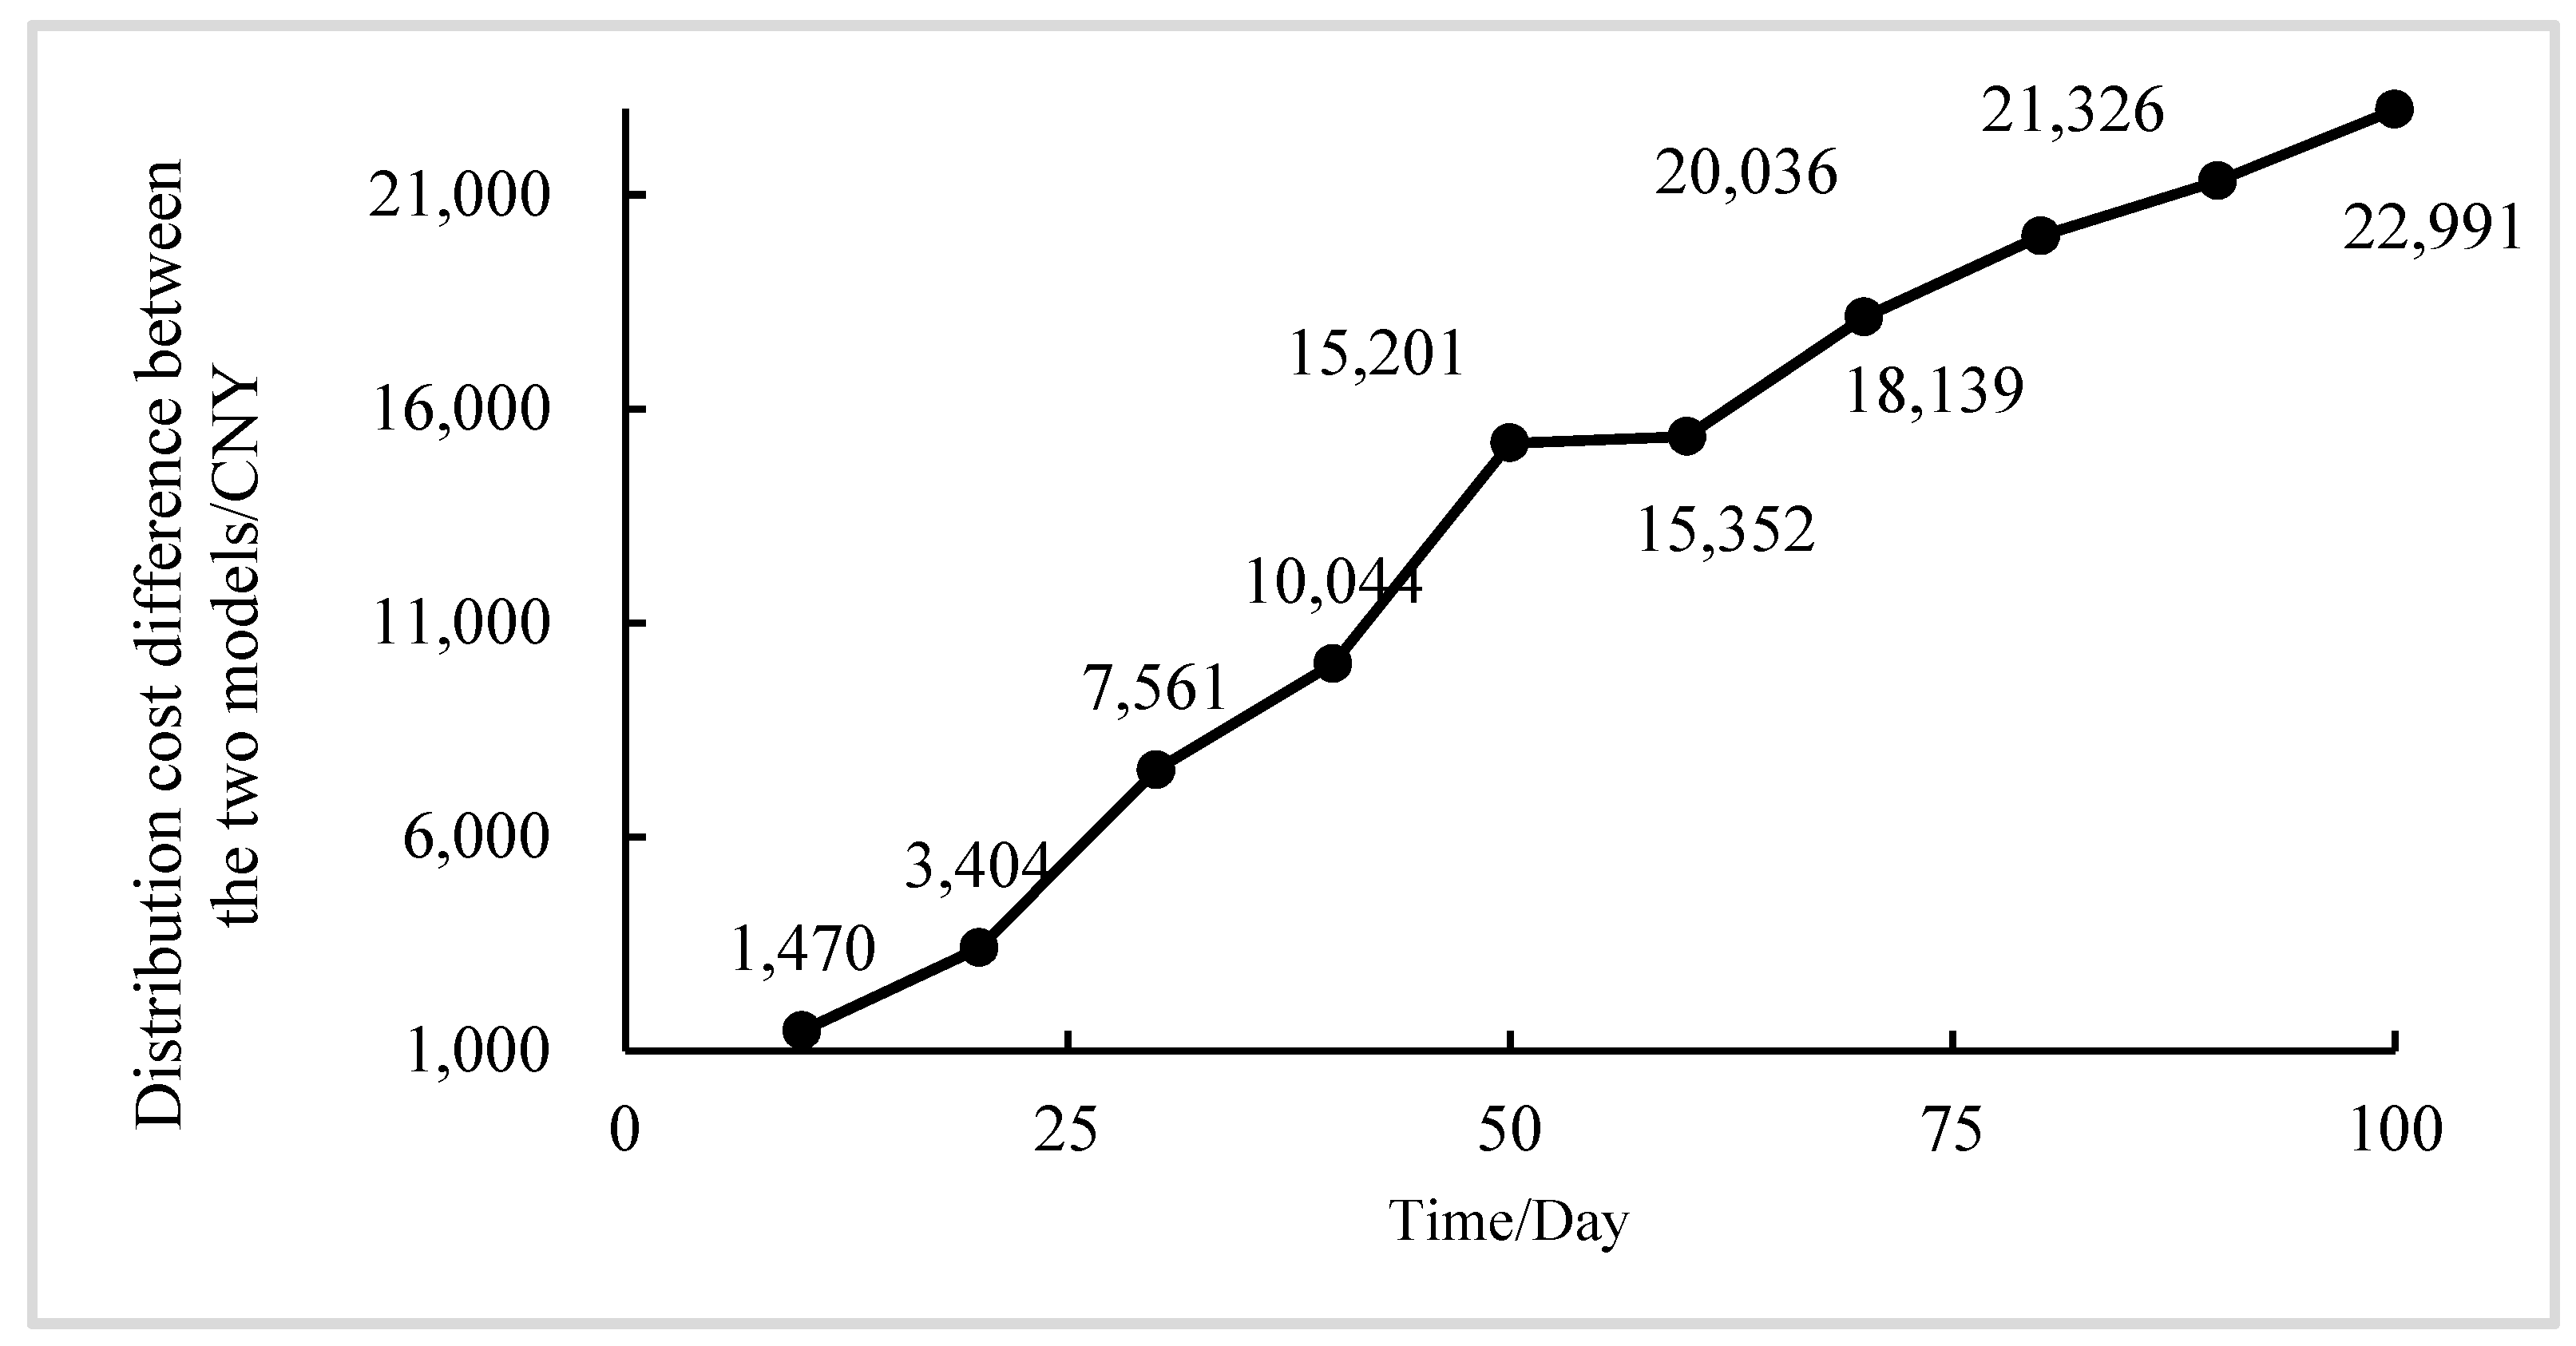
- Comparative Analysis of Distribution models: With the given computation, we receive the traditional logistical model and PI logistical model under the condition of the same infrastructure. The total cost of logistical distribution changes over time. From Figure 5 and Table 3, it is obvious that the PI logistical model continues to provide the cost advantages over the traditional logistical model in the simulation process, despite the fact that the PI logistical model’s simulation period is less than 20 days. The traditional logistical model and the PI logistical model have similar distribution costs; however, as time goes on, the cumulative logistical cost saved by the PI logistical model keeps growing, and the PI logistical model’s cost advantage progressively becomes apparent. The PI logistical model’s greatest saving value, which is CNY 22,892.49 on day 100, has an average daily saving rate of 3.96%. This demonstrates that when compared to traditional logistical networks, the PI logistical distribution network is open and interconnection performance can efficiently provide more distribution paths. Additionally, when the scale of local logistical service consumers reaches medium or above and is stable, the cost of the PI logistical distribution network is significantly lower than the cost of traditional logistics. In particular, the trend line of the logistical distribution model based on the PI is not steep, and the growth rate is comparatively stable. It is also difficult for an increase in freight volume to cause a rise in distribution costs. For every 200 containers deployed inside the system, the overall logistical cost rises by CNY 3591.55 on average. Additionally, because the internal infrastructure of PI serves all demanders in the form of public rental, common third-party logistical companies, and e-commerce activities are exempted from the cost of building basic logistical facilities, further lowering logistical distribution costs and raising customer satisfaction.
- (2)
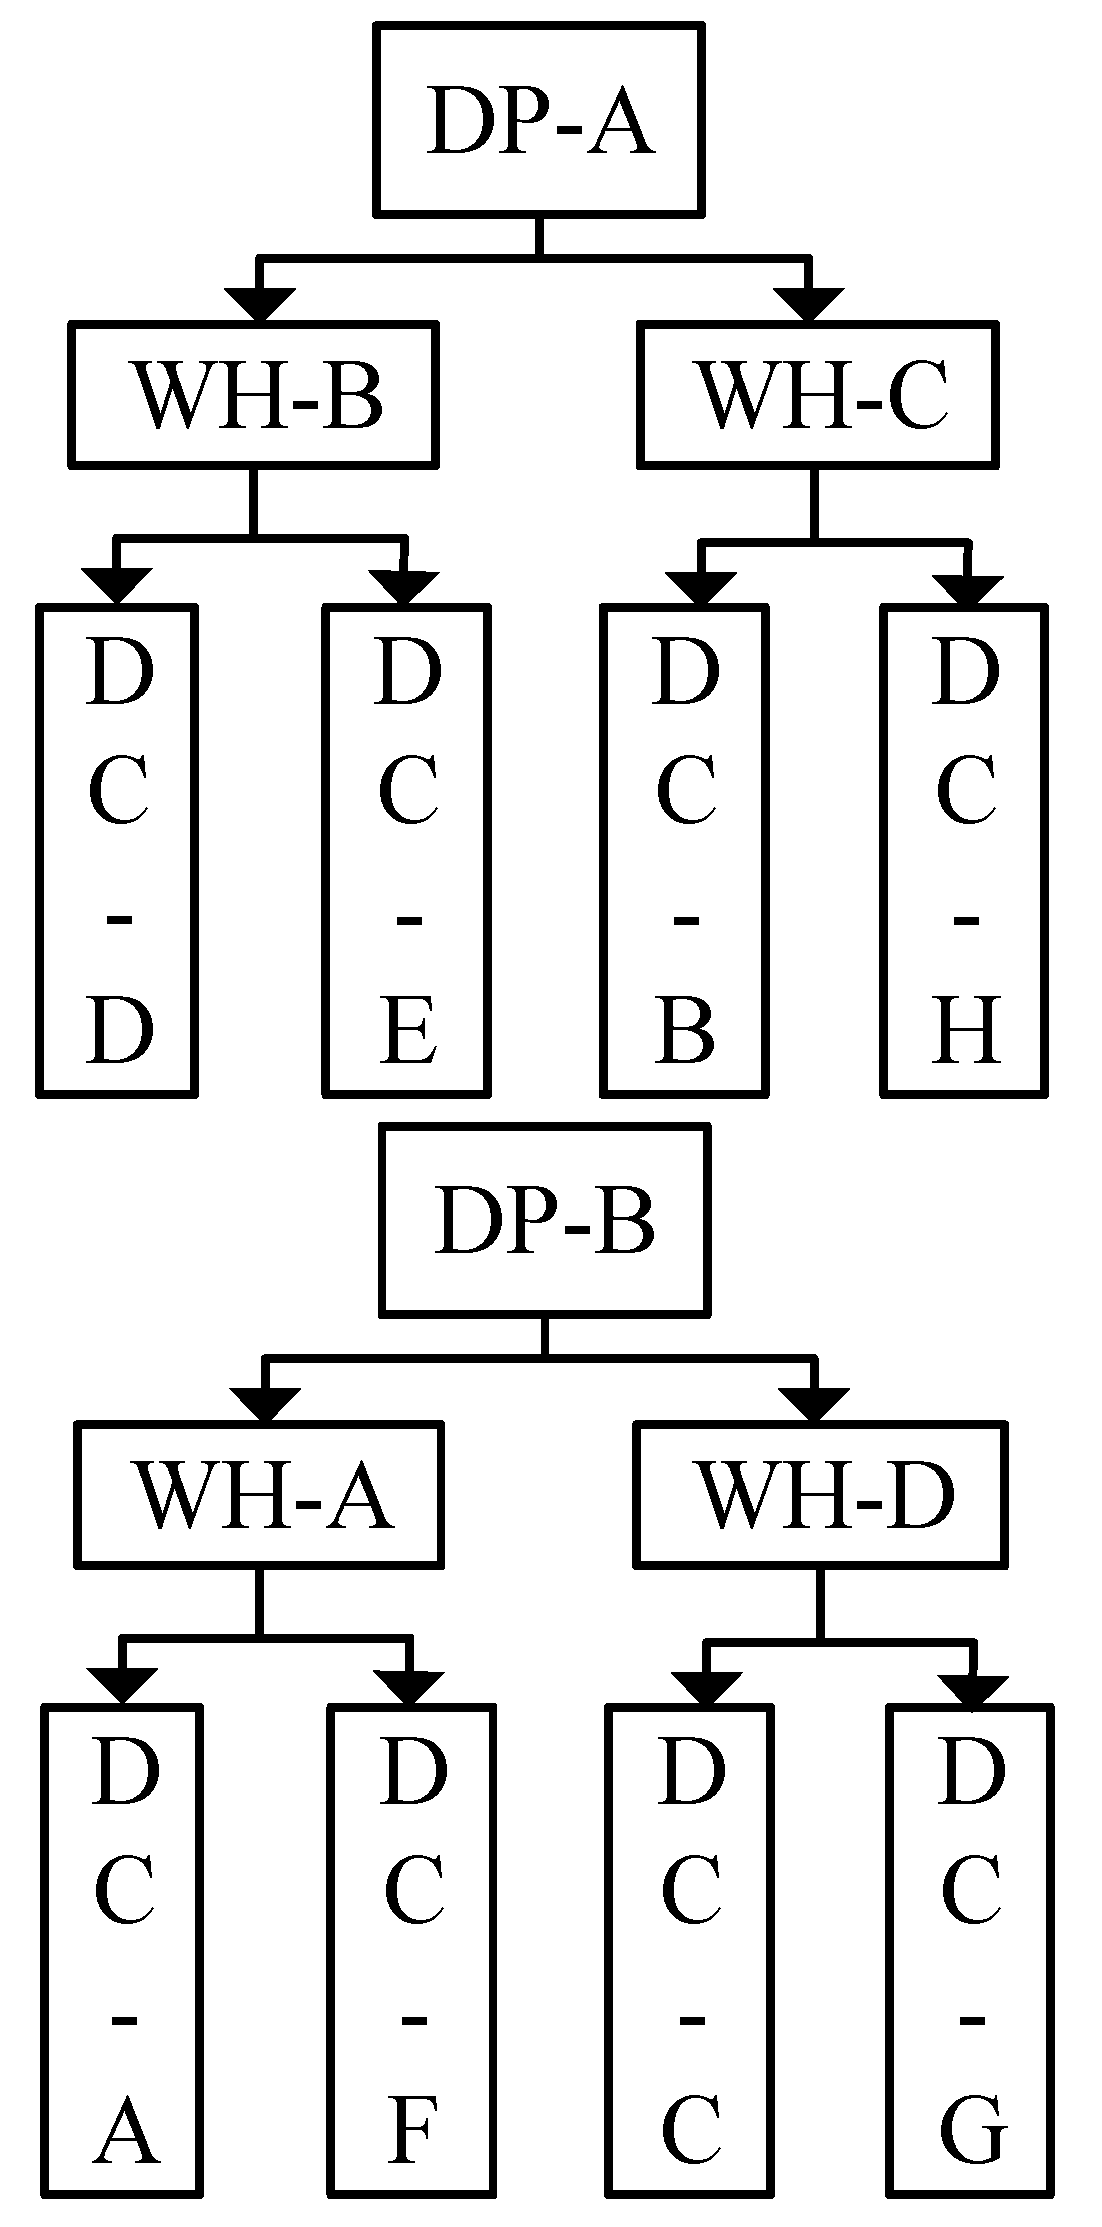
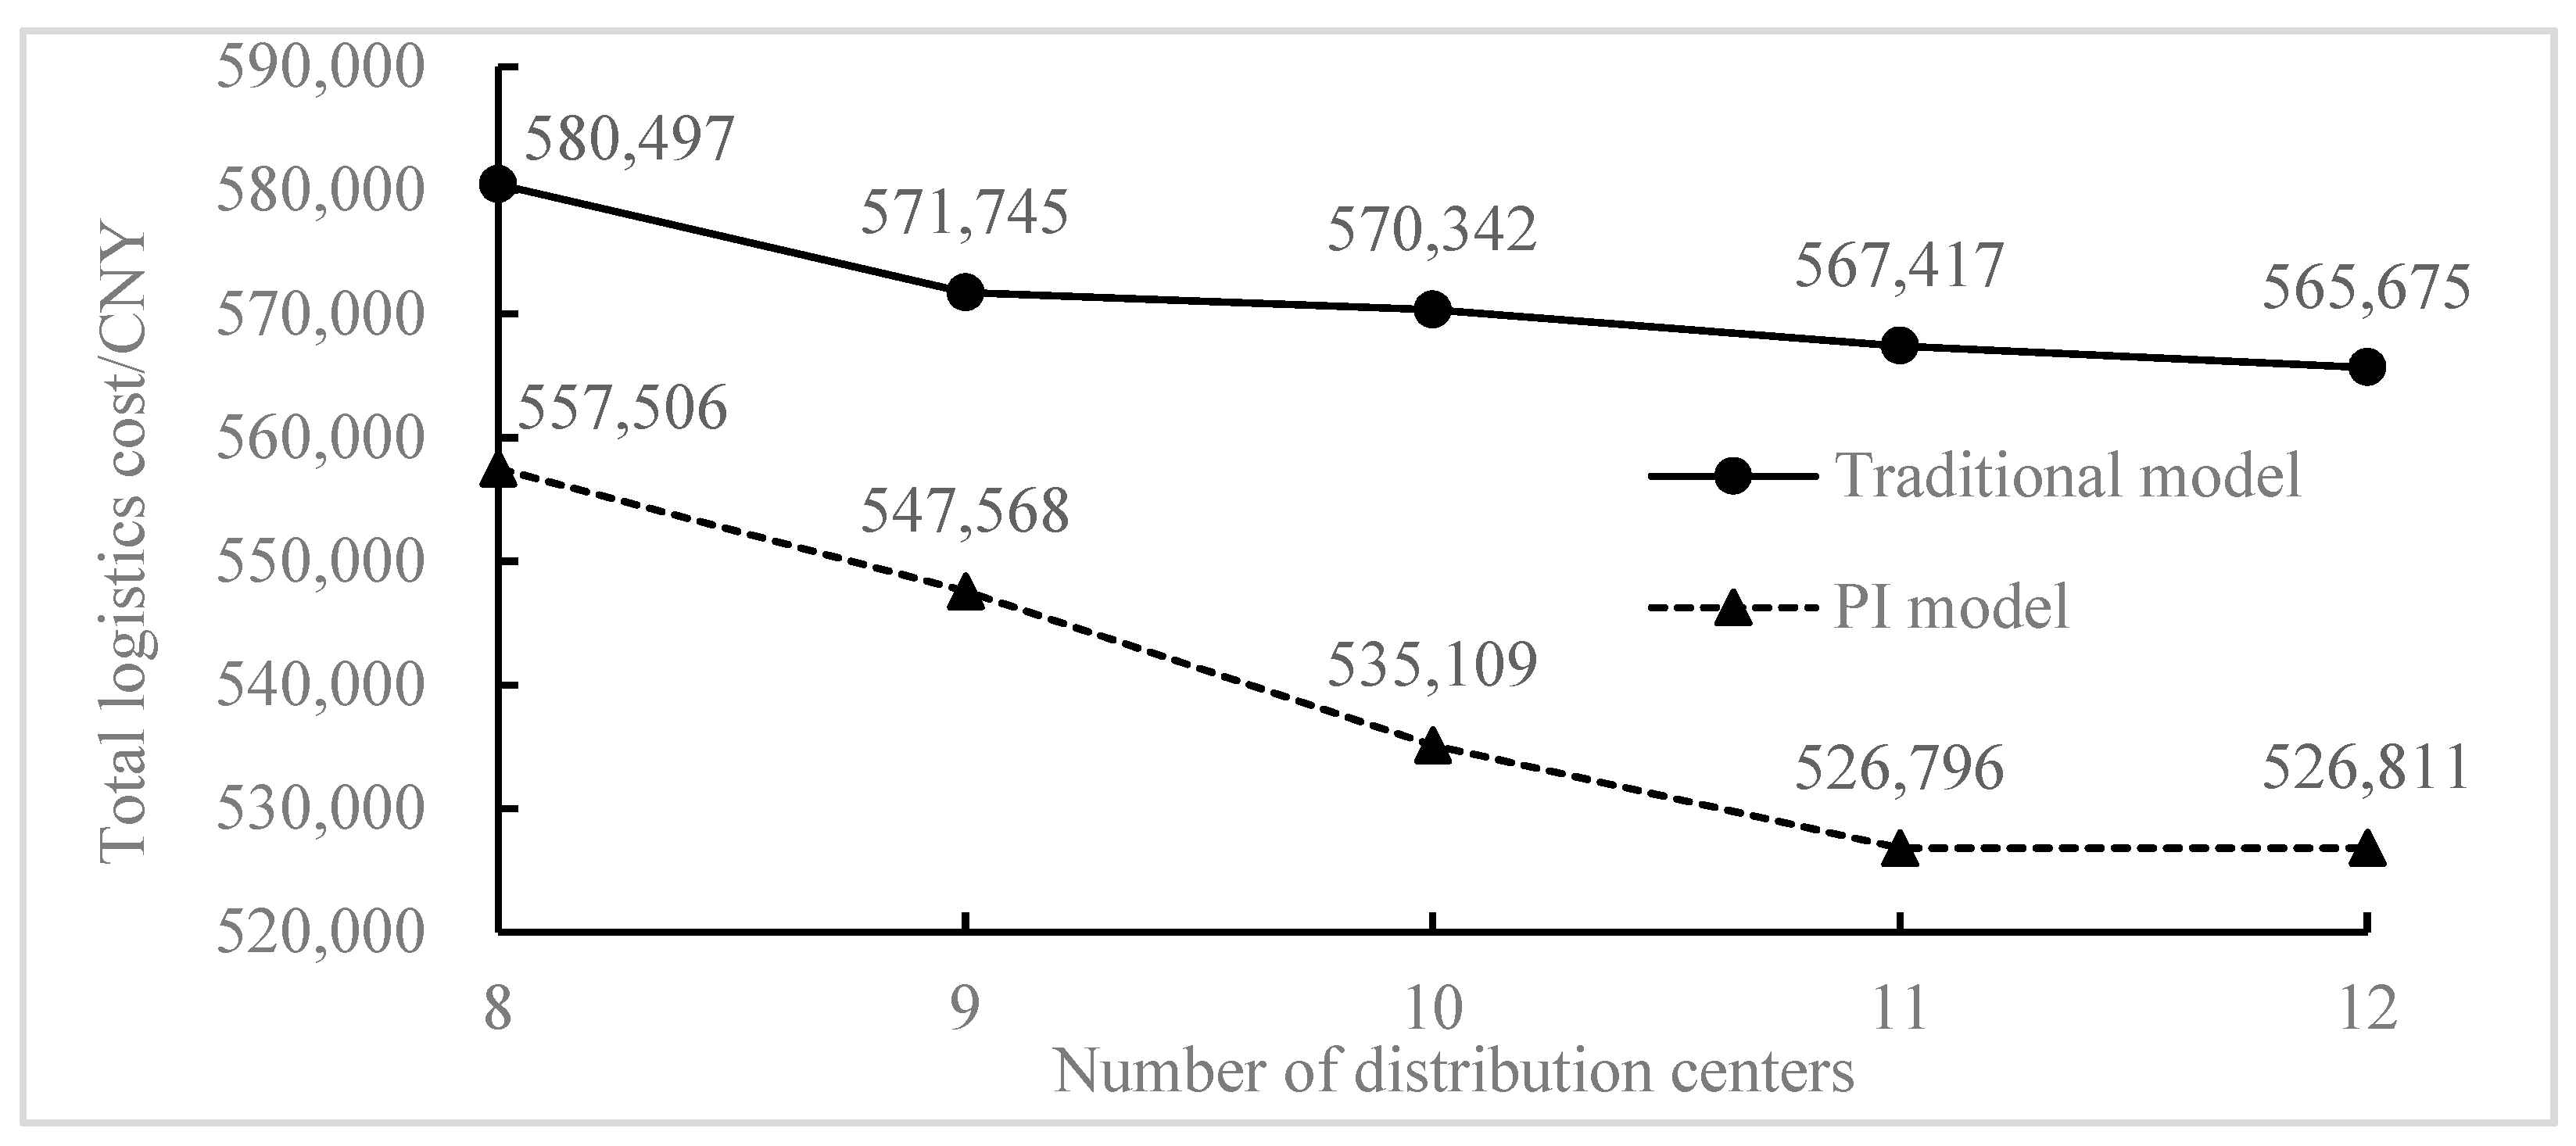
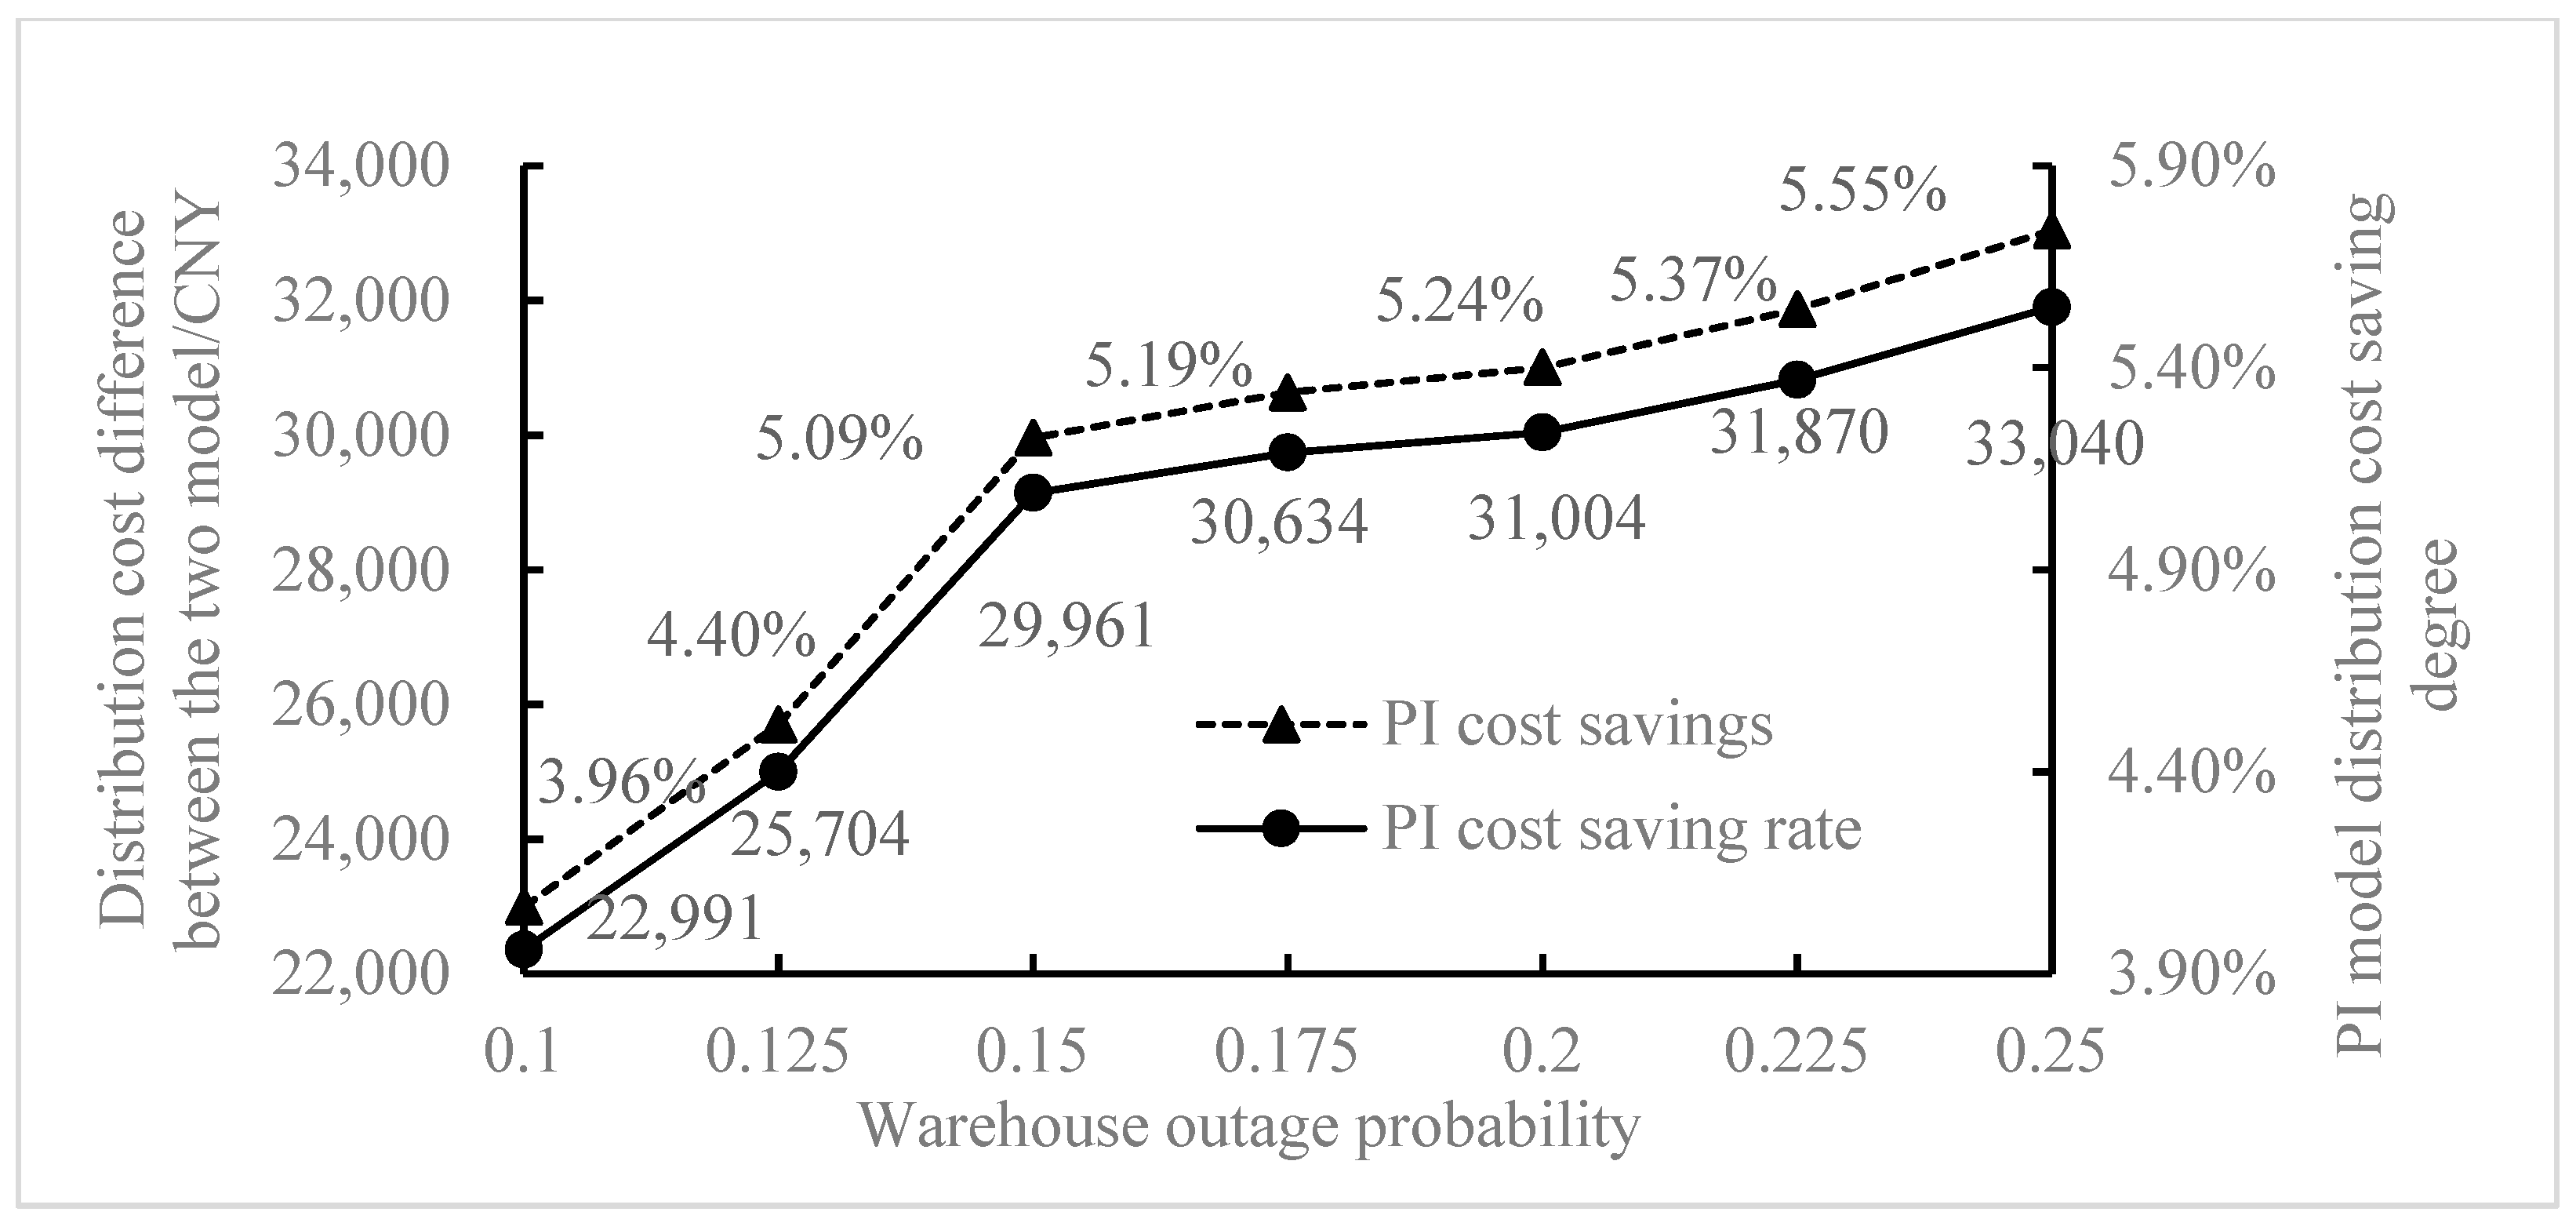
- The Core Factors Analysis: A surge in demand for logistical service providers and consumers has resulted from the gradual replacement of offline retail with online shopping. However, serious challenges have been brought about by “Shopping Day” blowing up and new epidemic outbreaks, which could cause transportation disruption on the elasticity of the logistical network. Experiments are carried out by gradually increasing the number of distribution centers from eight to twelve with a step size of 1, while keeping the same parameters in Table 1 and Figure 3, in order to further investigate the impact of the scale of logistical infrastructure and emergency interruption events on the cost advantage of the logistical distribution model in PI city. For simulation, the random outage chance for each warehouse was incrementally raised from 0.1 to 0.25, with a 0.125 step size. From Figure 6, it can be seen that the size of the logistical infrastructure for distribution has a positive promoting effect, lowering the total cost of the distribution center to give up the number of PI is higher at the end of the logistical distribution model of flexible selectivity, so the PI total cost of logistics and distribution center is roughly inversely proportional to the size number. Therefore, with each increase in a distribution center, the cost of distribution costs an average of about CNY 720.90. With the largest decrease in total cost of CNY 14,758.52, the cost optimization rate was 2.55%, only 48% of the PI logistical model improvement, and the visible PI cost optimization model was significantly higher than that of the traditional logistical model, so the expansion of the scale of the distribution center also brought some distribution advantages for the traditional logistical model. It can be seen from Figure 7 (taking the mean value after 10 simulations) that when the random interruption probability of each warehouse increases, the logistical network risk, and uncertainty increase, and the total cost of PI logistical distribution shows an increasing trend. When the interruption probability increases from 0.10 to 0.25, the total cost increases from CNY 555,116.96 to CNY 560,277.74, but the PI logistical model does not affect the optimization ability of the total cost. This is mainly reflected in the fact that the cost difference value and cost difference rate of the PI logistical model and traditional logistical model continues to rise, especially in the interval of interruption probability [0.10, 0.15] optimization increases significantly. Compared with the traditional logistical model, the total distribution cost savings of the PI logistical model are increased by CNY 6940.11, and the savings rate is increased by 1.23%. Moreover, the savings rate is consistently higher than 5.00% when the outage probability is greater than 0.15, which shows that PI has good robustness to sudden logistical outage events, while the traditional logistical distribution model has to start an emergency response when interruption occurs and to recover the distribution supply through manual allocation, which lacks good fault-tolerance. While comparing with the traditional logistical distribution model, Figure 6 and Figure 7 comprehensively show that the distribution of scale expansion and interruption probability increases when the PI cost savings rate has a high level of the model, the maximum of 6.87% and 5.55%, respectively. This further shows that the advantages of the PI logistical model in the escalating scale of logistical infrastructure and emergencies that frequently occur are still preserved. The cost and elasticity advantages are magnified under large-scale and highly intrusive external conditions.
5. Conclusions, Limitations and Future Prospects
Author Contributions
Funding
Data Availability Statement
Acknowledgments
Conflicts of Interest
References
- Crainic, T.G.; Ricciardi, N.; Storchi, G. Advanced freight transportation systems for congested urban areas. Transp. Res. Part C Emerg. 2004, 12, 119–137. [Google Scholar] [CrossRef]
- Behrends, S. Recent developments in urban logistics research–a review of the proceedings of the international conference on city logistics 2009–2013. Transp. Res. Procedia 2016, 12, 278–287. [Google Scholar] [CrossRef]
- Buldeo, R.H.; Dablanc, L. Hunting for treasure: A systematic literature review on urban logistics and e-commerce data. Transp. Rev. 2023, 43, 204–233. [Google Scholar] [CrossRef]
- Szymczyk, K.; Kadłubek, M. Challenges in general cargo distribution strategy in urban logistics–comparative analysis of the biggest logistics operators in EU. Transp. Res. Procedia 2019, 39, 525–533. [Google Scholar] [CrossRef]
- Wang, J.; Lim, M.K.; Tseng, M.L.; Yang, Y. Promoting low carbon agenda in the urban logistics network distribution system. J. Clean. Prod. 2019, 211, 146–160. [Google Scholar] [CrossRef]
- Škultéty, F.; Beňová, D.; Gnap, J. City logistics as an imperative smart city mechanism: Scrutiny of clustered eu27 capitals. Sustainability 2021, 7, 3641. [Google Scholar]
- Fatnassi, E.; Chaouachi, J.; Klibi, W. Planning and operating a shared goods and passengers on-demand rapid transit system for sustainable city-logistics. Transp. Res. B-Meth. 2015, 81, 440–460. [Google Scholar] [CrossRef]
- Cleophas, C.; Cottrill, C.; Ehmke, J.F.; Tierney, K. Collaborative urban transportation: Recent advances in theory and practice. Eur. J. Oper. Res. 2019, 273, 801–816. [Google Scholar]
- Thompson, R.G.; Hassall, K.P. A collaborative urban distribution network. Procedia Soc. Behav. Sci. 2012, 39, 230–240. [Google Scholar] [CrossRef]
- Yao, X.; Cheng, Y.; Song, M. Assessment of collaboration in city logistics: From the aspects of profit and CO2 emissions. Int. J. Logist. Res. 2019, 22, 576–591. [Google Scholar] [CrossRef]
- Gonzalez-Feliu, J. Sustainable Urban Logistics: Planning and Evaluation; John Wiley & Sons: Hoboken, NJ, USA, 2018. [Google Scholar]
- Montoya-Torres, J.R.; Muñoz-Villamizar, A.; Vega-Mejía, C.A. On the impact of collaborative strategies for goods delivery in city logistics. Prod. Plan. Control 2016, 27, 443–455. [Google Scholar]
- Taniguchi, E.; Thompson, R.G.; Yamada, T. New opportunities and challenges for city logistics. Transp. Res. Procedia 2016, 12, 5–13. [Google Scholar]
- Crainic, T.G. City logistics. In State-of-the-Art Decision-Making Tools in the Information-Intensive Age; INFORMS: Hanover, MD, USA, 2008; pp. 181–212. [Google Scholar]
- Fahim, P.B.; Rezaei, J.; Montreuil, B.; Tavasszy, L. Port performance evaluation and selection in the Physical Internet. Transp. Policy. 2022, 124, 83–94. [Google Scholar]
- Ambra, T.; Caris, A.; Macharis, C. Towards freight transport system unification: Reviewing and combining the advancements in the physical internet and synchromodal transport research. Int. J. Prod. Res. 2019, 57, 1606–1623. [Google Scholar]
- Crainic, T.G.; Montreuil, B. Physical internet enabled hyperconnected city logistics. Transp. Res. Procedia 2016, 12, 383–398. [Google Scholar]
- Venkatadri, U.; Krishna, K.S.; Ülkü, M.A. On Physical Internet logistics: Modeling the impact of consolidation on transportation and inventory costs. IEEE Trans. Autom. Sci. 2016, 13, 1517–1527. [Google Scholar]
- Yang, Y.; Pan, S.; Ballot, E. Mitigating supply chain disruptions through interconnected logistics services in the Physical Internet. Int. J. Prod. Res. 2017, 55, 3970–3983. [Google Scholar]
- Treiblmaier, H.; Mirkovski, K.; Lowry, P.B.; Zacharia, Z.G. The physical internet as a new supply chain paradigm: A systematic literature review and a comprehensive framework. Int. J. Logist. Manag. 2020, 31, 239–287. [Google Scholar]
- Montreuil, B. Toward a Physical Internet: Meeting the global logistics sustainability grand challenge. Logist. Res. 2011, 3, 71–87. [Google Scholar]
- Meyer, T.; Kuhn, M.; Hartmann, E. Blockchain technology enabling the Physical Internet: A synergetic application framework. Comput. Ind. Eng. 2019, 136, 5–17. [Google Scholar]
- Ben Mohamed, I.; Klibi, W.; Labarthe, O.; Deschamps, J.C.; Babai, M.Z. Modelling and solution approaches for the interconnected city logistics. Int. J. Prod. Res. 2017, 55, 2664–2684. [Google Scholar] [CrossRef]
- Hu, Z.; Askin, R.G.; Hu, G. Hub relay network design for daily driver routes. Int. J. Prod. Res. 2019, 57, 6130–6145. [Google Scholar] [CrossRef]
- Qiao, B.; Pan, S.; Ballot, E. Revenue optimization for less-than-truckload carriers in the Physical Internet: Dynamic pricing and request selection. Comput. Ind. Eng. 2020, 139, 105563. [Google Scholar] [CrossRef]
- Luo, H.; Tian, S.; Kong, X.T. Physical Internet-enabled customised furniture delivery in the metropolitan areas: Digitalisation, optimisation and case study. Int. J. Prod. Res. 2021, 59, 2193–2217. [Google Scholar] [CrossRef]
- Funke, J.; Kopfer, H. A model for a multi-size inland container transportation problem. Transp. Res. E Logist. Transp. Rev. 2016, 89, 70–85. [Google Scholar]
- Pan, S.; Trentesaux, D.; McFarlane, D.; Montreuil, B.; Ballot, E.; Huang, G.Q. Digital interoperability in logistics and supply chain management: State-of-the-art and research avenues towards Physical Internet. Comput. Ind. 2021, 128, 103435. [Google Scholar] [CrossRef]
- Pan, S.; Nigrelli, M.; Ballot, E.; Sarraj, R.; Yang, Y. Perspectives of inventory control models in the Physical Internet: A simulation study. Comput. Ind. Eng. 2015, 84, 122–132. [Google Scholar]
- Gorcun, O.F. Reduction of energy costs and traffic flow rate in urban logistics process. Energy Procedia 2017, 113, 82–89. [Google Scholar] [CrossRef]
- Yee, H.; Gijsbrechts, J.; Boute, R. Synchromodal transportation planning using travel time information. Comput. Ind. 2021, 125, 103367. [Google Scholar] [CrossRef]

| S. No. | Notations | Descriptions |
|---|---|---|
| 1. | collection of dispatching points , | |
| 2. | collection of logistics warehouse , | |
| 3. | collection of distribution centers , | |
| 4. | time of logistical distribution system represented by days, | |
| 5. | distance between the delivery point and each logistics warehouse , | |
| 6. | Distance (in kilometer) from each logistics warehouse to each distribution center , | |
| 7. | The shipment quantity at point follows normal distribution , | |
| 8. | fixed costs (CNY) of opening logistics warehouse and distribution center , | |
| 9. | daily unit inventory cost of logistics warehouse and distribution center , | |
| 10. | unit transportation cost (CNY) per kilometer upstream from point to warehouse , | |
| 11. | unit transportation cost (CNY) per kilometer downstream from warehouse to distribution center , | |
| 12. | daily inventory of logistics warehouse and distribution center , | |
| 13. | logistics warehouse storage capacity ceiling, | |
| 14. | if the warehouse can be used normally, it is 1. If it cannot be used due to warehouse explosion or emergency, it is 0, | |
| 15. | if container does not arrive on time, its unit penalty cost (CNY) is . | |
| These are the following decision variables: | ||
| 16. | select warehouse to receive container sent by point on day , | |
| 17. | select distribution centers to receive container sent by warehouse on day , | |
| 18. | number of containers transported from point to warehouse on day , | |
| 19. | number of containers transported from warehouse to distribution center on day , | |
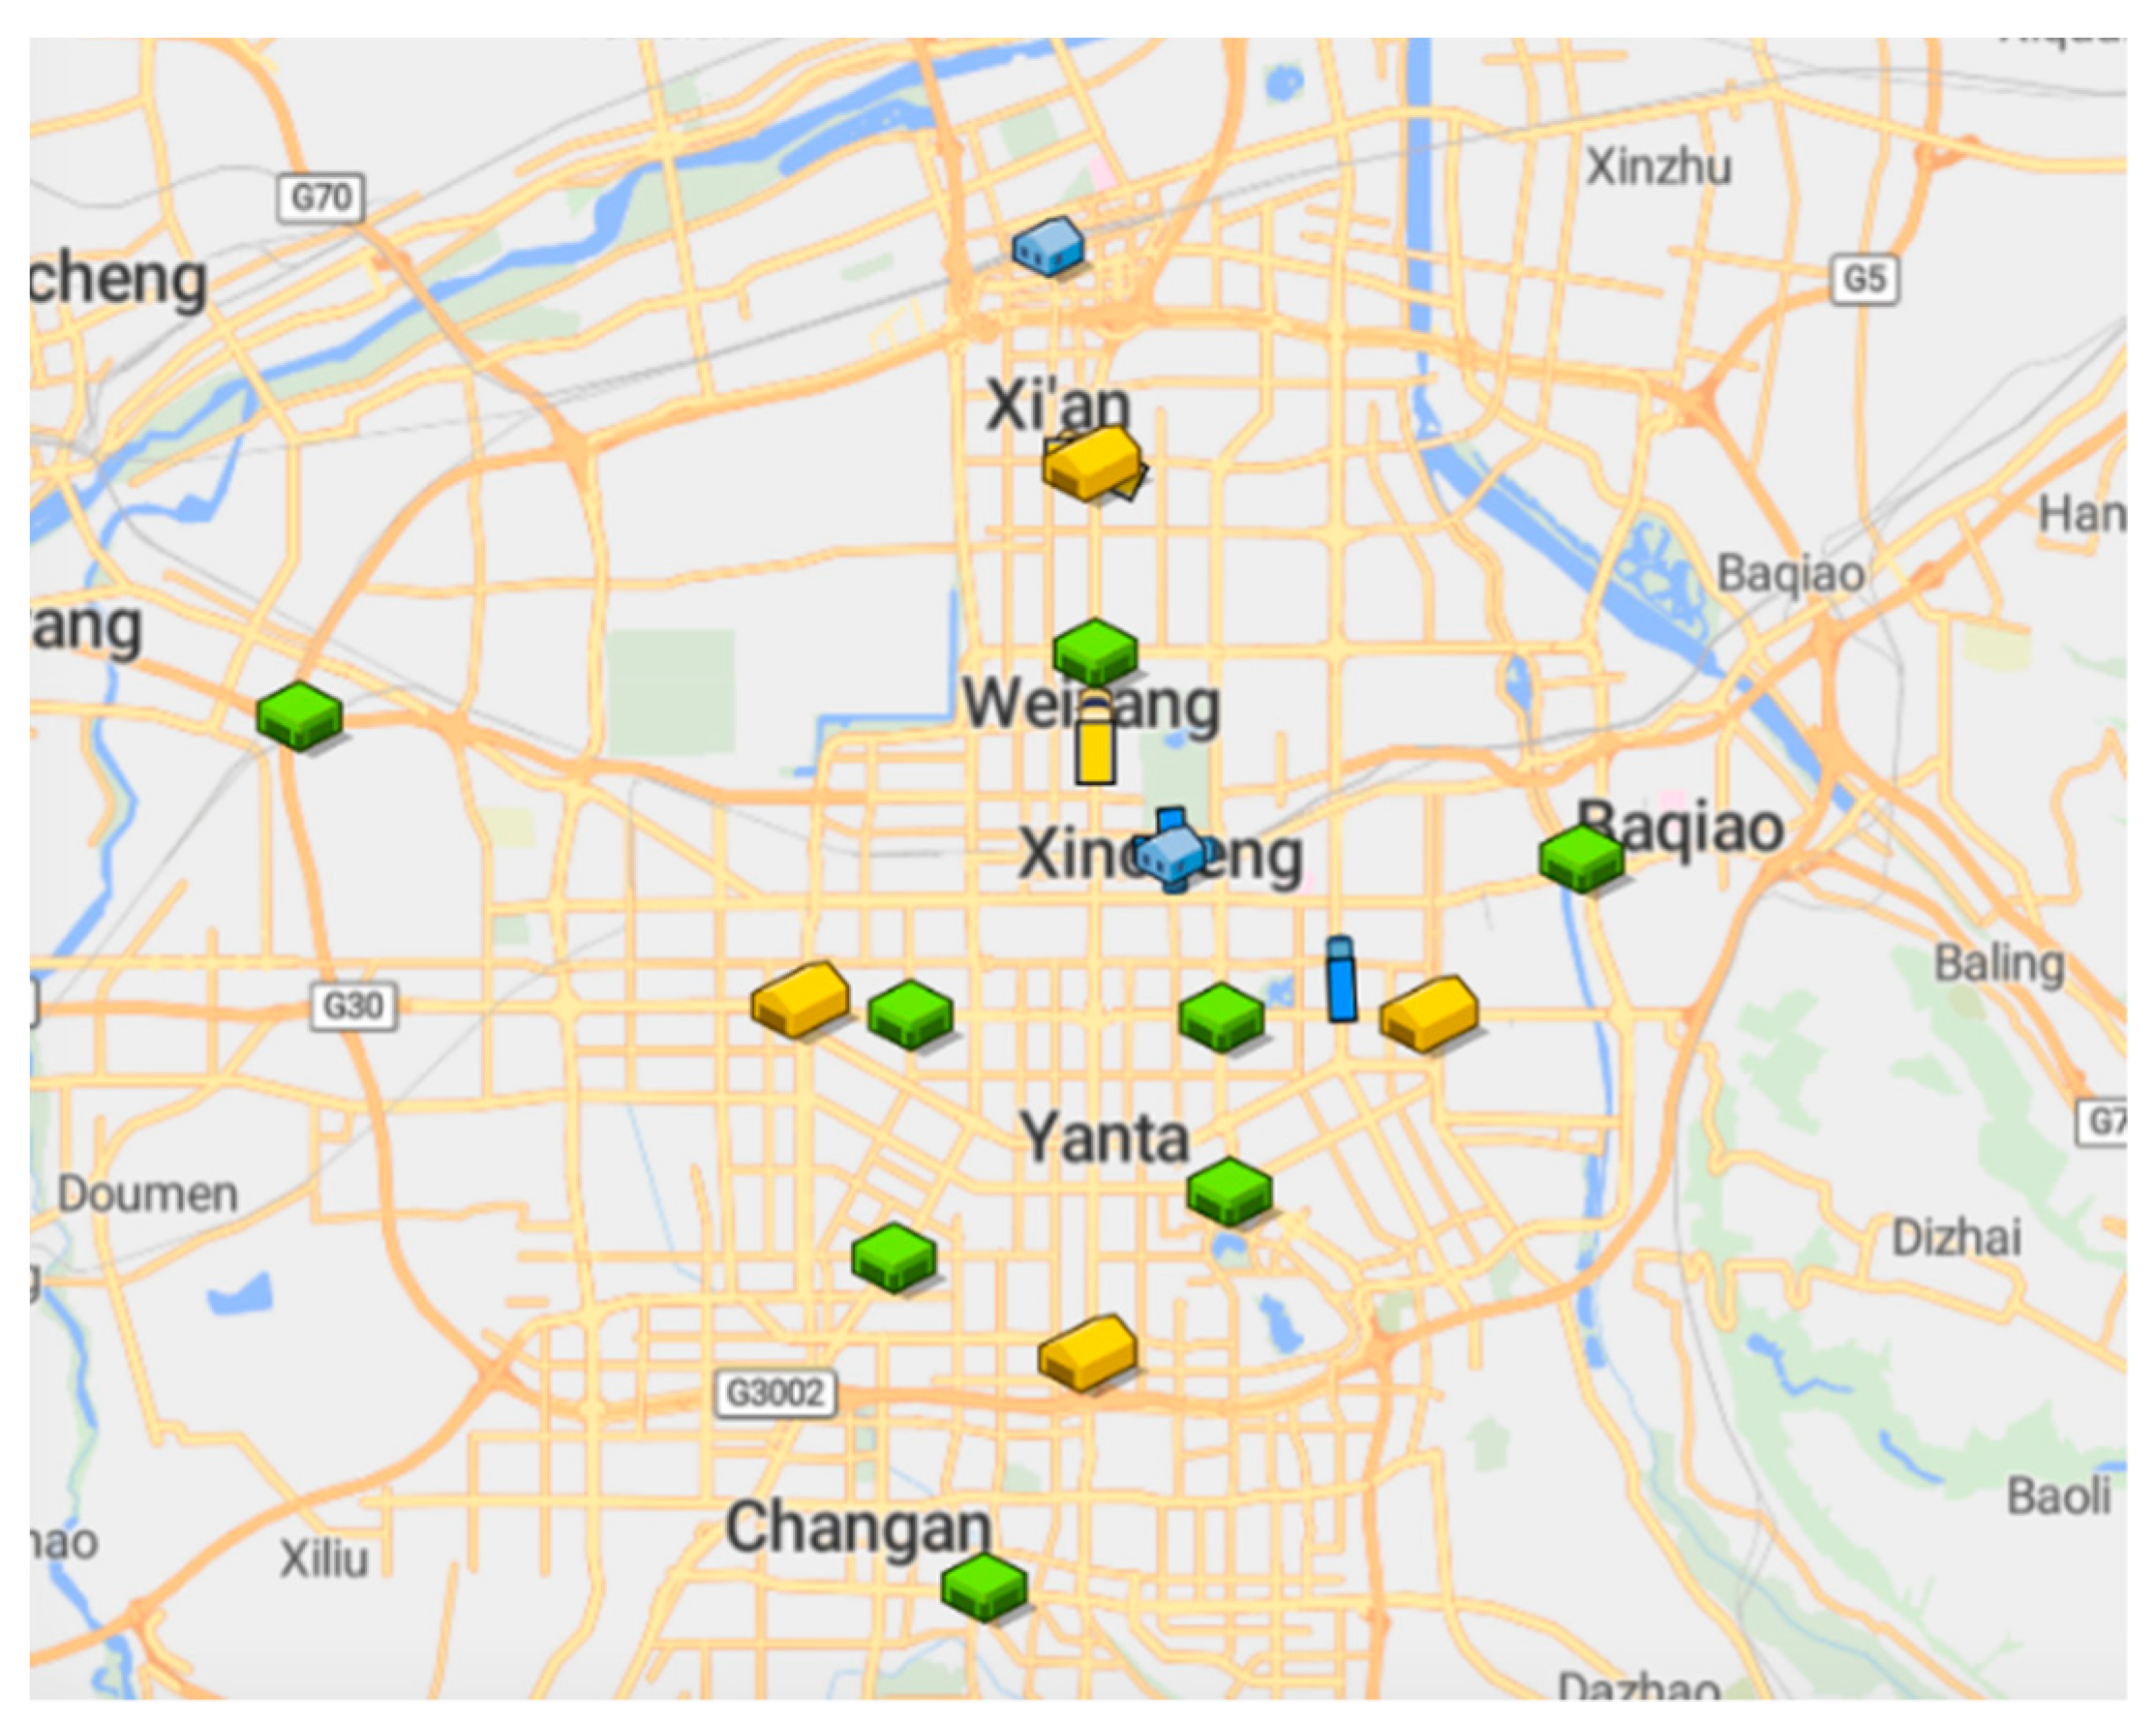
| Node | Latitude | Longitude |
|---|---|---|
| DP (first floor node) | ||
| DP-A (Xi’an Station) | 34.27946 | 108.95827 |
| DP-B (North Station) | 34.37815 | 108.93386 |
| WH (second floor node) | ||
| WH-A (North) | 34.34279 | 108.94259 |
| WH-B (South) | 34.19804 | 108.94177 |
| WH-C (East) | 34.25320 | 109.01013 |
| WH-D (West) | 34.25547 | 108.88411 |
| DC (third floor node) | ||
| DC-A (Weiyang) | 34.31241 | 108.94259 |
| DC-B (Lianhu) | 34.25366 | 108.90553 |
| DC-C (Beilin) | 34.25320 | 108.96785 |
| DC-D (Yanta) | 34.22483 | 108.96950 |
| DC-E (Changan) | 34.16057 | 108.92035 |
| DC-F (Xixian) | 34.30221 | 108.78308 |
| DC-G (Chanba) | 34.27907 | 109.04006 |
| DC-H (Gaoxin) | 34.21416 | 108.90223 |
| Time | Distribution Cost (CNY) | Cost Difference (CNY) | |
|---|---|---|---|
| Traditional Logistical Model | PI Logistical Model | ||
| 10 | 234,276 | 232,807 | 1470 |
| 20 | 275,347 | 271,942 | 3404 |
| 30 | 313,558 | 305,997 | 7561 |
| 40 | 352,121 | 342,076 | 10,044 |
| 50 | 391,190 | 375,989 | 15,201 |
| 60 | 429,092 | 413,740 | 15,352 |
| 70 | 467,772 | 449,633 | 18,139 |
| 80 | 506,306 | 486,270 | 20,036 |
| 90 | 542,385 | 521,059 | 21,326 |
| 100 | 580,497 | 557,506 | 22,991 |
Disclaimer/Publisher’s Note: The statements, opinions and data contained in all publications are solely those of the individual author(s) and contributor(s) and not of MDPI and/or the editor(s). MDPI and/or the editor(s) disclaim responsibility for any injury to people or property resulting from any ideas, methods, instructions or products referred to in the content. |
© 2023 by the authors. Licensee MDPI, Basel, Switzerland. This article is an open access article distributed under the terms and conditions of the Creative Commons Attribution (CC BY) license (https://creativecommons.org/licenses/by/4.0/).
Share and Cite
Li, J.; Fu, H.; Lai, K.K.; Ram, B. A City Logistics Distribution Model: A Physical Internet Approach. Processes 2023, 11, 3198. https://doi.org/10.3390/pr11113198
Li J, Fu H, Lai KK, Ram B. A City Logistics Distribution Model: A Physical Internet Approach. Processes. 2023; 11(11):3198. https://doi.org/10.3390/pr11113198
Chicago/Turabian StyleLi, Jianxun, Haoxin Fu, Kin Keung Lai, and Bhagwat Ram. 2023. "A City Logistics Distribution Model: A Physical Internet Approach" Processes 11, no. 11: 3198. https://doi.org/10.3390/pr11113198
APA StyleLi, J., Fu, H., Lai, K. K., & Ram, B. (2023). A City Logistics Distribution Model: A Physical Internet Approach. Processes, 11(11), 3198. https://doi.org/10.3390/pr11113198