Article

New Optimization Framework for Improvement Sustainability of Wastewater Treatment Plants

1
School of Chemistry and Chemical Engineering, Chongqing University, Chongqing 400044, China
2
Chongqing Three Gorges Water Yubei Drainage Co., Ltd., Chongqing 401120, China
3
College of Chemistry and Chemical Engineering, Chongqing University of Science and Technology, Chongqing 400044, China
*
Authors to whom correspondence should be addressed.
Processes 2023, 11(11), 3156; https://doi.org/10.3390/pr11113156
Submission received: 19 October 2023 / Revised: 1 November 2023 / Accepted: 2 November 2023 / Published: 5 November 2023

Abstract

:
Enhancing the sustainability of wastewater treatment plants (WWTPs) is crucial due to their manifold benefits, which encompass environmental preservation, cost reduction, and resource and energy conservation. The achievement of these advantages relies on the careful choice and implementation of retrofit technologies to upgrade WWTPs. However, this decision-making process is intricate, given the trade-offs between the objectives and the inherent decision uncertainties. To address these complexities, this work presents an innovative weighted multi-objective optimization (MOO) framework tailored for WWTP enhancement amid uncertain conditions. This framework comprises two phases. The first phase involves basic definition and information collection through a case-specific assessment, while the second phase includes model formulation and solver optimization, which serves as a generic tool for the weighted MOO problem. In the model formulation, a combined weighting approach that integrates expert opinions and statistical insights is introduced to assign significance to each objective. The solver optimization employs a projection-based algorithm to identify the optimal technology configuration that achieves a satisfactory and balanced improvement across multiple sustainable objectives. By applying this framework to a case plant for retrofit technology selection, the comprehensive sustainability performance, the targeting of discharged pollution, the operational cost, and the GHG emissions improved by 46.7% to 68.3%.

1. Introduction

Throughout the last century, the rapid growth of the human population, urbanization, and industrialization have imperiled the abundance and quality of natural water bodies. Municipal wastewater treatment plants (WWTPs) have served as a critical measure in the interception of aquatic pollutants and the reduction in the risks to human health and local ecology [1]. However, these WWTPs encounter significant challenges, such as inadequate design, low pollutant removal efficiency, high energy consumption, and greenhouse gas (GHG) emissions [2,3]. In the past decade, the wastewater sector has shifted its focus towards sustainable practices, placing emphasis on high-efficiency, low-carbon, and environmentally friendly development to evaluate the overall impact of WWTPs. As a result, the retrofitting of WWTPs has become a pivotal area of interest [3]. As pretreatment, secondary treatment, and advanced treatment units are typically involved in a standard wastewater treatment plant (WWTP), the following examples of retrofitting alternatives could be provided [4]. For the pretreatment unit, potential alternatives include the addition of fine screens and membrane screens, as well as the optimization of the operation of the sedimentation tank. In the secondary treatment unit, the considerations may include multiple influents, which incorporate suspended fillers, feeding carbon or nutrient sources, and the enhancement of the biological process configuration through the addition of a membrane bioreactor or the rearrangement of anaerobic/anoxic tanks. In the advanced treatment unit, options for improvement may encompass upgrading post-filtration processes and disinfection methods. From an overarching perspective, enhancing the operational efficiency of a WWTP can involve implementing superior control and automation systems and replacing outdated and inefficient pumps and aeration equipment. Additionally, taking steps to recover energy, as well as valuable nutrients like nitrogen and phosphorus (typically from the sludge line), is a promising avenue. Regarding energy recovery, retrofitting WWTPs with the combined heat and power system allows for the generation of electricity and heat from biogas. Other considerations may include the implementation of a heat pump system, the reuse of treated water, and the recycling of hydraulic potential energy [5]. For nutrient recovery, technologies such as struvite crystallization, ion exchange, or membrane concentration processes could be evaluated [6].
However, selecting retrofit technologies to meet the stringent objectives of the new requirements is increasingly challenging due to the numerous options available. Additionally, new roles have been assigned to WWTPs to recover resources such as energy and nutrients while still complying with strict discharge limits and reducing potential side effects like GHG emissions [7]. Therefore, ensuring the sustainability of WWTPs requires a careful consideration of multiple objectives, including technical performance, economic feasibility, and environmental impact [8], making the selection of suitable retrofit technologies a complex and time-consuming task. For instance, the process modeling software Biowin has frequently been utilized to assess the performance of hypothetical WWPTs that incorporate promising retrofit technologies [9,10]. Cost–benefit analysis and lifecycle costing (LCC) analysis have been suggested to address the economic considerations associated with the enhancement of WWPTs [11,12]. As for the environmental concerns, the lifecycle assessment (LCA) has always been applied and has included the evaluation of the energy and resource recovery technologies [12,13,14].
In dealing with the multiple concerns in the sustainability enhancement of the WWTPs, decision support systems (DSS) have been usually created by resorting to multi-attribute decision-making approaches or multi-objective optimization techniques [15,16]. For instance, a smart plant DSS has been developed specifically for the selection of WWTP configurations that incorporate resource recovery. In this system, a widely used multi-criteria decision-making (MCDM) method called the technique for order of preference by similarity to ideal solution (TOPSIS) is employed to compare various objective values, including GHG emissions, accumulation of effluent violations, effluent quality index, net present value, system readiness level, and plant land area [7]. Ullah et al. [17] introduced a multi-attribute-based DSS for suitable wastewater treatment technologies; it considered technical, social, economic, regulatory, governmental, and environmental factors and was based on four levels of treatment (preliminary, primary, secondary, and tertiary treatment) to customize treatment assembly, prevent mistakes, and facilitate decision making. By resorting to analytical hierarchical process (AHP, another popular MCDM method), Arroyo and Molinos-Senante [18] proposed a model to identify the most sustainable wastewater treatment technology among several alternatives by considering economic, environmental, and social criteria. Other MCDM techniques, such as stepwise weighted assessment ratio analysis (SWARA), multi-objective optimization by ratio analysis (MOORA), interactive multi-criteria decision making (TODIM), complex proportional assessment (COPRAS), and their variations, can also be found in recent works [19,20,21], demonstrating the advantages of addressing conflicting multiple criteria [22,23].
When retrofitting existing WWTPs for improved sustainability, the multi-objective optimization (MOO) technique is preferable over the MCDM methods. This preference stems from the MOO technique’s capability to evaluate trade-offs and determine an optimal solution within design constraints, as opposed to the MCDM methods that assess the sustainability performance of each alternative separately. For instance, Fernandez-Arevalo et al. [24] use the plant-wide modeling methodology to compare existing WWTP configurations and those which are under development by focusing on the influent characteristics, thus demonstrating that this methodology would be suitable for assessing the incorporation of emerging retrofit technologies in conventional plant layouts. The work of Sucu et al. [25] introduces a conceptual framework that employs weighted multi-objective mixed-integer nonlinear programming to determine the optimal unit process combination for recovering resources from wastewater while minimizing environmental, social, technical, and economic impacts.
Due to the inherent complexity of enhancing the sustainability of WWTPs, the computational challenges and human limitations when simultaneously managing multiple objectives can restrict the effectiveness of the MOO technique. In essence, MOO generates a set of Pareto frontiers that can be time-consuming, particularly when dealing with an infinite number of Pareto solutions in multi-objective mixed integer linear or nonlinear programming problems. Metaheuristic algorithms, including genetic algorithms, particle swarm optimization, and ant colony optimization, have been extensively employed to explore the solution space and improve the solutions in MOO problems, including those related to WWTP planning [26].
Despite the metaheuristic algorithms that provide a variety of Pareto optimal solutions, decision makers may struggle to select a final solution due to inadequate consideration of trade-offs among multiple objectives. To address this challenge, stakeholders often prefer a single-objective approach (SOA) when working to improve the sustainability of a WWTP. This approach aligns with their preferences and streamlines the optimization process by consolidating multiple objectives into a single goal. In the context of the SOA, several methods have been investigated to alleviate computational burdens, such as integrating the decision makers’ preferences, implementing normalized constraints, introducing the concept of dominance, employing Pareto filters, and minimizing the distance from the Pareto frontier [27]. However, the SOA can result in information loss and can overlook important trade-offs between conflicting objectives, especially when the stakeholders seek a broader range of options. To address these limitations, some works integrated MCDM methods into MOO techniques, enabling decision makers to not only understand the trade-offs between objectives but also to streamline the search towards a specific region of the Pareto front and reduce computational burdens [28]; this offered an easy yet promising way to enhance the effectiveness of the SOA-based MOO technique. Here are a few typical examples: the AHP method has been integrated into MOO techniques to design the resource networks in eco-industry parks [29], as well as the biomass supply chains [28]. The TOPSIS is combined with MOO to optimize the chemical pulp supply mix within the paper industry [30] and the ethylbenzene production process [31].
The published papers underscore the advantages of combining MOO with MCDM. Nonetheless, two concerns remain unaddressed. Firstly, there is a lack of a rational method for identifying the trade-offs among objectives. The previous works always rely on subjective weighting tools like AHP to gauge the relative significance of each objective; this is prone to bias stemming from human manipulation and could be hindered by challenges in the questionnaire design and information collection. Secondly, there is a lack of a reliable technique for defining the final Pareto point. The current research often prioritizes the aggregation of multiple objectives while neglecting their balanced performance. As a result, the obtained decision output is inadequate within the context of sustainability as it may lead to imbalanced development. Moreover, selecting retrofit technologies for WWTPs involves a substantial reliance on the judgments of experts and on numerical data, which are characterized by the presence of fuzziness and fluctuations, respectively. Considering the uncertain information involved, the MCDM–MOO models become more complex, particularly when attempting to identify trade-offs among multiple objectives and generating the final Pareto point.
This study introduces a hybrid MCDM–MOO framework to enhance the decision-making process in selecting retrofit technologies for improving the sustainability of WWTPs. Firstly, a combined weighting approach is proposed to enable a rational identification of the trade-offs among the objectives. This approach can simultaneously consider the decision makers’ preferences and the data characteristics. Secondly, a projection-based technique is used to reliably define the final Pareto point by representing both the improvement degrees and the balance between the objectives associated with the alternative technologies. Furthermore, by incorporating interval numbers, both the combined weighting method and the projection-based technique can be utilized in uncertain conditions, rendering the entire framework adaptable to real-world decision-making environments.

2. Materials and Methods

2.1. Overview of the Framework

This study aims to propose a systematic decision support framework for effectively identifying the optimal solution, with a focus on the retrofit technology-based sustainability enhancement of WWTPs. As illustrated in Figure 1, the framework consists of two phases: (1) basic definition and information collection and (2) model formulation and solver optimization. During the first phase, the problem scope is defined, followed by the collection and processing of relevant data. This phase should be conducted on a case-by-case basis, taking into account the specific characteristics of the WWTP under investigation. The second phase, model formulation and solver optimization, involves three important components: (i) the determination of the weights, (ii) the aggregation of the multi-objective, and (iii) the generation of an optimal configuration for the retrofit technologies. In contrast to the customized operations in phase 1, these three actions within phase 2 are applicable to the study of sustainability enhancement problems of various sizes and scopes. Therefore, the following sections will primarily explain the mathematical methods employed in phase 2, with a brief introduction to the operations conducted in phase 1.

2.2. Basic Definition and Information Collection

The stage of basic definition and information collection is tailored to the WWTP under investigation. The basic definition involves identifying retrofit technologies and determining the enhancement objectives. Subsequently, the demand data associated with each retrofit technology for a specific objective can be generated using suitable analytical tools. Additionally, data processing is necessary to mitigate the impact of objective dimensionality.

2.2.1. Alternative Technologies Identification

To enhance the sustainability of an existing WWTP, it is necessary to select sets of technologies (decision variables) from N options for implementation. Accordingly, a binary variable Tj is defined as either 1 or 0 (j = 1, 2, …, n), representing whether the corresponding technology is selected or not. Notably, alternative technologies are typically provided by professional experts based on their knowledge and expertise, using methods like experience-based approaches, experiments, and simulations.

2.2.2. Sustainability Objectives Determination

Adequate sustainability objectives can be determined according to the specific situation of the existing WWTP and the preferences of the stakeholders. Typical objectives may include environmental performance, such as by maximizing treatment efficiency; economic considerations, such as by minimizing operational costs; and social responsibility [32,33], such as by reducing GHG emissions, among others. Consequently, the number of objectives should be determined on a case-by-case basis, denoted as Oi, where i = 1, 2, …, m.

2.2.3. Information Collection and Treatment

According to the sustainability objectives, relevant information on each retrofit alternative would be collected using the appropriate tools. Using the aeration process in the biological treatment unit as an example, the operational data (effluent pollutants, operating costs, and carbon emissions) from the original plant can be collected or calculated before the aeration technology retrofit. After considering the advanced aeration technology, the equivalent modeling of the WWTP can be conducted using simulation software like Biowin [9]. It can also be compared with similar plants (those that have undergone the aeration retrofit) to obtain data on the influent/effluent and aeration equipment operation post-retrofit. Based on this, a thorough analysis of the WWTP’s energy consumption, material utilization, and labor expenses before and after aeration technology enhancements allows users to obtain insights into cost reduction [34]. Likewise, by considering the indirect GHG emissions related to electricity and chemical consumption, the information regarding the GHG emission reduction related to aeration technology improvement can be obtained [35]. The data collection process for various retrofit technologies can follow the same logic as that shown in Figure 2. In addition, it is crucial to maintain uniformity in the scope of the data collection. For instance, when addressing the cost reduction resulting from the adoption of retrofitting technologies, data pertaining to energy expenses, material costs, sludge disposal outlays, labor expenditures, and similar factors should be confined to the case plant premises. This ensures the integrity and comparability of the evaluation data.
In this way, the collected information can be used to estimate the categorized sustainability objective for the investigated WWTP. Let us consider a set of m objectives. The performance data of the WWTP for the i-th objective can be determined before and after the implementation of the j-th technology, denoted as Oi(P) and Oi(Tj), respectively. The resulting difference between the two is then used to generate the corresponding demand data, represented as Δ O i ( T j ) = O i T j O i P . Notably, in order to address the varying units and scales present in the collected data ( Δ O i ( T j ) ) for multi-objective analysis, it is necessary to eliminate the effects of the objectives’ dimensionality, depicted as z i j = [ z i j L ,   z i j U ] .

2.3. Model Formulation and Solver Optimization

This work introduces a generic model for selecting the optimal configuration of the retrofit technologies by employing a single-goal function to identify a unique Pareto point, instead of exploring multiple Pareto frontiers. To achieve this, a weighted MOO is suggested, where the two critical issues, i.e., the assignment of the weights to the objectives and the aggregation of the objectives into a single goal, can be properly considered, as given in Equation (1) [36].
Optimize   F w i × z i j T j s . t .   h ( T j ) = 0   g ( T j ) 0  
In Equation (1), the function F w i × z i j T j is used to provide a unique Pareto point among the weighted multiple objectives. Here, wi represents the significance of the i-th objective, and z i j T j represents the objective vector. Additionally, h ( T j ) = 0 and g ( T j ) 0 symbolize the equality and inequality constraints, respectively.

2.3.1. Weights Assignment

An important aspect of this study is the incorporation of a combined weighting approach, which enables a rational assessment of the trade-offs among the objectives. This approach allows decision makers to consider their preferences and to account for data characteristics simultaneously during the decision-making process. To be specific, the weighting approach employed in this study combines the subjective method of SWARA II (stepwise weight assessment ratio analysis II) with the objective method of CRITIC (criteria importance through intercriteria correlation). Both methods are then modified to account for uncertain conditions by utilizing interval numbers, which offers an easy yet generic way to account for uncertain decision making [37].

Subjective Weights–Interval SWARA II

In the context of the weighted MOO, pair-wise comparison methods (such as AHP) are commonly used to assign weights to multiple objectives [38]. These methods are favored by experts as they effectively capture their preferences and facilitate the conversion of preferences into numerical weights. In this study, an extended version of the pair-wise comparison method, SWARA II [39], is utilized to assign subjective weights under uncertain conditions. This modified approach provides several advantages, including simplified model solving, decreased computation time, and improved ease of comprehension [40]. The steps (1–3) involved in the application of the interval SWARA II are outlined below:
Step 1. Ranking and comparing the multiple objectives in descending order of significance. The committee of experts prioritizes the objectives from the most to the least important according to the actual situation of the investigated WWTP. Subsequently, the relative importance of each objective over the next one in the ranks should be given by the experts using Saaty’s scale system (Table 1). Such a scale system is characterized by its nine-point scale of preferences and is highly esteemed in the MCDM process for its precision in scale division and flexibility in the comparative evaluation.
To account for the uncertainty in subjective preference, the utilization of the interval numbers r i = r i L ,   r i U is suggested. For instance, if ri is an interval number of [2, 4], it indicates that the relative importance of the i-th objective over the next one (i + 1-th) ranges from very low (2) to medium low (4).
Step 2. Determining the relative weighting coefficient. Let kt denote the value of the relative weighting coefficient. Starting from the last ranked objective, the relative coefficient between two adjacent objectives is given in Equation (2) [39].
k t = 1 + r i / 10 2 × k t + 1
Step 3. Generating the interval SWARA II weights. Equation (3) is established to calculate the subjective weight of each objective.
min / max s w i s . t . r 1 [ r 1 L , r 1 U ] ,   r 2 [ r 2 L , r 2 U ] , , r m 1 [ r m 1 L , r m 1 U ] ; k 1 = 1 + r 1 10 2 × k 2 ,   k 2 = 1 + r 2 10 2 × k 3 , ,   k m 1 = 1 + r m 1 10 2 × k m ,   k m = 1 ; s w i = k i / ( k 1 + k 2 + + k m ) ; s w 1 s w 2 s w m 0
In Equation (3), a minimize or maximize function should be implemented for the i-th objective, resulting in a solution presented as an interval number, which is denoted as s w i = min s w i , max s w i = s w i L , s w i U .

Objective Weights–Interval CRITIC

Objective weighting methods, such as entropy and standard deviation, can be employed in the weighted MOO problem [41]. These methods assign higher weights to objectives with higher levels of disorder, reflecting their relative importance in the decision-making process. Incorporating these weighting techniques eliminates subjective human manipulation in the determination of the weights, enabling a more objective and systematic approach to MOO. In this study, the CRITIC method is used as the weighting approach. Compared to other objective weighting approaches, the CRITIC method provides valuable insights into the challenges that arise from conflicting multi-objectives and enables the incorporation of interdependent objectives. Additionally, this study expands the application of the CRITIC method to handle uncertain evaluations by using interval numbers. An outline of the steps (4–6) involved in applying the interval CRITIC method is given below:
Step 4. Transforming data. This step involves transforming the original collected data of z i j using Equation (4).
z ¯ i j L , z ¯ i j U = z i j L min i   z i j L max i   z i j U min i   z i j L ,   z i j U min i   z i j L max i   z i j U min i   z i j L
Step 5. Computing standard derivation and correlation. According to the literature [42], Equation (5) is employed to calculate the standard deviation of each objective (e.g., the i-th objective, σ i = σ i L ,   σ i U ) and measures the intensity of the contrast. Equation (6) is used to determine the correlation coefficient between the two objectives (e.g., the i-th and g-th objectives, q i g = q i g L ,   q i g U ).
σ i L ,   σ i U = i = 1 m z ¯ i j l a z j 2 m , i = 1 m z ¯ i j U a z j 2 m
q i g L ,   q i g U = j = 1 n z ¯ i j L a z j z ¯ g j L a z j j = 1 n z ¯ i j L a z j 2 j = 1 n z ¯ g j L a z j 2 ,   j = 1 n z ¯ i j U a z j z ¯ g j U a z j j = 1 n z ¯ i j U a z j 2 j = 1 n z ¯ g j U a z j 2
where a z j = i = 1 m z ¯ i j L + z ¯ i j U 2 m represents the average performance of m alternative technologies with respect to the i-th objective.
Step 6. Generating the interval CRITIC weights. The amount of information linked to the i-th objective ( f i = f i L , f i U ) is determined using Equation (7). A higher value of f i indicates the greater importance of this objective [42]. Additionally, the normalized amount of information for the i-th objective is subsequently utilized to generate the corresponding weight, i.e., o w i = o w i L , o w i U , as given in Equation (8).
f i L , f i U = min σ i L m g = 1 m q i g L ,   σ i U m g = 1 m q i g U ,   max σ i L m g = 1 m q i g L ,   σ i U m g = 1 m q i g U
o w i L , o w i U = f i L j = 1 m f i L + f i U / 2 ,   f i U j = 1 m f i L + f i U / 2

Combined Weights–Minimize Deviation

The interval numbers related to subjective and objective weights need to be appropriately managed and integrated into the combined weights, as given in step 7.
Step 7. Generating the combined weight. Adhering to the work in [43], Equation (9) is employed in combining the weights, indicating that the final weight exhibits minimal deviation from both the subjective and objective weights.
Minimize   D = i w i s w i L 2 + w i s w i U 2 2 + i w i o w i L 2 + w i o w i U 2 2 s . t .   i w i = 1 ; min s w i L , o w i L w i max s w i L , o w i L

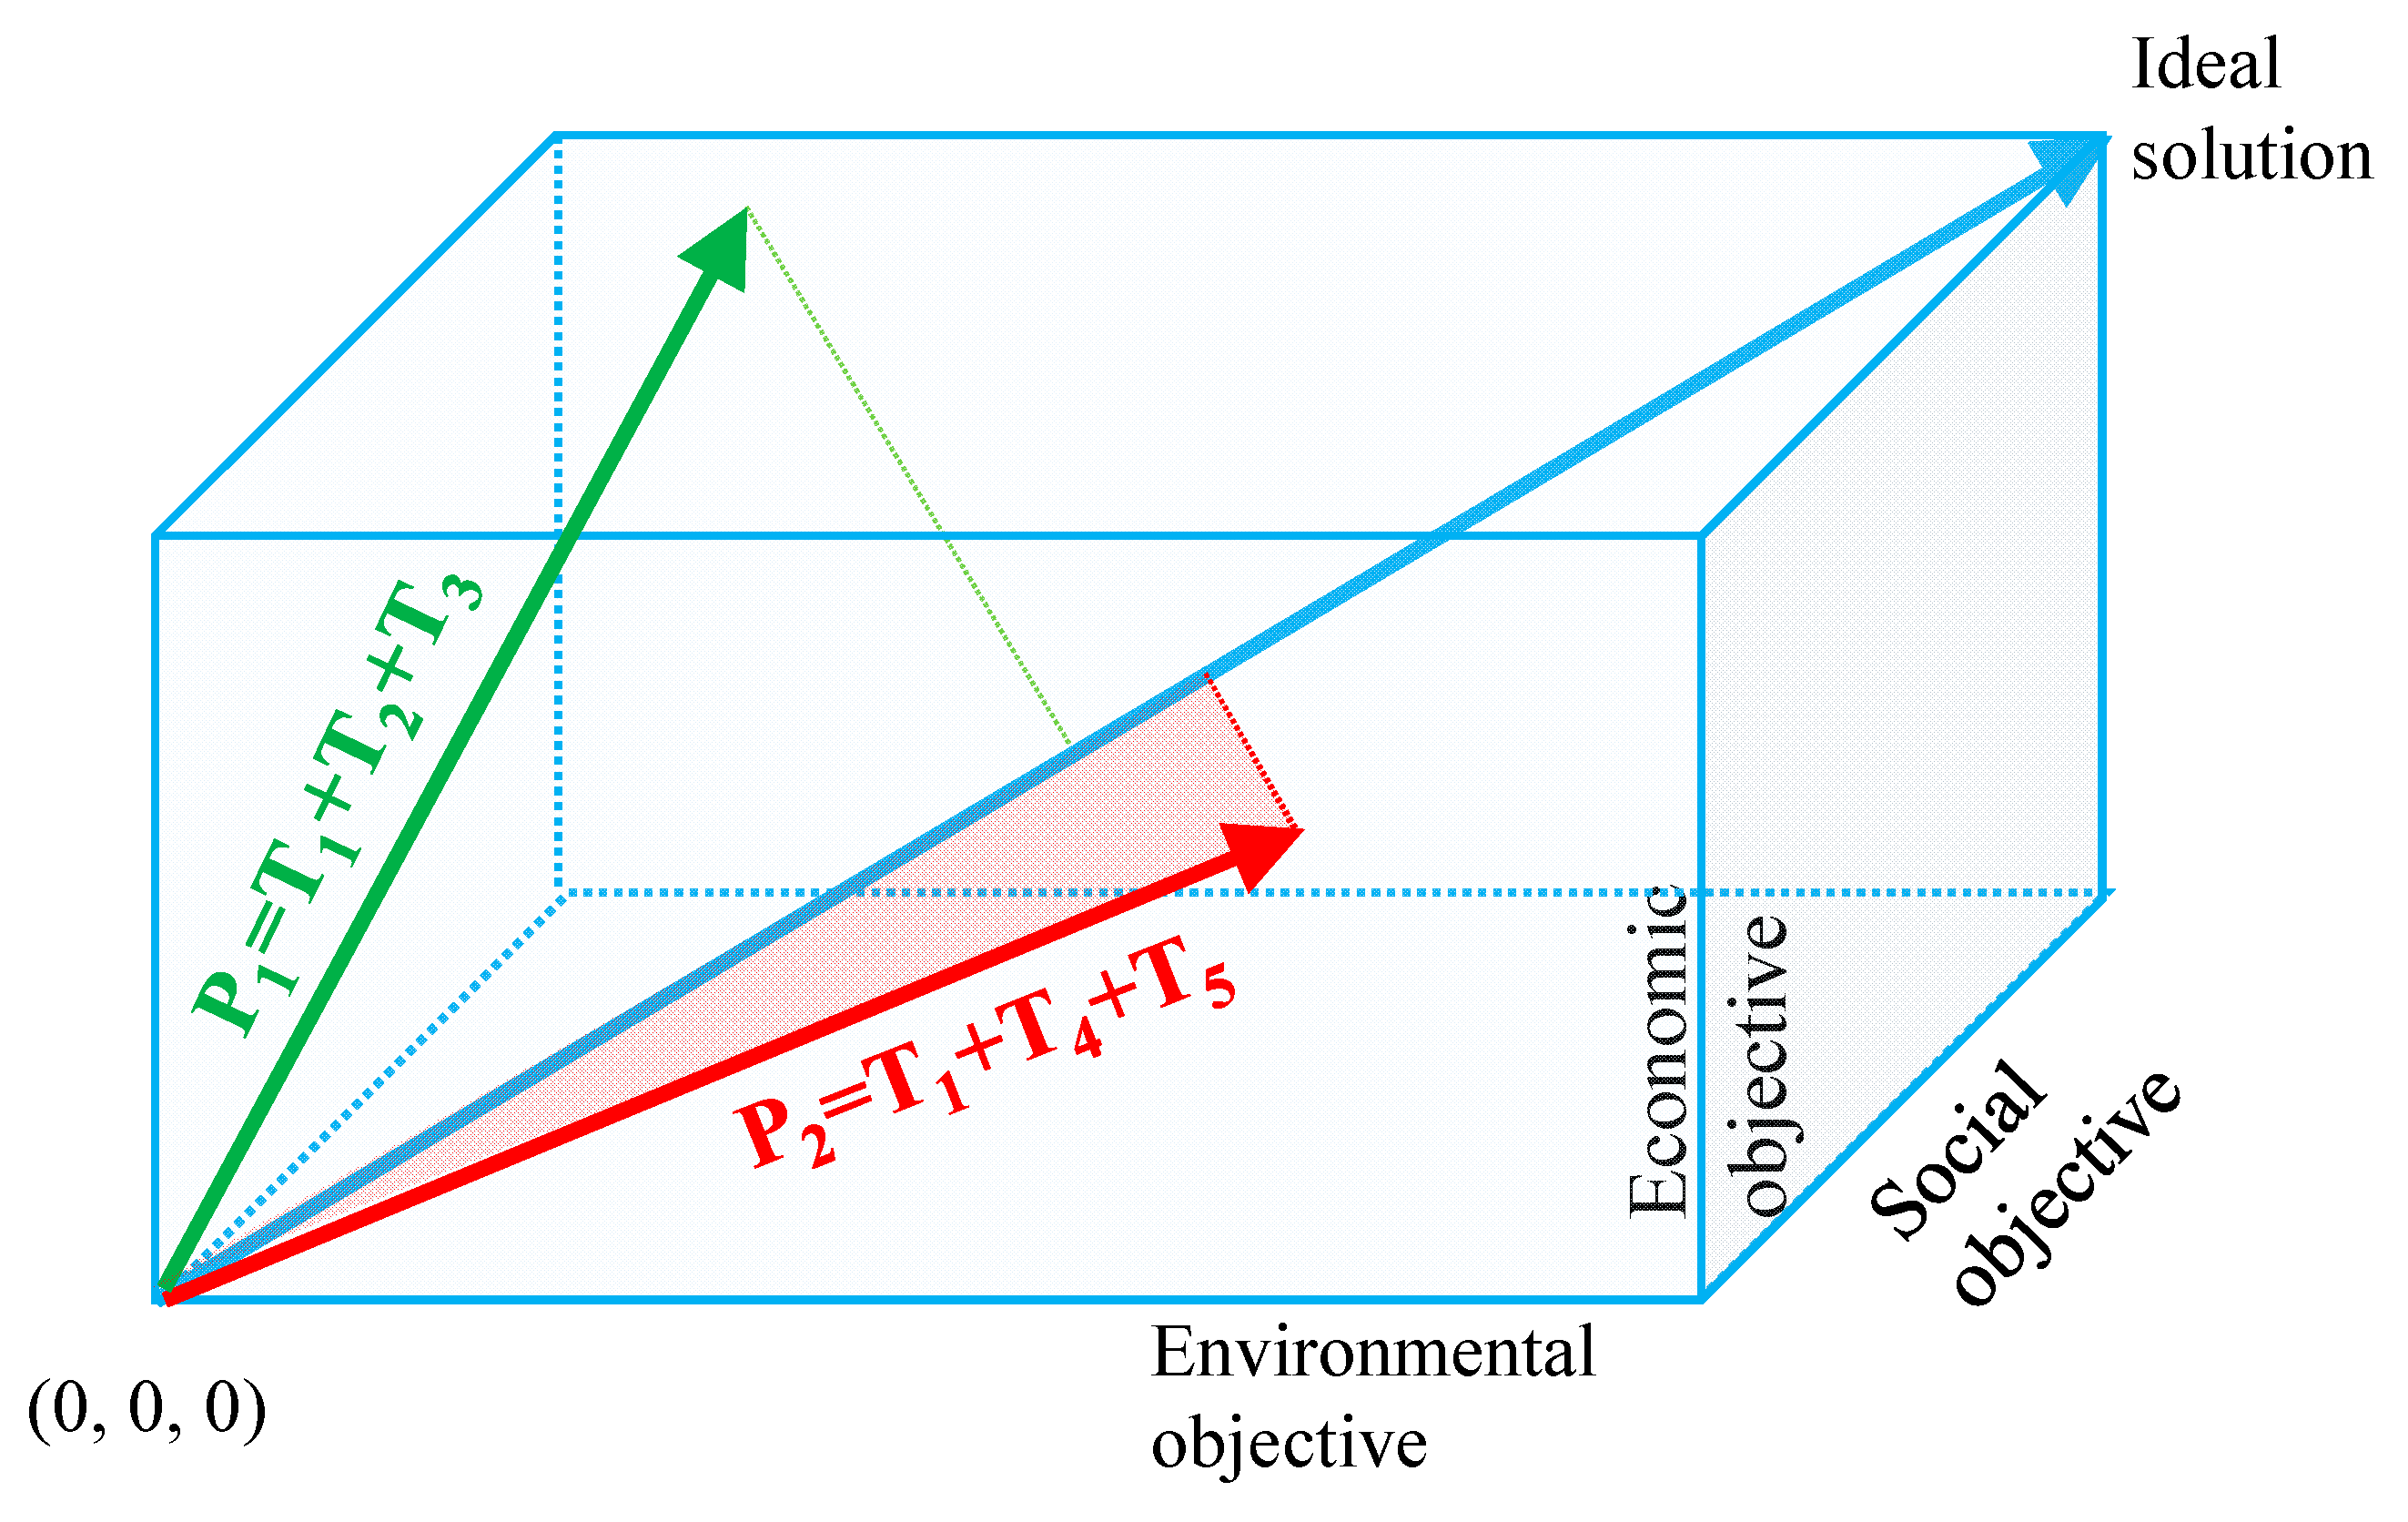
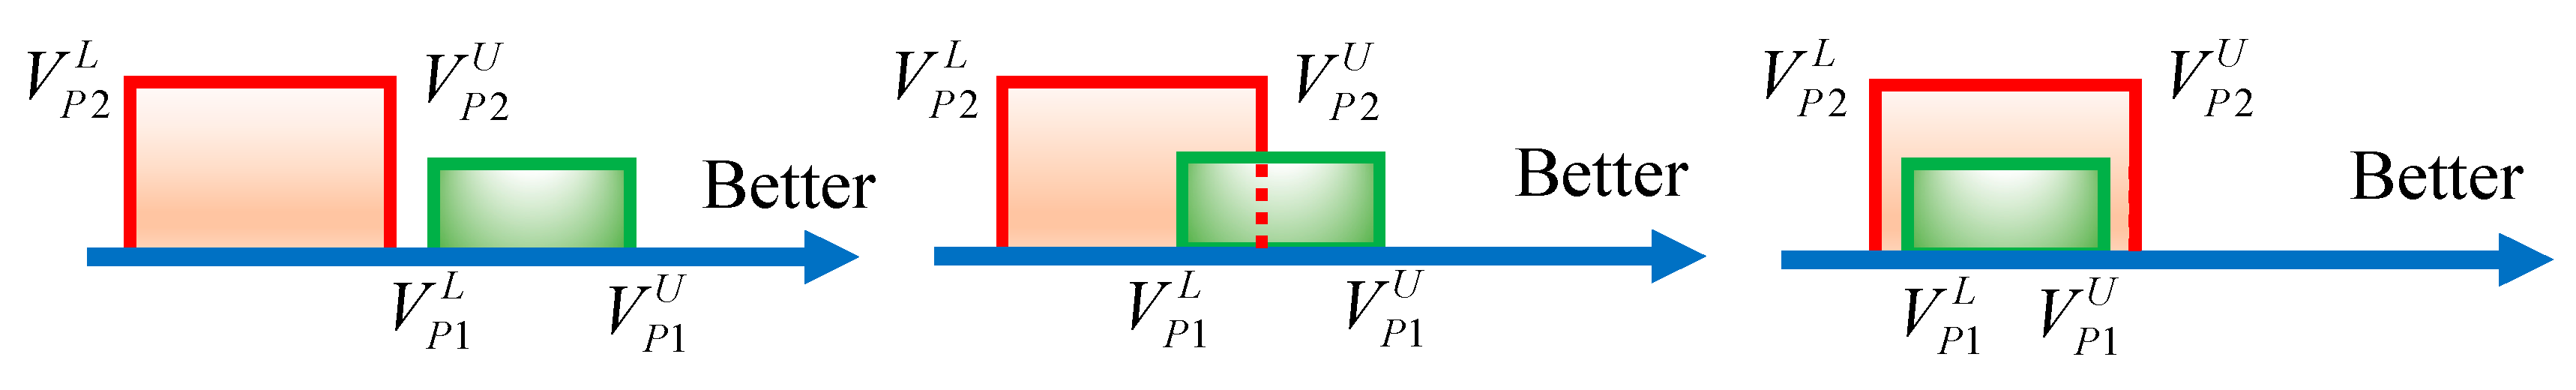
2.3.2. Multi-Objective Aggregation

In the literature, the weighted sum technique (WST) is commonly used for aggregating multiple objectives. This method utilizes mathematical aggregation to formulate a single-goal function using weighted objectives, which are denoted as single-goal = i w i × O i . In this equation, wi represents the weight assigned to the i-th objective, and i w i = 1 . However, traditional aggregation methods rely solely on the maximum weighted sum of multiple objectives to identify the optimal solution, which overlooks the need for relative balance in the developmental levels of different objectives. Consequently, these methods might result in solutions that do not fulfill the requirements of sustainable development, including the imperative for balanced progress across dimensions such as the environment, economy, and society. In the work of Moradi-Aliabadi and Huang [44], a sustainable cube is presented to depict the status of a system before and after implementing retrofitting technologies. As shown in Figure 3, arrows with magnitudes and directions can play a role in the aggregation of multiple objectives. By utilizing vector functions to represent the arrow-based solutions in the MOO problem, this approach effectively addresses balance issues and ensures a comprehensive evaluation of objectives. Inspired by the studies [44,45], the multi-objective aggregation involves the following steps (8–10).
Step 8. Using vector functions to represent the objective improvement. The degrees of improvement in the multiple objectives of the investigated WWTP using the j-th technology can be expressed in Equation (10). In the case involving the selection of several retrofit technologies, the vector function that describes the multi-objective improvement for this technology configuration can be defined by Equation (11).
O T j = w 1 × z ¯ 1 j , w 2 × z ¯ 2 j , , w m × z ¯ m j
C P = j p O T j = j p w 1 z ¯ 1 j T j , j p w 2 z ¯ 2 j T j , , j p w m z ¯ m j T j
In Equation (11), jP indicates that the j-th technology belongs to a specific configuration. As demonstrated in Figure 3, the sustainability of the WWTP is defined by three objectives, with the initial status represented as (0, 0, 0) in a 3D space. By assigning varying weights to these objectives, the lengths of the corresponding pillars differ. Through different technology configurations, a sequence of state transitions is illustrated using vectors. For instance, the configurations P1 = (T1 + T2 + T3) and P2 = (T1 + T4 + T5) are examples of such transitions. The configuration P1 performs admirably when it comes to economic and social objectives, but it requires improvement with regard to the environmental objective. Conversely, the latter configuration, P2, although lacking a standout area in all three objectives, exhibits a more harmonized performance.
Step 9: Utilizing a projection-based algorithm to aggregate the multi-objective. In this step, a novel single-goal approach is provided using the vector projection (VP) method. VP involves projecting a vector onto a reference vector (the ideal solution is given by the blue arrow in Figure 3) to determine the component of the first vector that aligns with the direction of the reference vector. Therefore, the ideal technology configuration for each objective is required to generate the reference vector, as specified in Equation (12). Notably, the ideal configurations regarding different objectives can vary, implying that P1, P2, and P3 (in Equation (12) are not required to be consistent.
C I d e a l = G 1 * , G 2 * , , G m * = j P 1 w 1 × z ¯ 1 j T j I d e a l ,   j P 2 w 2 × z ¯ 2 j T j I d e a l ,   ,   j P 3 w m × z ¯ m j T j I d e a l
Once the reference vector ( C I d e a l ) is obtained, the projection-based algorithm for a potential technology configuration ( C P ) with respect to C I d e a l can be expressed and is denoted as V P = V C P , C I d e a l . In one step forward, by maximizing the function (Max VP) under relevant constraints, the general mathematical model for enhancing the sustainability of the original WWTP can be determined, as described in Equation (13).
Max   V P = C P C I d e a l C I d e a l = j p w 1 z ¯ 1 j T j j P 1 w 1 z ¯ 1 j T j I d e a l + j p w 2 z ¯ 2 j T j j P 2 w 2 z ¯ 2 j T j I d e a l +     + j p w m z ¯ m j T j j P m w m z ¯ m j T j I d e a l j P 1 w 1 z ¯ 1 j T j I d e a l 2 + j P 2 w 2 z ¯ 2 j T j I d e a l 2 +     + j P m w m z ¯ m j T j I d e a l 2 s . t .   T j × 1 T j = 0 ,   j = 1 , 2 , , n i w i = 1 h a ( T j ) = 0 ,   a = 1 , 2 , , e g b ( T j ) 0 ,   b = 1 , 2 , , r

2.3.3. Optimal Configuration Generation

As stated in the introduction, the presence of uncertain data makes the decision-making process quite complex. In Equation (13), the data of w i z i j L T j , w i z i j U T j have both a lower and an upper bound, resulting in the optimization algorithm having a specific searching strategy with the consideration of the interval numbers in VP. Assume there are two promising technology configurations, P1 and P2 (with interval values of V P 1 L , V P 1 U and V P 2 L , V P 2 U , respectively); these would be the optimal solutions for enhancing the WWTP’s sustainability; three scenarios can be given to analyze the relative priority, as shown in Figure 4.
As noted in Figure 4, there is no argument within scenarios a and b that V P 1 L , V P 1 U is larger than V P 2 L , V P 2 U , which generates a conclusion that V P 1 V P 2 with the condition of V P 1 U V P 2 U   and   V P 1 L V P 2 L . However, scenario c offers a dilemma in the comparison of two interval numbers. By resorting to the ideal of Xu and Da [46], the priority between two interval numbers can be mathematically calculated as shown in Equation (14), where Q ( P 1 > P 2 ) 0.5 , implying that V P 1 L , V P 1 U V P 2 L , V P 2 U . Therefore, this study proposes a boundary search and comparison strategy as an effective solution for identifying the optimal configuration, as outlined in step 10.
Q ( P 1 > P 2 ) = max 1 max V P 2 U V P 1 L V P 2 U V P 2 L + V P 1 U V P 1 L , 0 , 0
Step 10. Boundary searching and comparison strategy.
A strategy that focuses on identifying and comparing the largest values concerning the lower/upper bounds of VP can be employed to determine the optimal configuration that offers the highest improvement for WWTPs. Figure 5 provides an illustrative diagram for the boundary searching and comparison strategy, which first uses Equations (15) and (16) to identify the possible configurations (Px and Py) that have the largest values in Max   V P x L (lower bound) and Max   V P y U (upper bound), respectively. If these two values are generated by the same configuration (Px = Py), then the final configuration is determined. Otherwise, Equation (14) should be implemented to determine the preferable configuration between Px and Py. Subsequently, taking the right side in Figure 5 as a reference, suppose Px is better (having the largest value in the upper bound, i.e., V P x L ). In this case, the configuration of Py would no longer be considered. Consequently, Equation (16) needs to be reused to identify the configuration that has the second largest value in V P y ,   y y U . Similarly, if P x = P y , the final answer is obtained; otherwise, the comparison between V P x L ,   V P x U and V P y L ,   V P y U is required. This strategy should continue until the same configuration is associated with both the lower and upper bounds, resulting in the decision output of the retrofit technology configuration.
Max   V P i L = C P i L C I d C I d = j p w 1 z 1 j L T j j P 1 w 1 z 1 j U T j I d e a l + j p w 2 z 2 j L T j j P 2 w 2 z 2 j U T j I d e a l +     + j p w m z m j L T j j P m w m z m j U T j I d e a l j P 1 w 1 z 1 j U T j I d e a l 2 + j P 2 w 2 z 2 j U T j I d e a l 2 +     + j P m w m z m j U T j I d e a l 2 s . t .   T j × 1 T j = 0 ,   j = 1 , 2 , , n i w i = 1 h a ( T j ) = 0 ,   a = 1 , 2 , , e g b ( T j ) 0 ,   b = 1 , 2 , , r
Max   V P j U = C P j U C I d C I d = j p w 1 z 1 j U T j j P 1 w 1 z 1 j U T j I d e a l + j p w 2 z 2 j U T j j P 2 w 2 z 2 j U T j I d e a l +     + j p w m z m j U T j j P m w m z m j U T j I d e a l j P 1 w 1 z 1 j U T j I d e a l 2 + j P 2 w 2 z 2 j U T j I d e a l 2 +     + j P m w m z m j U T j I d e a l 2 s . t .   T j × 1 T j = 0 ,   j = 1 , 2 , , n i w i = 1 h a ( T j ) = 0 ,   a = 1 , 2 , , e g b ( T j ) 0 ,   b = 1 , 2 , , r

3. Case Study and Results

As an illustrative example, a WWTP located in the city of Chongqing, China, serving a population of 236,200 with a treated flow of 50,000 m3/day, is presented. As shown in Figure 6, this plant includes primary clarification, a second activated sludge process (anaerobic/anoxic/aerobic-AAO), and secondary clarification. After undergoing a thickening and dewatering processes, approximately 17.2 DT (dry tons) of sewage sludge with 80% water content is generated. Additionally, Table 2 provides a summary of the influent and effluent water quality for the plant design.

3.1. Basic Definition and Information Collection in the Case Study

3.1.1. Ten Alternative Technologies

Ten retrofit technologies were recommended in the case study to enhance the sustainability of the WWTP, as summarized in Table 3. It is important to note that while some of these alternative technologies focus on improving water quality, others prioritize resources and/or energy saving.

3.1.2. Three Sustainability Objectives

The sustainability of the investigated WWTP is defined by three objectives, as outlined in the literature [57,58,59]. These objectives include discharged pollution reduction (O1, environmental impact), operational cost reduction (O2, economic concern), and GHG emissions reduction (O3, social responsibility).
Notably, this study focuses on developing a generic decision support framework for selecting retrofit technologies. The case study provides only general information about the selected technologies and objectives. Thus, when applying the framework in real cases, users have the freedom to choose technology candidates and define objectives based on their preferences and the actual conditions of the WWTP being investigated.

3.1.3. Information Collection and Treatment in the Case Study

O1 focuses on representing water quality by considering three critical pollutants: BOD5, total nitrogen (TN), and total phosphorus (TP). With reference to Dong et al. [57], the pollution reduction benefit is depicted using Equation (17), where a1 = a2 = a3 = 1/3. In the case study, BODbase, TNbase, and TPbase represent the corresponding effluent concentrations of the existing WWTP, as indicated in Table 2 (the 3rd column). Δ B O D T j , Δ T N T j , and Δ T P T j , on the other hand, denote the reduced effluent concentrations achieved after implementing the j-th technology. The corresponding data are summarized in Supplementary Materials.
O 1 j = a 1 R T j B O D + a 2 R T j T N + a 3 R T j T P = a 1 × Δ B O D T j B O D b a s e + a 2 × Δ T N T j T N b a s e + a 3 × Δ T P T j T P b a s e
According to Rodriguez-Garcia et al. [58], O2 focuses on reducing operational costs as an economic goal. This objective can be further subdivided into various items such as energy, materials, staff, and others, as illustrated in Equation (18). For the investigated WWTP, the original operational cost is 1.35 CNY/m3. As for the other parameters in Equation (18), taking O R T j e n e r g y as an example, it represents the cost savings in energy achieved by implementing the retrofit technology, Tj. The collected data for ORTj-energy, ORTj-material, ORTj-staff, and ORTj-other are also provided in Supplementary Materials.
O 2 = O R T j e n e r g y + O R T j m a t e r i a l + O R T j s t a f f + O R T j o t h e r Original   operational   cost
According to the literature [59], the GHG emissions in wastewater treatment include direct biological emissions from the process itself and indirect emissions from electricity and chemical consumption within the defined system boundary. As retrofit technologies have limited impact on direct emissions, only the indirect emissions are taken into account. Therefore, O3, which represents indirect GHG emissions, can be calculated using Equation (19). For more detailed information on this objective, please refer to Pang et al. [59]. In the case study, the original GHG emissions for the WWTP is 0.502 kg CO2-eq/m3, while the collected data regarding C R T j electricity and C R T j chemical s can be found in Supplementary Materials.
O 3 = C R T j electricity + C R T j chemical s Original   GHG   emissions
After eliminating the effect of the dimensionality in the original information (see Supplementary Materials), the normalized data z ¯ i j = [ z i j L ,   z i j U ] are summarized in Table 4.

3.2. Model Formulation and Solver Optimization in the Case Study

In order to construct the mathematical model, constraints need to be provided. This case study examines four common constraints that are involved in improving WWTPs: the sustainability improvement requirement, budget limit, configuration restrictions, and construction time. (1) The sustainability improvement requirement is determined by the decision makers, who establish a minimum level of development for each categorized objective based on factors such as the current status and enhancement expectations of the WWTP. (2) The budget limit imposes an inequality constraint, ensuring that the total cost of implementing a specific technology configuration remains below a specified threshold. (3) Configuration restrictions arise from conflicting and restrictive relationships among candidate technologies, necessitating the adoption of certain technologies together while precluding the simultaneous implementation of others. (4) Construction time serves as another inequality constraint during WWTP retrofitting, with the aim of minimizing process downtime and limiting the duration of the construction period. It is worth noting that while increasing labor or allocating more resources could potentially reduce construction time, this study ignores such situations as they would lead to increased overall costs.
As a demonstration, Equations (20)–(23) represent the constraints involved in the case study. Equation (20) sets the minimum required improvement level for each objective, i.e., it cannot be negative. Equation (21) states that the budget limit must not exceed CNY 10 million (M¥). Equation (22) restricts the construction duration for implementing the retrofit technologies to a maximum of 100 days. As summarized in Table 4 (the last two columns), the budget and construction costs associated with each alternative technology are provided. Finally, Equation (23) addresses the configuration restrictions. Specifically, it prohibits the simultaneous use of T5 and T6 due to their focus on improving the AAO process. Additionally, conflicts arise between the sludge drying options, namely T8 and T9.
j p w i z i j L T j 0 ,   i = 1 , 2 , 3 ;   j = 1 , 2 , , 10
j p B L j T j 10 ,   j = 1 , 2 , , 10
j p C D j T j 100 ,   j = 1 , 2 , , 10
T 5 × T 6 = 0 ,   T 8 × T 9 = 0

3.2.1. Weight Assignment in the Case Study

The interval versions of the SWARA II and CRTIC methods are applied to assign the subjective and objective weights to three objectives, respectively. Specifically, in the interval SWARA II, step 1 determines the significance order as O2 > O3 > O1, based on the stakeholders’ preferences and the actual conditions of the investigated WWTP. Based on the ranks, the relative importance of each objective over the next one is defined as r1 = [6, 7] and r2 = [8, 9]. This implies that the relative importance of O2 over O3 ranges from medium high (6) to high (7), while the importance of O3 over O1 is an interval number of [8, 9]. In step 2, equations k 1 = 1 + r 1 10 2 × k 2 , and k 2 = 1 + r 2 10 2 × k 3 are established. Using the minimize or maximize functions in step 3, the interval weight of each objective can be calculated. Taking the weight of sw1 as an example (Equation (24)), the value of s w 1 L is obtained by running the minimize function, while the value of s w 1 U is determined by implementing the maximize function. In this study, Lingo 11 is used to solve the equations for minimizing or maximizing each objective’s weight, and the results are presented in Table 5.
min s w 1 L s . t . r 1 [ 6 , 7 ] ,   r 2 [ 8 , 9 ] ; k 1 = 1 + r 1 10 2 × k 2 ,   k 2 = 1 + r 2 10 2 × k 3 ,   k 3 = 1 ; s w 1 L = k 1 k 1 + k 2 + k 3 ,   s w 2 = k 2 k 1 + k 2 + k 3 ,   s w 3 = k 3 k 1 + k 2 + k 3   ; s w 1 L s w 2 s w 3 0   |   max s w 1 U   s . t . r 1 [ 6 , 7 ] ,   r 2 [ 8 , 9 ] ; k 1 = 1 + r 1 10 2 × k 2 ,   k 2 = 1 + r 2 10 2 × k 3 ,   k 3 = 1 ; s w 1 L = k 1 k 1 + k 2 + k 3 ,   s w 2 = k 2 k 1 + k 2 + k 3 , s w 3 = k 3 k 1 + k 2 + k 3   ; s w 1 U s w 2 s w 3 0
The interval CRITIC method is employed to determine the objective weights. Firstly, the original collected data are normalized using Equation (4) in step 4 (refer to Supplementary Materials for the normalized data). Next, the standard deviation (Equation (5)) and correlation (Equation (6)) of each objective are calculated, as stated in step 5. Then, by running step 6, the amount of information associated with each objective is computed using Equation (7). These values are subsequently normalized to derive the weighting results based on Equation (8). The information obtained from the interval CRITIC method is summarized in Table 6.
The optimal programming in step 7 is used to aggregate the information generated by the interval SWARA II and the interval CRITIC, as demonstrated in Equation (25). By resorting to the software Lingo 11.0, the combined weight can be determined as w1 = 0.235, w2 = 0.445, and w3 = 0.320.
M i n i m i z e   D = w 1 0.182 2 + w 1 0.205 2 2 + w 1 0.311 2 + w 1 0.546 2 2   + w 2 0.458 2 + w 2 0.490 2 2 + w 2 0.257 2 + w 2 0.307 2 2   + w 3 0.323 2 + w 3 0.343 2 2 + w 3 0.274 2 + w 3 0.303 2 2 s . t . w 1 + w 2 + w 3 = 1 ;   0.182 w 1 0.546 ;   0.257 w 2 0.490 ;   0.274 w 2 0.343

3.2.2. Multi-Objective Aggregation in the Case Study

Based on the determined weights (wi) and the transformed data ( z ¯ i j = [ z i j L ,   z i j U ] ), step 8 is employed to take the objective improvement by implementing different retrofit technologies as vector functions. According to the processed data and the identified constraints, the ideal technology configuration for each objective should be generated, as stated in step 9. Taking maximize G 1 * as an example, the model is coded in Equation (26).
max G 1 * = j P 1 w 1 z 1 j U T j I d e a l s . t .   G 1 * = 0.235 × 3.30 % T 1 + 13.30 % T 2 + 13.30 % T 3 + 20.00 % T 4 + 20.00 % T 5 + 16 . 70 % T 6 + 0.00 % T 7 + 0.00 % T 8 + 0.00 % T 9 + 0.00 % T 10 ; T j ( 1 T j ) = 0 ,   j = 1 , 2 , , 10 ; T 5 × T 6 = 0 ,   T 8 × T 9 = 0 ; j B L j T j 10 ,   j = 1 , 2 , , 10 ; j C D j T j 100 , j = 1 , 2 , , 10
In Equation (26), T j ( 1 T j ) = 0 ,   j = 1 , 2 , , 10 implies that one or zero can be assigned to the j-th technology for judging whether it is adopted. By running Equation (26), the obtained result of max G 1 * = 0.235 × 69.90 % was contributed by the technologies combination of ( T 1 + T 2 + T 3 + T 4 + T 5 ) with the total cost of CNY 7.4 million and the construction time of 90 days. Similarly, the maximum potential improvements regarding the other two objectives and their corresponding configurations can be obtained as summarized in Table 7. From Table 7, it is observed that achieving optimization for individual objectives relies on different combinations of technologies. When the target weights are not taken into account, the combination of technologies (T1~T5) maximizes the objective of reducing discharged pollution by 69.9%. Likewise, the combination of technologies T1, T7, and T8 optimizes the goal of reducing operational costs, while the configuration involving technologies T1, T2, T3, T7, and T10 maximizes the aim of reducing GHG emissions. These findings indirectly underscore that enhancing the sustainability of WWTPs necessitates seeking compromises between different objectives, as there is no universal solution that can simultaneously achieve optimal performance across various dimensions.

3.2.3. Optimal Configuration Generation in the Case Study

The values of G 1 * , G 2 * , and G 3 * are subsequently used in the projection-based algorithm, which is categorized into both lower and upper bounds for the optimal configurations (see step 10), as given in Equations (27) and (28), respectively.
Max   V P L = C P L C I d e a l C I d e a l = G 1 * j p w 1 z 1 j L T j + G 2 * j p w 2 z 2 j L T j + G 3 * j p w 3 z 3 j L T j G 1 * 2 + G 2 * 2 + G 3 * 2 s . t .   T j ( 1 T j ) = 0 ,   j = 1 , 2 , , 10 ; j p w 1 z 1 j L T j 0 ,   j p w 2 z 2 j L T j 0 ,   j p w 3 z 3 j L T j 0 ; T 5 × T 6 = 0 ,   T 8 × T 9 = 0 ; j p B L j T j 10 ; j p C D j T j 100
Max   V P U = C P U C I d e a l C I d e a l = G 1 * j p w 1 z 1 j U T j + G 2 * j p w 2 z 2 j U T j + G 3 * j p w 3 z 3 j U T j G 1 * 2 + G 2 * 2 + G 3 * 2 s . t .   T j ( 1 T j ) = 0 ,   j = 1 , 2 , , 10 ; j p w 1 z 1 j L T j 0 ,   j p w 2 z 2 j L T j 0 ,   j p w 3 z 3 j L T j 0 ; T 5 × T 6 = 0 ,   T 8 × T 9 = 0 ; j p B L j T j 10 ; j p C D j T j 100
Lingo 11.0 is used for generating the solution, i.e., the lower bound of V P L 1 L = 0.4667 is contributed by the portfolio of ( P L 1 L = T1 + T2 + T3 + T8 + T10), with the cost of CNY 8.3 million and the construction time of 70 days, while the upper bound of V P U 1 U = 0.7020 is yielded by the combination of ( P U 1 U = T1 + T2 + T3 + T4 + T8 + T10), with the cost of CNY 8.6 million and the construction time of 85 days. Considering the contradiction between the possible solutions in the lower and upper values, the corresponding interval numbers should be generated for both of them, that is P L 1 L , P L 1 U = [0.4667, 0.6833], and P U 1 L , P U 1 U = [0.4381, 0.7020]. The two interval numbers are compared as: max 1 max 0.7020     0.4667 0.6833     0.4667   +   0.7020     0.4381 , 0 , 0 = 51.02 % , implying they are quite similar to each other, while the configuration (T1 + T2 + T3 + T8 + T10) performs slightly better. Hence, this configuration is used for further investigation, where the maximizing function in Equation (27) should be reused to find the second highest value in the upper bound, and the result of 0.6833 comes with the configuration of (T1 + T2 + T3 + T8 + T10). As the same configuration in both the lower and the upper bounds has been identified, the final result is generated; that is, the technologies (T1 + T2 + T3 + T8 + T10) are chosen to improve the sustainability of the WWTP.

4. Discussion

In this section, discussions regarding the weighting result and the configuration identification are provided to test the feasibility of the proposed methodologies.

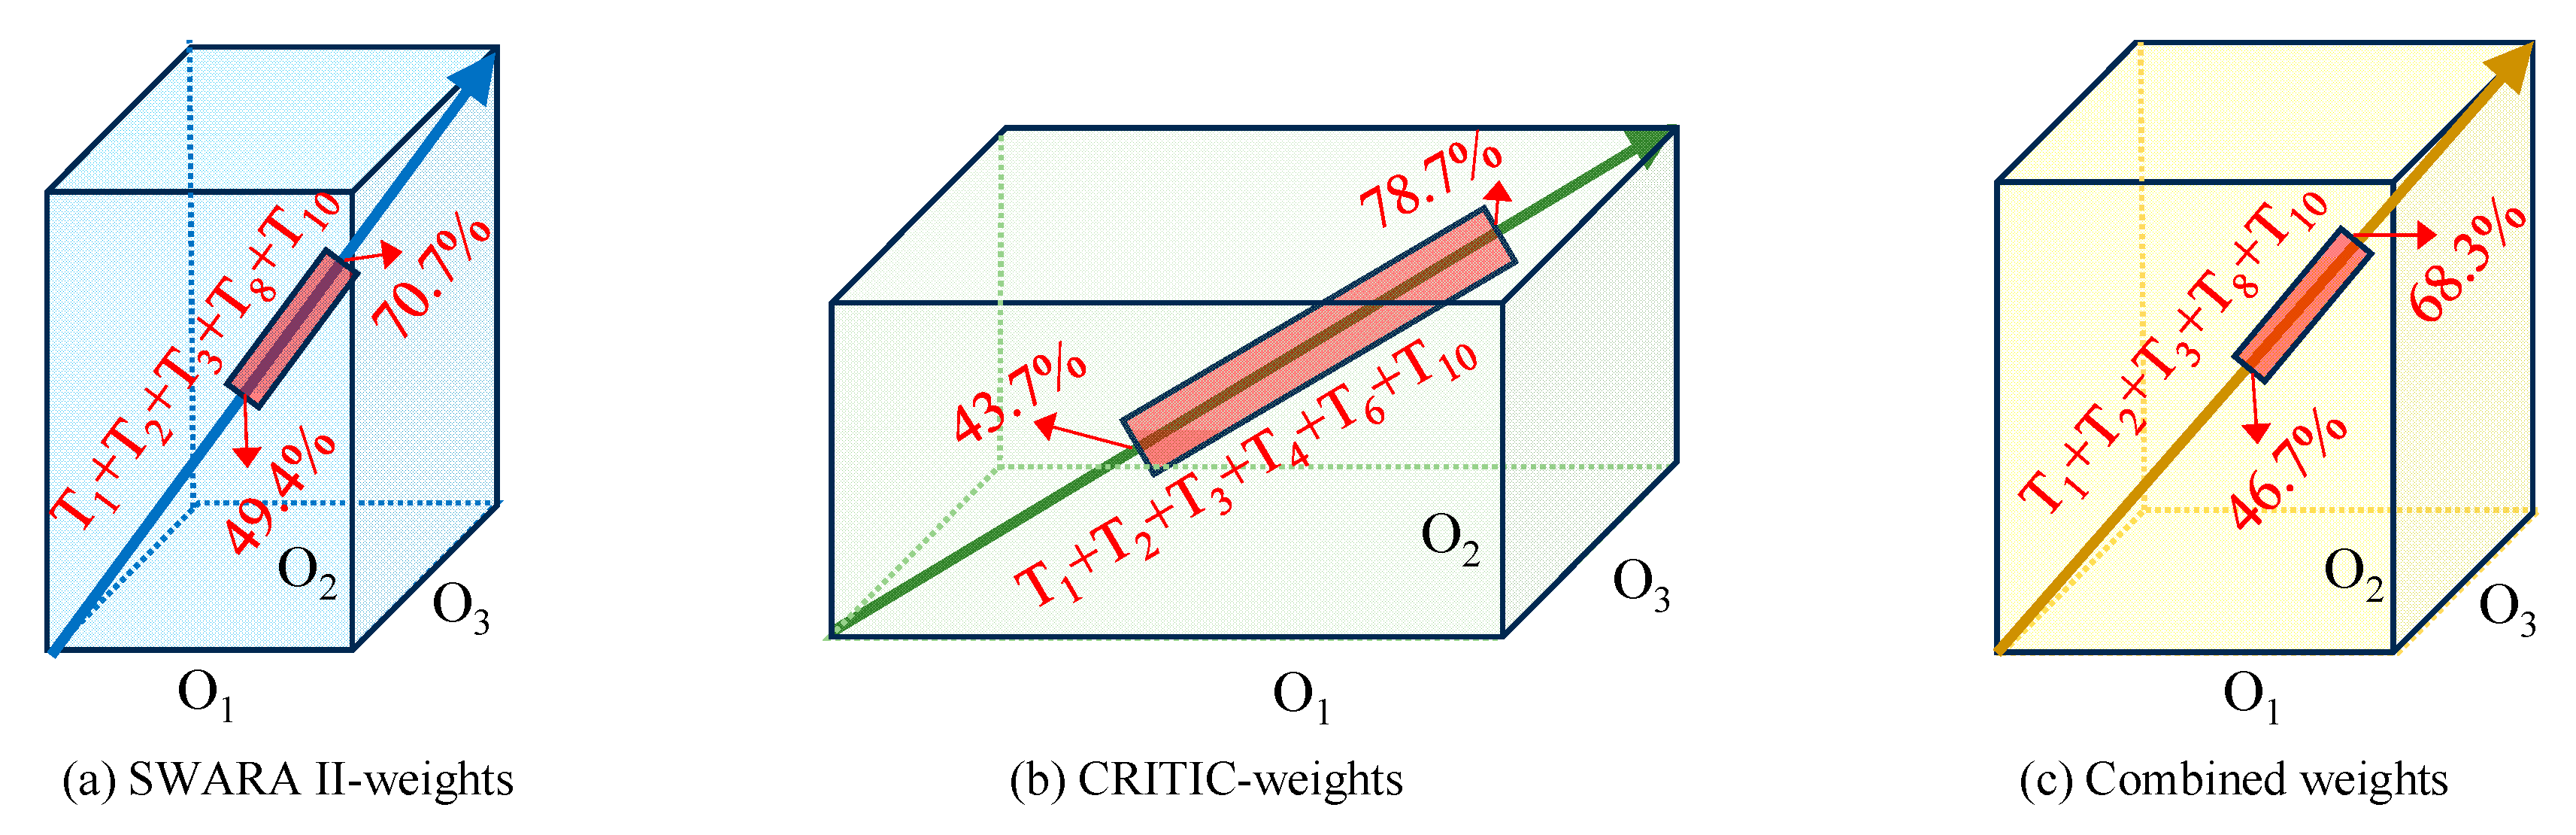
4.1. Effect of the Weighting Result

The comparison of different weights highlights the importance of considering the combined weights for the objectives. Specifically, by employing constrained optimization programming (refer to Equation (29)), the results obtained from the interval SWARA II method are converted into precise subjective weights. Similarly, the values calculated by the interval CRITIC method are transformed into deterministic objective weights.
Minimize   D = i w i h w i L 2 + w i h w i U 2 2 s . t .   i w = 1 ; h w i L w i h w i U
In Equation (28), h w i L , h w i U could be either the interval SWARA II weight or the interval CRITIC weight, and w i is the corresponding weighting result. The summary of the three sets of weighting results is presented in Figure 7, which demonstrates the noticeable discrepancies between the weightings obtained from the interval SWARA II and the interval CRITIC methods. Specifically, the interval SWARA II method assigns the least significance to the first objective, whereas the interval CRITIC method assigns the highest weight to O1. However, by combining these results, the weight of O1 is adjusted to a rational value of w1 = 0.235. This adjustment suggests that reducing discharged pollution might not be the primary objective, as the existing wastewater treatment plant already meets the required standards for pollutant removal to an acceptable extent.
Moving forward, the decision output for the optimal technology configuration is generated by utilizing the SWARA II weight and the CRITIC weight. The results, as illustrated in Figure 8, demonstrate that different configurations are recommended based on the assigned significance of the three objectives (represented by different 3D cubes with varying side lengths). This highlights the crucial role of incorporating a rational weighting method in the decision process for the weighted MOO problem.

4.2. Weighted MOO Techniques Comparison

The comparison of the different weighted MOO methods highlights the importance of incorporating relative balance among the multiple objectives in decision making for optimal configuration. In this study, the widely used and straightforward weighted sum technique (WST) is employed to aggregate the multiple objectives into a single goal using the function max w i z i j T j [42]. After implementing the boundary searching and comparison strategy for the WST, the optimal configuration is determined as (T1 + T2 + T3 + T4 + T8 + T10). The WST-derived optimal configuration is also discussed as the second-best alternative solution in the case study, indirectly confirming the feasibility of the projection-based weighted MOO technique. However, the WST-derived configuration only considers the maximum sum of weighted objectives from an absolute standpoint, disregarding the relative balance of each objective’s development. This misalignment with the concept of sustainable development in WWTPs, which emphasizes balanced progress between environmental performance, economic benefits, and social responsibility, is noteworthy. Therefore, it is reasonable to consider the configuration recommended by the projection-based weighted MOO as superior, particularly in the context of sustainability.

5. Conclusions

Strategically planning for sustainable development in a wastewater treatment plant is an immensely intricate undertaking. It involves continuous efforts across various aspects, necessitating the application of sustainability principles based on the triple bottom line at the enhancement stage. The challenge becomes even more daunting when aiming to achieve a harmonious balance between economic viability, environmental preservation, and social well-being within the context of wastewater treatment.
This paper employs a weighted multi-objective optimization framework to determine the optimal technology configuration for enhancing the sustainability of WWTPs. The framework comprises two main phases: (1) the basic definition and information collection and (2) the model formulation and solver optimization. The former phase should be customized to the specific conditions of the investigated WWTP, while the latter phase, as described below, serves as a versatile and effective tool for addressing the weighted MOO problem in enhancing WWTP sustainability. To formulate the model, a combined weighting method that integrates the interval SWARA II and interval CRITIC methods is introduced. This method allows the assigned weights to aggregate the multiple objectives into a singular goal, employing sustainability improvement as a vector-based sustainability state transition process. Subsequently, the sustainability status of the WWTP (before and after implementing retrofit technologies) is represented as vector functions. A projection-based optimal algorithm is then utilized to identify the best technology configuration by considering the degrees of improvement and the development balance.
In conclusion, this study serves as a pioneering work that addresses sustainability enhancement issues for WWTP through technology selection. It offers two mathematical contributions to the existing weighted MOO studies. Firstly, by integrating the interval versions of SWARA II and CRITIC, this approach provides a well-rounded assessment of the multi-objective weights. It helps mitigate the biases and limitations in the subjective and objective weighting methods by combining expert opinions and numerical features of the investigated WWTP. This enables a rational determination of the significance of each objective, resulting in a more accurate evaluation. Secondly, by leveraging the projection-based optimization algorithm, this approach allows a comprehensive exploration of sustainability enhancement issues through space partitioning and characterization. It facilitates the identification of a technology configuration that achieves a satisfactory performance in absolute development and relative balance among the multiple objectives. As a result, the decision output within the sustainability context becomes more reliable. Moreover, the entire weighted MOO framework can be effectively applied in uncertain conditions by incorporating interval numbers, which effectively address cognitive uncertainty in subjective opinions and data fluctuations in objective statistics. The above analysis also provides theoretical implications for stakeholders in WWTPs, as follows: To provide a clearer understanding of the trade-offs among multiple objectives, it is advisable to consider both the subjective preferences of decision makers and the objective properties of the WWTP when generating a comprehensive weighting result. To better aggregate the multiple objectives into a final Pareto point, the use of a projection-based technique is recommended. This technique takes into account both the degrees of improvement and the balance among the objectives. To more effectively address uncertain information and fluctuating data within the decision-making process, incorporating interval numbers into the framework is suggested. This approach offers a straightforward and generic method for preserving and managing uncertainties.
The decision support framework presented in this study is both systematic and easy to apply. The case study conducted on enhancing the sustainability of a WWTP, along with the subsequent discussions of the results, has demonstrated its effectiveness. However, further research is required for the application of this framework in complex and high-dimensional optimization problems, as specified below: (1) The case study overlooks the interaction between technologies, despite its widespread use in research focused on sustainable improvement based on technological selection. In reality, there may exist more intricate internal relationships among the retrofit alternatives involved in the WWTP upgrades. (2) The case study could benefit from improved data quality by integrating modeling software like Biowin and sustainability analysis tools to enhance decision-making information. Furthermore, in-depth and detailed simulation studies of the case plant can be specifically conducted to explore its post-retrofitting performance, which would serve as a valuable reference for other WWTPs with similar AAO processes. (3) In this case study, several representative sustainability objectives and constraints were considered; these can be expanded as needed in future research. Similarly, the number of retrofit alternatives can also be increased. (4) Group decision making could be integrated into this framework by, for example, employing a group-based interval SWARA II method to obtain a more comprehensive set of subjective weights, using techniques like consensus building and non-negotiable aggregation. Overall, this study lays a solid foundation for future advancements in the field of sustainability enhancement for WWTPs through technology selection.

Supplementary Materials

The following supporting information can be downloaded at: https://www.mdpi.com/article/10.3390/pr11113156/s1, Table S1: Original data of O1 (discharged pollution reduction) with respect to taking each alternative retrofit technology; Table S2: Original data of O2 (operational cost reduction) with respect to taking each alternative retrofit technology; Table S3: Original data of O3 (GHG emissions reduction) with respect to taking each alternative retrofit technology; Table S4: Normalized data in the interval CRITIC in the case study.

Author Contributions

H.L. contributed to the study conception; H.L., D.X. and L.D. contributed to the methodology design; data collection was performed by H.L. and F.P.; formal analysis and investigation were conducted by all the authors; the first draft of the manuscript was written by H.L.; funding acquisition, D.X.; supervision, L.D. All authors have read and agreed to the published version of the manuscript.

Funding

This study was supported by the Natural Science Foundation of Chongqing, China, Grant No. CSTB2023NSCQ-MSX0826 and the Science and Technology Research Program of Chongqing Municipal Education Commission, China, Grant No. KJQN202101512.

Data Availability Statement

All data generated or analyzed during this study are included in this published article (and its Supplementary Materials files).

Conflicts of Interest

The authors have no relevant financial, non-financial interest, or intellectual property to disclose.

References

  1. Kadam, R.; Khanthong, K.; Park, B.; Jun, H.; Park, J. Realizable wastewater treatment process for carbon neutrality and energy sustainability: A review. J. Environ. Manag. 2023, 328, 116927. [Google Scholar] [CrossRef] [PubMed]
  2. Kretschmer, F.; Hrdy, B.; Neugebauer, G.; Stoeglehner, G. Wastewater Treatment Plants as Local Thermal Power Stations-Modifying Internal Heat Supply for Covering External Heat Demand. Processes 2021, 9, 1981. [Google Scholar] [CrossRef]
  3. Kwon, S.; Zhang, C.L.; Oh, J.; Park, K. Sustainability assessment of retrofitting alternatives for large and old wastewater treatment plants in Seoul. Water Sci. Technol. 2023, 87, 969–986. [Google Scholar] [CrossRef] [PubMed]
  4. Wei, Z.; He, Y.; Wang, X.; Chen, Z.Y.; Wei, X.; Lin, Y.Y.; Cao, C.J.; Huang, M.S.; Zheng, B.H. A comprehensive assessment of upgrading technologies of wastewater treatment plants in Taihu Lake Basin. Environ. Res. 2022, 212, 113398. [Google Scholar] [CrossRef]
  5. Shao, S.; Mu, H.L.; Keller, A.A.; Yang, Y.; Hou, H.C.; Yang, F.L.; Zhang, Y. Environmental tradeoffs in municipal wastewater treatment plant upgrade: A life cycle perspective. Environ. Sci. Pollut. Res. 2021, 28, 34913–34923. [Google Scholar] [CrossRef]
  6. Mayor, A.; Vinardell, S.; Ganesan, K.; Bacardí, C.; Cortina, J.L.; Valderrama, C. Life-cycle assessment and techno-economic evaluation of the value chain in nutrient recovery from wastewater treatment plants for agricultural application. Sci. Total Environ. 2023, 892, 164452. [Google Scholar] [CrossRef]
  7. Juznic-Zonta, Z.; Guisasola, A.; Baeza, J.A. Smart-Plant Decision Support System (SP-DSS): Defining a multi-criteria decision-making framework for the selection of WWTP configurations with resource recovery. J. Clean. Prod. 2022, 367, 132873. [Google Scholar] [CrossRef]
  8. Zhang, Y.Z.; Zhang, C.; Qiu, Y.; Li, B.; Pang, H.T.; Xue, Y.; Liu, Y.C.; Yuan, Z.G.; Huang, X. Wastewater treatment technology selection under various influent conditions and effluent standards based on life cycle assessment. Resour. Conserv. Recycl. 2019, 154, 104562. [Google Scholar] [CrossRef]
  9. Elawwad, A.; Matta, M.; Abo-Zaid, M.; Abdel-Halim, H. Plant-wide modeling and optimization of a large-scale WWTP using BioWin’s ASDM model. J. Water Process. Eng. 2019, 31, 100819. [Google Scholar] [CrossRef]
  10. Mohan, T.R.; Chanakya, H.N.; Kumar, M.S.M.; Rao, L. Achieving biological nutrient removal in an old sewage treatment plant through process modifications—A simulation and experimental study. J. Water Process. Eng. 2021, 45, 102461. [Google Scholar] [CrossRef]
  11. Baena-Moreno, F.M.; Malico, I.; Marques, I.P. Promoting Sustainability: Wastewater Treatment Plants as a Source of Biomethane in Regions Far from a High-Pressure Grid. A Real Portuguese Case Study. Sustainability 2021, 13, 8933. [Google Scholar] [CrossRef]
  12. Muñoz, I.; Portillo, F.; Rosiek, S.; Battles, F.J.; Martínez-Del-Río, J.; Acasuso, I.; Piergrossi, V.; De Sanctis, M.; Chimienti, S.; Di Iaconi, C. Prospective environmental and economic assessment of solar-assisted thermal energy recovery from wastewater through a sequencing batch biofilter granular reactor. J. Clean. Prod. 2019, 212, 1300–1309. [Google Scholar] [CrossRef]
  13. Hao, X.D.; Wang, X.Y.; Liu, R.B.; Li, S.; van Loosdrecht, M.C.M.; Jiang, H. Environmental impacts of resource recovery from wastewater treatment plants. Water Res. 2019, 160, 268–277. [Google Scholar] [CrossRef] [PubMed]
  14. Okan, B.; Erguder, T.H.; Aksoy, A. Plant-wide modeling of a metropolitan wastewater treatment plant to reduce energy consumption and carbon footprint. Environ. Sci. Pollut. Res. 2022, 30, 16068–16080. [Google Scholar] [CrossRef]
  15. Caligan, C.J.A.; Garcia, M.M.S.; Mitra, J.L.; San Juan, J.L.G. Multi-objective optimization for a wastewater treatment plant and sludge-to-energy network. J. Clean. Prod. 2022, 368, 133047. [Google Scholar] [CrossRef]
  16. Llácer-Iglesias, R.M.; López-Jiménez, P.A.; Pérez-Sánchez, M. Exploring options for energy recovery from wastewater: Evaluation of hydropower potential in a sustainability framework. Sustain. Cities Soc. 2023, 95, 104576. [Google Scholar] [CrossRef]
  17. Ullah, A.; Hussain, S.; Wasim, A.; Jahanzaib, M. Development of a decision support system for the selection of wastewater treatment technologies. Sci. Total Environ. 2020, 731, 139158. [Google Scholar] [CrossRef]
  18. Arroyo, P.; Molinos-Senante, M. Selecting appropriate wastewater treatment technologies using a choosing-by-advantages approach. Sci. Total Environ. 2018, 625, 819–827. [Google Scholar] [CrossRef]
  19. Attri, S.D.; Singh, S.; Dhar, A.; Powar, S. Multi-attribute sustainability assessment of wastewater treatment technologies using combined fuzzy multi-criteria decision-making techniques. J. Clean. Prod. 2022, 357, 131849. [Google Scholar] [CrossRef]
  20. Narayanamoorthy, S.; Brainy, J.V.; Sulaiman, R.; Ferrara, M.; Ahmadian, A.; Kang, D. An integrated decision making approach for selecting a sustainable waste water treatment technology. Chemosphere 2022, 301, 134568. [Google Scholar] [CrossRef]
  21. Priyanka; Kumar, S.; Kalia, S. MULTIMOORA-based MCDM model for sustainable ranking of wastewater treatment technologies under picture fuzzy environment. Expert. Syst. 2023, ahead of print. [Google Scholar] [CrossRef]
  22. Ordu, M.; Der, O. Polymeric Materials Selection for Flexible Pulsating Heat Pipe Manufacturing Using a Comparative Hybrid MCDM Approach. Polymers 2023, 15, 2933. [Google Scholar] [CrossRef] [PubMed]
  23. Qureshi, M.R.N.; Singh, R.K.; Hasan, M.A. Decision support model to select crop pattern for sustainable agricultural practices using fuzzy MCDM. Environ. Dev. Sustain. 2018, 20, 641–659. [Google Scholar] [CrossRef]
  24. Fernández-Arévalo, T.; Lizarralde, I.; Fdz-Polanco, F.; Pérez-Elvira, S.I.; Garrido, J.M.; Puig, S.; Poch, M.; Grau, P.; Ayesa, E. Quantitative assessment of energy and resource recovery in wastewater treatment plants based on plant-wide simulations. Water Res. 2017, 118, 272–288. [Google Scholar] [CrossRef]
  25. Sucu, S.; van Schaik, M.O.; Esmeli, R.; Ouelhadj, D.; Holloway, T.; Williams, J.B.; Cruddas, P.; Martinson, D.B.; Chen, W.S.; Cappon, H.J. A conceptual framework for a multi-criteria decision support tool to select technologies for resource recovery from urban wastewater. J. Environ. Manag. 2021, 300, 113608. [Google Scholar] [CrossRef] [PubMed]
  26. Deepak, M.; Rustum, R. Review of Latest Advances in Nature-Inspired Algorithms for Optimization of Activated Sludge Processes. Processes 2022, 11, 77. [Google Scholar] [CrossRef]
  27. Xu, D.; Li, W.C.; Shen, W.F.; Dong, L.C. Decision-Making for Sustainability Enhancement of Chemical Systems under Uncertainties: Combining the Vector-Based Multiattribute Decision-Making Method with Weighted Multiobjective Optimization Technique. Ind. Eng. Chem. Res. 2019, 58, 12066–12079. [Google Scholar] [CrossRef]
  28. Wheeler, J.; Páez, M.A.; Guillén-Gosálbez, G.; Mele, F.D. Combining multi-attribute decision-making methods with multi-objective optimization in the design of biomass supply chains. Comput. Chem. Eng. 2018, 113, 11–31. [Google Scholar] [CrossRef]
  29. Leong, Y.T.; Lee, J.Y.; Tan, R.R.; Foo, J.J.; Chew, I.M.L. Multi-objective optimization for resource network synthesis in eco-industrial parks using an integrated analytic hierarchy process. J. Clean. Prod. 2017, 143, 1268–1283. [Google Scholar] [CrossRef]
  30. Manzardo, A.; Ren, J.Z.; Piantella, A.; Mazzi, A.; Fedele, A.; Scipioni, A. Integration of water footprint accounting and costs for optimal chemical pulp supply mix in paper industry. J. Clean. Prod. 2014, 72, 167–173. [Google Scholar] [CrossRef]
  31. Han, X.; Zhao, L.; Ye, Z.C. Multiobjective Economic-Environmental-Selectivity Optimization of the Dry Gas Based Ethylbenzene Production Process. Ind. Eng. Chem. Res. 2021, 60, 15679–15689. [Google Scholar] [CrossRef]
  32. Cossio, C.; Norrman, J.; McConville, J.; Mercado, A.; Rauch, S. Indicators for sustainability assessment of small-scale wastewater treatment plants in low and lower-middle income countries. Environ. Sustain. Ind. 2020, 6, 100028. [Google Scholar] [CrossRef]
  33. Gherghel, A.; Teodosiu, C.; Notarnicola, M.; De Gisi, S. Sustainable design of large wastewater treatment plants considering multi-criteria decision analysis and stakeholders’ involvement. J. Environ. Manag. 2020, 261, 110158. [Google Scholar] [CrossRef] [PubMed]
  34. Chen, L.A.; Hou, H.X.; Fei, W.B.; Zhao, E.Y. Comparative Research to Surface Aeration and Blasting Aeration System Based on LCC Theory. Iop C Ser. Earth Env. 2017, 63, 012029. [Google Scholar] [CrossRef]
  35. Shahabadi, M.B.; Yerushalmi, L.; Haghighat, F. Estimation of greenhouse gas generation in wastewater treatment plants—Model development and application. Chemosphere 2010, 78, 1085–1092. [Google Scholar] [CrossRef]
  36. Kesireddy, A.; Carrillo, L.R.G.; Baca, J. Multi-Criteria Decision Making—Pareto Front Optimization Strategy for Solving Multi-Objective Problems. In Proceedings of the 2020 IEEE 16th International Conference on Control & Automation (ICCA), Singapore, 9–11 October 2020; pp. 53–58. [Google Scholar]
  37. Huang, Q.J. Selecting sustainable renewable energy-powered desalination: An MCDM framework under uncertain and incomplete information. Clean Technol. Environ. Policy 2022, 24, 1581–1598. [Google Scholar] [CrossRef]
  38. Wheeler, J.; Caballero, J.A.; Ruiz-Femenia, R.; Guillén-Gosálbez, G.; Mele, F.D. MINLP-based Analytic Hierarchy Process to simplify multi-objective problems: Application to the design of biofuels supply chains using on field surveys. Comput. Chem. Eng. 2017, 102, 64–80. [Google Scholar] [CrossRef]
  39. Keshavarz-Ghorabaee, M. Assessment of distribution center locations using a multi-expert subjective-objective decision-making approach. Sci. Rep. 2021, 11, 19461. [Google Scholar] [CrossRef]
  40. Yu, Y.; Wu, S.B.; Yu, J.X.; Xu, Y.; Song, L.; Xu, W.P. A hybrid multi-criteria decision-making framework for offshore wind turbine selection: A case study in China. Appl. Energ. 2022, 328, 120173. [Google Scholar] [CrossRef]
  41. Wang, Z.Y.; Parhi, S.S.; Rangaiah, G.P.; Jana, A.K. Analysis of Weighting and Selection Methods for Pareto-Optimal Solutions of Multiobjective Optimization in Chemical Engineering Applications. Ind. Eng. Chem. Res. 2020, 59, 14850–14867. [Google Scholar] [CrossRef]
  42. Diakoulaki, D.; Mavrotas, G.; Papayannakis, L. Determining Objective Weights in Multiple Criteria Problems—The Critic Method. Comput. Oper. Res. 1995, 22, 763–770. [Google Scholar] [CrossRef]
  43. Xu, D.; Li, W.C.; Ren, X.S.; Shen, W.F.; Dong, L.C. Technology selection for sustainable hydrogen production: A multi-criteria assessment framework under uncertainties based on the combined weights and interval best-worst projection method. Int. J. Hydrog. Energy 2020, 45, 34396–34411. [Google Scholar] [CrossRef]
  44. Moradi-Aliabadi, M.; Huang, Y.L. Vector-Based Sustainability Analytics: A Methodological Study on System Transition toward Sustainability. Ind. Eng. Chem. Res. 2016, 55, 3239–3252. [Google Scholar] [CrossRef]
  45. Moradi-Aliabadi, M.; Huang, Y.L. Decision Support for Enhancement of Manufacturing Sustainability: A Hierarchical Control Approach. ACS Sustain. Chem. Eng. 2018, 6, 4809–4820. [Google Scholar] [CrossRef]
  46. Xu, Z.S.; Da, Q.L. The uncertain OWA operator. Int. J. Intell. Syst. 2002, 17, 569–575. [Google Scholar] [CrossRef]
  47. Tang, X.W.; Fu, J.L.; Ren, Y.Y. Application of precise aeration system on improving removal rate of TN in AAO + MBR process. Water Purif. Technol. 2020, 39, 133–137. (In Chinese) [Google Scholar]
  48. Hou, Y.L. Optimal Operation and Automatic Control of the Chemical Phosphorus Removal in Municipal WWTP. Master’s Thesis, Tsinghua University, Beijing, China, 2012. (In Chinese). [Google Scholar]
  49. Zhou, X. Online Monitoring and Control of Sludge Concentration in Sewage Treatment System. Master’s Thesis, North China Electric Power University, Beijing, China, 2012. (In Chinese). [Google Scholar]
  50. Li, H.; Dong, L.C.; Lv, L.P. Enhanced Biological Nitrogen Removal Performance of Low Carbon to Nitrogen Ratio Wastewater. China Water Wastewater 2022, 38, 80–85. (In Chinese) [Google Scholar]
  51. Wang, C.; Liu, Y.; Lv, W.Z.; Xia, S.Q.; Han, J.C.; Wang, Z.Y.; Yu, X.X.; Cai, L.H. Enhancement of nitrogen removal by supplementing fluidized-carriers into the aerobic tank in a full-scale A/O system. Sci. Total Environ. 2019, 660, 817–825. [Google Scholar] [CrossRef]
  52. Yang, P.; Zhou, J.Z.; Guan, Y.J.; Yang, X.M.; Liu, S.; Liu, Y.L.; Wu, D. Comparison of AAO and Bardenpho Processes Transformation Effect Based on MBBR. China Water Wastewater 2021, 37, 11–19. (In Chinese) [Google Scholar]
  53. Wang, W.; Lee, D.J. Valorization of anaerobic digestion digestate: A prospect review. Bioresour. Technol. 2021, 323, 124626. [Google Scholar] [CrossRef]
  54. Ali, I.; Abdelkader, L.; El Houssayne, B.; Mohamed, K.; El Khadir, L. Solar convective drying in thin layers and modeling of municipal waste at three temperatures. Appl. Therm. Eng. 2016, 108, 41–47. [Google Scholar] [CrossRef]
  55. Zhang, T.; Yan, Z.W.; Wang, L.Y.; Zheng, W.J.; Wu, Q.; Meng, Q.L. Theoretical analysis and experimental study on a low-temperature heat pump sludge drying system. Energy 2021, 214, 118985. [Google Scholar] [CrossRef]
  56. Llacer-Iglesias, R.M.; Lopez-Jimenez, P.A.; Perez-Sanchez, M. Hydropower Technology for Sustainable Energy Generation in Wastewater Systems: Learning from the Experience. Water 2021, 13, 3259. [Google Scholar] [CrossRef]
  57. Dong, H.J.; Zhang, L.; Geng, Y.; Li, P.; Yu, C.H. New insights from grey water footprint assessment: An industrial park level. J. Clean. Prod. 2021, 285, 124915. [Google Scholar] [CrossRef]
  58. Rodriguez-Garcia, G.; Molinos-Senante, M.; Hospido, A.; Hernández-Sancho, F.; Moreira, M.T.; Feijoo, G. Environmental and economic profile of six typologies of wastewater treatment plants. Water Res. 2011, 45, 5997–6010. [Google Scholar] [CrossRef]
  59. Pang, C.X.; Luo, X.; Rong, B.; Nie, X.B.A.; Jin, Z.Y.; Xia, X. Carbon Emission Accounting and the Carbon Neutralization Model for a Typical Wastewater Treatment Plant in China. Int. J. Environ. Res. Public Health 2023, 20, 140. [Google Scholar] [CrossRef]
Figure 1. Overview of the decision support framework.
Processes 11 03156 g001
Figure 2. Diagram for collecting information on retrofit technologies’ impact on sustainability objectives.
Processes 11 03156 g002
Figure 3. An illustrative diagram depicting vector-based sustainability improvement.
Processes 11 03156 g003
Figure 4. Comparison scenarios regarding two interval numbers.
Processes 11 03156 g004
Figure 5. Diagram for the boundary searching and comparison strategy.
Processes 11 03156 g005
Figure 6. Scheme of the investigated WWTP.
Processes 11 03156 g006
Figure 7. Comparison of the weighting results.
Processes 11 03156 g007
Figure 8. Decision output regarding the optimal configurations using different weighting results.
Processes 11 03156 g008
Table 1. Linguistic terms and corresponding preference values [40].
Linguistic VariablesPreference Values
Extreme low (EL)1
Very low (VL)2
Low (L)3
Medium low (ML)4
Medium (M)5
Medium high (MH)6
High (H)7
Very high (VH)8
Extreme high (EH)9
Table 2. Design for influent and effluent water quality in wastewater treatment (major pollutants).
PollutantInfluent Concentration (mg/L)Effluent Concentration (mg/L)Removal Rate (%)
BOD5220≤10≥95.45
COD400≤50≥87.50
SS280≤10≥96.43
NH3-N34≤8≥76.47
TN50≤15≥70
TP5≤1≥80
Table 3. Optional retrofit technologies in the case study.
TechnologyBrief Introduction
T1: Advanced
aeration system (AAS) [47]
This is an effective wastewater aeration system with small air bubbles that improve biological degradation. The fine bubbles from APAS, having a larger surface area, enhance oxygen transfer. It allows accurate air flow control according to tank needs, ensuring optimal oxygen levels. This results in higher TN removal rates and lower energy usage.
T2: Precision dosing system (PDS) [48]This refers to the precise delivery of treatment chemicals to the wastewater treatment process by controlling the design and operational parameters of the dosing system. By utilizing feed-forward control systems, PDS employs online analyzers in the inlet stream to provide real-time data to a dosing control system. This enables automatic adjustments of the dosing amount and timing to achieve optimal wastewater treatment results.
T3: Advanced automatic sludge control system (ASC) [49]This utilizes advanced automation control systems to effectively monitor and regulate the sludge removal system in real-time. By incorporating parameters such as sludge flow, quality, and moisture content, the sludge removal equipment can be automatically adjusted, ensuring precise sludge discharge and treatment. Moreover, through sludge analysis and data management, the design and operation of the sludge removal system can be optimized, leading to enhanced sludge treatment efficiency and sustainability.
T4: External carbon source (ECS) [50]ECS can enhance the treatment efficiency of the wastewater treatment process, especially in situations where the incoming wastewater has low organic matter concentrations or when nitrogen and phosphorus removal is necessary. This retrofitting technique involves careful control of the type and quantity of external carbon source added to prevent the overgrowth of microorganisms and the consequent production of excess sludge.
T5: Fluidized carriers supplementary (FCS) [51]This system with fluidized carriers supplemented into the aerobic tank in the existing AAO system could improve nitrogen removal ability, primarily because of the higher relative abundance of nitrifying bacteria and denitrifying bacterial genera attached onto the biofilm formed on the carrier.
T6: Moving bed biofilm reactor (MBBR) [52]Integrating an MBBR reactor into the existing wastewater treatment system can enhance treatment efficiency and improve water quality. MBBR offers several advantages, including high biomass concentrations, the ability to achieve high SRTs with relatively low HRTs, good resilience to shocks from organic loading, minimal sludge bulking issues, and low risks of carrier media clogging.
T7: Anaerobic digestion of sludge (AD) [53]AD stabilizes sludge by converting volatile solids into biogas in the absence of air, requiring additional processing to recover and utilize the methane content of the biogas. AD offers advantages such as energy production, reduced sludge volume and disposal costs, and environmental benefits through reduced greenhouse gas emissions. It is a cost-effective and sustainable method for sludge management with resource utilization and minimal environmental impact.
T8: Solar convective drying (SCD) [54]Sludge dewatering and drying are crucial processes in WWTPs for effective sludge management. While sludge treatment can be expensive, drying the sludge reduces its mass and volume, benefiting the environment, economy, and society. This innovative retrofit technology utilizes solar convective drying to replace conventional dewatering machines, resulting in significant energy savings and reduced volume of treated sludge.
T9: Heat pump drying (HPD) [55]This is another energy-saving technology for drying sludge. This process involves a heat pump absorbing sensible and latent heat from the medium-temperature, high-humidity air leaving the drying chamber. As the air releases moisture, it is reheated and transferred to the sludge, causing internal moisture to migrate to the surface, evaporate into the drying medium, and effectively separate from the sludge, accomplishing the drying objective.
T10: Hydropower utilization (HPU) [56]The case study presents an excellent opportunity for installing a mini hydropower system due to the significant 35 m drop in water discharge. Consequently, harnessing the energy generated by flowing water can power the investigated WWTP, reducing the dependence on external sources of electricity.
Table 4. The normalized data regarding each objective after implementing each technology.
z i j L , z i j U O1O2O3Budget Limit
(BL, 106 CNY)
Construction Duration (CD, Day)
T1[1.7%, 3.3%][2.2%, 4.3%][6.8%, 13.7%]1.220
T2[6.7%, 13.3%][0.5%, 0.6%][3.6%, 3.6%]0.510
T3[5.0%, 13.3%][2.0%, 3.4%][3.6%, 3.8%]1.015
T4[10.0%, 20.0%][−6.1%, −5.6%][−1.8%, −1.8%]0.315
T5[10.0%, 20.0%][−1.7%, −0.4%][−12.3%, −8.2%]4.430
T6[13.3%, 16.7%][−0.4%, 0.2%][−4.1%, −2.1%]2.830
T7[0.0%, 0.0%][13.2%, 14.3%][10.4%, 13.9%]5.220
T8[0.0%, 0.0%][21.1%, 28.5%][0.0%, 0.0%]3.615
T9[0.0%, 0.0%][15.1%, 15.1%][−9.7%, −9.7%]2.420
T10[0.0%, 0.0%][2.6%, 2.6%][10.4%, 10.4%]2.010
Table 5. Information and weighting result of the interval SWARA II in the case study.
ObjectiveOrderPreferenceSubjective Weight
O21[6, 7][0.458, 0.490]
O32[8, 9][0.323, 0.343]
O13-[0.182, 0.205]
Table 6. Parameters and weighting result of the interval CRITIC in the case study.
σ i L ,   σ i U f i L , f i U o w i L , o w i U
O1[0.241, 0.416][0.768, 1.347][0.311, 0.546]
O2[0.236, 0.277][0.623, 0.755][0.257, 0.307]
O3[0.283, 0.303][0.674, 0.747][0.274, 0.303]
Table 7. Weight improvements and the corresponding technologies configurations.
ObjectiveImprovement Degree ConfigurationCostConstruction Time
G 1 * 0.235 × 69.90 % T1 + T2 + T3 + T4 + T57.490
G 2 * 0.445 × 47.1 % T1 + T7 + T810.055
G 3 * 0.320 × 45.4 % T1 + T2 + T3 + T7 + T109.975
Disclaimer/Publisher’s Note: The statements, opinions and data contained in all publications are solely those of the individual author(s) and contributor(s) and not of MDPI and/or the editor(s). MDPI and/or the editor(s) disclaim responsibility for any injury to people or property resulting from any ideas, methods, instructions or products referred to in the content.

