
Melting Behavior and Densities of K2B2OF6 Melts Containing KReO4

 ,
,
Abstract
:
1. Introduction
2. Experimental Procedures
2.1. Molten Salt Preparation
2.2. Measuring Procedures
3. Results and Discussion
4. Conclusions
Author Contributions
Funding
Data Availability Statement
Acknowledgments
Conflicts of Interest
References
- Shen, L.; Tesfaye, F.; Li, X.; Lindberg, D.; Taskinen, P. Review of Rhenium Extraction and Recycling Technologies from Primary and Secondary Resources. Miner. Eng. 2021, 161, 106719. [Google Scholar] [CrossRef]
- Huang, Y.; Bai, S.; Zhang, H.; Ye, Y. Sealing of Cracks in the Rhenium Coating on C/C Composites by Alloying with Cobalt. Surf. Coat. Technol. 2015, 261, 404–410. [Google Scholar] [CrossRef]
- John, D.A. Rhenium: A Rare Metal Critical in Modern Transportation; US Geological Survey: Reston, VT, USA, 2015. [Google Scholar]
- Arroyave, M.; Ruiz, C.; Echeverri, P.; Jaoul, C.; Grisales, M.; Bejarano, G. Microstructure, Chemical Composition and Mechanical Properties of Rhenium Nitride Hard Coating Deposited by Reactive Magnetron Sputtering. Int. J. Refract. Met. Hard Mater. 2023, 110, 106026. [Google Scholar] [CrossRef]
- Vikanova, K.V.; Kustov, A.L.; Makhov, E.A.; Tkachenko, O.P.; Kapustin, G.I.; Kalmykov, K.B.; Mishin, I.V.; Nissenbaum, V.D.; Dunaev, S.F.; Kustov, L.M. Rhenium-Contained Catalysts Based on Superacid ZrO2 Supports for CO2 Utilization. Fuel 2023, 351, 128956. [Google Scholar] [CrossRef]
- Yi, A.; Jiang, H. Rhenium-Molybdenum Separation in an Alkaline Leaching Solution of a Waste Superalloy by N263 Extraction. Arab. J. Chem. 2023, 16, 104516. [Google Scholar] [CrossRef]
- Lin, Y.; Chen, Y.; Tong, Z.; Hu, Z.; Gao, Z. Effect of Rhenium on Corrosion Behavior of Electrodeposited Co-Cu Alloy Coating at Room Temperature and High Temperature. Mater. Today Commun. 2023, 35, 105579. [Google Scholar] [CrossRef]
- King, A.H.; Eggert, R.G.; Gschneidner, K.A. The Rare Earths as Critical Materials. In Handbook on the Physics and Chemistry of Rare Earths; Elsevier: Amsterdam, The Netherlands, 2016; pp. 19–46. [Google Scholar]
- Cutter, G.A. Metalloids And Oxyanions. In Encyclopedia of Ocean Sciences; Elsevier: Amsterdam, The Netherlands, 2001; pp. 1737–1745. [Google Scholar]
- Chauvel, C. Long-Lived Radionuclides. In Encyclopedia of Geology; Elsevier: Amsterdam, The Netherlands, 2021; pp. 125–133. [Google Scholar]
- Crompton, T.R. Metals in Surface, Ground, and Mineral Waters. In Determination of Metals in Natural Waters, Sediments and Soils; Elsevier: Amsterdam, The Netherlands, 2015; pp. 161–178. [Google Scholar]
- Werner, T.T.; Mudd, G.M.; Jowitt, S.M.; Huston, D. Rhenium Mineral Resources: A Global Assessment. Resour. Policy 2023, 82, 103441. [Google Scholar] [CrossRef]
- Zhou, W.; Li, A.; Gale, P.A.; He, Q. A Highly Selective Superphane for ReO4− Recognition and Extraction. Cell Rep. Phys. Sci. 2022, 3, 100875. [Google Scholar] [CrossRef]
- Henckens, M.L.C.M.; Driessen, P.P.J.; Worrell, E. Metal Scarcity and Sustainability, Analyzing the Necessity to Reduce the Extraction of Scarce Metals. Resour. Conserv. Recycl. 2014, 93, 1–8. [Google Scholar] [CrossRef]
- Ober, J.A. Mineral Commodity Summaries; US Geological Survey: Reston, VT, USA, 2018. [Google Scholar]
- Anderson, C.D.; Taylor, P.R.; Anderson, C.G. Extractive Metallurgy of Rhenium: A Review. Min. Metall. Explor. 2013, 30, 59–73. [Google Scholar] [CrossRef]
- Janz, G.J.; Tomkins, R.P.T. Molten Salts: Vol. 5, Part 1, Additional Single and Multi-Component Salt Systems. Electrical Conductance, Density, Viscosity, and Surface Tension Data. J. Phys. Chem. Ref. Data 1980, 9, 831–1022. [Google Scholar] [CrossRef]
- Rapp, B. Molten Salts. Mater. Today 2005, 8, 6. [Google Scholar] [CrossRef]
- Norikawa, Y.; Nohira, T. A New Concept of Molten Salt Systems for the Electrodeposition of Si, Ti, and W. Acc. Chem. Res. 2023, 56, 1698–1709. [Google Scholar] [CrossRef]
- Ji, D.; Zhang, F.; Qiao, Z.; Zhang, J.; Wu, H.; Wang, G. Electrochemical Synthesis and Structural Characteristics of New Carbon-Based Materials Generated in Molten Salts. Appl. Sci. 2022, 12, 9923. [Google Scholar] [CrossRef]
- Chernyshev, A.A.; Apisarov, A.P.; Isakov, A.V.; Zaikov, Y.P.; Malkov, V.B.; Laptev, M.V. Rhenium Electrowinning in the KF-KBF4-B2O3-KReO4 Melt. J. Electrochem. Soc. 2018, 165, D427–D431. [Google Scholar] [CrossRef]
- Arkhipov, S.P.; Apisarov, A.P.; Grishenkova, O.V.; Isakov, A.V.; Chernyshev, A.A.; Zaikov, Y.P. Electrochemical Nucleation and Growth of Rhenium on Glassy Carbon in the KF-KBF4-B2O3-KReO4 Melt. J. Electrochem. Soc. 2019, 166, D935–D939. [Google Scholar] [CrossRef]
- Kataev, A.; Tkacheva, O.; Zakiryanova, I.; Apisarov, A.; Dedyukhin, A.; Zaikov, Y. Interaction of B2O3 with Molten KF-AlF3 and KF-NaF-AlF3. J. Mol. Liq. 2017, 231, 149–153. [Google Scholar] [CrossRef]
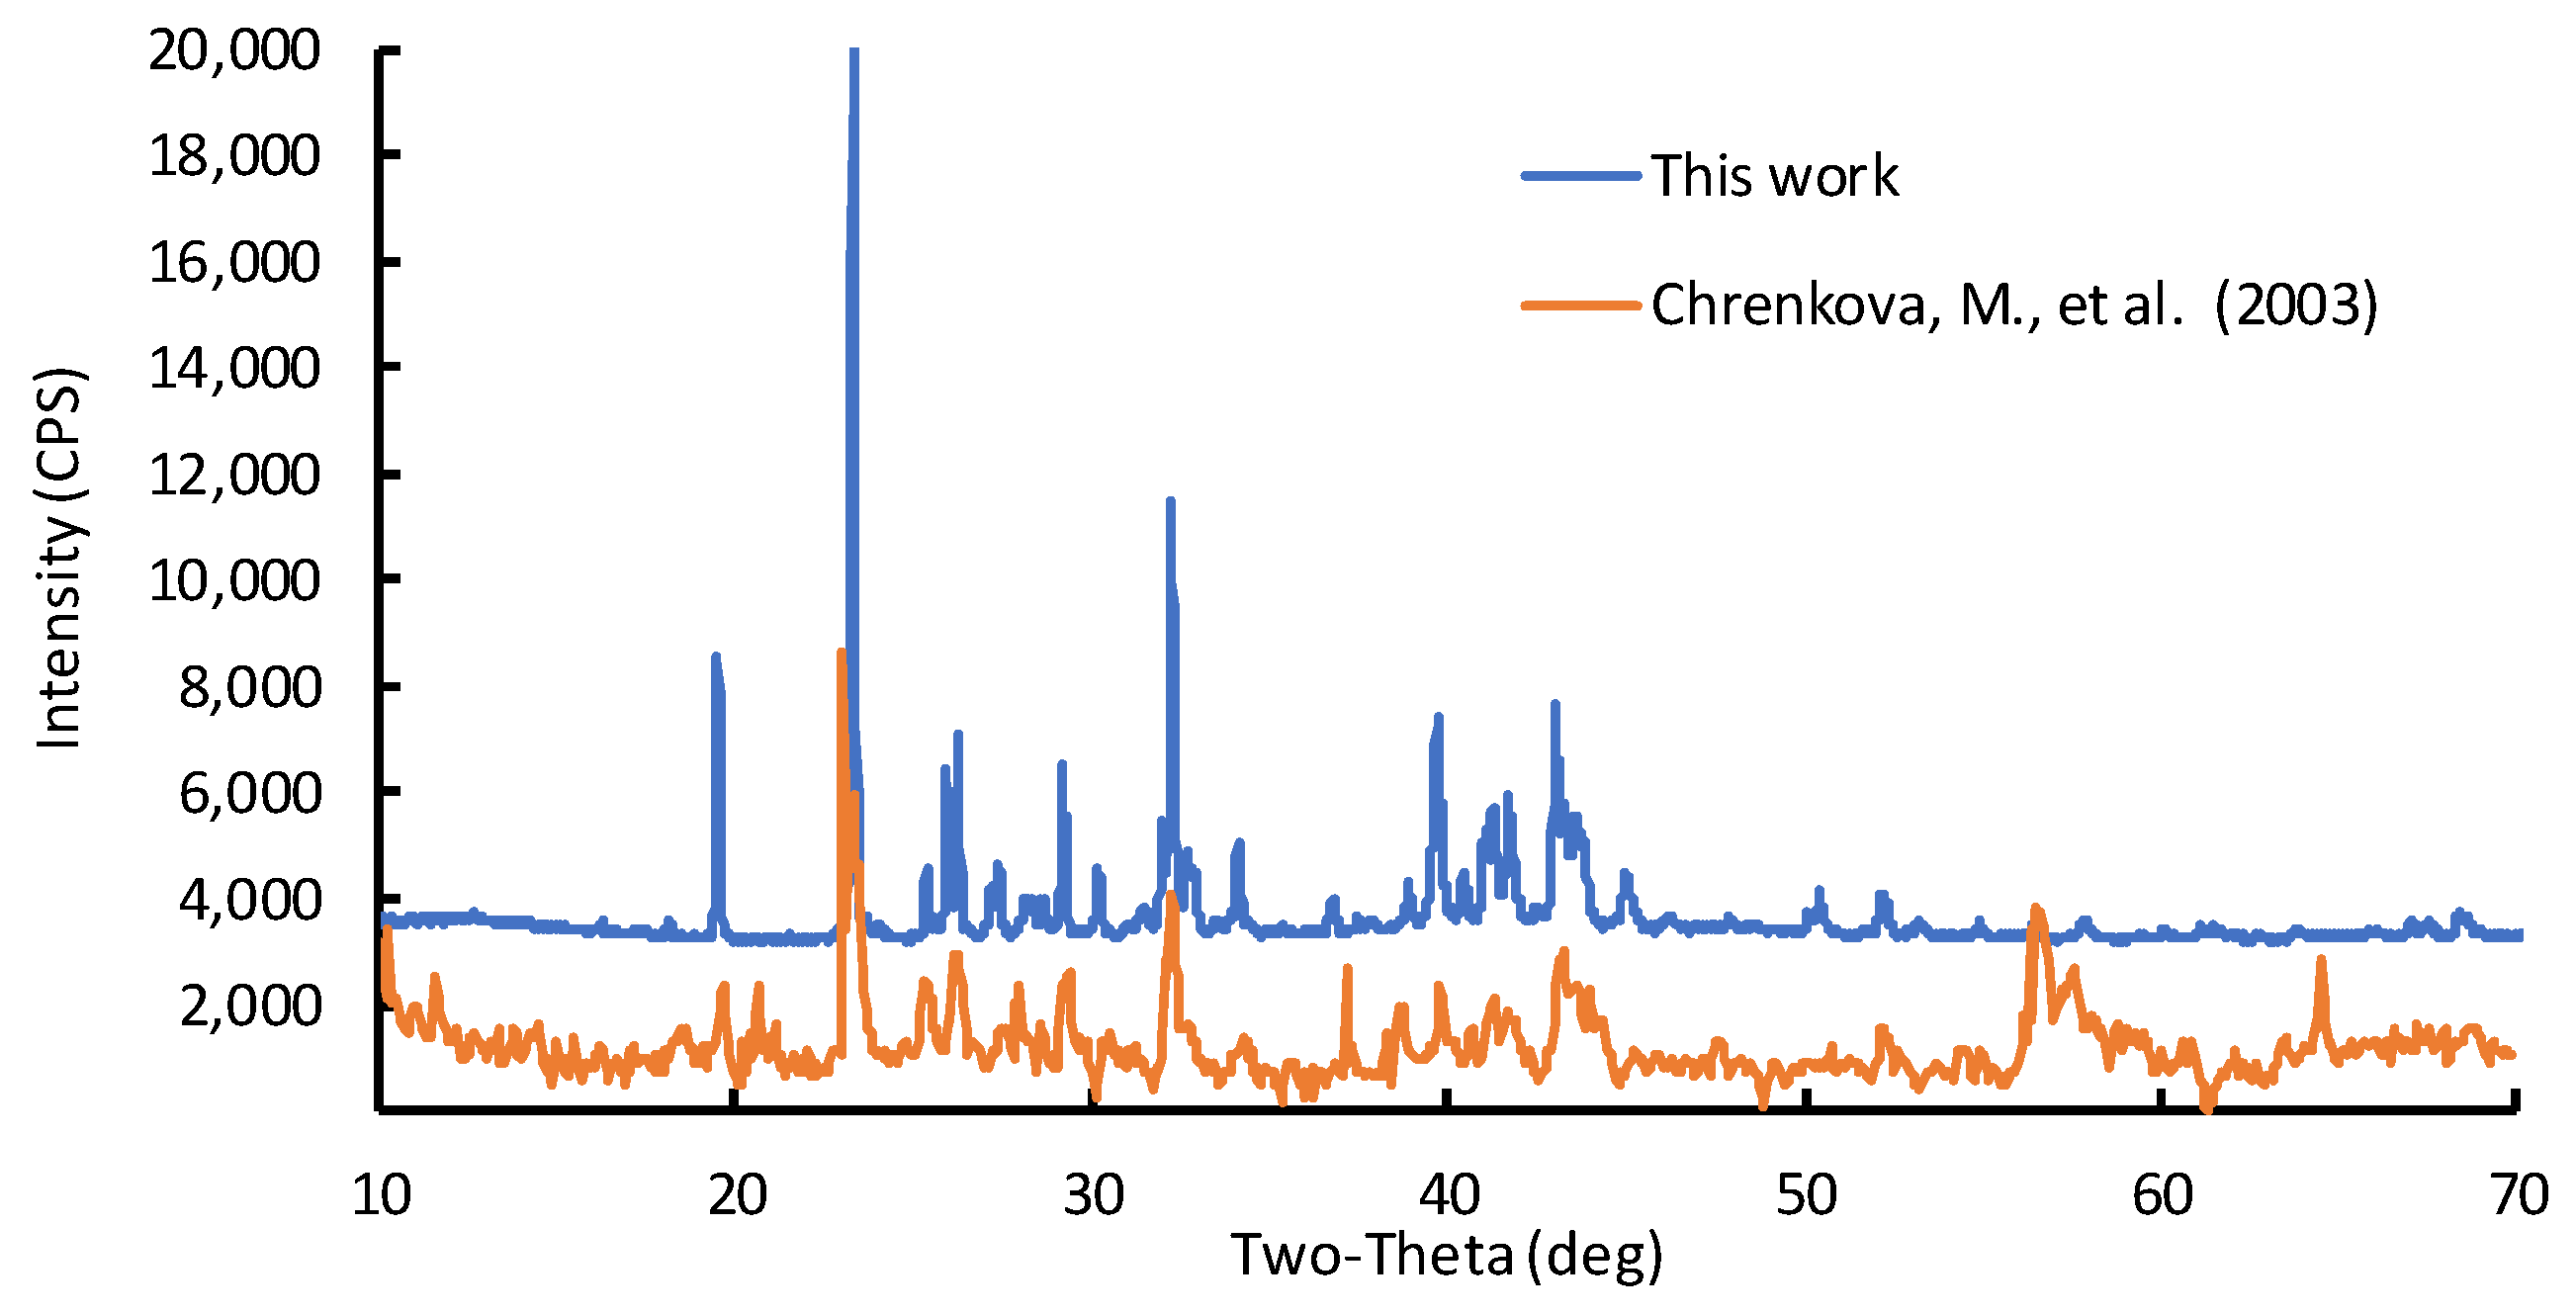
- Chrenková, M.; Daněk, V.; Silný, A.; Kremenetsky, V.; Polyakov, E. Density and Viscosity of the (LiF-NaF-KF)Eut-KBF4-B2O3 Melts. J. Mol. Liq. 2003, 102, 213–226. [Google Scholar] [CrossRef]
- Wu, H.; Yu, H.; Bian, Q.; Yang, Z.; Han, S.; Pan, S. Borate Fluoride and Fluoroborate in Alkali-Metal Borate Prepared by an Open High-Temperature Solution Method. Inorg. Chem. 2014, 53, 12686–12688. [Google Scholar] [CrossRef]
- Plovnick, R.H.; Schmidt, G.E. Purification and Crystal Growth of Potassium Perrhenate, KReO4. J. Cryst. Growth 1971, 8, 309–310. [Google Scholar] [CrossRef]
- Bowman, H.A.; Schoonover, R.M. Procedure for High Precision Density Determinations by Hydrostatic Weighing. J. Res. Natl. Bur. Stand. Sect. C Eng. Instrum. 1967, 71C, 179. [Google Scholar] [CrossRef]
- Rashmi, R.; Snekhalatha, U. Evaluation of Body Composition Parameters Using Various Diagnostic Methods: A Meta Analysis Study. Obes. Med. 2019, 16, 100150. [Google Scholar] [CrossRef]
- Smirnov, M.V.; Stepanov, V.P. Density and Surface Tension of Molten Alkali Halides and Their Binary Mxitures. Electrochim. Acta 1982, 27, 1551–1563. [Google Scholar] [CrossRef]
- Kaptay, G. Interfacial Forces in Dispersion Science and Technology. J. Dispers. Sci. Technol. 2012, 33, 130–140. [Google Scholar] [CrossRef]
- Utlak, S.A. Modeling Complex Oxides: Thermochemical Behavior of Modeling Complex Oxides: Thermochemical Behavior of Nepheline-Forming Na-Al-Si-B-K-Li-Ca-Mg-Fe-O and Hollandite-Nepheline-Forming Na-Al-Si-B-K-Li-Ca-Mg-Fe-O and Hollandite-Forming Ba-Cs-Ti-Cr-Al-Fe-Ga-O Systems Forming Ba-Cs-Ti-Cr-Al-Fe-Ga-O Systems. Doctoral Dissertation, The University of South Carolina, Columbia, SC, USA, 2019. [Google Scholar]
- Chernyshev, A.A.; Arkhipov, S.P.; Apisarov, A.P.; Shmygalev, A.S.; Isakov, A.V.; Zaikov, Y.P. Rhenium Electrodeposition and Its Electrochemical Behavior in Molten KF-KBF4-B2O3-KReO4. Materials 2022, 15, 8679. [Google Scholar] [CrossRef] [PubMed]
- Keller, C.; Kanellakopulos, B. Ternäre Oxide Des Drei-Bis Siebenwertigen Technetiums Mit Alkalien. J. Inorg. Nucl. Chem. 1965, 27, 787–795. [Google Scholar] [CrossRef]
- Tkachev, N.K.; Rukavishnikova, I.V.; Lokett, V.N.; Stepanov, V.P. Density of Stratified Ionic Melts: Experiment and Theory. Russ. J. Electrochem. 2007, 43, 955–960. [Google Scholar] [CrossRef]


| №. | K2B2OF6 | KReO4 | ||
|---|---|---|---|---|
| mol. % | wt. % | mol. % | wt. % | |
| 1 | 100.00 | 100.00 | 0.00 | 0.00 |
| 2 | 99.20 | 99.00 | 0.80 | 1.00 |
| 3 | 98.41 | 98.00 | 1.59 | 2.00 |
| 4 | 96.80 | 96.00 | 3.20 | 4.00 |
| 5 | 95.17 | 94.00 | 4.83 | 6.00 |
| 6 | 91.89 | 90.00 | 8.11 | 10.00 |
| 7 | 87.71 | 85.00 | 12.29 | 15.00 |
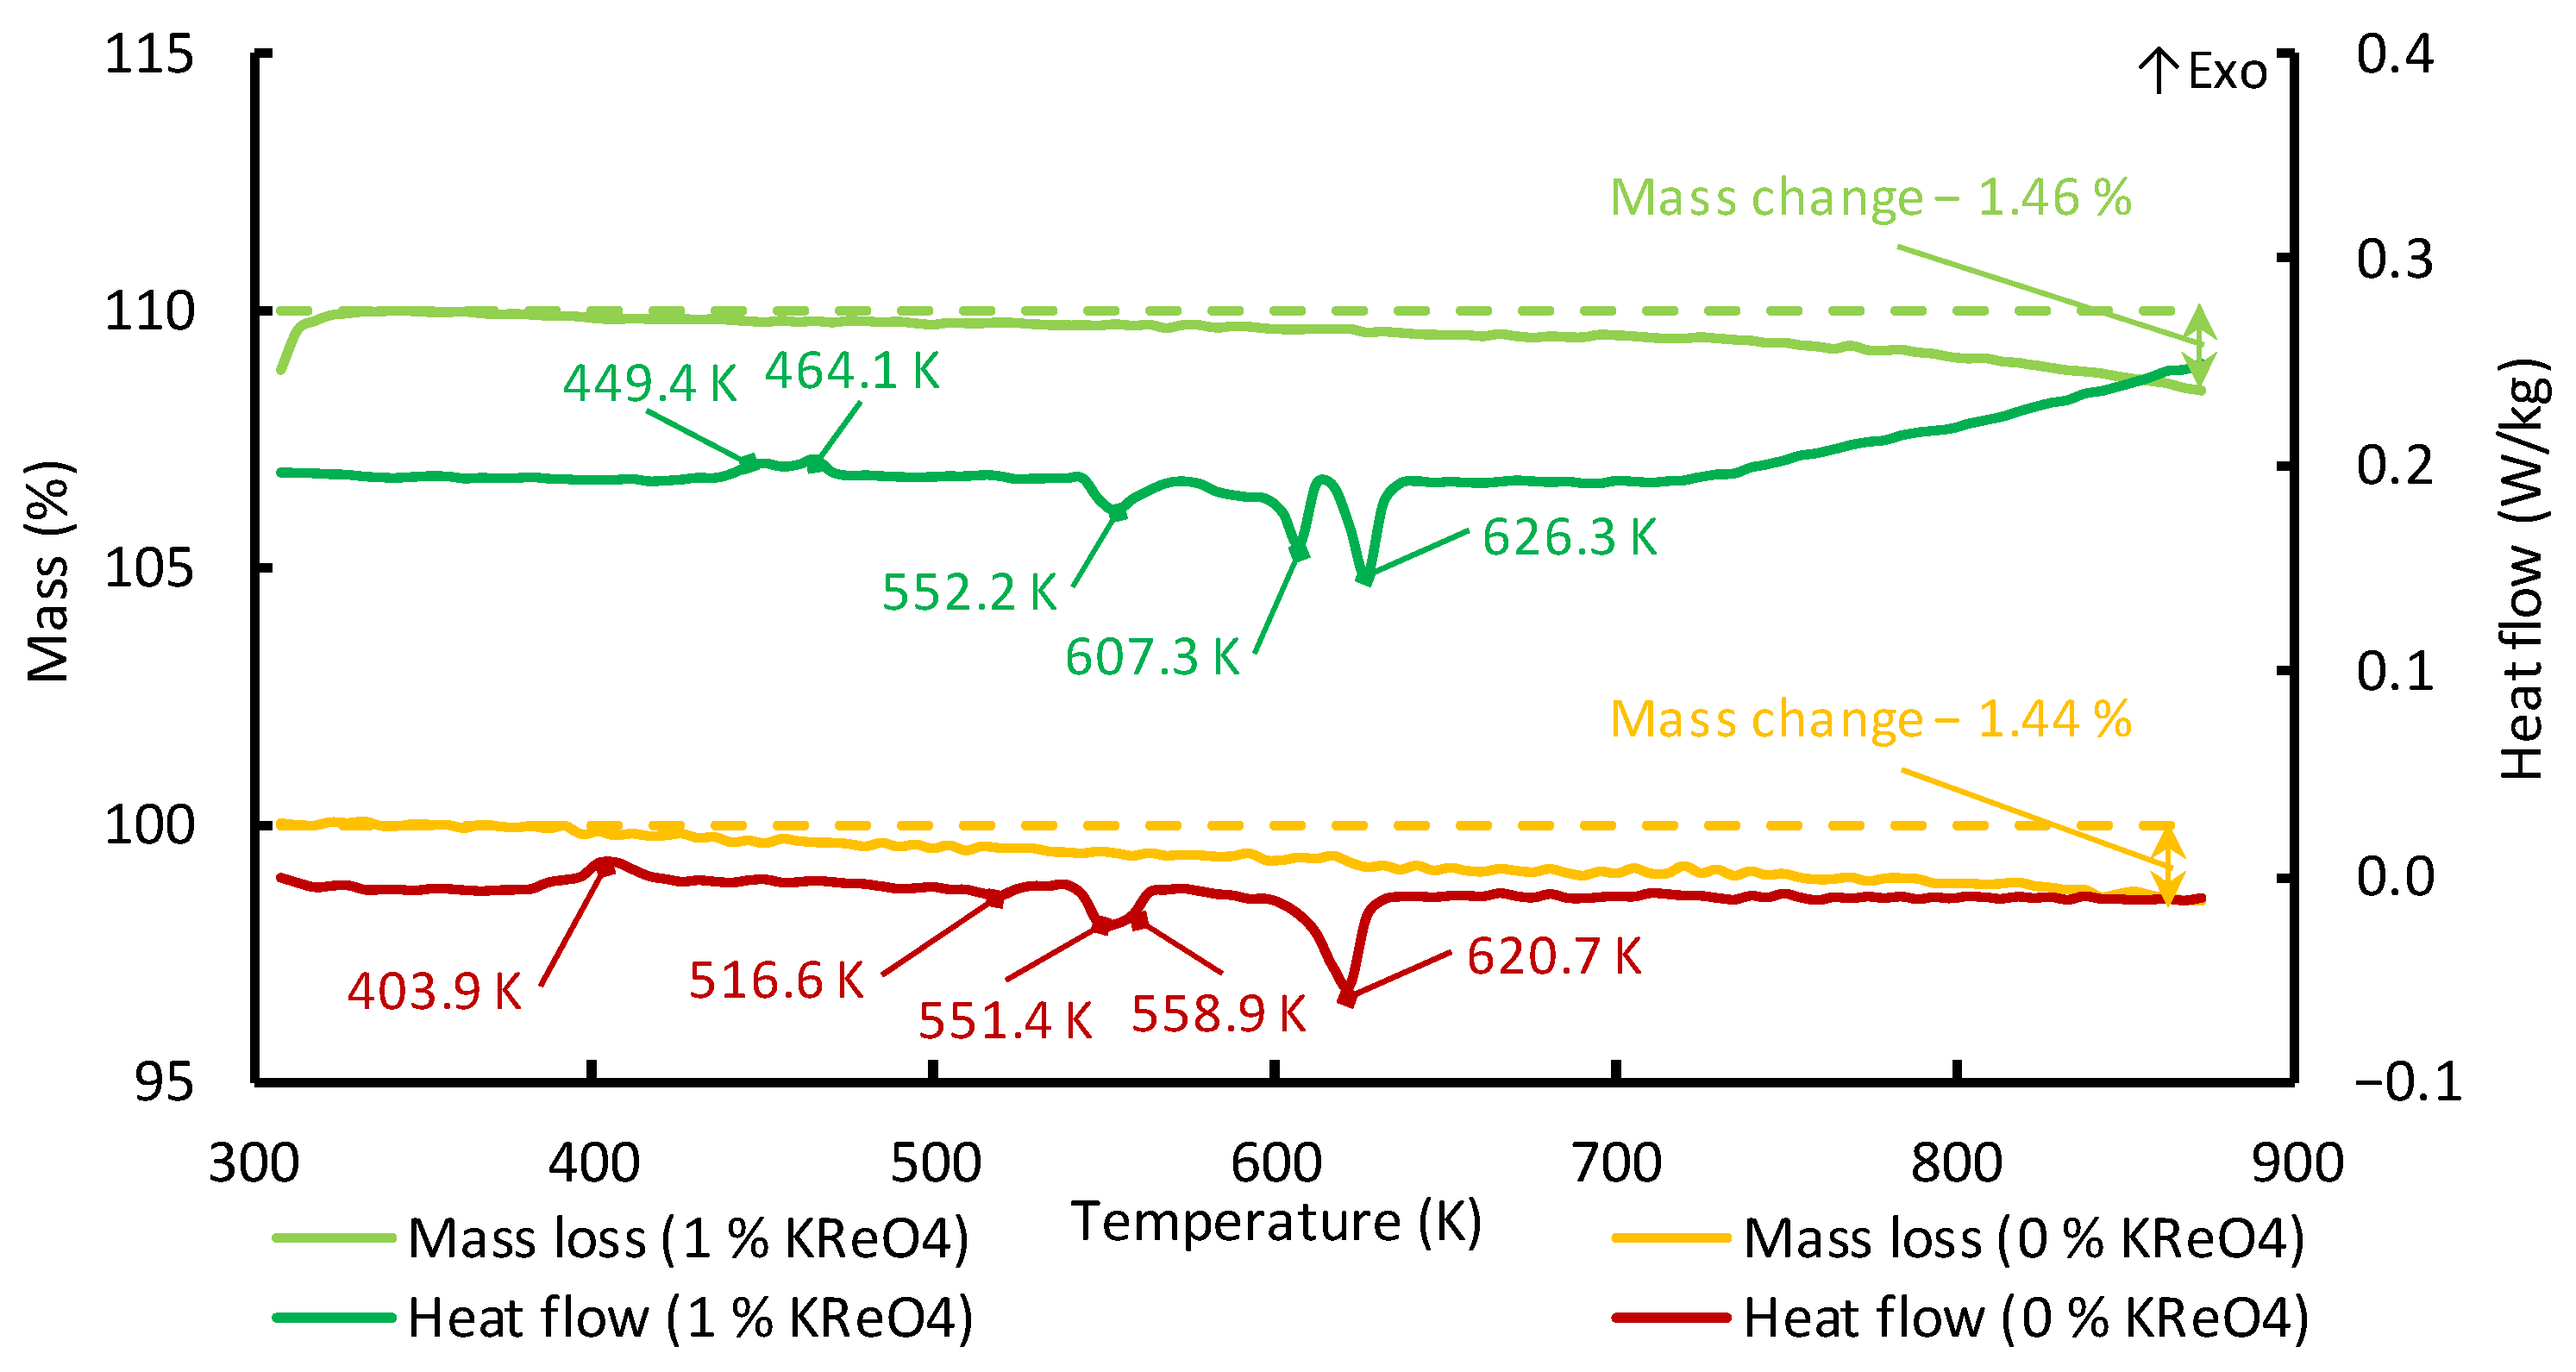
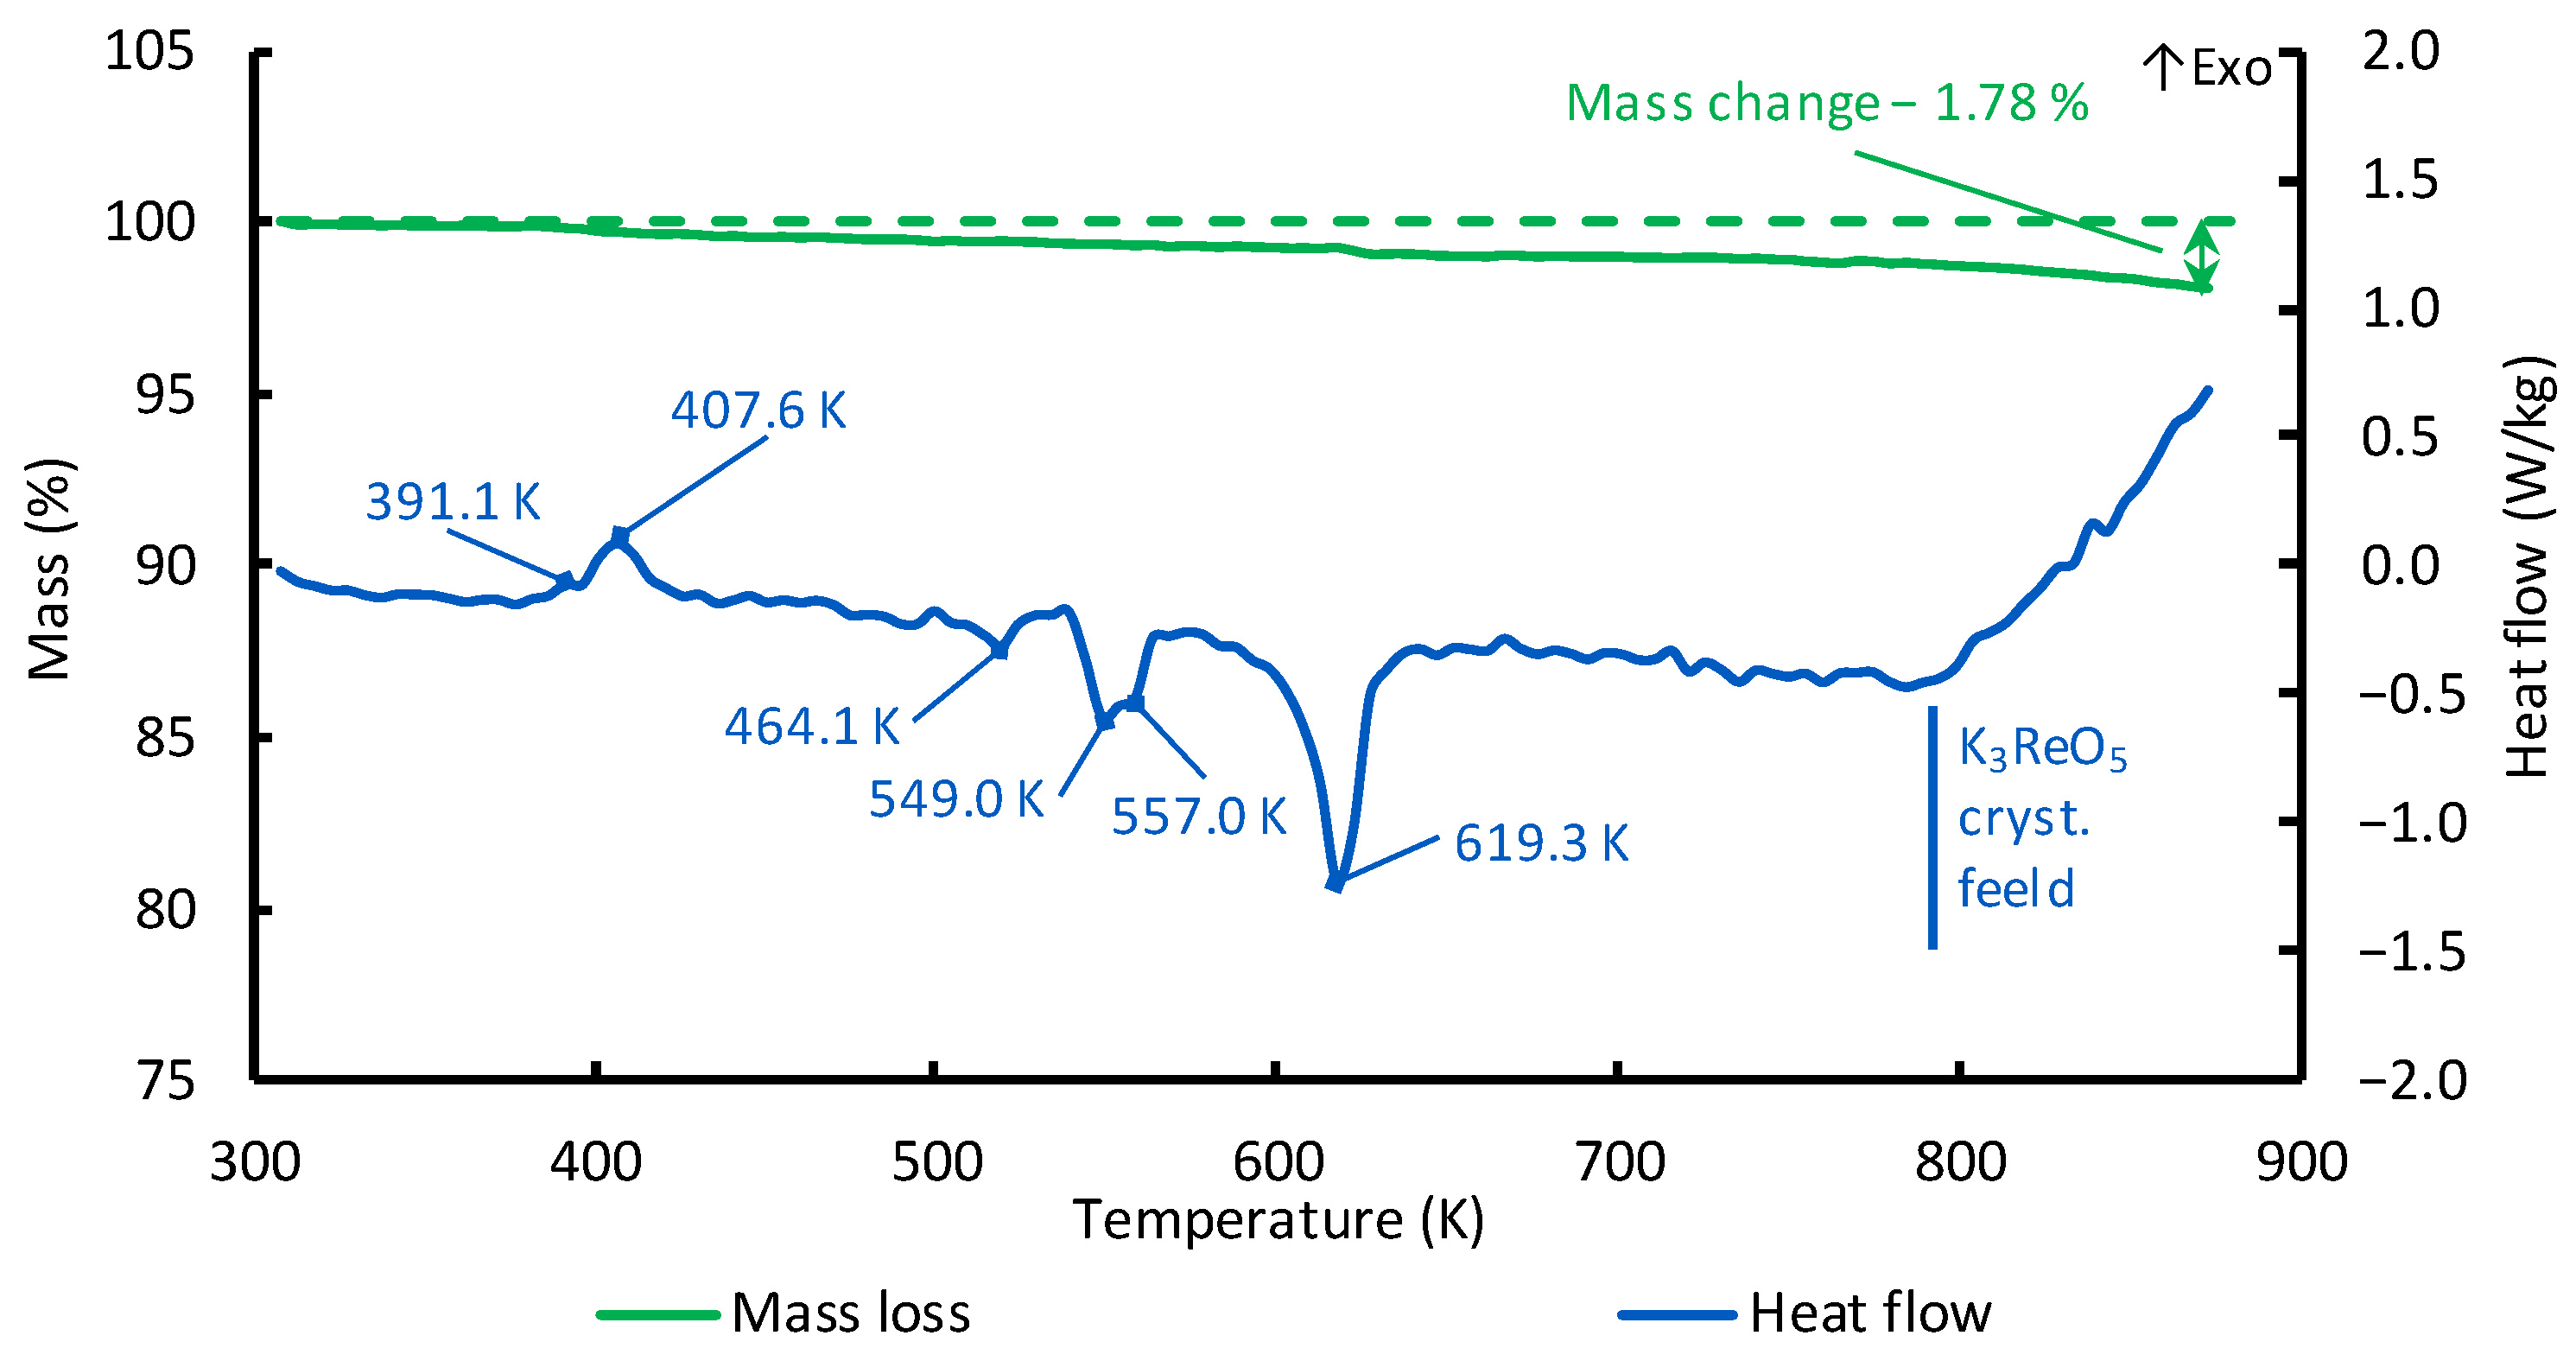
| Thermal Effect | Content of KReO4, wt. % | Notes | ||
|---|---|---|---|---|
| 0 | 1 | 2 | ||
| 1 | - | 403–407 K | 403–407 K | Exothermic, associated with KReO4 appearance |
| 2 | 449–464 K | - | - | Exothermic |
| 3 | 551–557 K | 551–557 K | 551–557 K | Endothermic, formation of K10B38O62 [31] |
| 4 | 607 K | - | - | Endothermic |
| 5 | 628 ± 5 K | 628 ± 5 K | 628 ± 5 K | Endothermic, melting |
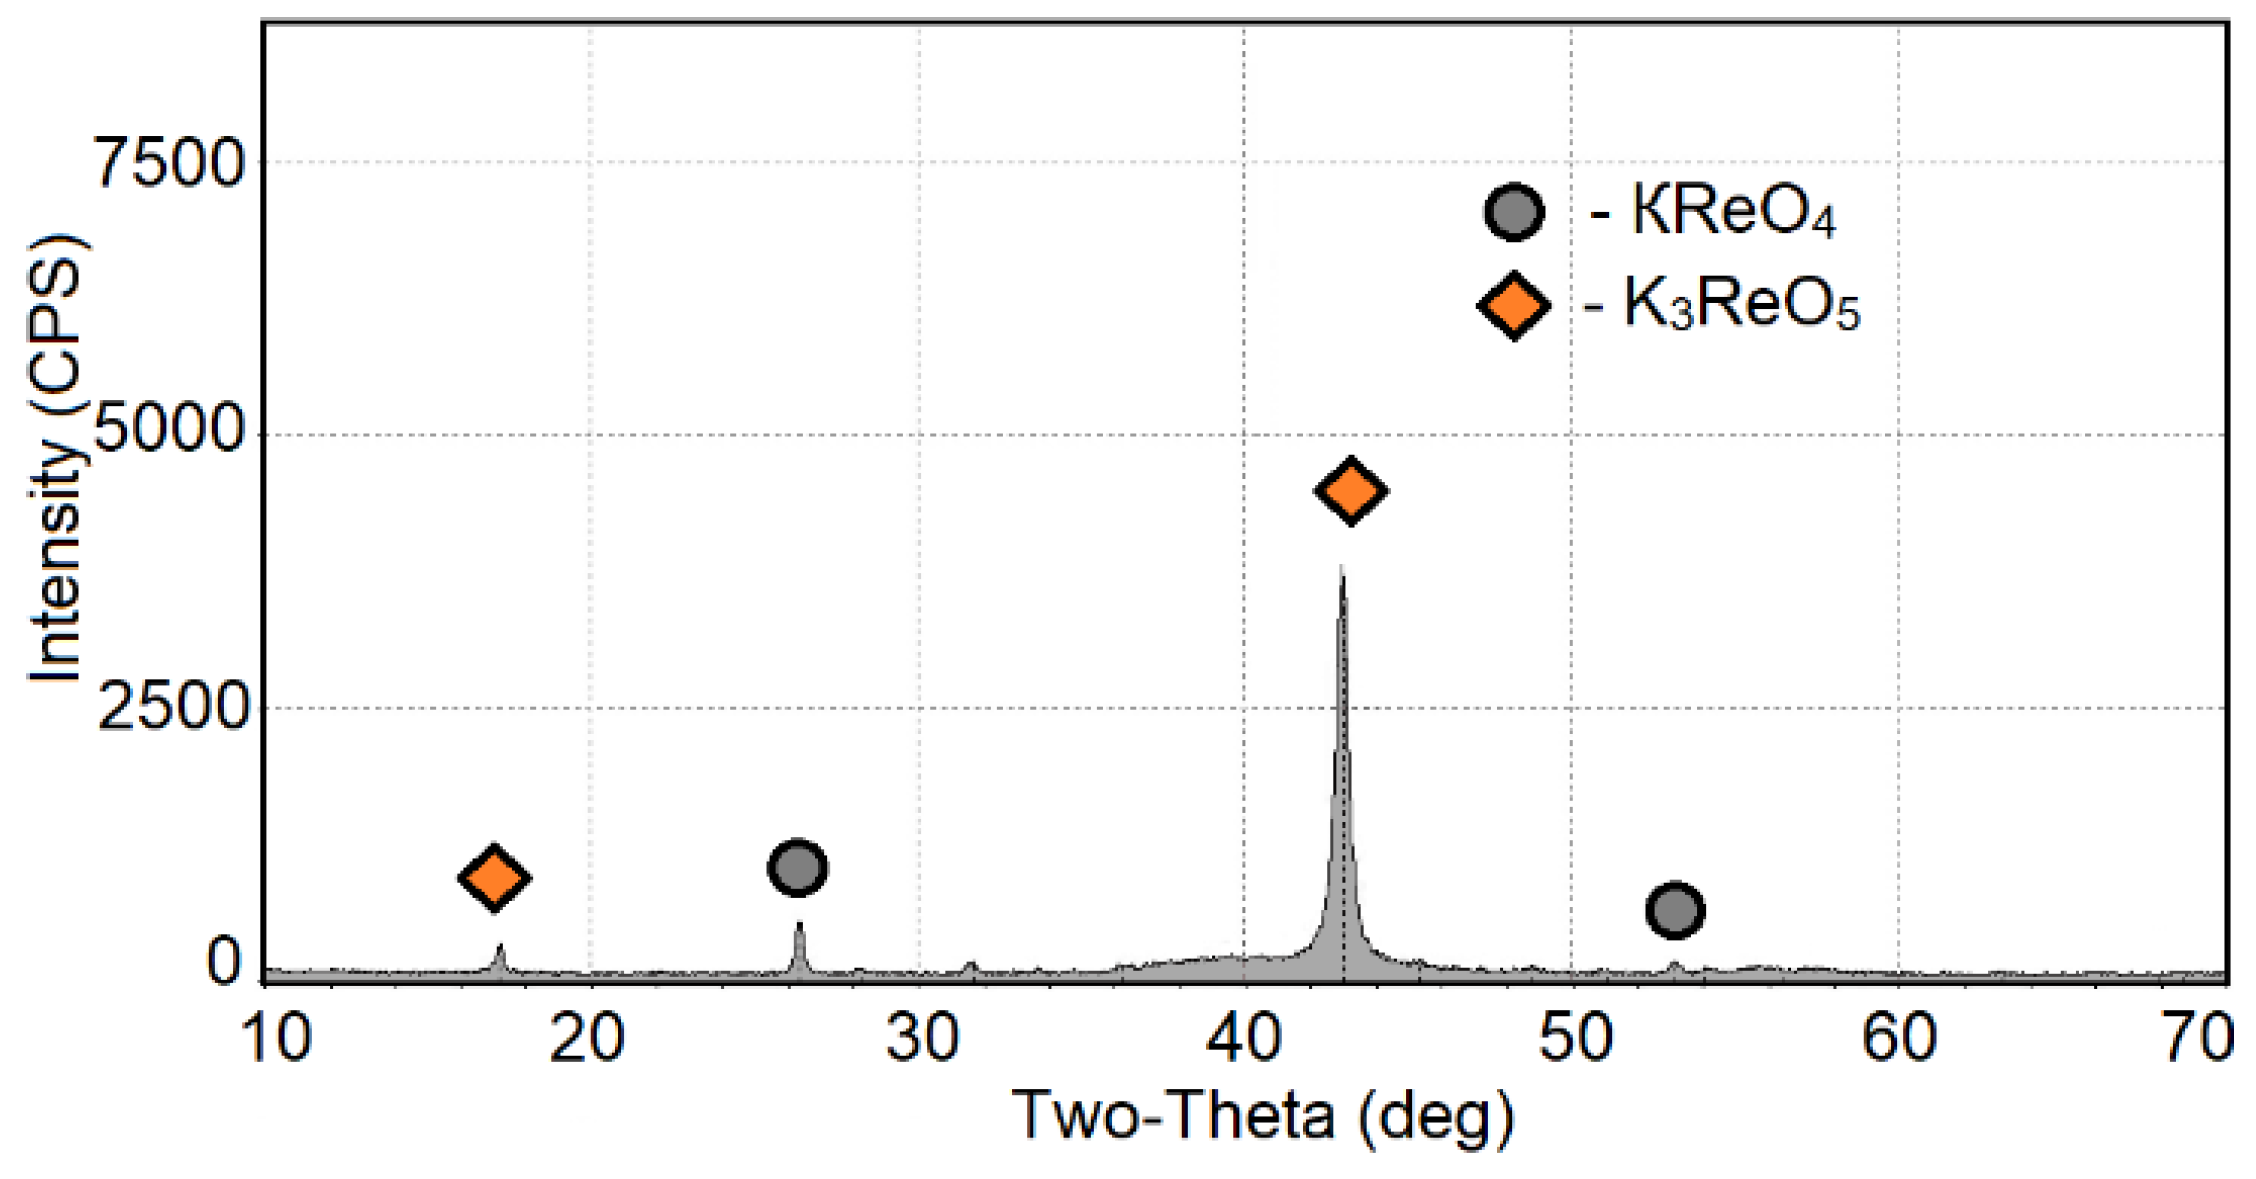
| 6 | - | - | Starting at 773 K | Exothermic, crystallization of K3ReO5 |
| №. | Melt | KReO4 wt.% | Coefficients of the Equation d = a − b·T | R2 | Temperature Range, K | Deposition of the First Crystal Point, K | TCr, K | |
|---|---|---|---|---|---|---|---|---|
| a | b | |||||||
| 1 | K2B2OF6–KReO4 | 0 | 2.7292 | 0.0009 | 1 | 929–628 | 628 | - |
| 2 | 1 | 2.8924 | 0.0011 | 0.9996 | 834–674 | 674 | - | |
| 3 | 4U | 2.6068 | 0.0008 | 0.9979 | 926–703 | 702 | 1183 | |
| 4 | 4L | 2.7251 | 0.0009 | 0.9933 | 926–702 | 702 | ||
| 5 | 6L | 2.8495 | 0.0010 | 0.9993 | 924–733 | 733 | 1416 | |
| 6 | 6U | 2.7079 | 0.0009 | 0.9951 | 933–734 | 733 | ||
| 7 | 10L | 2.7122 | 0.0008 | 0.9981 | 926–699 | 731 | 1005 | |
| 8 | 10U | 2.9131 | 0.0010 | 0.9957 | 923–731 | 731 | ||
| 9 | 15U | 2.6837 | 0.0007 | 0.9943 | 775–731 | 731 | 775 | |
| 10 | 15L | 2.9935 | 0.0011 | 0.9883 | 775–743 | 731 | ||
Disclaimer/Publisher’s Note: The statements, opinions and data contained in all publications are solely those of the individual author(s) and contributor(s) and not of MDPI and/or the editor(s). MDPI and/or the editor(s) disclaim responsibility for any injury to people or property resulting from any ideas, methods, instructions or products referred to in the content. |
© 2023 by the authors. Licensee MDPI, Basel, Switzerland. This article is an open access article distributed under the terms and conditions of the Creative Commons Attribution (CC BY) license (https://creativecommons.org/licenses/by/4.0/).
Share and Cite
Chernyshev, A.A.; Apisarov, A.P.; Isakov, A.V.; Khudorozhkova, A.O.; Laptev, M.V. Melting Behavior and Densities of K2B2OF6 Melts Containing KReO4. Processes 2023, 11, 3148. https://doi.org/10.3390/pr11113148
Chernyshev AA, Apisarov AP, Isakov AV, Khudorozhkova AO, Laptev MV. Melting Behavior and Densities of K2B2OF6 Melts Containing KReO4. Processes. 2023; 11(11):3148. https://doi.org/10.3390/pr11113148
Chicago/Turabian StyleChernyshev, Aleksandr A., Alexey P. Apisarov, Andrey V. Isakov, Anastasia O. Khudorozhkova, and Michael V. Laptev. 2023. "Melting Behavior and Densities of K2B2OF6 Melts Containing KReO4" Processes 11, no. 11: 3148. https://doi.org/10.3390/pr11113148
APA StyleChernyshev, A. A., Apisarov, A. P., Isakov, A. V., Khudorozhkova, A. O., & Laptev, M. V. (2023). Melting Behavior and Densities of K2B2OF6 Melts Containing KReO4. Processes, 11(11), 3148. https://doi.org/10.3390/pr11113148