2.2.1. Power Loss of the Pump
The power loss of the pump is composed of mechanical and volumetric power loss, which can be expressed as:
where
and
represent the mechanical power loss and volumetric power loss, respectively.
In addition, the mechanical power loss
can be expressed as Equation (21).
where
is the torque loss of the pump,
represents the pump torque loss generated by the friction pair,
is the pump torque loss generated by oil viscosity,
is the pump torque loss generated by fluid churn, and
is the angular velocity of the pump.
,
and
can be expressed as Equations (22)–(24), respectively.
where
is the pressure area,
is the frictional coefficient of the friction pair,
is the distance from the friction to the center of the rotation axis,
is the mechanical loss coefficient,
is the projected area of the friction area,
is the oil shear stress on unit area,
is the viscous friction coefficient,
is the projected area of the turbulent follow channel,
is the density of the oil,
is the rotational speed of the pump,
is the churning loss coefficient,
is the working pressure of the pump, and
is the dynamic viscosity of the fluid.
Combining Equations (21)–(24), the expression for the mechanical power loss of the pump can be obtained as:
where
,
, and
.
In addition, the volumetric power loss of the pump is generated by the leakage of the sealing surface. The volumetric power loss and the leakage equation can be expressed as follows:
where
is the leakage of the pump, and
and
denote the leakage in laminar and turbulent, respectively, which can be expressed as follows.
where
is the height of the leakage gap,
is the length of the leakage boundary,
is the length of the leakage channel,
is the laminar leakage coefficient, and
is the turbulent leakage coefficient. Therefore, the volumetric power loss of the pump can be obtained as:
According to Equations (20), (25) and (29), the power loss of the pump can be expressed as follows:
According to Equation (30), it can be found that the power loss of the pump is a function of the system pressure and the displacement of the pump.
2.2.2. Power Loss of the Motor
Generally, the motor power loss is mainly composed of electrical loss which consists of copper and iron losses. The expression of the motor loss can be presented as follows:
where
is the electrical power loss, and
and
indicate the copper and iron losses, respectively, which can be expressed as follows:
where
is the number of phases of the motor winding,
is the RMS value of the winding phase current,
is the phase resistance,
is the hysteresis loss coefficient,
is the frequency of alternating magnetic field,
is the Steinmetz coefficient, and
is the additional loss coefficient.
The copper and iron losses of the motor depend greatly on the design structure and the material of the motor according to Equations (32) and (33). However, it is difficult to determine the specific parameters of the motor at the beginning of EHA design. The loss model of the motor can also be obtained by using similarity criterion. Similarly, the motor rated torque is selected as the definition parameter, while the dimensional parameter is defined as .
- (1)
Copper Loss Calculation
The relationship between motor output torque and current can be expressed as:
where
is the output torque of the motor, and
is the torque coefficient of the motor.
Combining Equations (32) and (34), the relationship of the copper loss and the output torque can be expressed as:
where
can be defined as the coefficient between copper loss and the output torque. Meanwhile, the similarity ratio of the
can be expressed as:
The value of the motor torque coefficient and back EMF coefficient can be considered equal for the permanent magnet synchronous motor. Thus, the similar ratio for the torque coefficient can be expressed as follows based on the formula for back EMF.
where
is the similarity ratio of back EMF, and
is the similarity ratio of the rotational speed.
In the high-speed operation process, the motor rotor contains a large centrifugal force. The maximum rotational speed of the motor is generally limited by the mechanical constraints caused by the centrifugal force for safety. Assuming that the motor possesses the same scale factor in all dimensions, the similarity ratio of the concentrated stress of the shaft can be expressed as Equation (38) according to the centrifugal force calculation method.
where
is the similarity ratio of the concentrated stress of the shaft.
Furthermore, assuming that the motors are produced from the same material that contains the same stress limits,
. Therefore, the similarity ratio of rotational speed, the shaft shear force and torque can be obtained as follows, respectively:
Combining Equations (37) and (39), the similarity ratio for the torque coefficient can be obtained as:
The similarity ratio of the winding resistance can be obtained as Equation (43) according to the calculation method of the motor winding resistance.
where
is the similarity ratio of the winding number, which can be expressed as:
Combining Equations (43) and (44), the final representation of the winding resistance similarity ratio can be expressed as:
Furthermore, for a given motor shaft material, the ratio between the fatigue stress and the maximum stress is fixed. Therefore, the ratio between the rated torque of the motor and its maximum torque is also fixed, which can be expressed as:
where
and
represent the similarity ratio of the maximum and the rated torque, respectively.
Moreover, the relationship between the similarity ratio of
and the rated torque can be obtained as Equation (47) according to Equations (16), (36), (42) and (45).
- (2)
Iron Loss Calculation
The flux density of the motor in engineering is generally
; therefore, the iron loss of the motor can be simplified as:
where
is the loss coefficient of stator material, and
is the mass of the stator. Substituting the motor rotational speed versus frequency, the expression for iron loss of the motor can be regained as follows:
where
is the coefficient representing the relationship between iron loss and rotational speed, and the similarity ratio of
can be expressed as follows:
- (3)
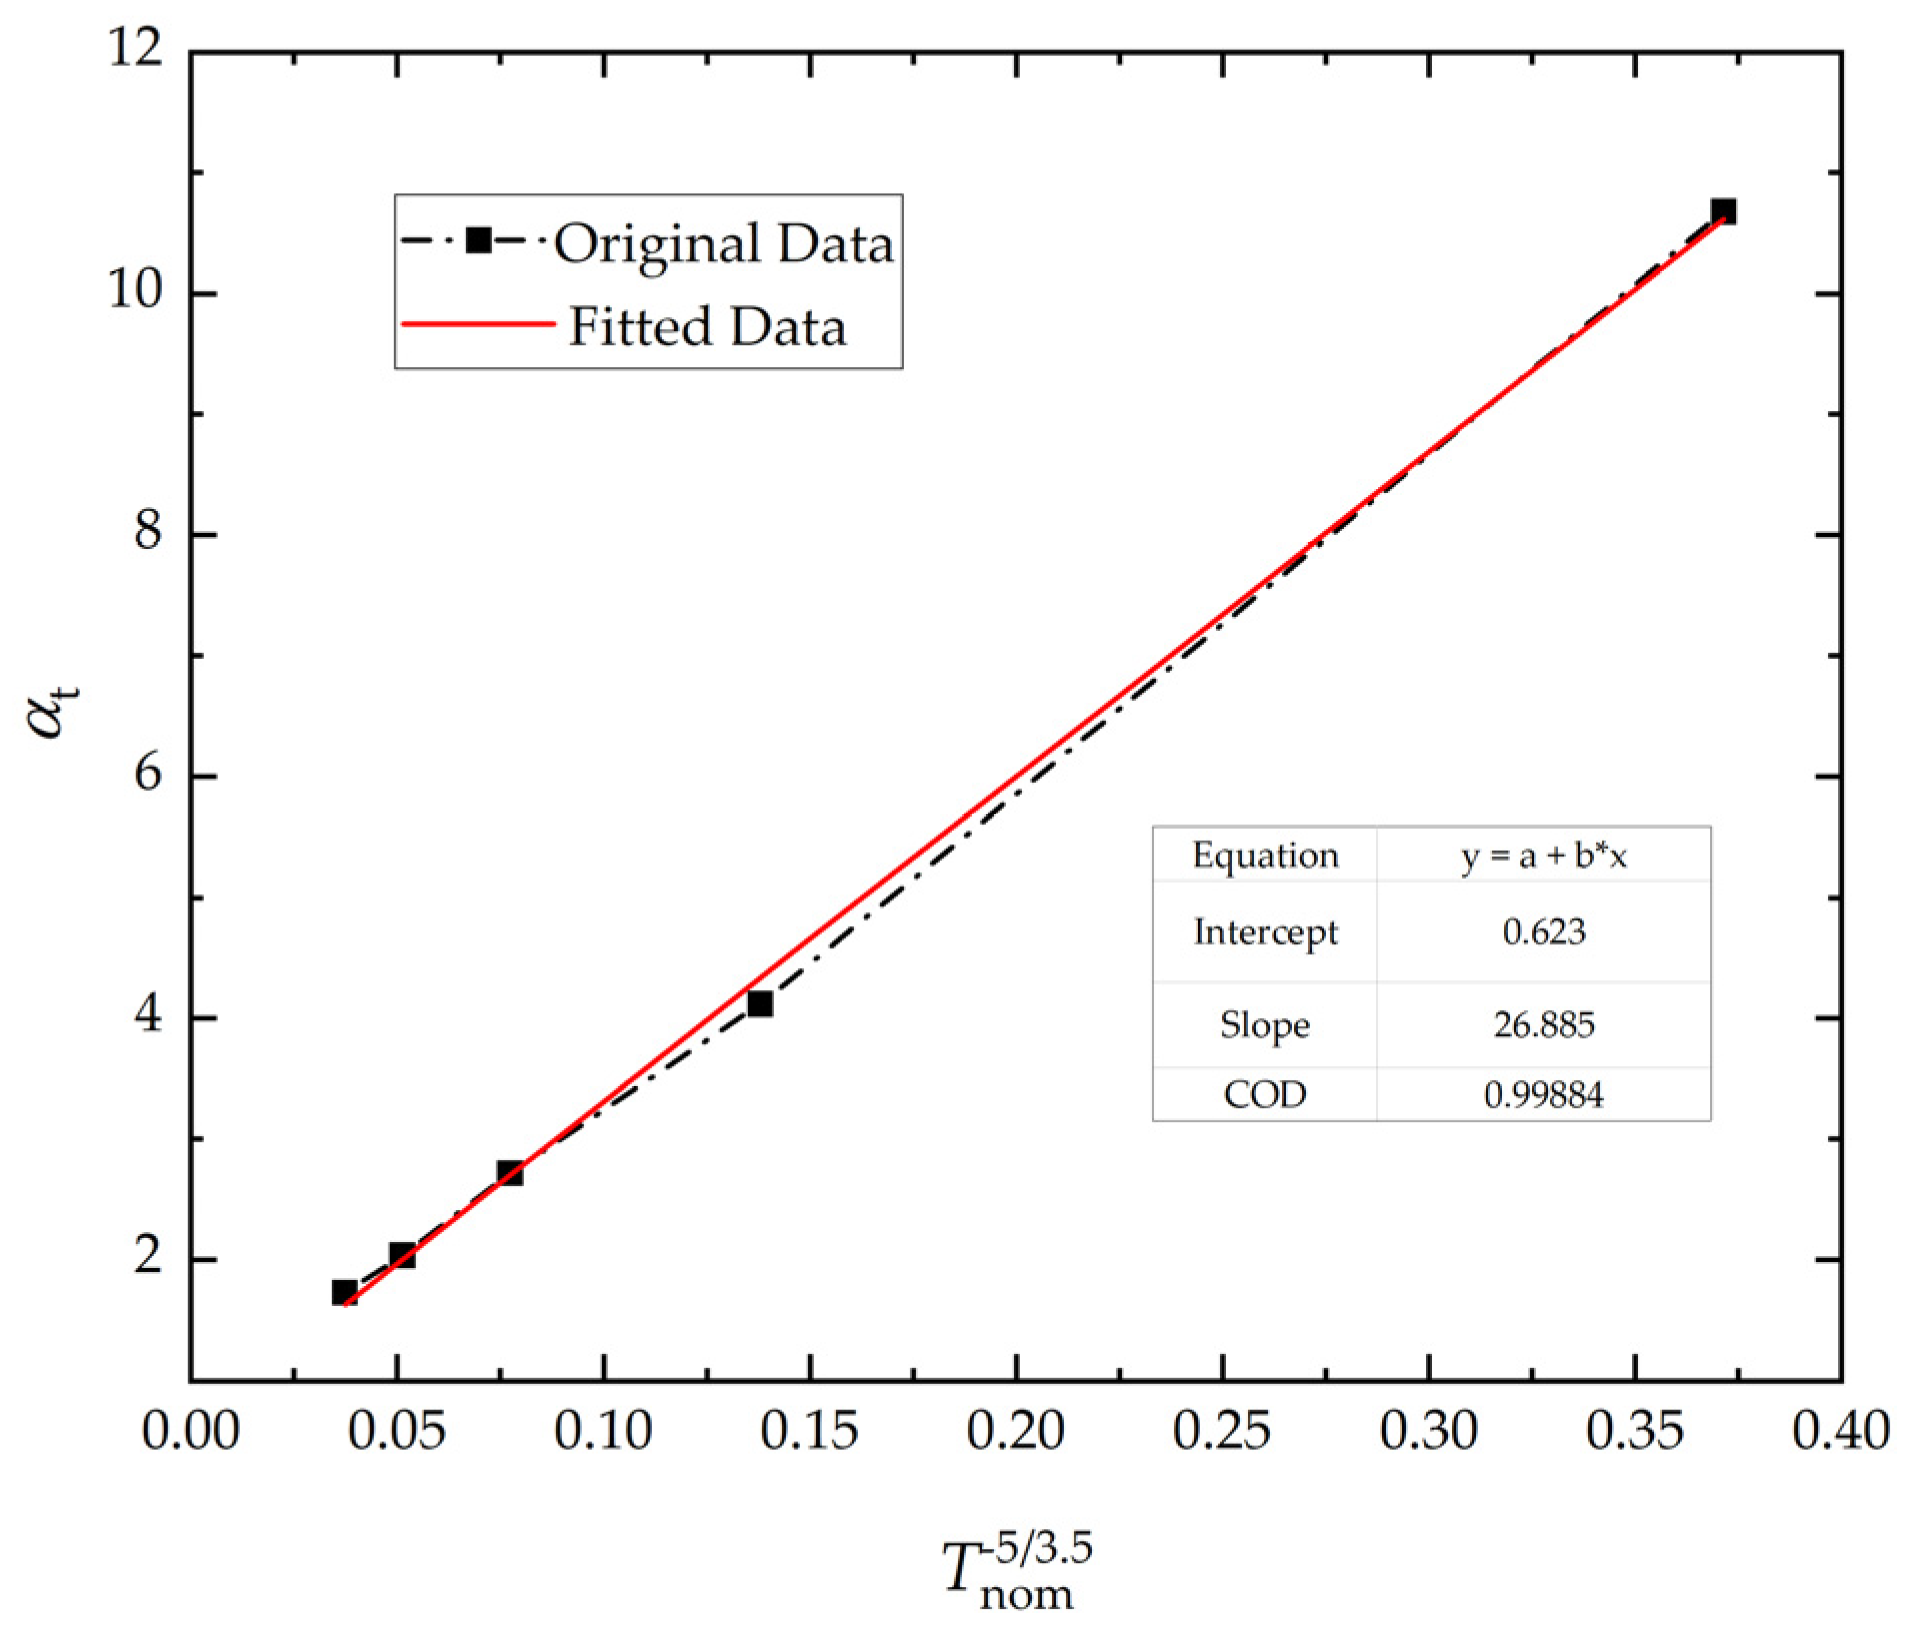
Calculation Method of and
In order to obtain the specific expression of
and
, the motor simulation models are established as shown in
Figure 5. The simulation results of power loss at different rated operating conditions are shown in
Table 1. Further, the loss coefficients versus rated torque graphic can be obtained by combining Equations (47) and (50), as shown in
Figure 6 and
Figure 7, respectively. Ultimately, the expressions for
and
can be denoted as Equations (51) and (52), respectively.
Finally, the motor loss calculation model can be expressed as follows by combining Equations (35), (49), (51) and (52).
According to Equation (53), it can be found that the power loss of the motor is a function of the motor output torque and rotational speed, which is related to the motor working conditions.


