1. Introduction
Titanium dioxide is a widely used white pigment in industries such as coatings, paints, paper, plastic, rubber, ceramics, and textiles. There are two main structures of titanium dioxide particles: rutile and anatase, depending on the production method [
1]. The sulfate process, which involves the decomposition of titanium-containing raw materials using sulfuric acid and the precipitation of titanium sulfate, is the focus of this paper [
2]. Another method is the chloride process [
3]. The chemical equations for the sulfate process are shown in Equation (1).
To produce a high-quality white pigment, a stable and precise process control of precipitation is required and most
manufacturing companies have attempted to optimize the process [
4,
5,
6,
7,
8]. The uniformity of particle size during the precipitation process is essential for producing high-quality
pigments. If particles of varying sizes are produced, they may block the pores of the filter cloth in the following washing process [
9]. Inconsistent particle sizes during precipitation can destabilize the titanyl sulfate solution and negatively impact subsequent washing and bleaching processes. This non-uniform particle size distribution can result in a final product with inconsistent coloration and an increased annual defect production rate. Therefore, achieving uniform particle sizes during the precipitation process is of utmost importance across all production processes. To ensure a stable precipitation process with uniform particle size distribution, the agitator in the precipitation tank must meet two specified conditions.
Firstly, the agitator must effectively mix the solution and keep the temperature consistent during the precipitation stages. Secondly, the early injection of seed particles must be rapidly and evenly dispersed.
Numerous researchers within the chemical field have conducted experiments focusing on the examination of this agglomeration phenomenon [
10,
11,
12,
13,
14]. However, there remains a significant dearth of studies that delve into the analysis of the precipitation process using CFD, with an especially noticeable absence of any design considerations for precipitation via multiphase analysis [
15,
16,
17]. The limited availability of information concerning the design parameters of agitators in the realm of chemical engineering can be attributed to the restricted understanding of mechanical intricacies regarding the efficiency of mixing and the diffusivity of seeds based on the shape and placement of agitators. Moreover, there exists a clear necessity for additional research data concerning the hydrodynamic characteristics of agitators that integrate chemical reactions within the domain of mechanical engineering.
In the field of mechanical engineering, various multiphase CFD techniques have been developed and applied in recent years [
18,
19]. However, there is a notable absence of research focusing on the precipitation process to analyze real physics or optimize it. Therefore, in this paper, the Eulerian-Lagrangian multiphase CFD method is introduced for the first time in the precipitation process, aiming to combine knowledge from both the chemical and mechanical engineering disciplines to understand the impact of various design parameters of agitators on the particle size distribution of
pigments. Furthermore, this research aims to examine the path of seeds introduced during the precipitation phase and ascertain the most suitable injection site for achieving a more uniformly distributed outcome. Through the analysis of simulation findings, the existing shortcomings of the current precipitation method is pinpointed, followed by the proposition of a blade and seed inlet configuration that can enhance mixing rates.
2. MultiPhase CFD Simulation
2.1. Govering Equation
Computational fluid dynamics (CFD), which we know well, is mainly a single-phase flow that uses the Navier-stokes equation as a governing equation. Equation (2)
Nonetheless, the introduction of a wet steam gas type into the precipitation tank where a
solution is present leads to phase changes. This process results in the occurrence of multiphase flow, force, and mass exchanges. Consequently, it is imperative to utilize the following governing equations, Equations (3) and (4), for the analysis of the multiphase flow.
The meaning of
is the Volume fraction of
phase, and the momentum equation of
phase can be written as the following Equation (5):
where
is the interphase forces exchange and
is the interphase mass exchange. Ansys CFX 18.2 is used for governing equations and the multiphase solver. The turbulence modeling utilized in this study was the Detached Eddy Simulation (DES).
2.2. Geometry and Mesh Generation
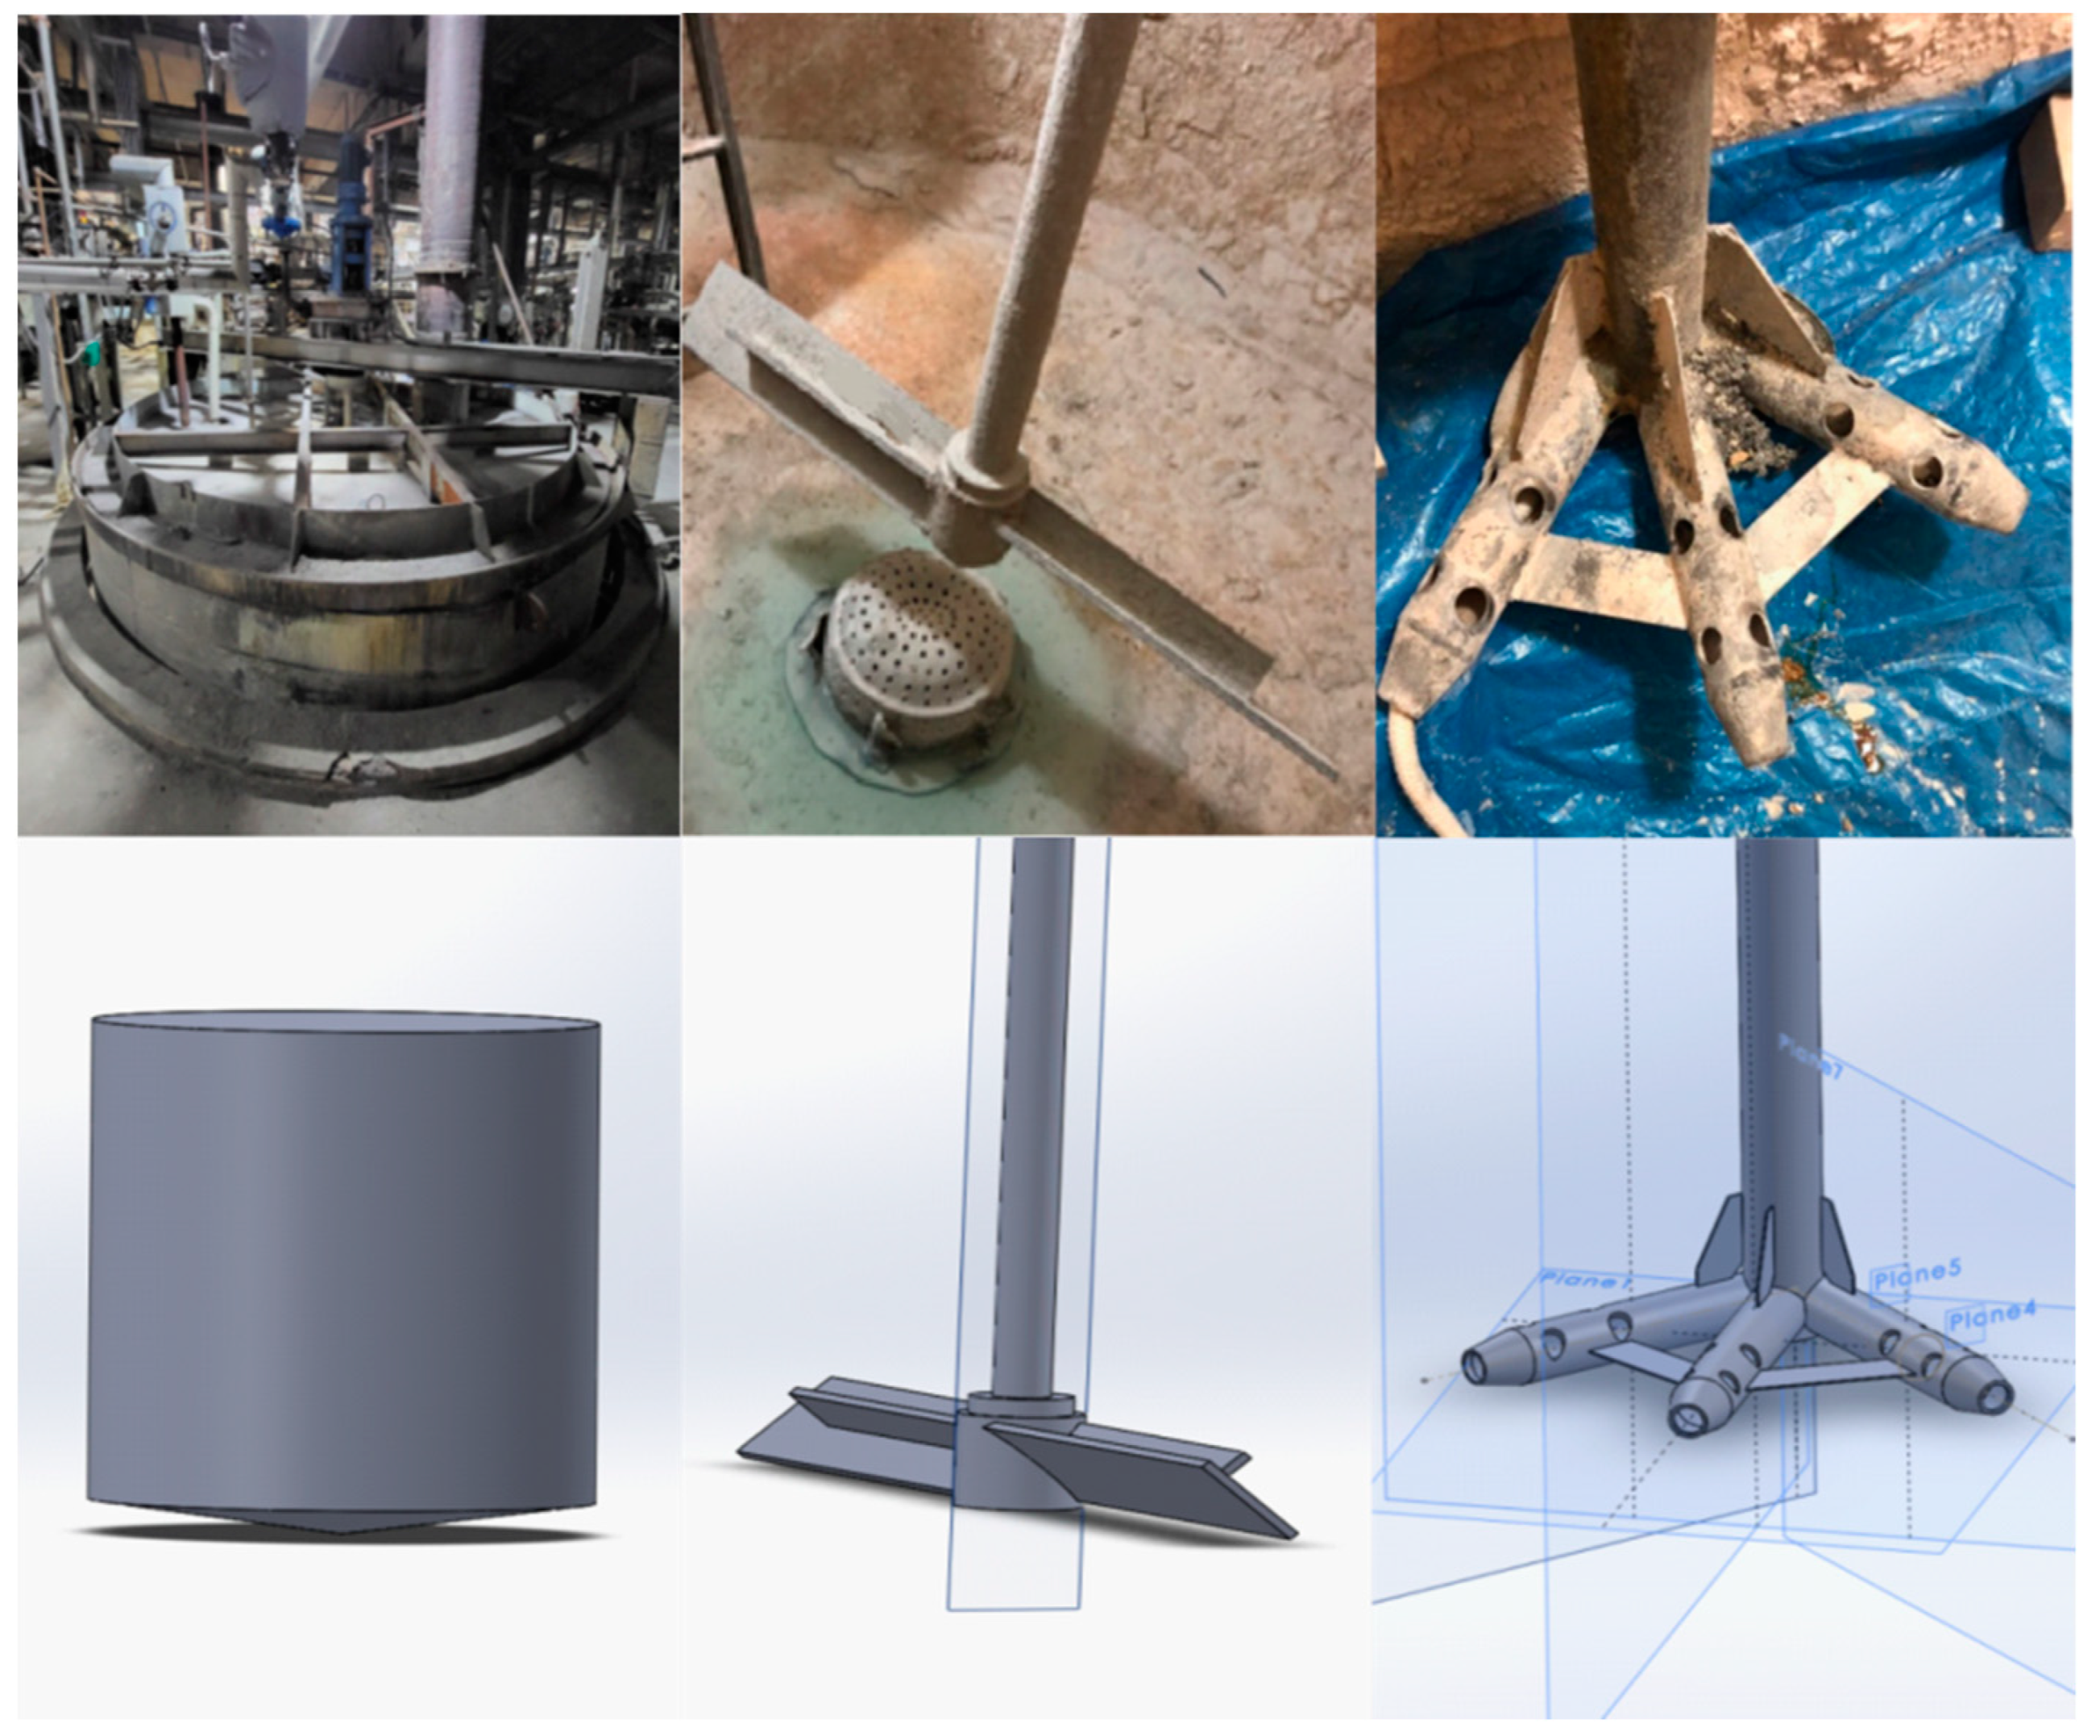
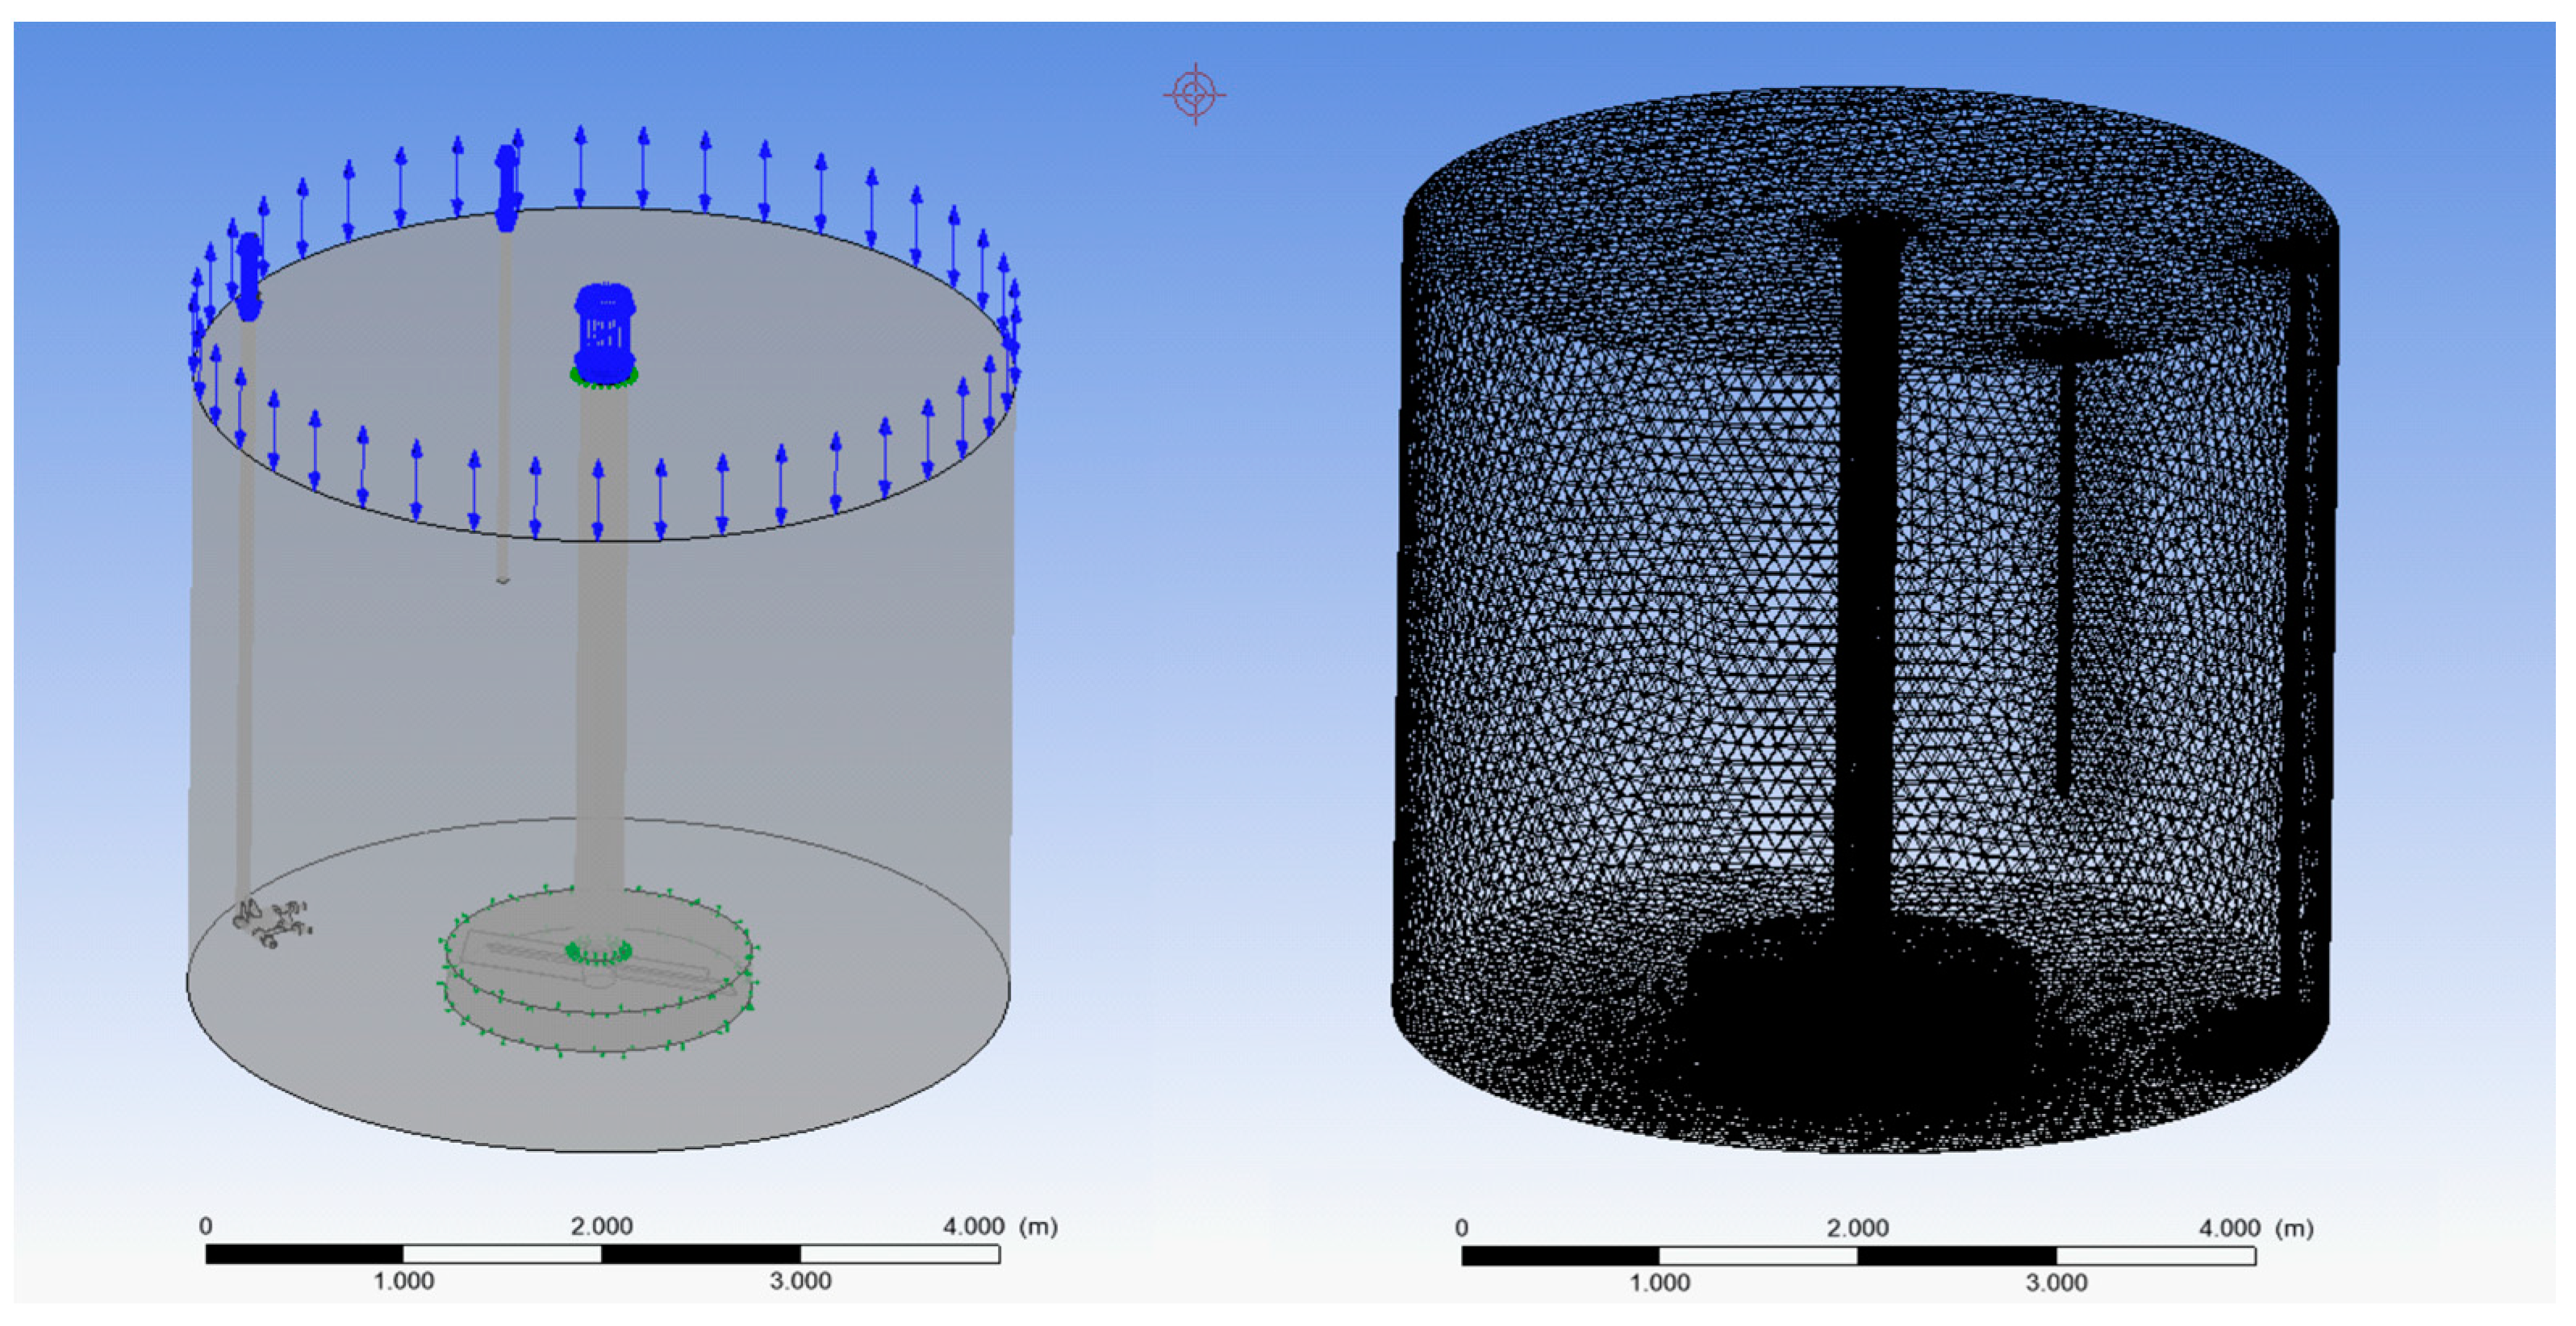
The system design consists of three essential components: the primary tank, an agitator, and a steam nozzle. The primary tank has a diameter of 3.96 m, while the agitator measures 1.44 m in length. The steam nozzle is equipped with three injection holes. The arrangement of these components is illustrated in
Figure 1.
The computational domain comprises two distinct zones: a rotating zone housing the agitator and a fixed zone without the agitator. These two domains interact via the General Grid Interface (GGI). However, the rotation of the agitator induces alterations in the cell centers at the interface, potentially impacting the precision of the computations. To mitigate this issue, a remeshing technique is employed to adjust the cell centers at each time step, thereby enhancing the accuracy of the calculations.
In total, approximately 4 million unstructured grids are generated within the rotating zone, while 6 million unstructured grids are produced within the fixed zone, resulting in a total of 10,348,194 elements and 4,885,988 nodes. The mesh generation and computational domain are illustrated in
Figure 2.
To implement the Detached Eddy Simulation (DES) turbulence modeling, 10 layers are created around the blade with a growth rate of 1.05. The value of Y+ (the non-dimensional distance to the wall) is set to 1, ensuring that the turbulence model effectively captures the flow characteristics in the vicinity of the blade.
The steam nozzle is positioned 50 cm above the tank bottom, in line with the agitator’s blades, and is approximately 1 m away from the blade tips. Additionally, the steam nozzle is configured to spray steam in three directions at a 45-degree angle. In this simulation, two different fluids are used. The first fluid is a solution of
, which is contained in the precipitation tank and maintained at a temperature of 55 °C. The second fluid is wet steam, introduced from a steam nozzle, and has a temperature of 141 °C. The properties of the
solution, wet steam, and initial conditions can be found in
Table 1 below. Additionally, for the purposes of this simulation, a solid-type seed is utilized. The particle size of the seed is less than 100 nm, and approximately 70 kg of seed is introduced during the heating procedure.
Tank wall and steam nozzle surface are set with no-slip wall boundary conditions. The open boundary condition has a zero volume fraction of
, allowing only steam to flow out through the free surface. To make the simulation as realistic as possible, steam with a turbulence intensity of 30% is injected. The seed inlet is located both at the side inlet and the central part, as shown in
Figure 3, which describes the boundary conditions.
2.3. Numerical Analysis of Single-Stage Agitator
A simulation was conducted by changing the position of the seed inlet for a 1440 mm single-stage blade currently used in the field and a 1940 mm blade, which had the highest mixing rate among single-stage blades. To validate a developed three-phase multiphase CFD code, a comparison and analysis was made between the average temperature on each plane and the temperature in the field. The code validation results are explained in
Table 2 below.
The left side of
Figure 4 represents the volume fraction of steam discharged from the steam nozzle, and the right side of
Figure 4 indicates the steam volume fraction from the agitator. Mass and heat transfer between steam and solution has occurred. Moreover, the three-phase CFD solver employed performs calculations by incorporating solid-phase into the basic momentum equation (Equation (5)). Mass transfer between seeds and the solution is not considered in this research; therefore, focusing solely on particle trajectory is sufficient. To avoid the increased computational time associated with adding mass transfer terms to the momentum equation, which is the case with the commonly used Eulerian-Eulerian method, this study utilizes the Eulerian-Lagrangian approach, setting the seeds as particle transport solids.
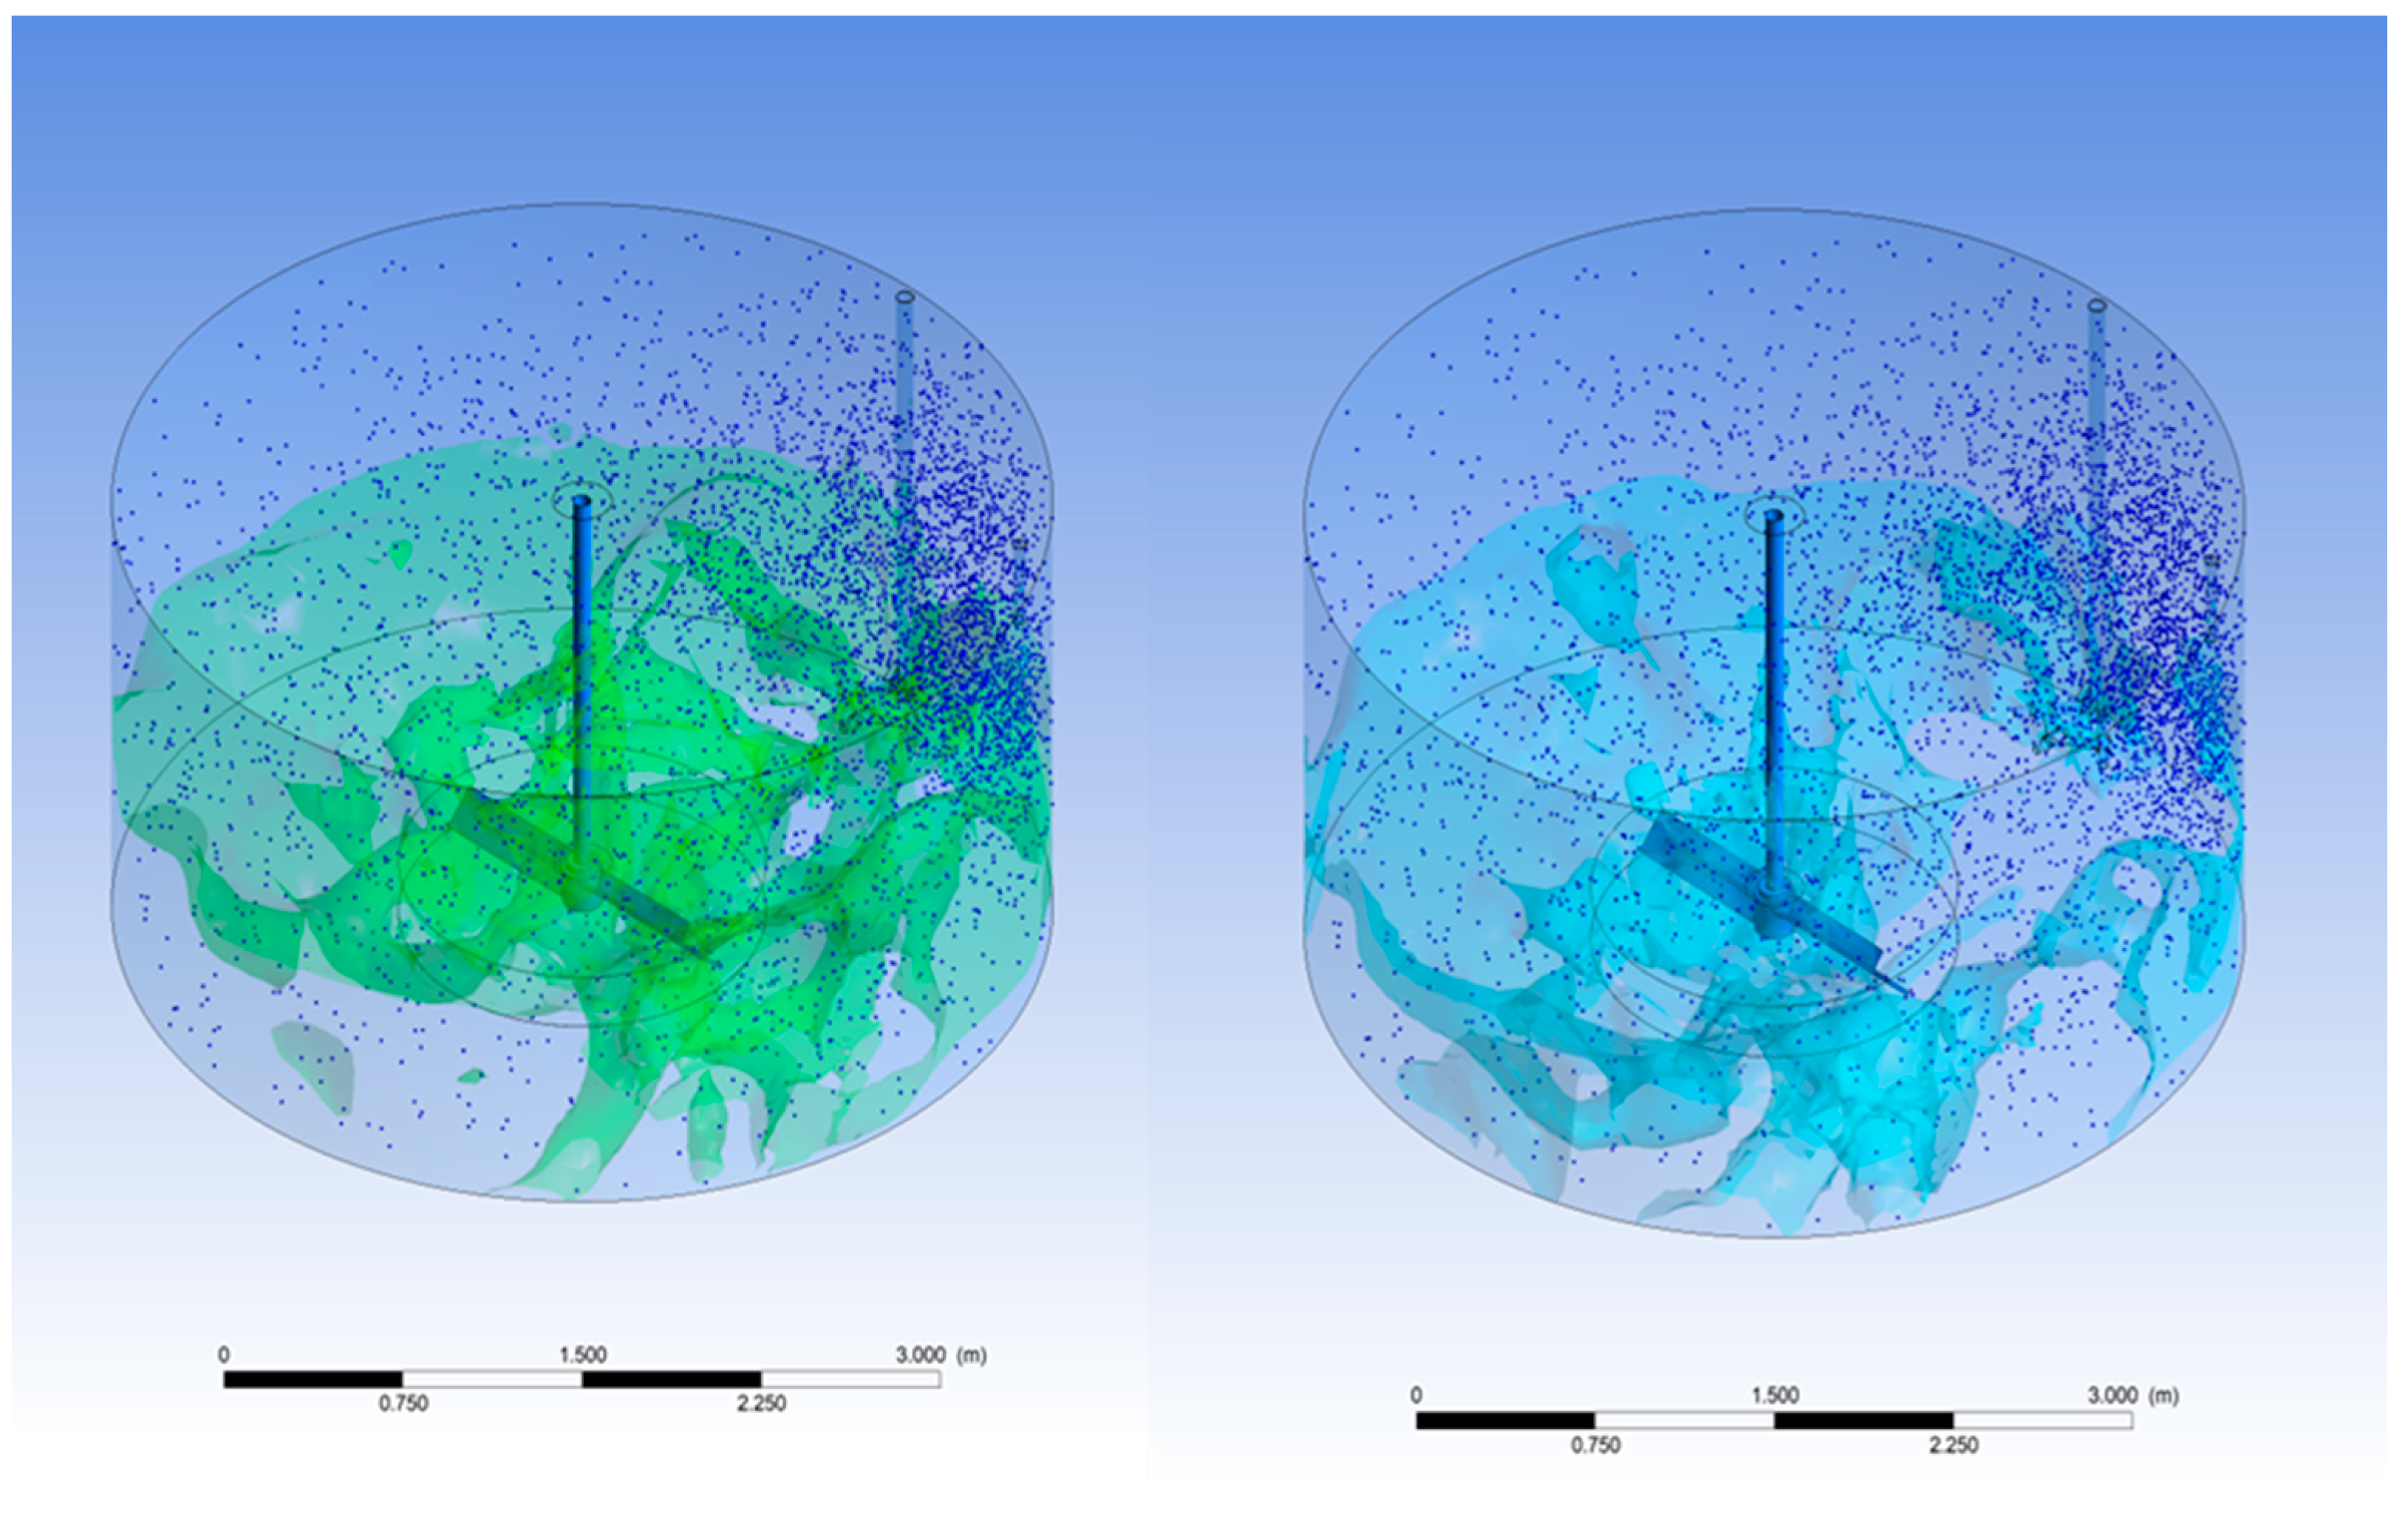
As can be seen in
Figure 5, when the seed is input through the side inlet, a large amount of seed accumulates on the left side of the tank and cannot be dispersed.
The process design consists of three essential components: the primary tank, an agitator, and a steam nozzle. The precipitation occurs most actively at the initial stage when the seed is added. Therefore, the early stage of seed addition is more critical than the state where the distribution is uniformly achieved after a sufficient time. Accordingly, this study analyzes the dispersion within 5 min after seed addition.
It is difficult to describe the agglomeration phenomenon of nano-sized particles using CFD, and it is almost impossible to represent that of primary particles. Therefore, in this paper, it is assumed that uniform-sized agglomerates grow when the injected seed is evenly distributed. Ultimately, the agglomerated TiO2 particles are targeted to have a size between 300 nm and 400 nm. When the seeds are not evenly distributed, particulates of less than 100 nm are produced by heat and water, which we call pre-hydrolysis. To make a uniform particle size distribution, the optimized blade design is required to avoid pre-hydrolysis.
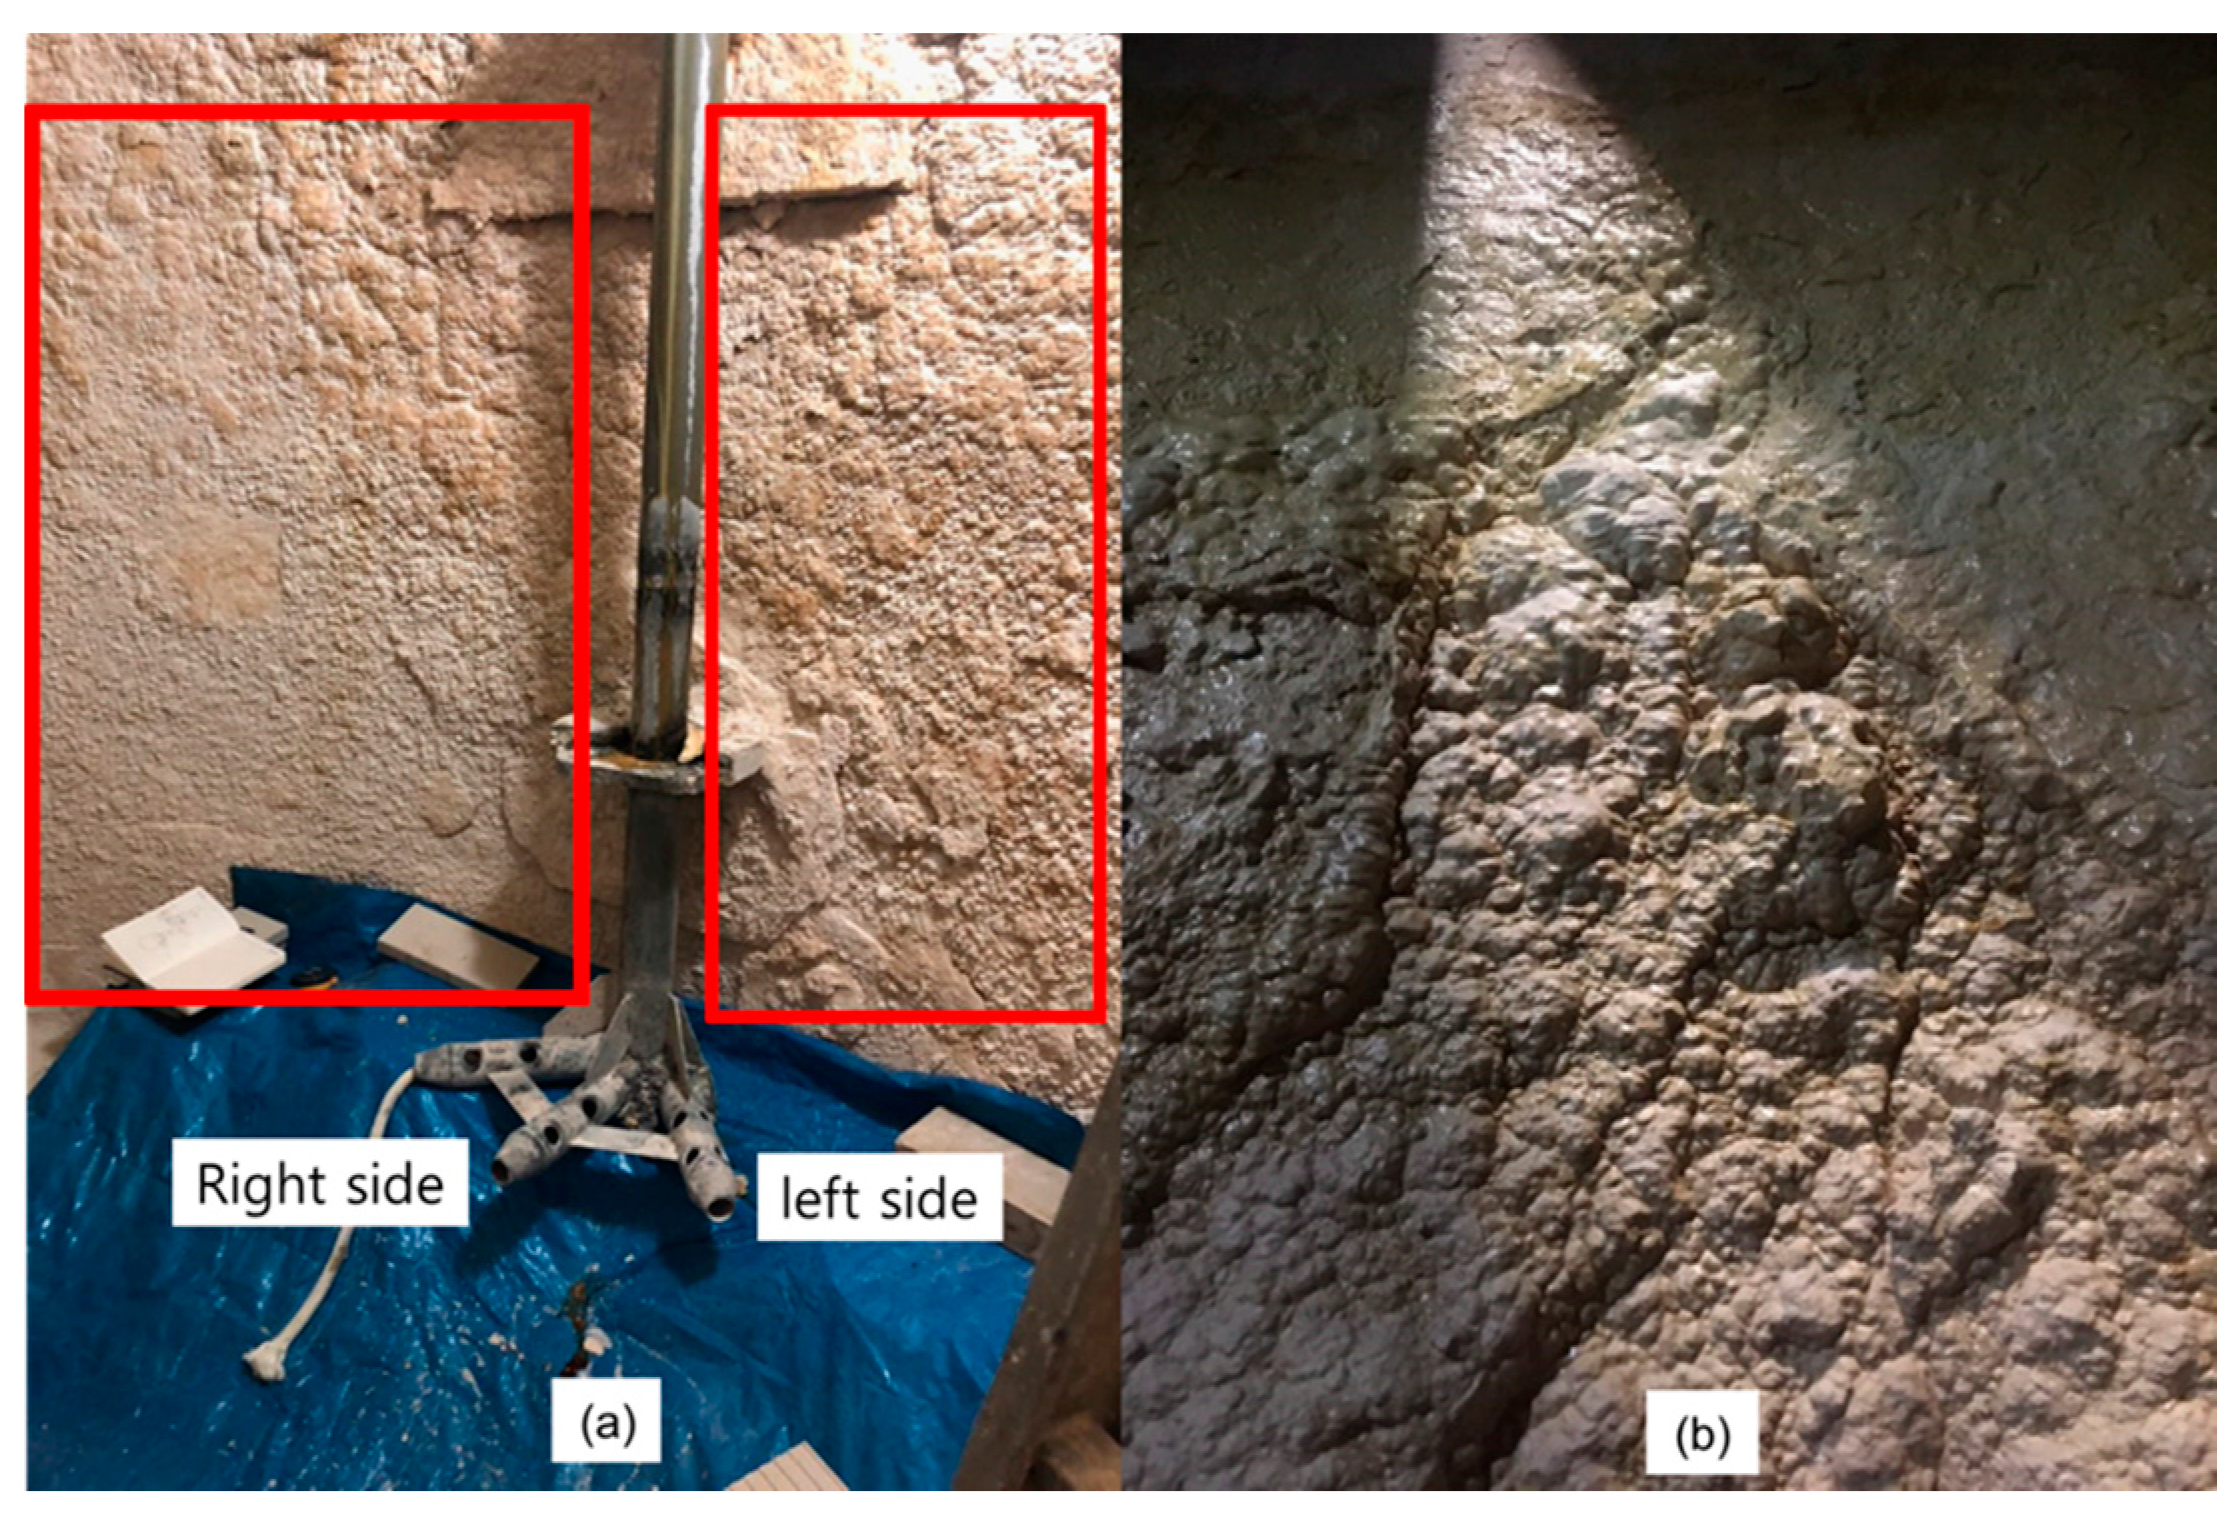
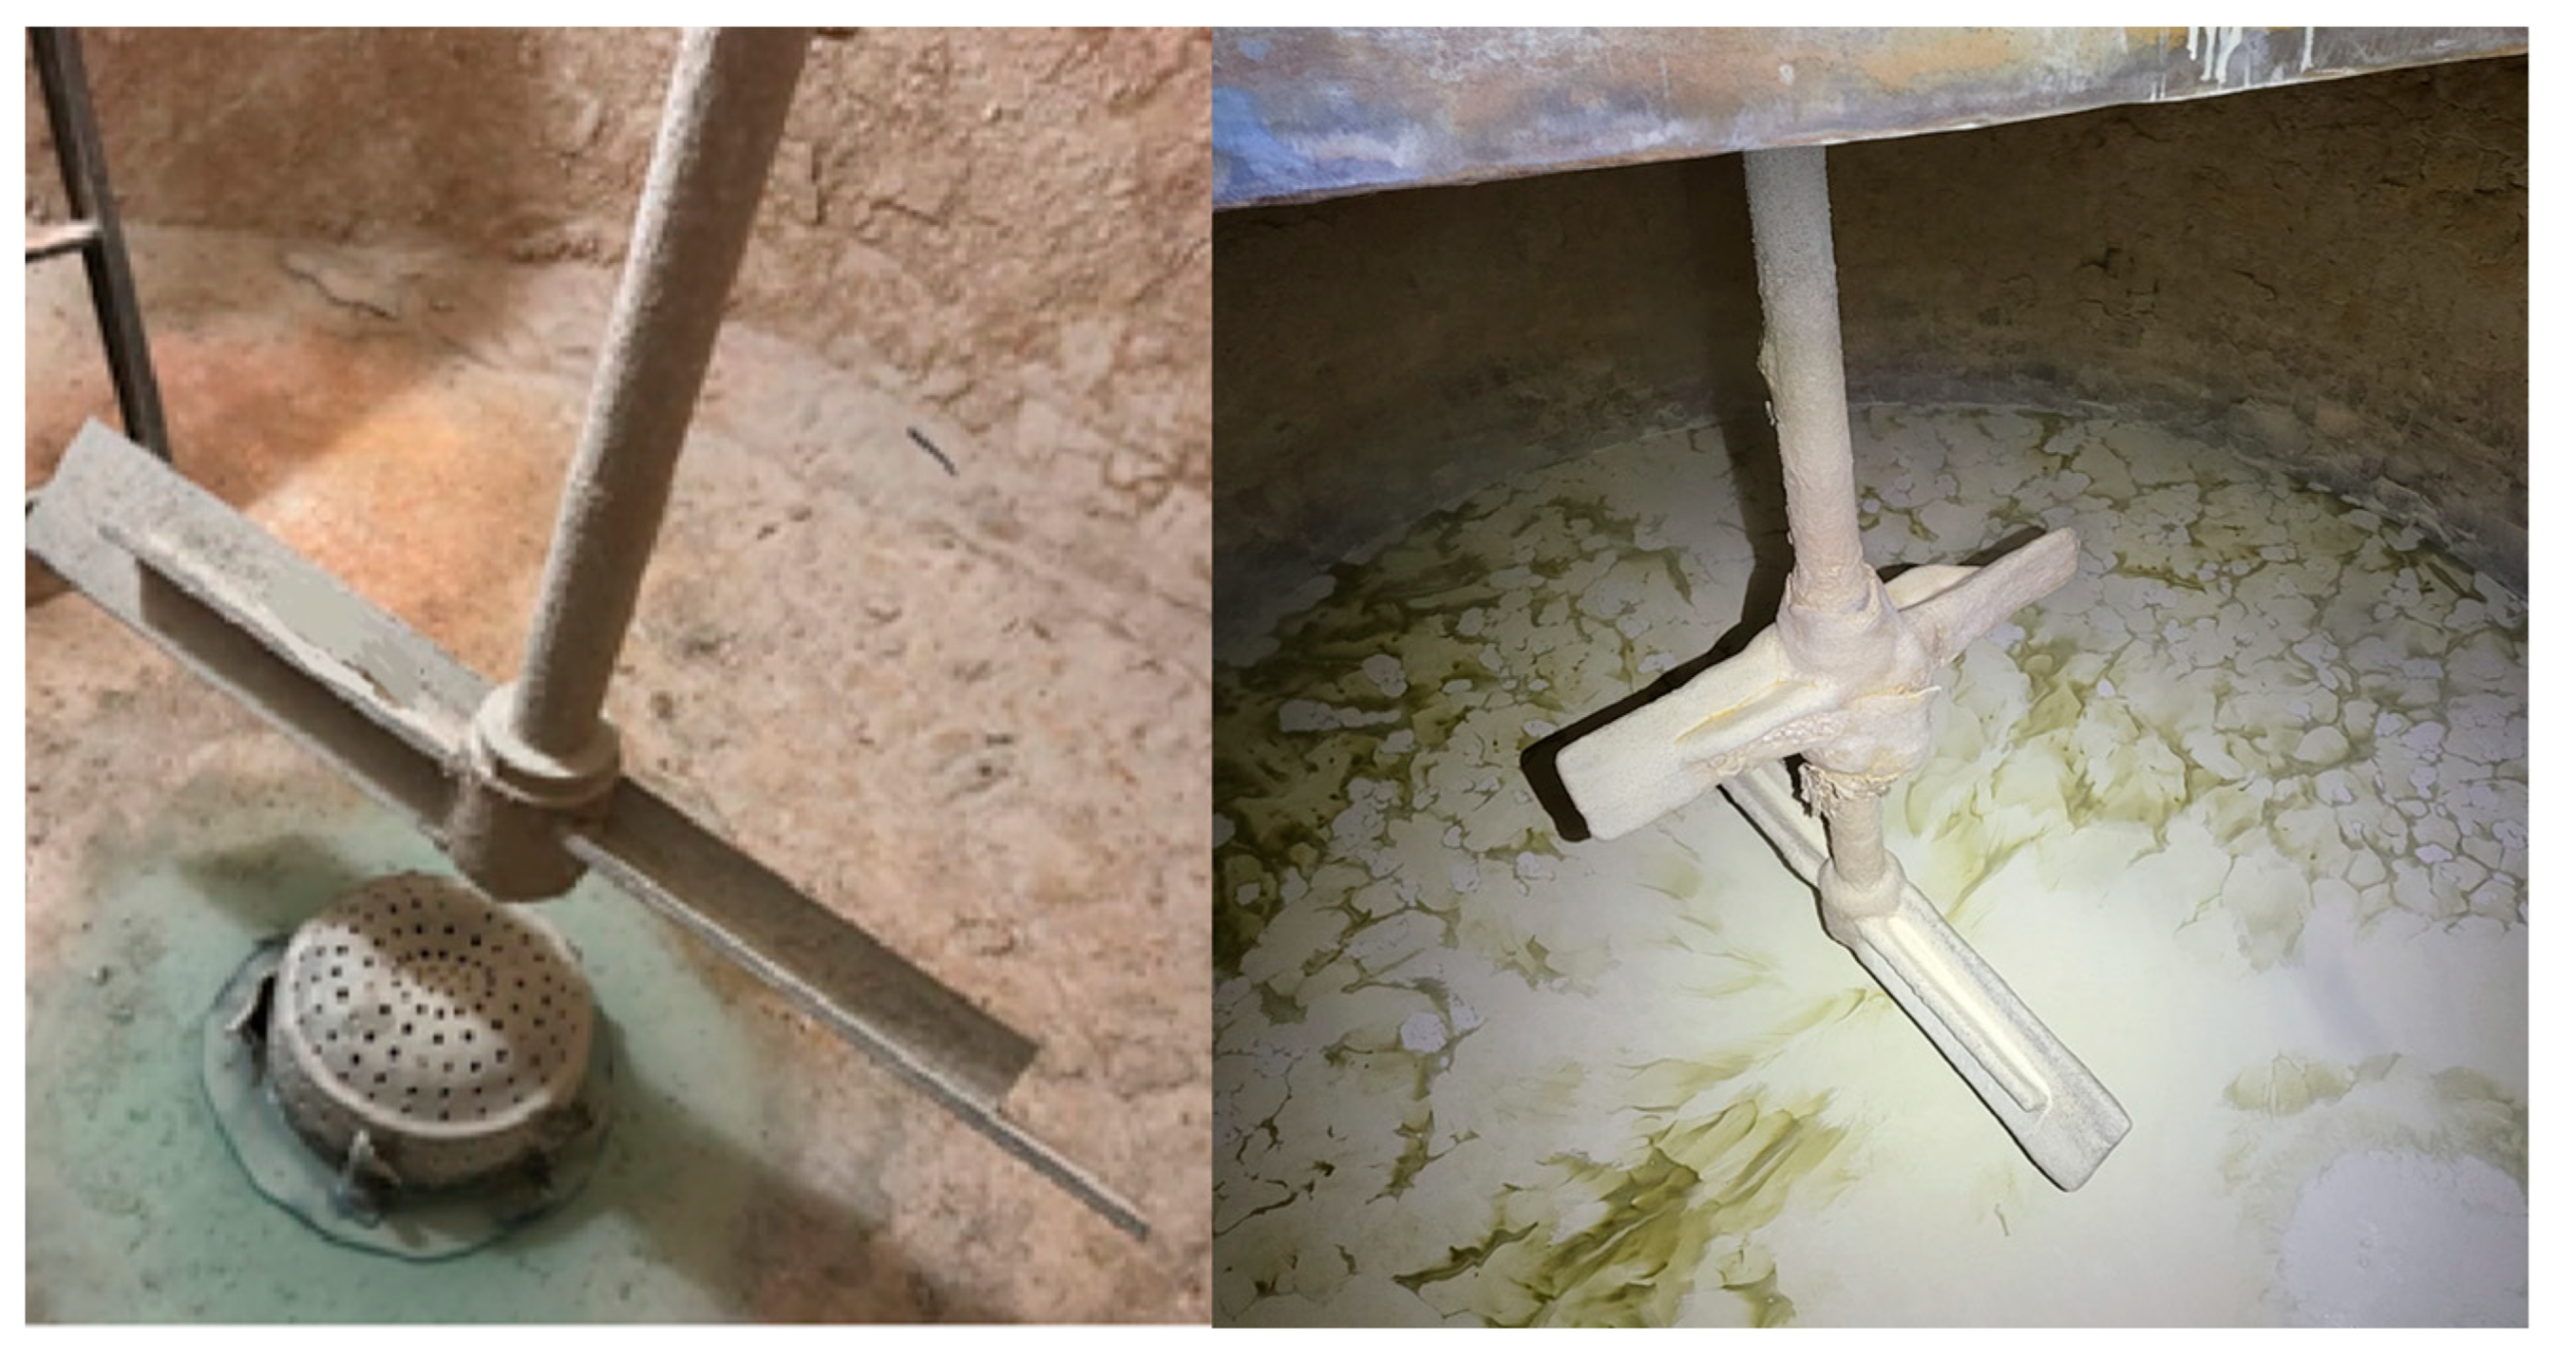
In the case of a side inlet, it was not possible to obtain uniform seed dispersion regardless of the location in a circular tank. Moreover, as shown in
Figure 6, upon observation of the actual site, a significant amount of scale was found to form in the same location where seed had accumulated, on the left side of the nozzle as predicted by the CFD simulation.
Figure 6a illustrates the region around the nozzle in the currently operated precipitation tank, demonstrating that more scale is generated on the left wall of the tank compared to the right wall.
Figure 6b provides an enlarged view of the left wall of the tank, further confirming the substantial scale formation in the area where the seed particles are not dispersed but rather accumulated, consistent with the CFD predictions.
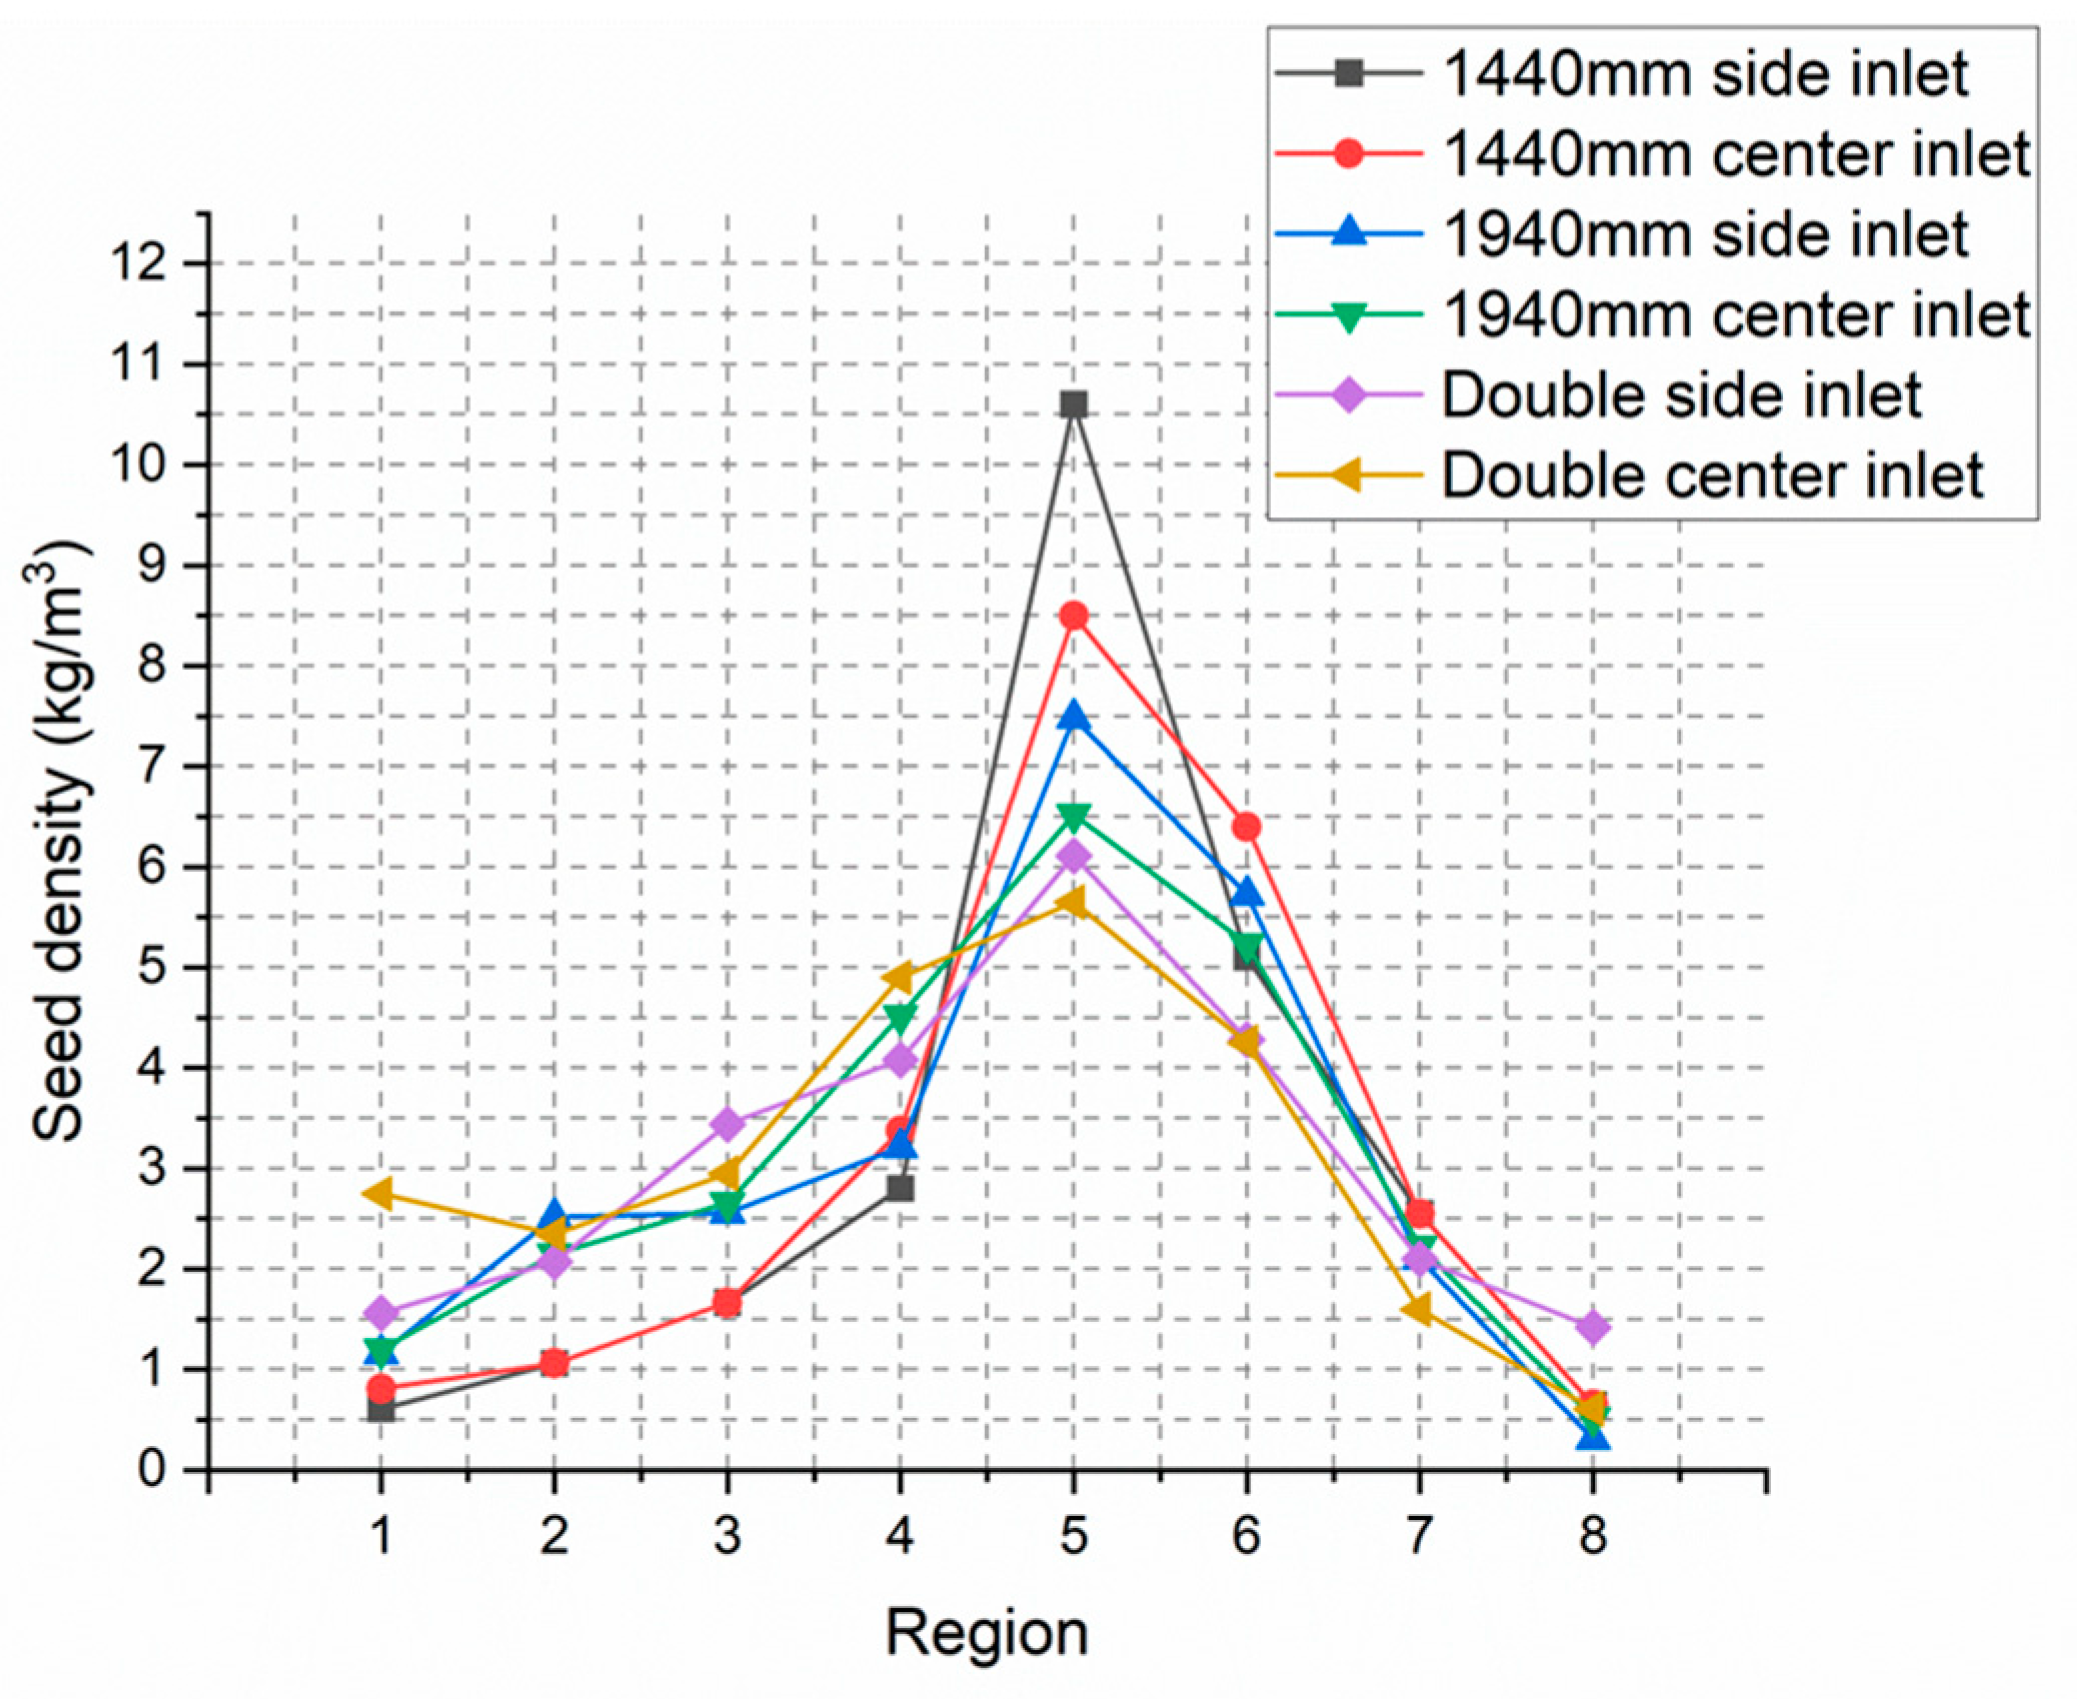
To identify the seed distribution, the tank was divided into a total of 8 regions, with 4 regions evenly distributed on each side of the agitator. Seed density was measured in each region.as shown in the following left side of
Figure 7; results are presented in the right side of
Figure 7.
As can be seen from
Figure 8, for the side inlet, both the 1440 mm and 1940 mm single-stage blades have the highest concentration of seeds in region 5 and the lowest distribution of seeds in zone 1. This is because the steam injected faster than the tip speed ratio reaches the wall and then rises along the wall. The risen seeds are rotated by the agitator and dispersed. Even upon inspecting of the interior of the tank, it can be observed that a minimal amount of scale is generated on the wall of region 1.
Additionally, the highest concentration of seeds in zone 5 can be attributed to the centrifugal force generated by the rotation of the agitator, which causes the seeds to spread towards both the central and wall areas of the tank. In terms of the relationship between mixing rate and dispersibility, it is evident that the seeds are more evenly dispersed with the more efficient mixing rate of the 1940 mm single-stage blade.
Figure 8 depicts the top view of different seed inlets for the 1440 mm and 1940 mm blades, respectively.
2.4. Numerical Analysis of Double-Stage Agitator
In
Section 2.3, the performance of the single-stage blade agitator was analyzed by changing the seed injection position. It was found that higher mixing efficiency and a more uniform distribution of the seed were achieved. Furthermore, the use of the center inlet for seed injection resulted in a more uniform distribution than the side inlet. The performance of a double-stage blade agitator with a lower blade length of 1440 mm and an upper blade length of 960 mm, installed by a distance of 1400 mm, was also analyzed. This optimized blade shape was explained other research [
17]. For comparing the mixing rate of the
solution, this study used Root Mean Square (RMS) values. The calculation of RMS is explained in Equation (6). In this study, planes were created at the bottom, middle, and top of the tank to calculate the difference between the area average temperature and the target temperature (96 °C). The meaning of 0 value of RMS indicates a mixture temperature of TiOSO4 and steam approaching 96 °C.
where
represents the average temperature of the precipitation tank and
T represents the temperature in each cross-sectional area. Comparing the RMS values of a single-blade agitator and a double-blade agitator, the results are shown in
Table 3.
As observed from the mixing rate depending on the blade type, it can be deduced that the high RMS (Root Mean Square) at the tank bottom indicates a lack of mixing due to direct injection of steam, resulting in different temperature ranges that have not yet homogenized. Additionally, at the tank’s upper portion, the presence of thermal interaction with the air unavoidably leads to high RMS values. In prior studies, the optimized double-stage blade was identified as having the lowest RMS, signifying the highest mixing efficiency. This implies that it can effectively adjust the internal tank temperature to 96 degrees.
Consequently, when compared to the low-efficiency single blade, the optimized double-stage blade exhibited the highest mixing rate, making it the preferred choice for achieving the best seed distribution. This assertion is further substantiated through an analysis of the seed distribution.
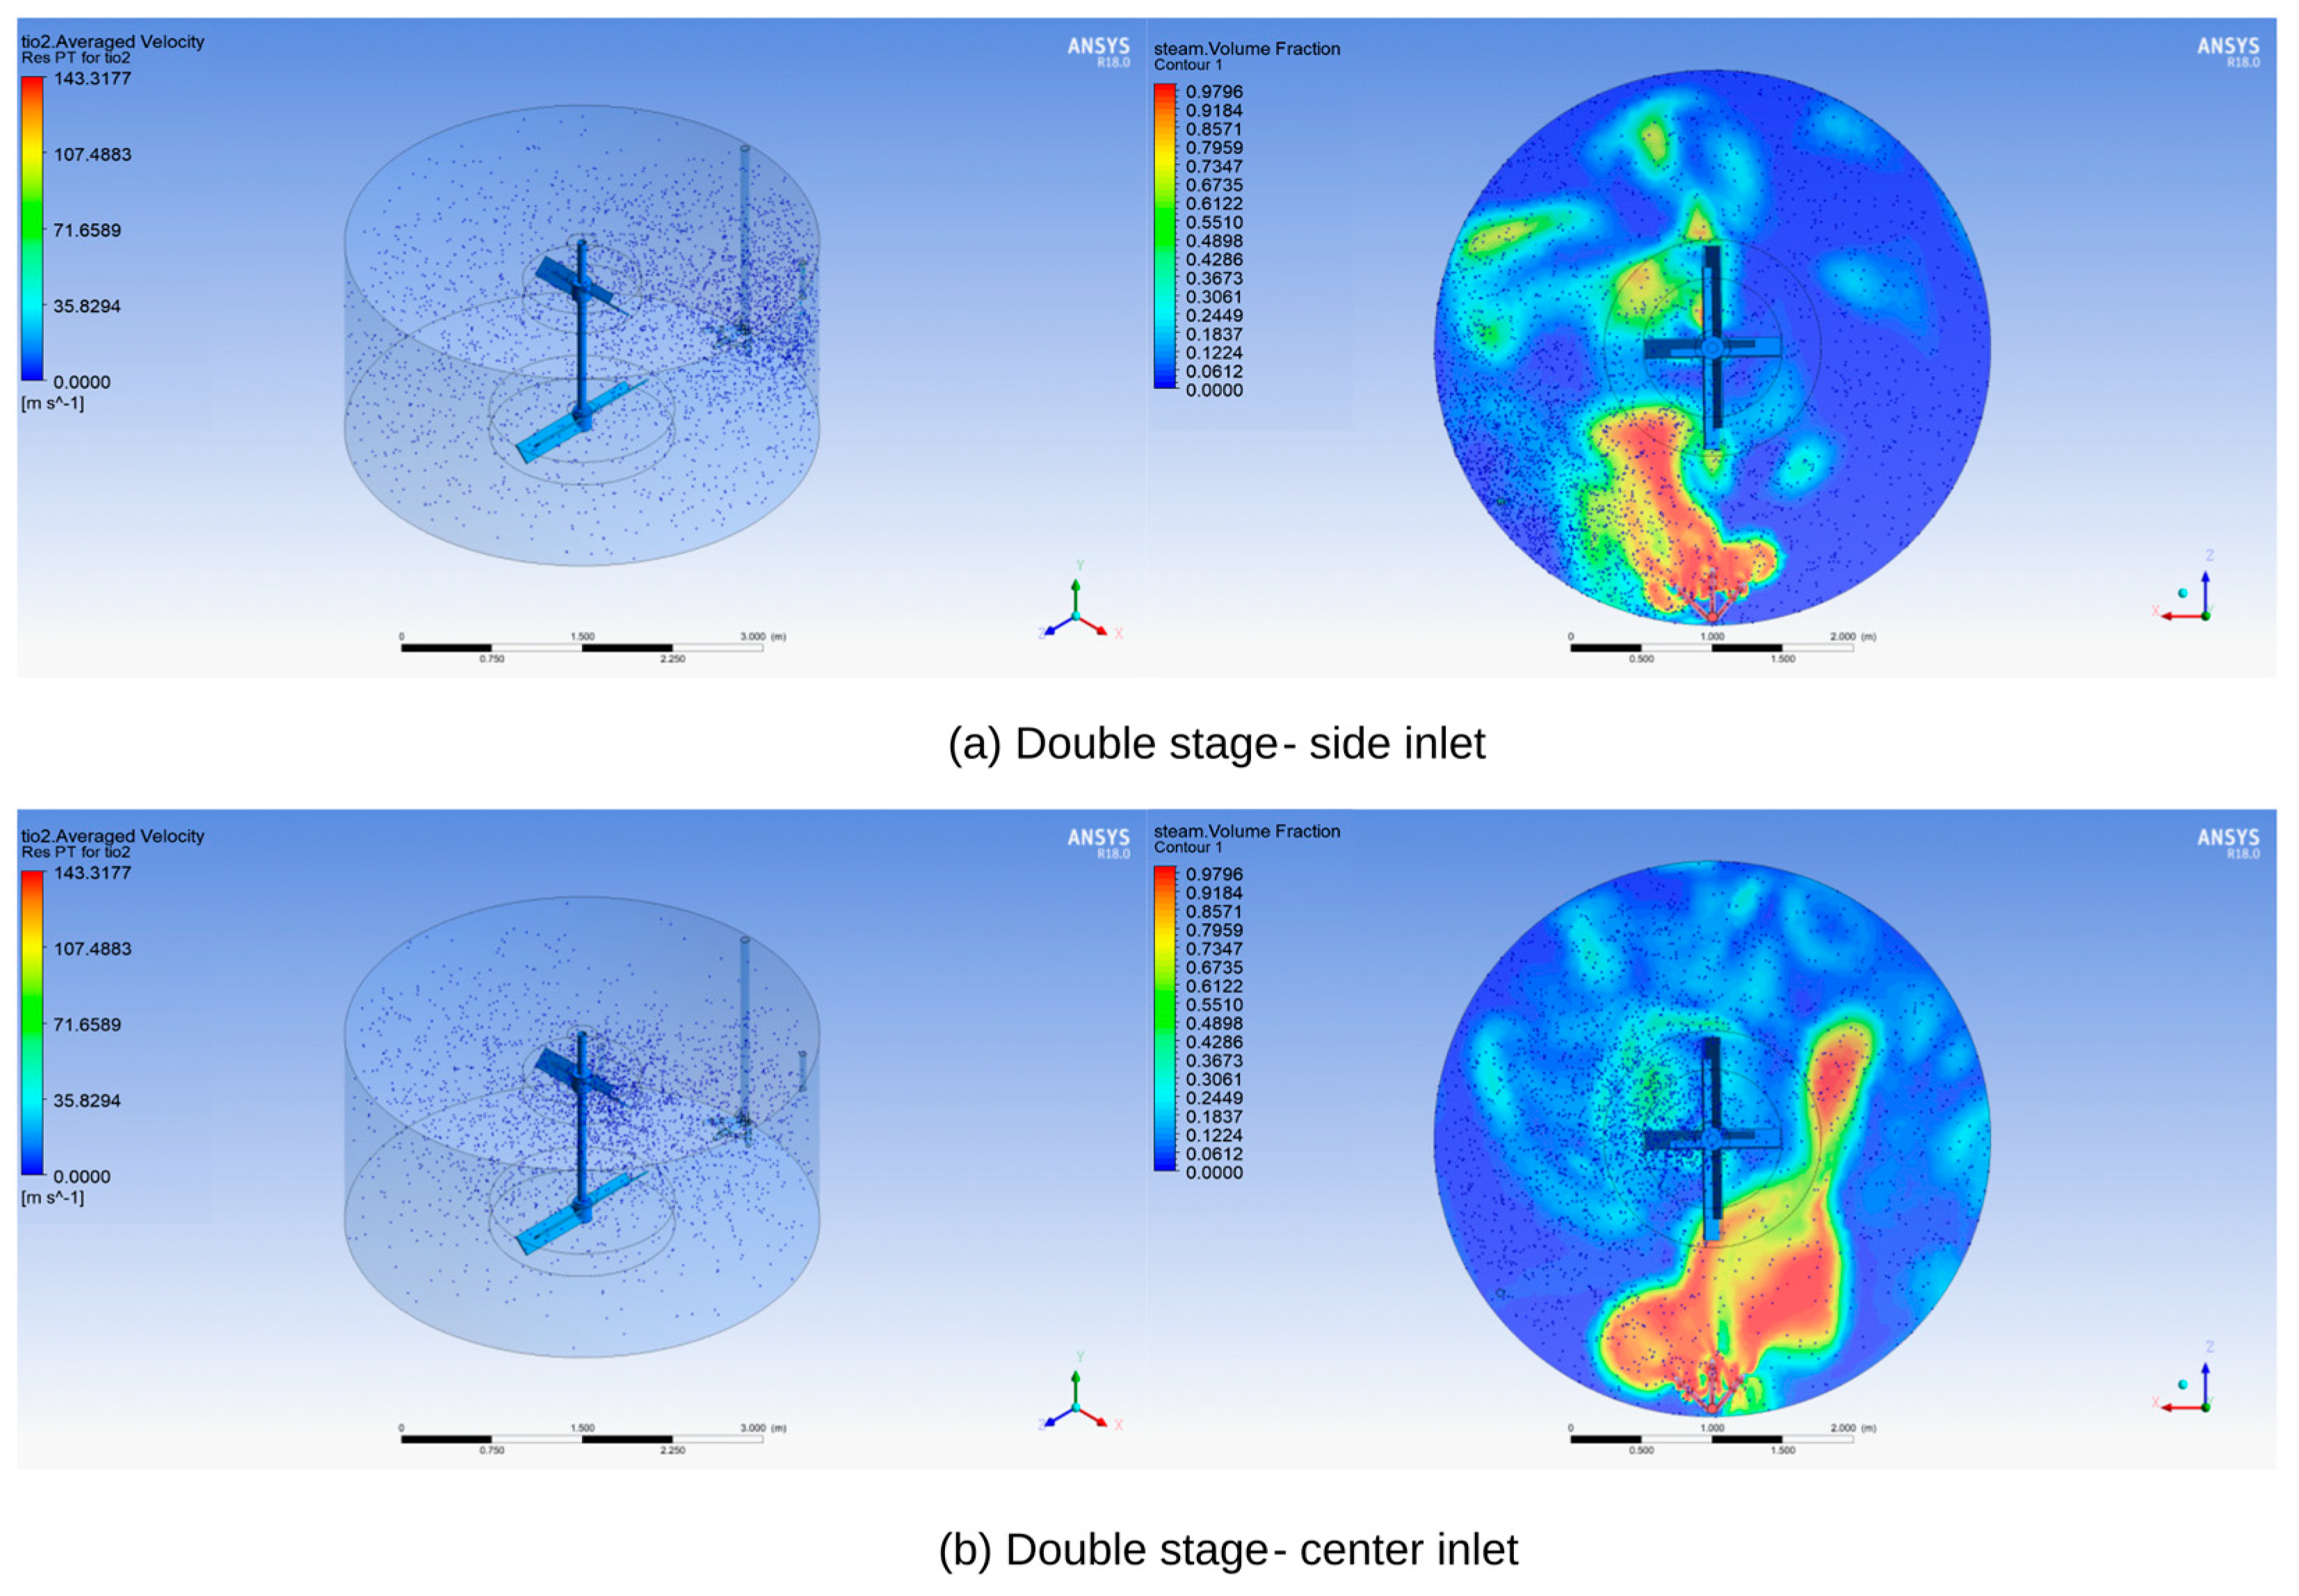
Figure 9 below illustrates the particle trajectory of the seed in the double-stage blade, demonstrating that even with a side inlet, it achieves a more uniform particle distribution compared to the single-stage blade. Furthermore, employing the center inlet results in an even more consistent particle distribution.
A uniform seed distribution is considered a fundamental factor in achieving uniform TiO2 agglomeration and maintaining consistent particle sizes. This uniform seed distribution serves as the basis for ensuring that the TiO2 particles generated can exhibit consistent efficiency in subsequent processes such as washing and bleaching. This, in turn, allows for effective removal of heavy metal contents. Consequently, it can be said that the most critical element for achieving color stability is indeed a uniform seed distribution.
For quantitative analysis, the tank was divided into eight regions as shown in
Figure 7, and the seed density in each region was measured again.
It was confirmed that there is no change in the total amount of seed, and the distribution of seed for each blade can be seen in
Table 4 and
Figure 10.
As shown in
Figure 10 above, for the single-blade configuration, it can be observed that as the mixing rate increases, the seeds that were initially concentrated in region 5 move to other regions. However, in the case of both the 1440 mm and 1940 mm blade configurations, attempts to distribute the seeds evenly at the ends of the tank using side seed inlets were unsuccessful. Noticeable effects were only observed when using the center seed inlet. On the other hand, there is a slight difference between the center inlet and side inlet configurations in the optimized double blade with a high mixing rate. By slightly shifting the distribution of seed towards region 1 through the center inlet, a more uniform precipitation process can be achieved.
3. Lab Scale Experimental Results
The CFD analysis confirms that the double-blade agitator achieves a more effective mixing rate of solutions in comparison to the presently utilized single-blade agitator. To ensure the verification of chemical reactions during the seeding process, it is essential to conduct experiments on a laboratory scale as well as real-world field tests.
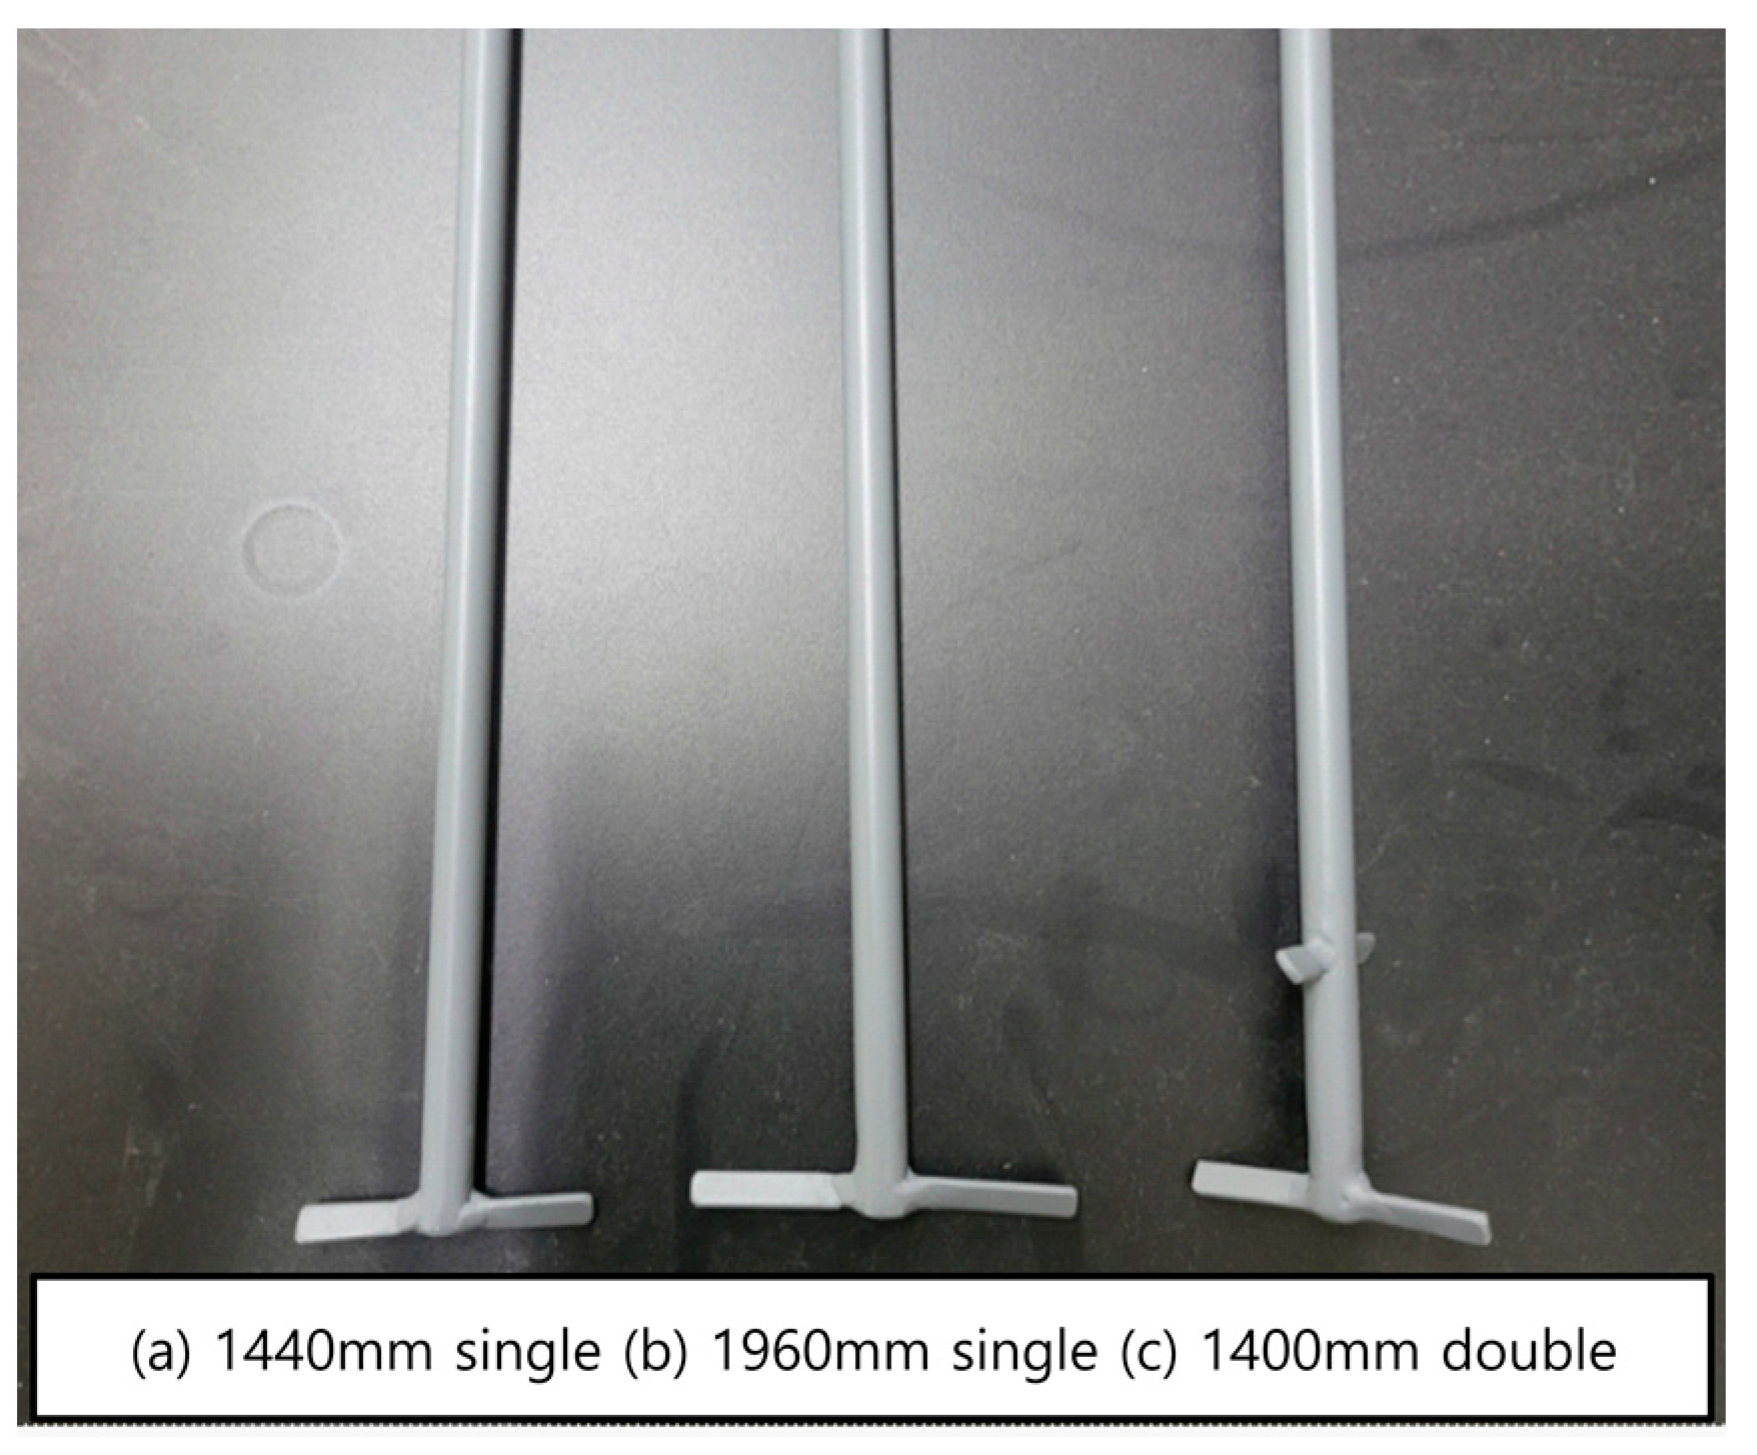
Firstly, a reduced-scale model experiment was performed using an existing precipitation tank system at a proportion of 1:32.8, with the specific dimensions of the scaled-down model outlined in
Table 5.
In
Figure 11 below, the explanation includes (a) the 1440 mm scale reduction model, (b) the 1960 mm scale reduction model, and (c) the double-stage blade scale reduction model. These three primary blade variations underwent testing to assess the agitator’s performance. The precipitation experiment setup is illustrated in
Figure 12, with a detailed test procedure outlined in
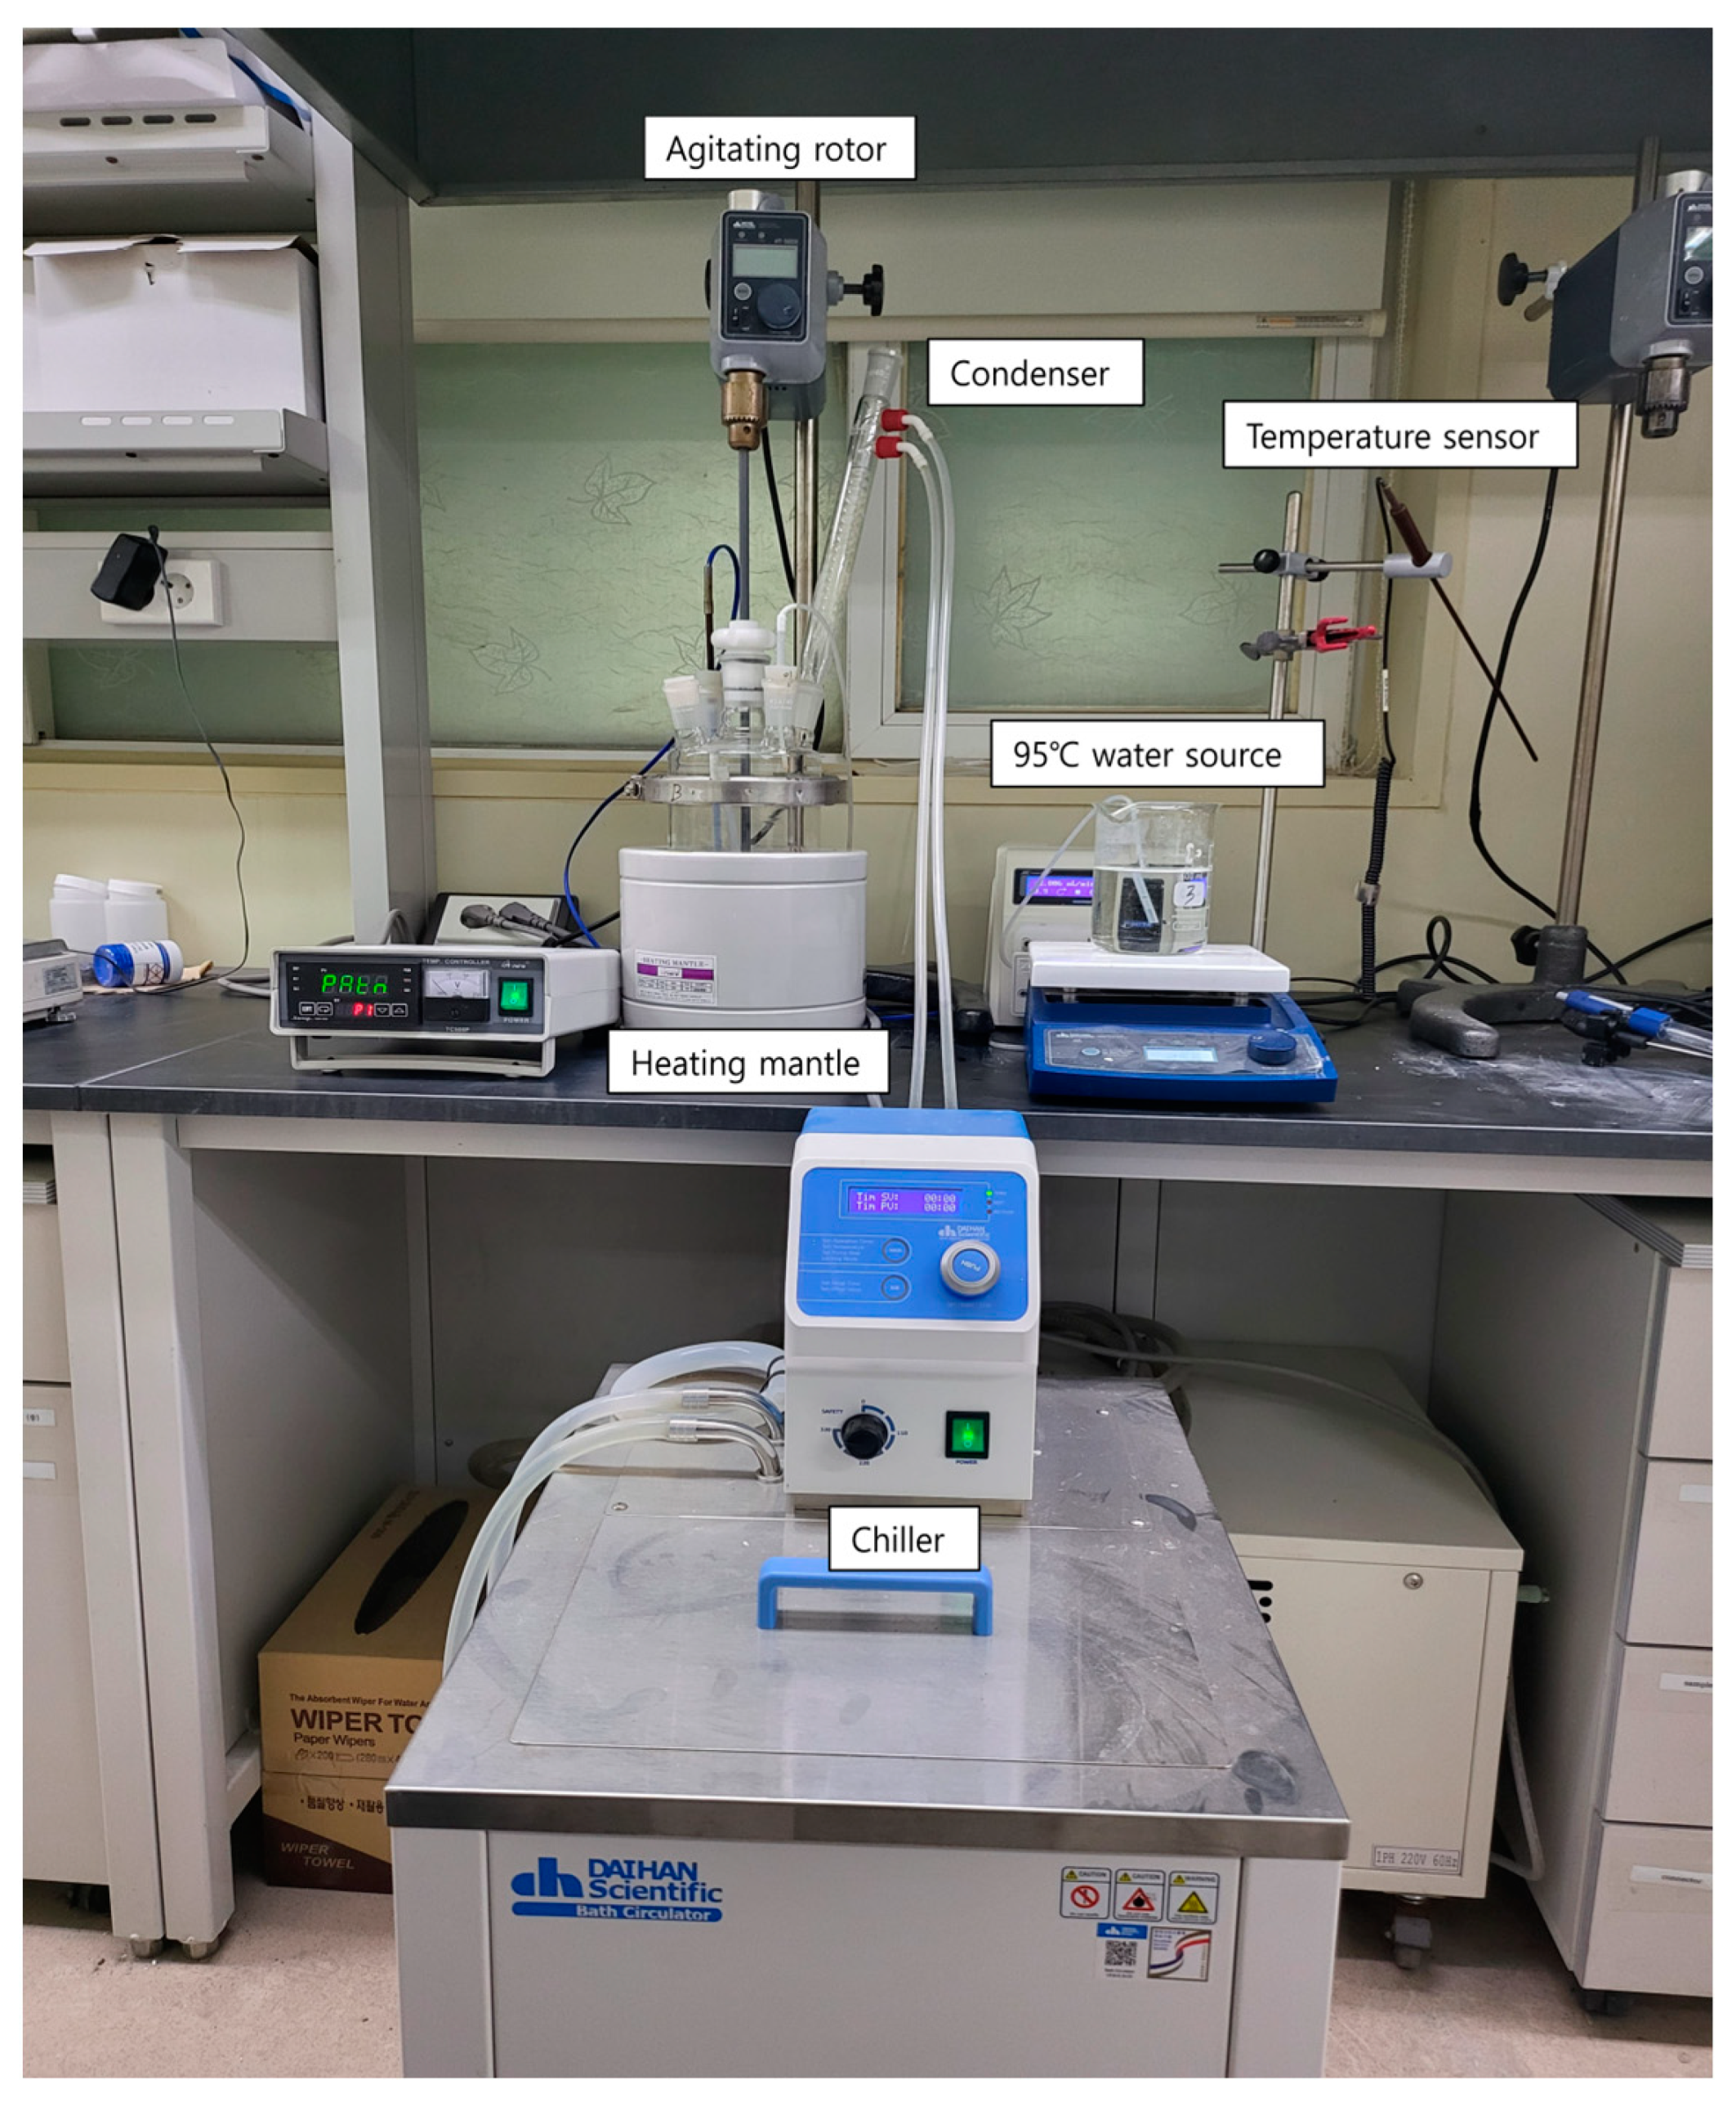
Table 6 further below. The tests were conducted within a glass reactor. In the real-world application, steam is employed to raise the temperature. However, due to constraints in laboratory-scale experiments, which involve challenges in steam generation and maintaining a steady supply, the temperature was elevated using a heating mantle and water at 100 °C. Additionally, a condenser linked to a coolant system was installed to prevent concentration effects arising from evaporation.
The temperature control system was established to operate automatically within set intervals. This system, which incorporates a temperature sensor and a Temperature Controller linked to the heating mantle, is employed for the single decomposition process using a solution. The concentration of titanium (Ti) and the quenching process typically range from 180 g/L to 220 g/L and are treated as proprietary technology. Hence, a specific amount of water at 95 °C is introduced into a beaker to ensure a stable test environment. The heating process is facilitated by a heating mantle, with any evaporated water condensed and channeled back through a condenser and chiller. The precipitation process involves several stages, including initial heating, seed injection, aging, secondary heating, and temperature stabilization. Seed injection is initiated once the solution temperature reaches 96 °C. The uniform dispersion of the seed into the tank is a critical aspect of the seed injection process, maintaining consistency with the overall procedure. The rotational speed of the agitator is a vital determinant in these laboratory experiments.
Upon completion of the precipitation process, the mother liquor undergoes filtration using a 5-micron filter until the residual iron content diminishes to 100 mg/L. Post initial washing, water is applied to the resultant cake, followed by re-pulping. The resulting solution is combined with sulfuric acid and aluminum powder and heated to 70 °C for the bleaching process, effectively eliminating chromium, arsenic, and iron. A secondary washing process is then conducted, similar to the initial washing, until the residual iron content reduces to 3 mg/L. The resulting solid undergoes calcination in an electric furnace, where the temperature gradually rises from 350 °C to 950 °C over a two-hour period, maintained at 950 °C for one hour. Subsequently, the solid is pulverized utilizing a pulverizer equipped with a 0.2 mm mesh. Analytical equipment, including ICP-OES, ICP-MS, XRF, and Microtrac, is employed to evaluate the heavy metal content, particle size, and distribution.
To ensure experimental similarity, selecting the Reynolds number would lead to a high RPM that exceeds testing capabilities. Consequently, we opted for the lab experiment to utilize the Froude number Equation (7), which accounts for inertia and gravity.
where
Fr is the Froude number,
V is the velocity of the agitator blade (m/s),
g is the acceleration due to gravity (m/s
2), and
L is the diameter of the impeller (m). The revolutions per minute (rpm), linked to the Froude number, were modified using checalc.com, a web application employed for computing different physical properties relevant in chemical experiments. This online tool is capable of scaling operations both up and down, based on conditions like maintaining consistent tip speed, power per unit volume, identical Reynolds number, and Froude number, among others, utilizing authentic field data. Details of the findings are outlined in
Table 7.
Throughout the heating process, bubbles naturally formed in both the actual field and laboratory experiments. In the actual field, these bubbles typically had a negligible size. However, in the lab tests, these bubbles had a significant impact on the mixing rate. To mitigate this effect, the initial heating was carried out with minimal heat for an extended period before seed injection. However, during the second heating stage, which required a temperature of 110 °C, it was challenging to avoid bubble formation in the lab-scale experiment. Additionally, due to the influence of these bubbles, it was difficult to discern the differences between the side inlet and center inlet methods of seed injection in the experiments.
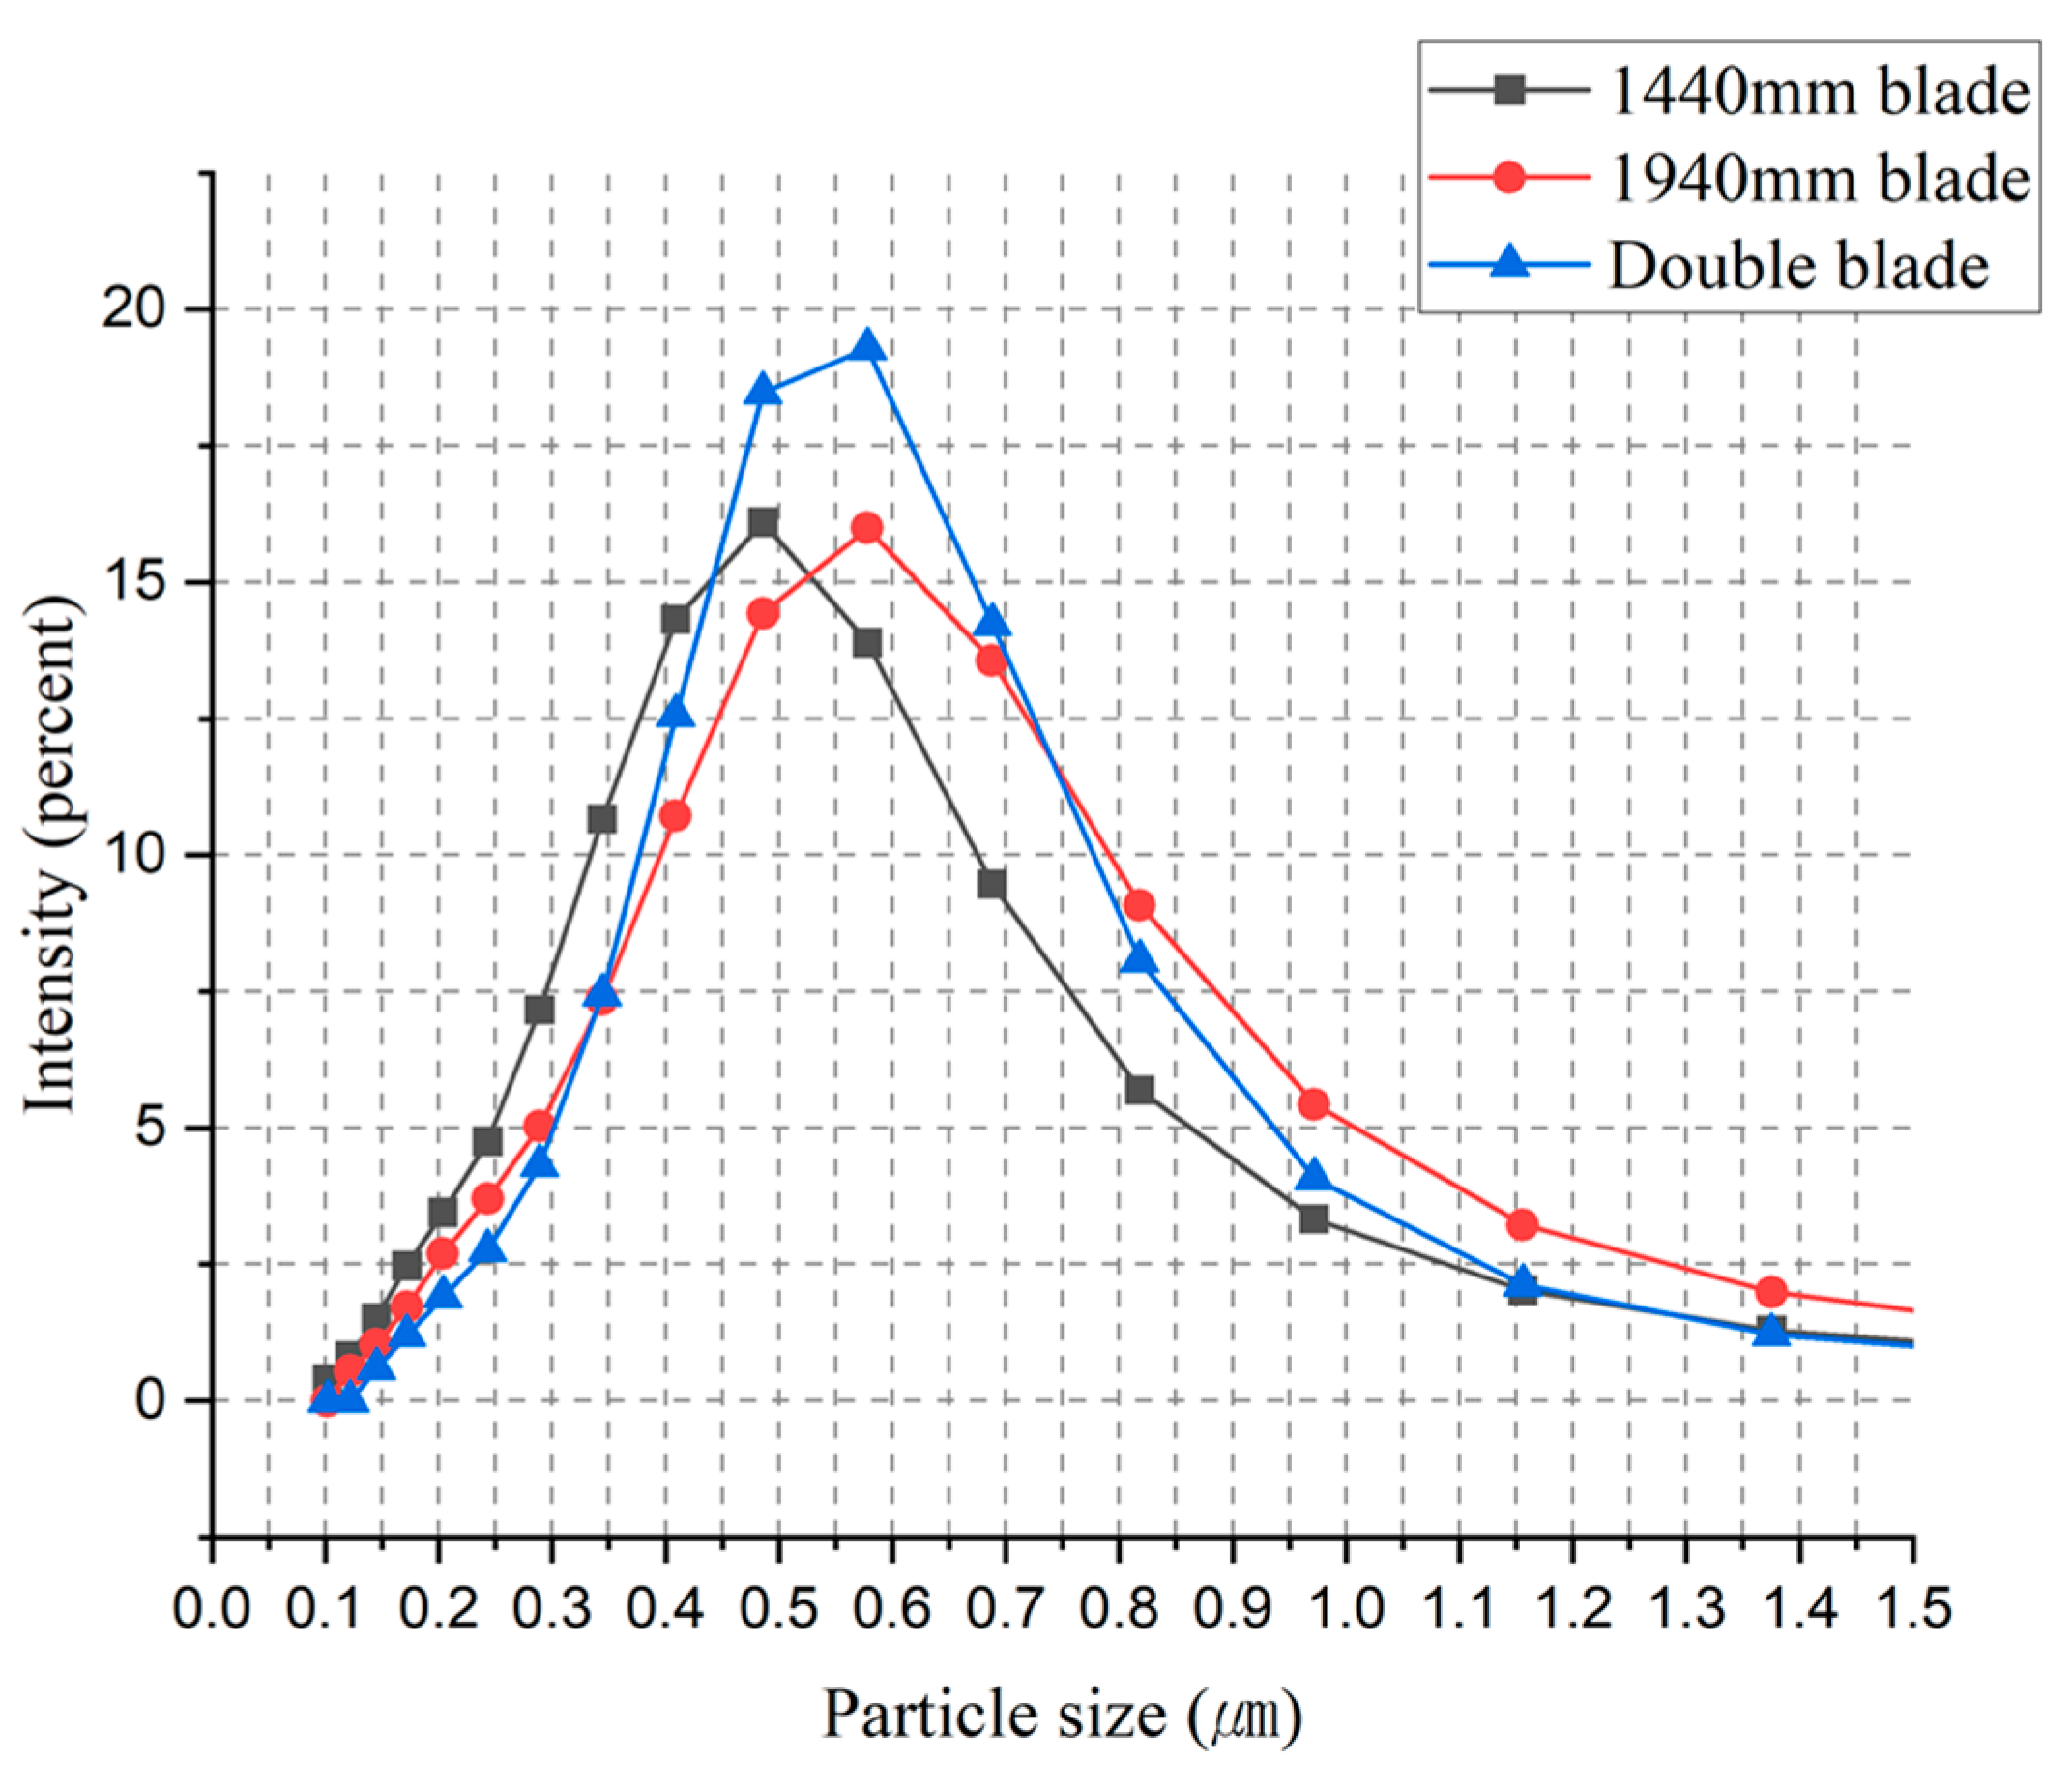
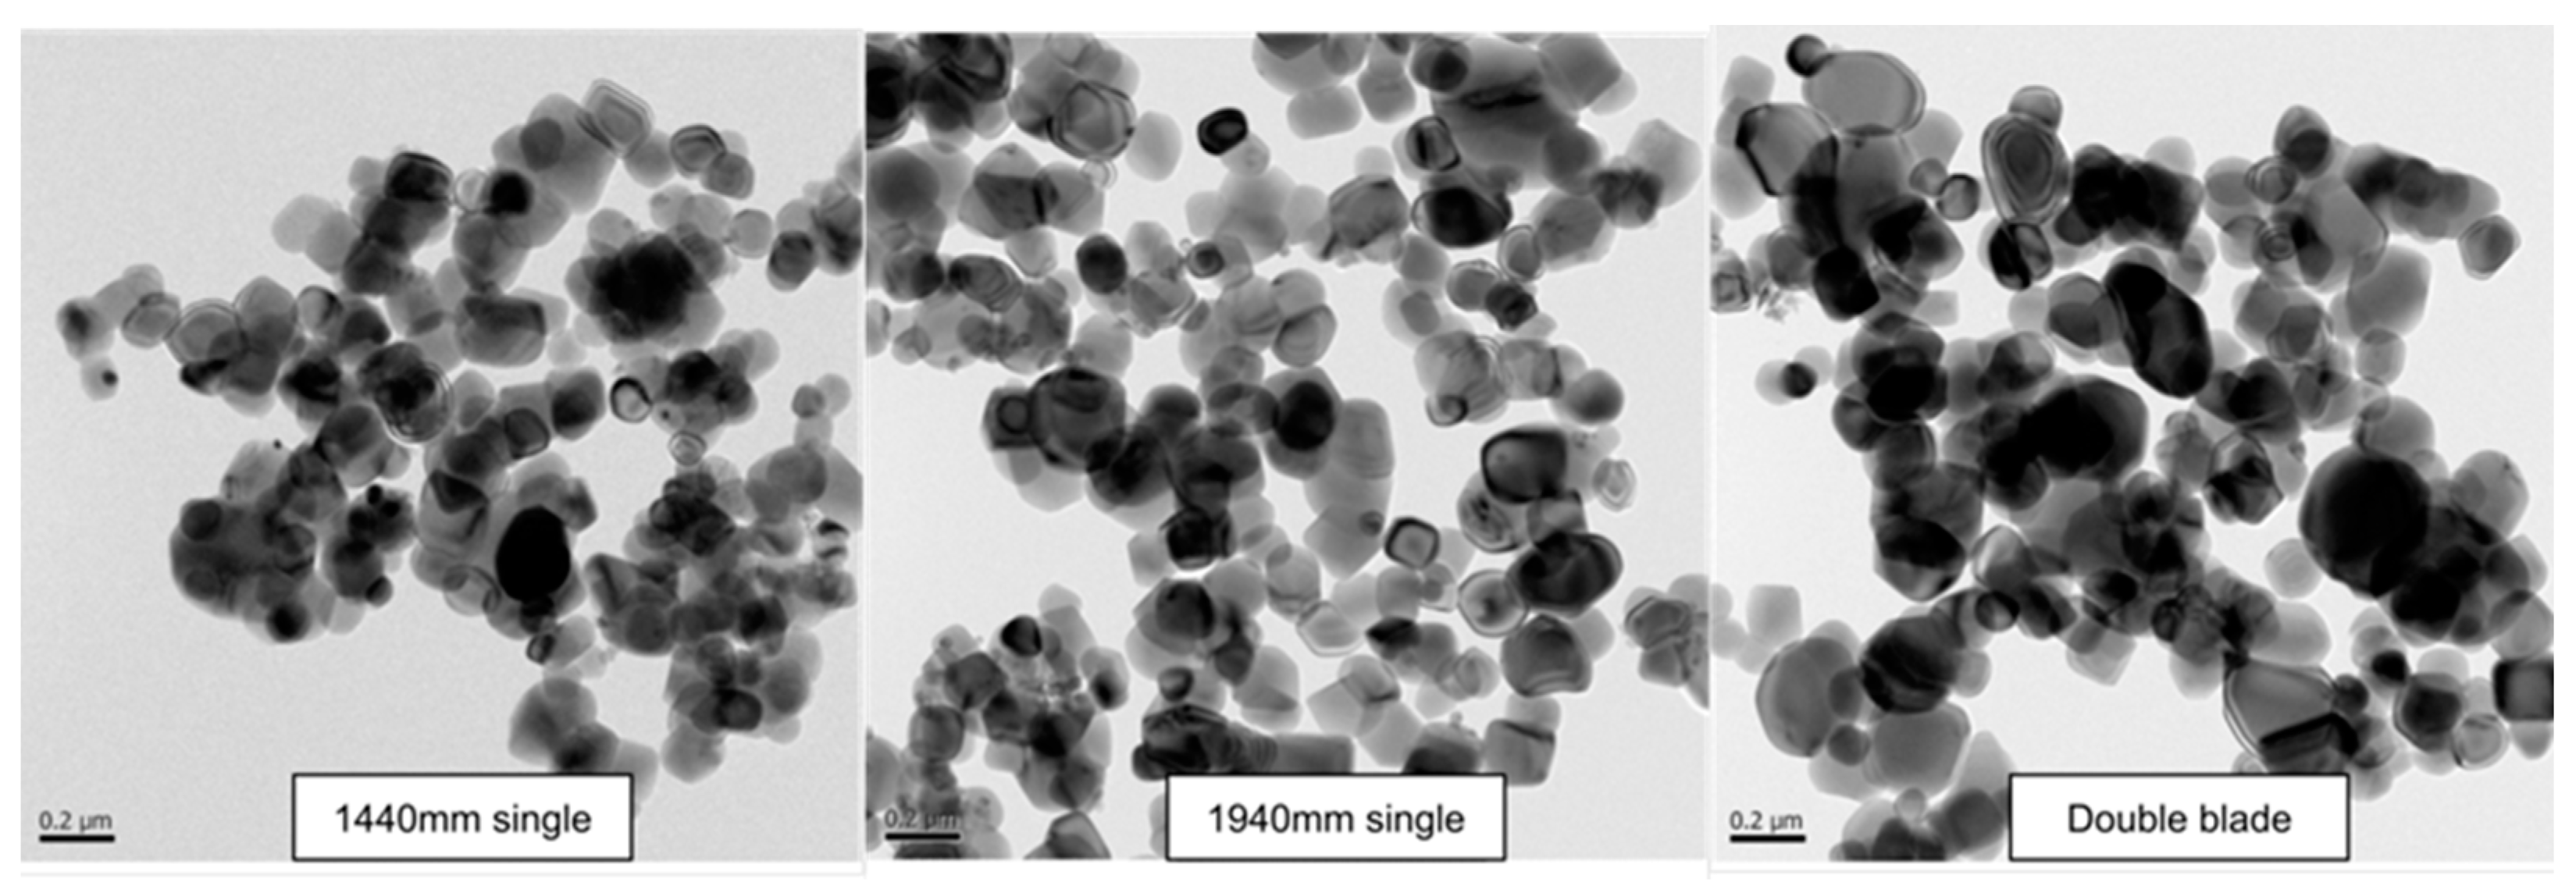
Nonetheless, as illustrated in
Figure 13 below, the particle distribution in experiments utilizing a double-stage blade configuration was superior to that of a single-stage blade. Each test was conducted three times, and the average data from these test results were compared.
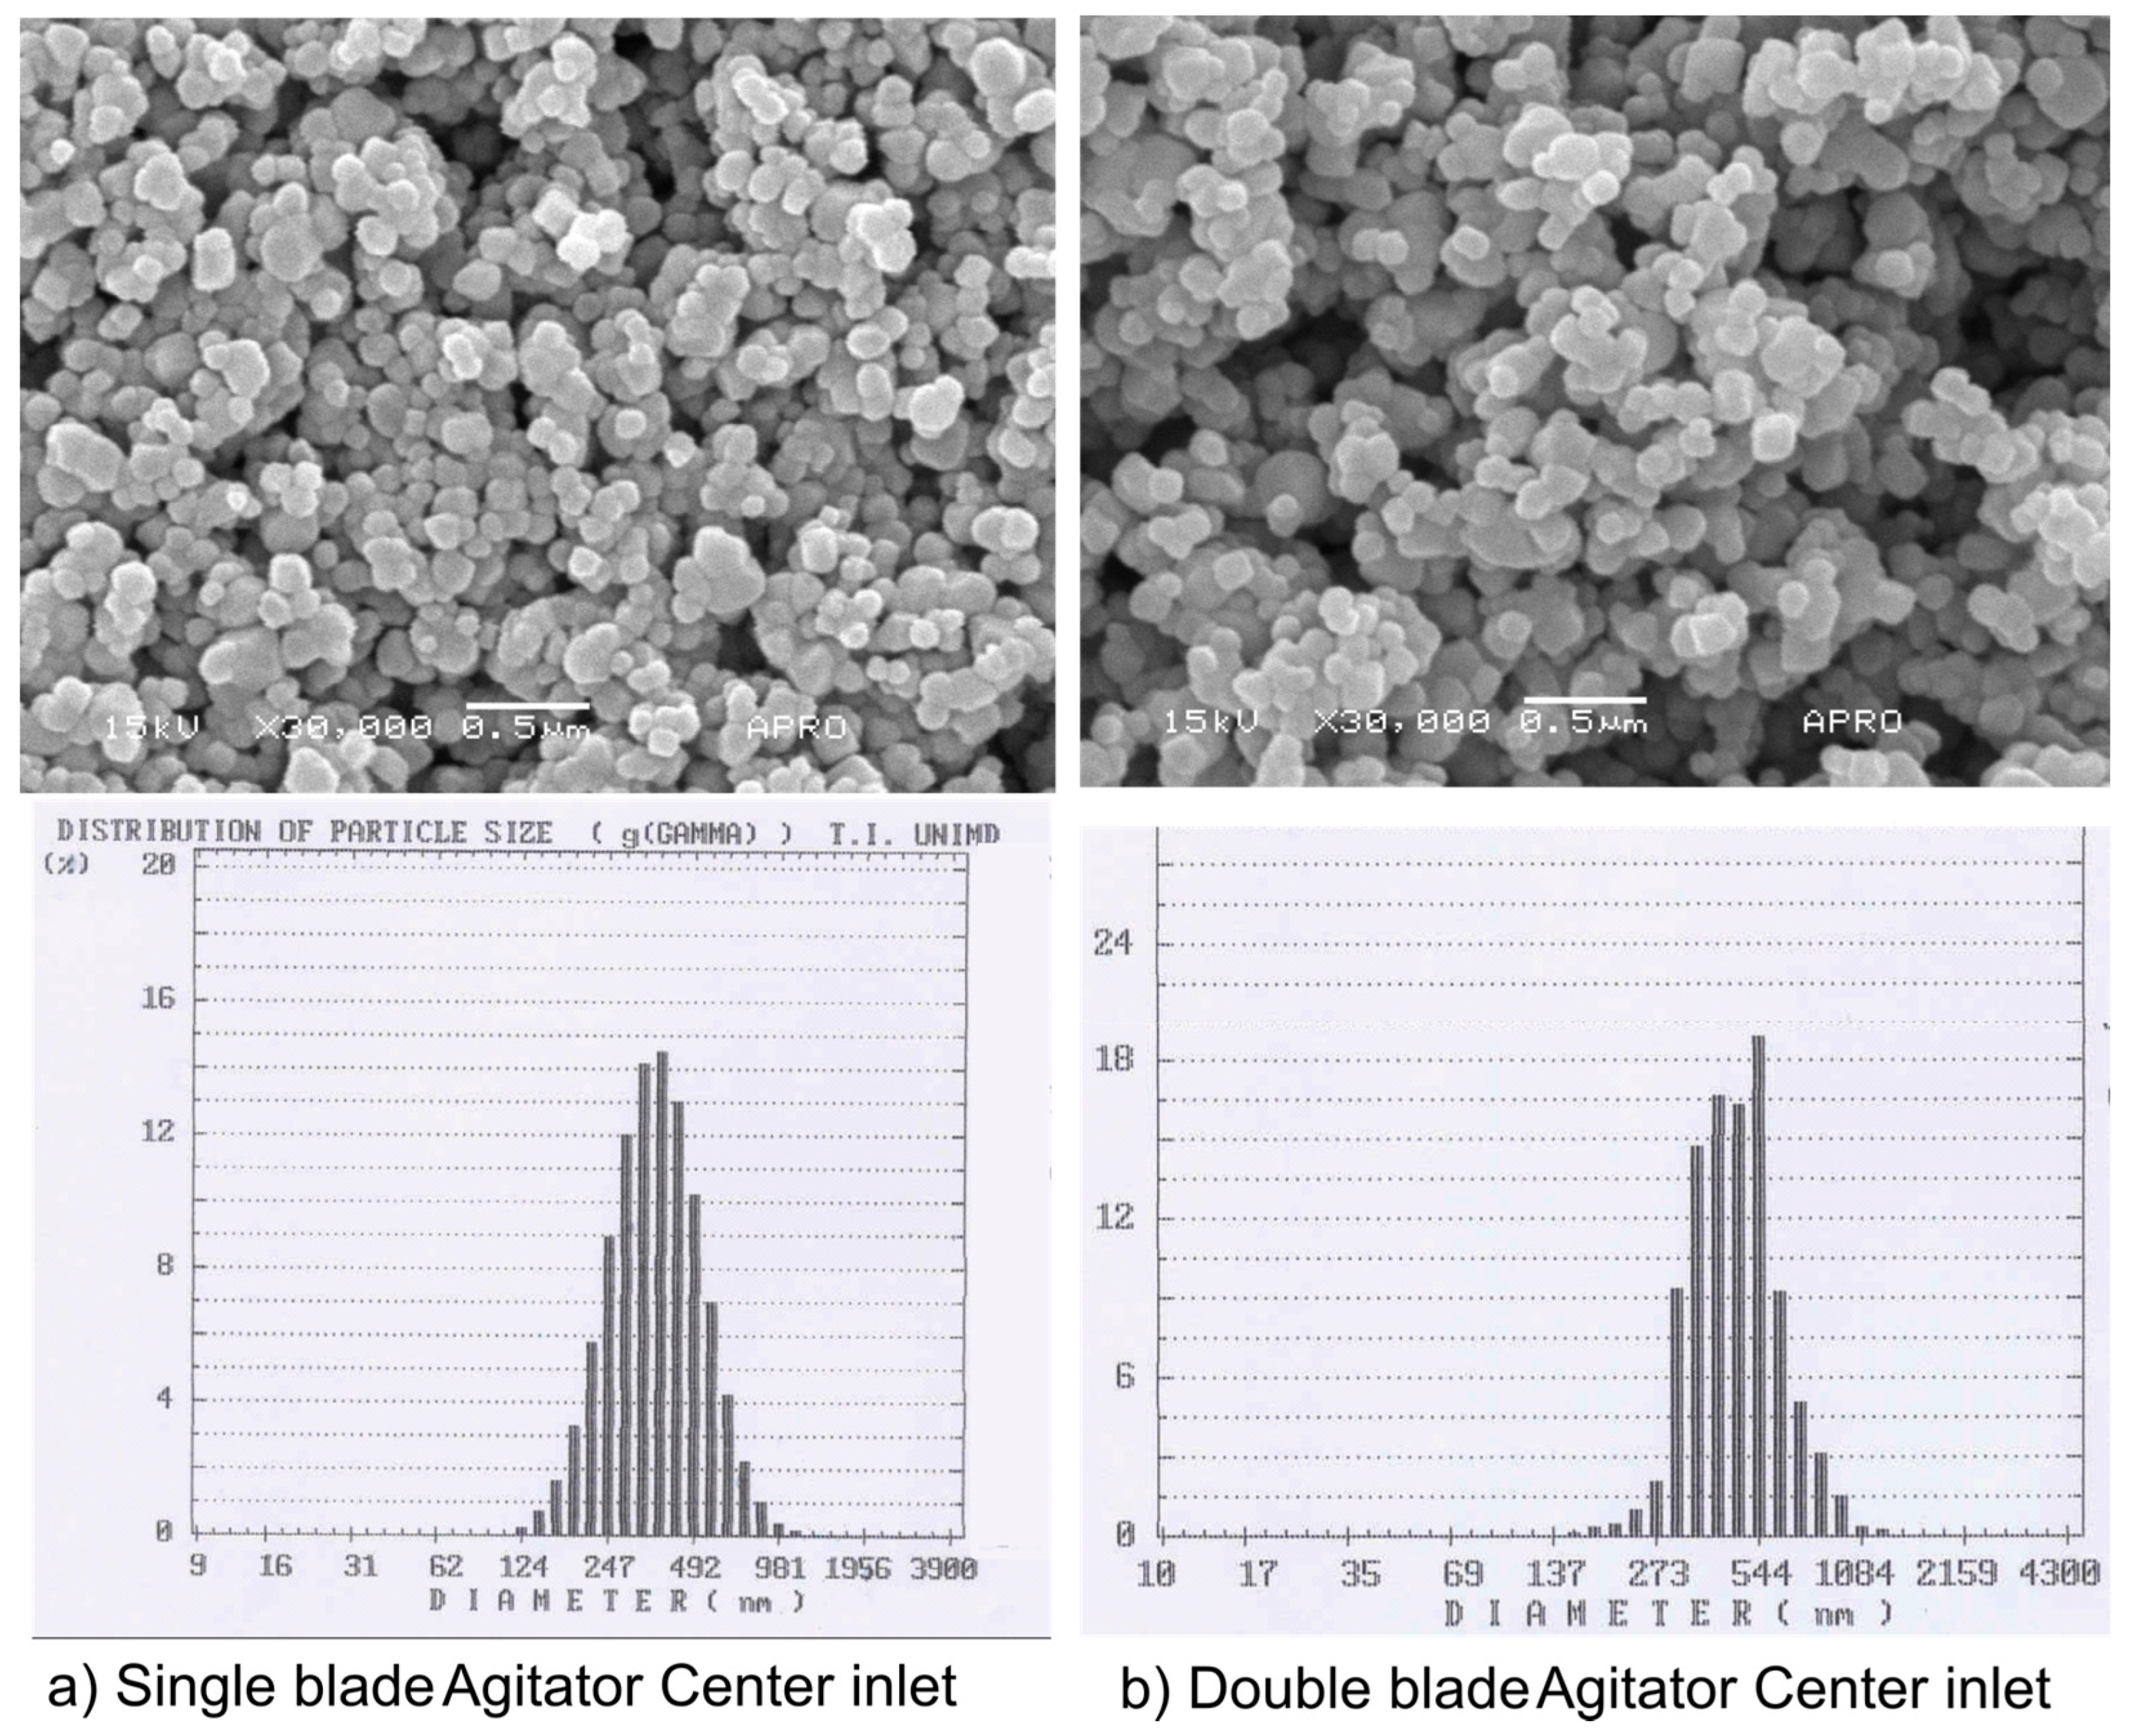
Figure 14 provides an explanation of the Transmission Electron Microscopy (TEM) analysis.
As previously mentioned, the experiments were affected by noticeable bubble interference, which posed limitations on accurately assessing the mixing rate solely based on the agitator. As a result of this influence, it was observed that larger particles in the range of 500~600 nm were produced instead of the targeted 300~400 nm TiO2 particle size. However, it can be confirmed that as the mixing efficiency increased, there was a significant reduction in the presence of fine particles.
4. Actual Field Test Results
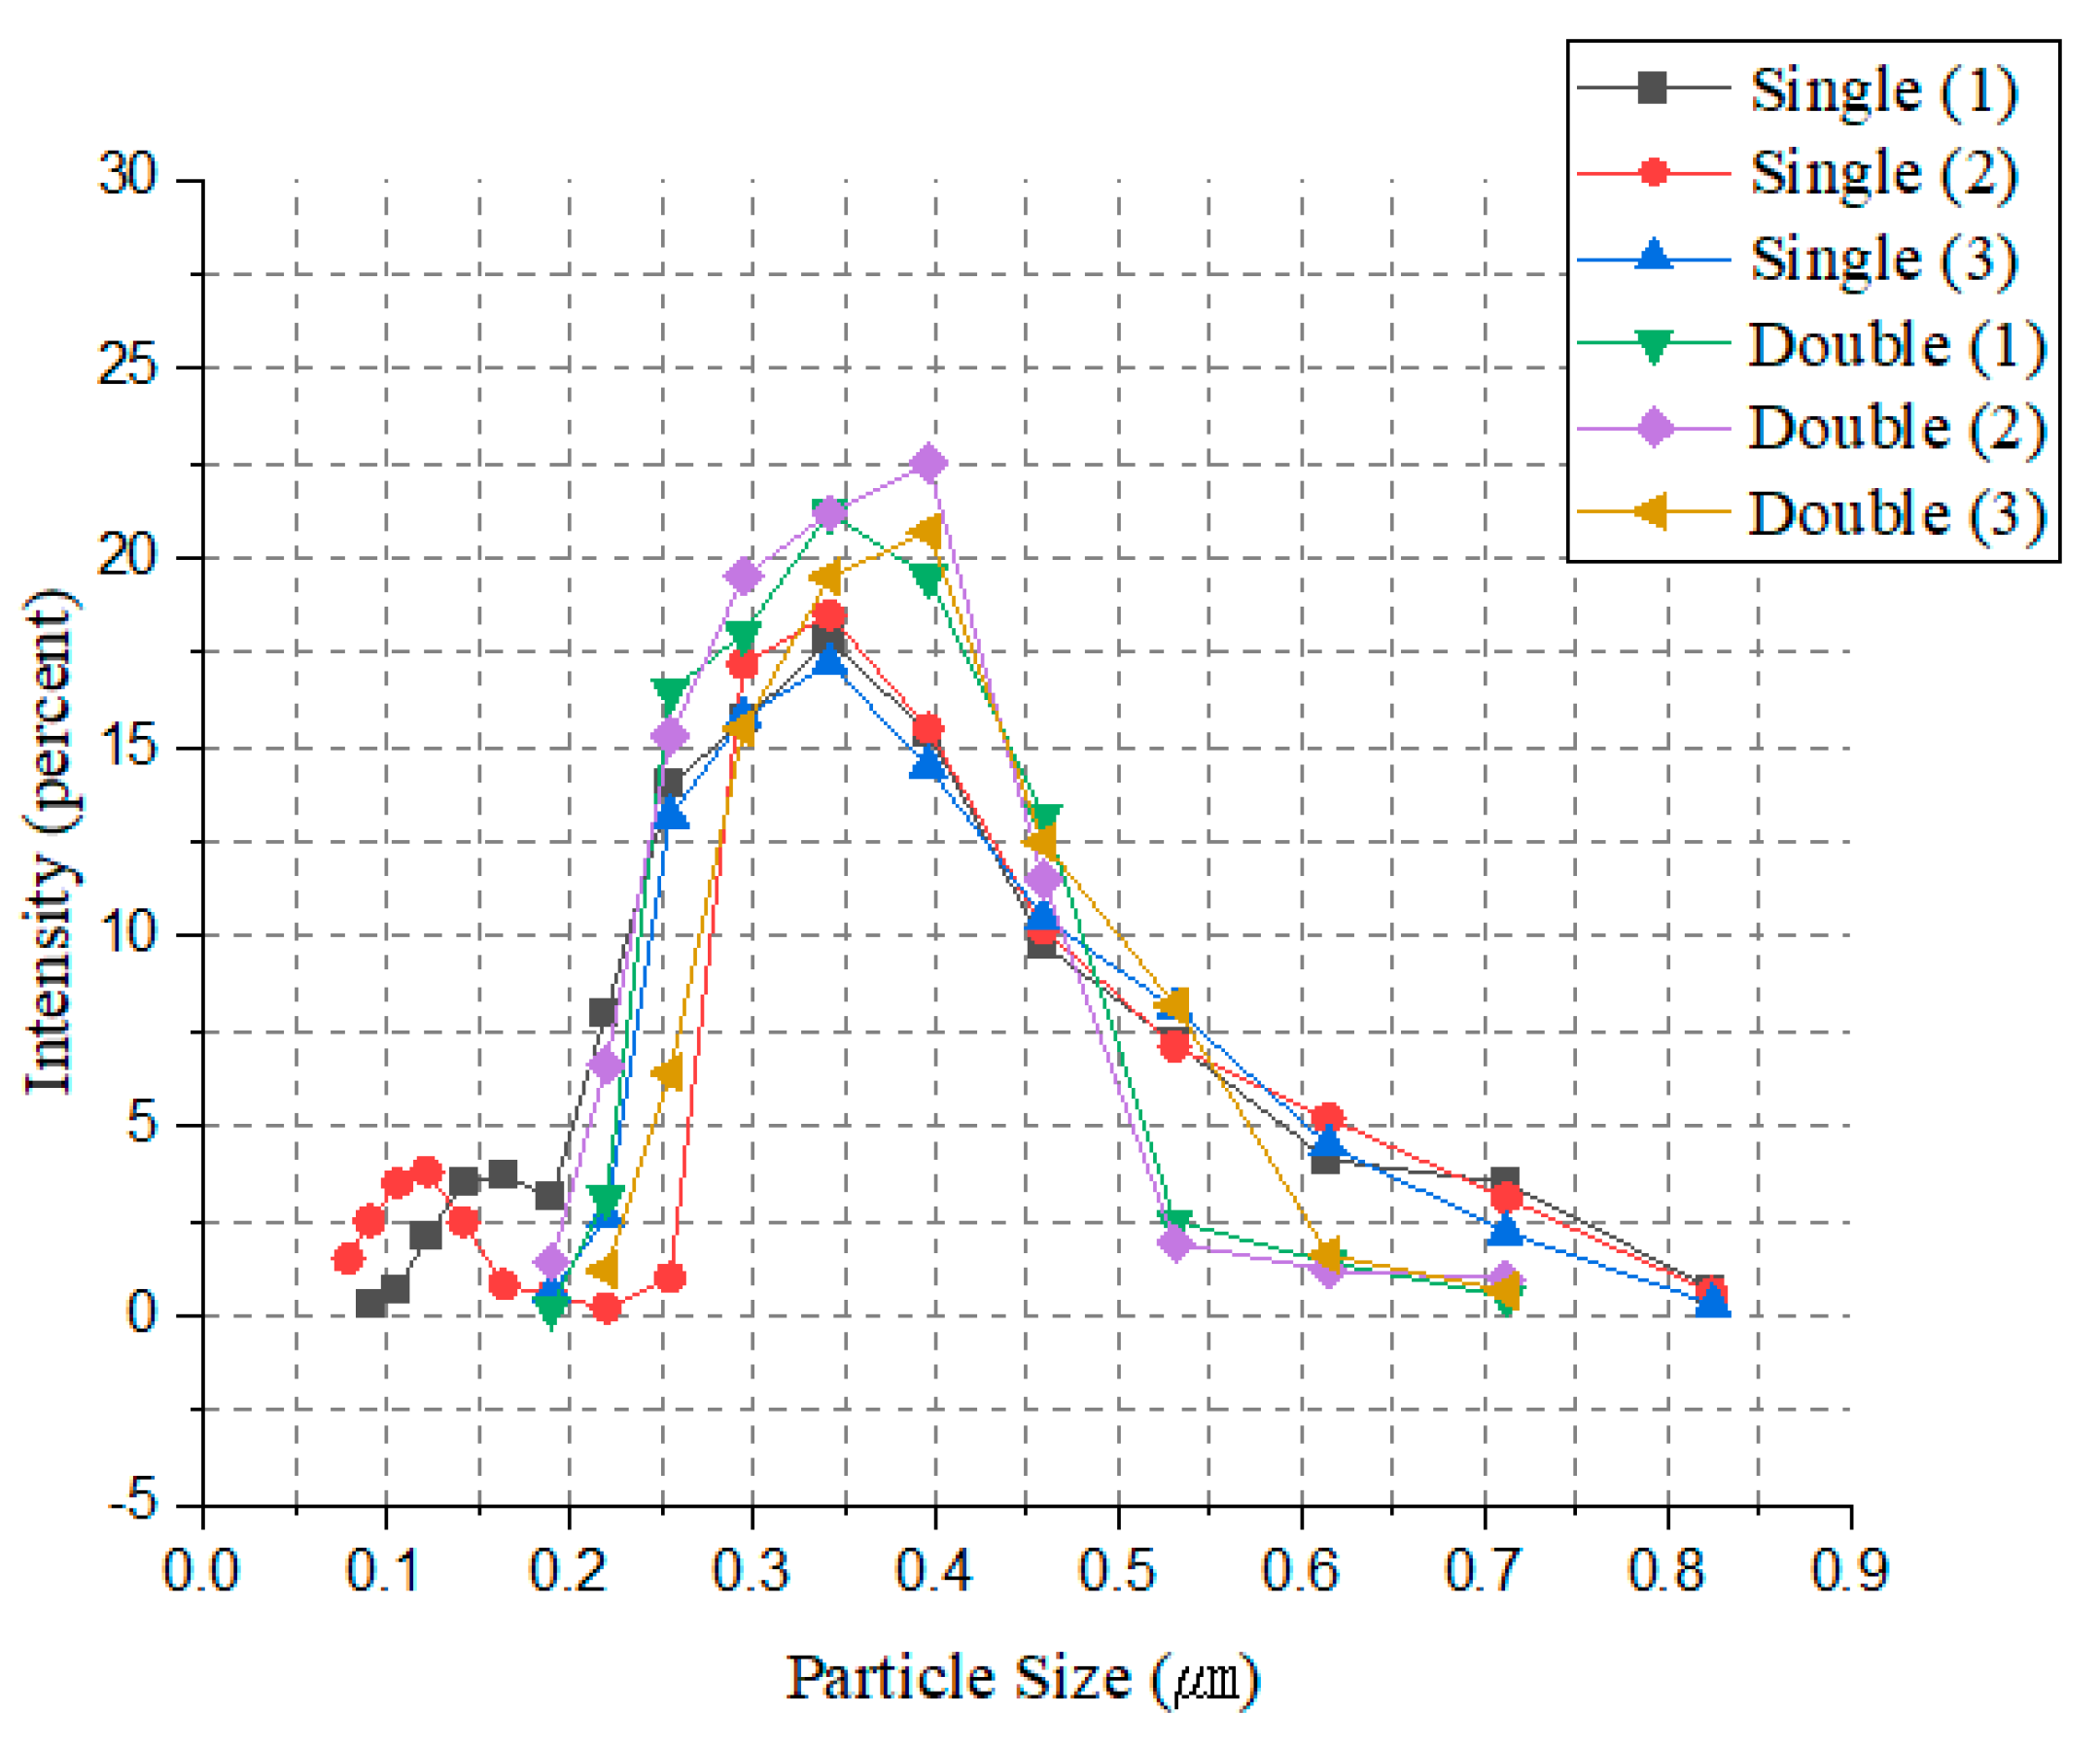
For the actual field test, a precipitation tank fitted with a double-stage blade, confirmed through both CFD analysis and a laboratory-scale experiment, was put into operation. The single- and double-stage blade configurations are illustrated in
Figure 15. Liquid samples were extracted from two distinct types of precipitation tanks for the purpose of analyzing particle distribution, as depicted in
Figure 16. The Malvern planetary system was utilized to examine the particle size distribution.
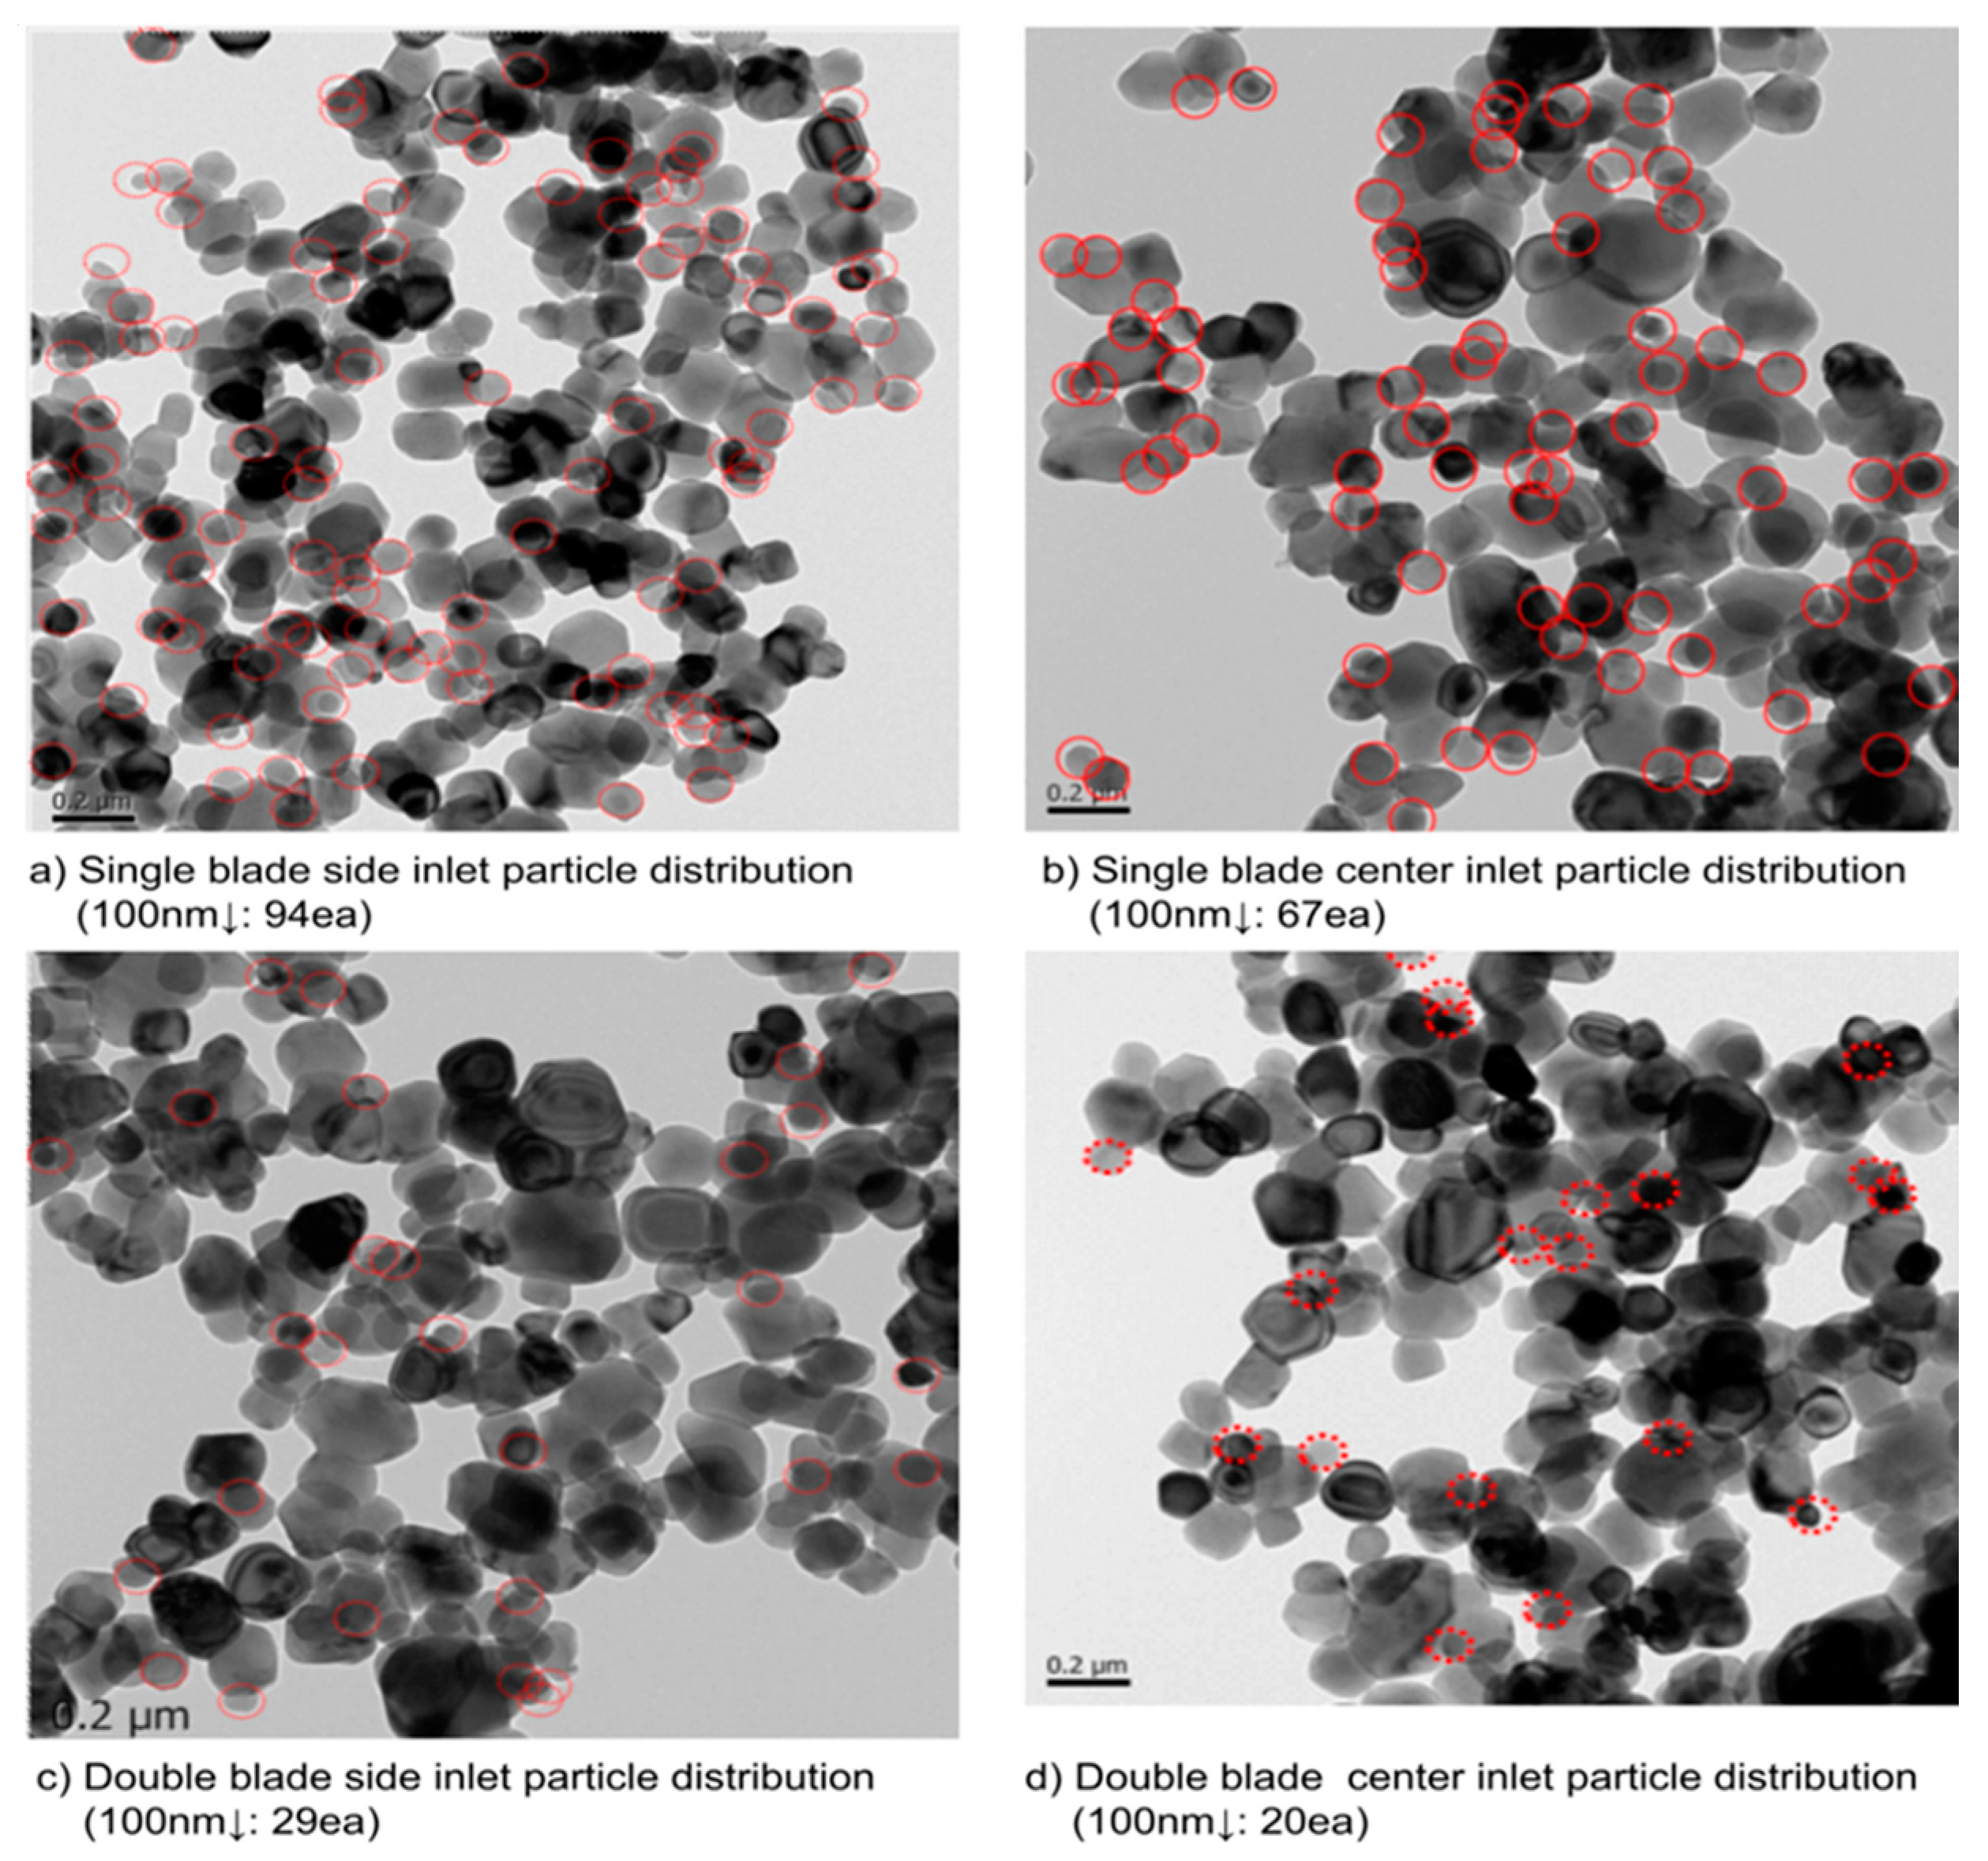
As shown in
Figure 16, multiple experiments were conducted, each repeated three times. In the case of hydrolysis using a single blade, numerous fine particles and large particles exceeding 700 nm were observed. These non-uniform particles can clog filter cloth holes during the washing process, reducing their lifespan and making it challenging to remove heavy metal contents dissolved within them. In contrast, the double-blade configuration successfully increased the intensity of particles in the target size range of 300 nm to 400 nm and effectively removed fine particles below 200 nm.
Figure 17, a Transmission Electron Microscopy (TEM) photograph of particle distribution, revealed a significant reduction in fine particles in both the center seed inlet and side inlet for the double-blade configuration.
In this study, a settling value test, widely employed for assessing particle size uniformity, was conducted. Subsequently, we aimed to perform a comparative analysis of particle distribution between the single-blade and double-blade configurations. The settling value test involves diluting 114 mL (190 g/L ) of the hydrolyzed solution with 300 mL of water. After cooling to 25 degrees, additional water is added to make up a 500 mL solution. After 30 min, the suspension length is measured. A high settling value indicates a broader accumulation of smaller particles in the gaps between larger particles, resulting in a longer suspension length. On the contrary, a low settling value demonstrates that larger than 400 nm particles are uniformly generated and there are significant presence of voids between particles.
The investigation determined that the most effective washing efficiency for the Moore Filter (MF) employed in the Cosmo chemical process was 50 mm per 30 min. It was observed that the 1440 mm single-blade configuration with a side inlet, exhibiting the lowest mixing rate in this analysis, yielded a settling value exceeding 67. The increase in the settling value implies a substantial formation of flocs between particles and a notable variation in particle size. The results of the settling value test for both single blade and double blades with a center seed inlet are depicted in
Figure 18 and
Table 8 below.
Figure 19 presents SEM analysis results for single-blade and double-blade configurations, along with the corresponding particle distribution data. For single-blade configurations with settling values of 60 or higher, the intensity in the range of 300 to 400 nm, considered as the target, maintains around 60–70%. However, for double-blade configurations, it increased to up to 80%. Additionally, the percentage of particles in the range of 100 to 200 nm decreased from 12% to within 5%.
5. Results
This study primarily focuses on optimizing the operational parameters of the precipitation process through multiphase CFD simulation, lab-scale experiments, and actual field tests, with the main goal of achieving a uniform particle size distribution. A Fluid-Gas-Solid coupled multiphase solver, explicitly tailored for handling precipitation involving solid-type seeds, was developed. This three-phase CFD solver, which utilizes the Eulerian-Lagrangian method, not only reduces the source term in the momentum equation but also enables tracking of particle trajectories while understanding the real physics of precipitation. This capability allows us to establish a strong correlation between the mixing rate and seed distribution.
As the mixing rate of the solution and steam increased, a more uniform distribution of seeds was achieved, effectively minimizing pre-hydrolysis in areas devoid of seeds. Consequently, the utilization of a double-stage agitator with a high mixing rate resulted in a notable decrease in the number of particles below 100 nm, accompanied by a pronounced centralization of the particle distribution. Moreover, it was observed that using a center inlet for seed injection in a single-stage blade yielded a more uniform seed distribution compared to a side inlet.
In the context of a double blade, which boasts a high mixing rate, both side inlet and center inlet configurations produced uniform seed distributions. However, using a center inlet demonstrated superior performance by ensuring an even particle distribution through the uniform supply of seeds to the opposite side of the nozzle. This uniform particle distribution not only facilitated consistent precipitation but also hindered the formation of particles smaller than 100 nm.
In conclusion, the optimized blade, as validated by CFD, demonstrated exceptional mixing capabilities during field experiments within the precipitation process. It not only ensured a uniform temperature distribution of solution but also created a consistent seed distribution. Additionally, by operating the precipitation process uniformly and stably, particles with a uniform size could be produced. This enhanced uniformity in distribution played a pivotal role in improving settling value. The optimization of the precipitation process, as the key outcome of this research, had a significantly positive impact on the subsequent washing and bleaching process. This resulted in a substantial improvement in productivity efficiency and played a pivotal role in the high-quality production process of .


