

Feasibility of Advanced CO2 Injection and Well Pattern Adjustment to Improve Oil Recovery and CO2 Storage in Tight-Oil Reservoirs


Abstract
:1. Introduction
2. Experiments and Simulation
2.1. Experiments
2.1.1. Materials
Reservoir Cores
Formation Oil
Formation Brine
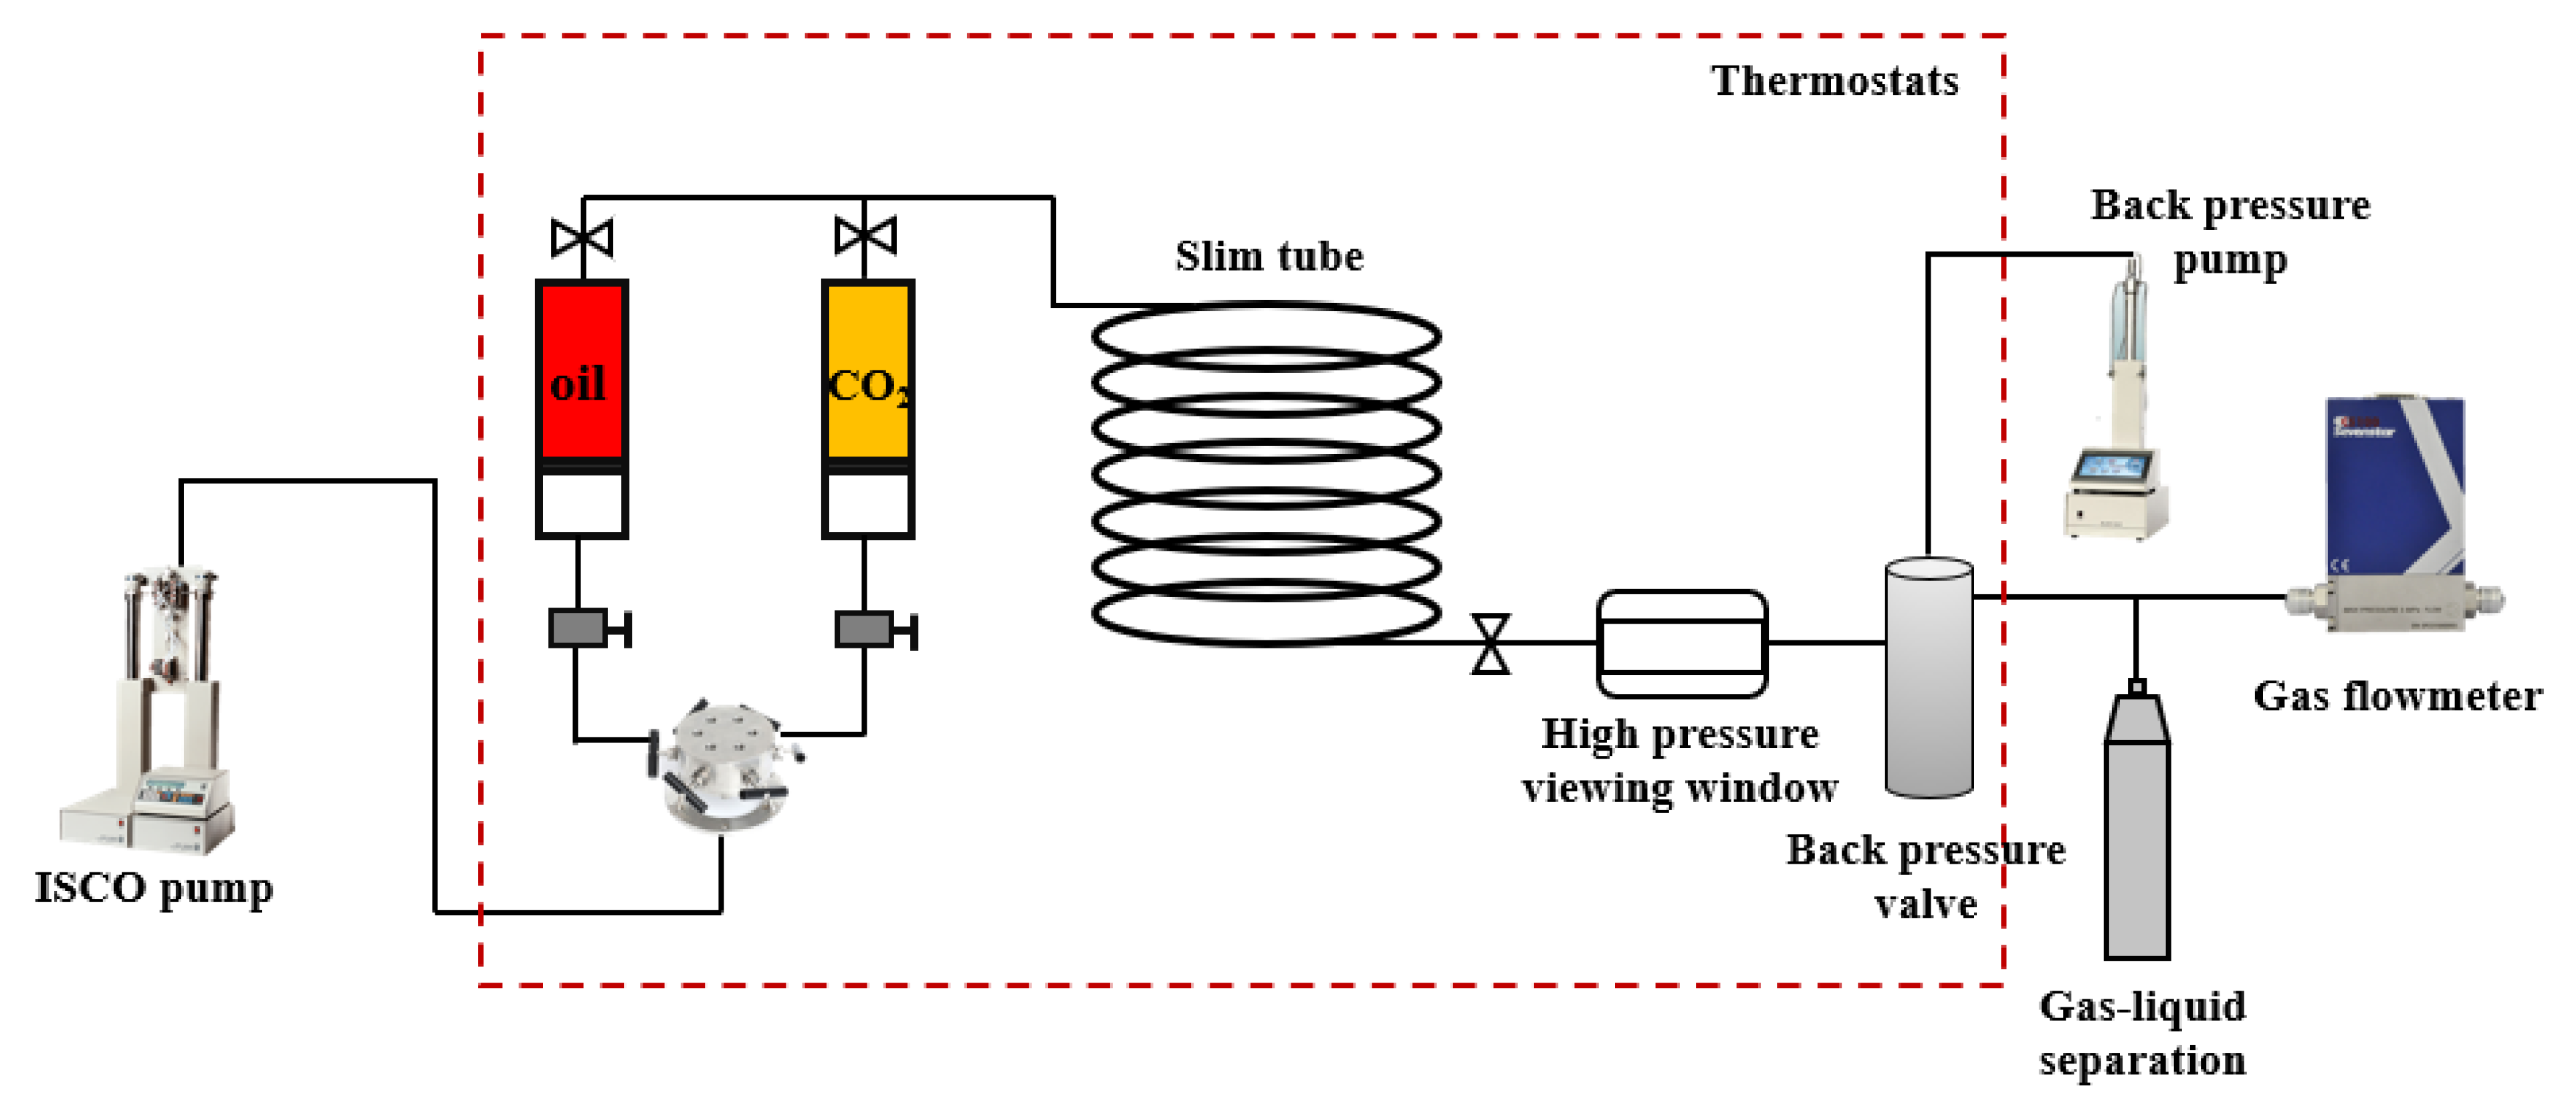
2.1.2. Experimental Setup
Slim Tube
Long-Core Displacement
2.1.3. Experimental Procedure
Slim Tube
Long-Core Displacement
2.2. Simulation
2.2.1. Simulation Background
2.2.2. Numerical Simulation Model
3. Results and Discussions
3.1. Experimental Results
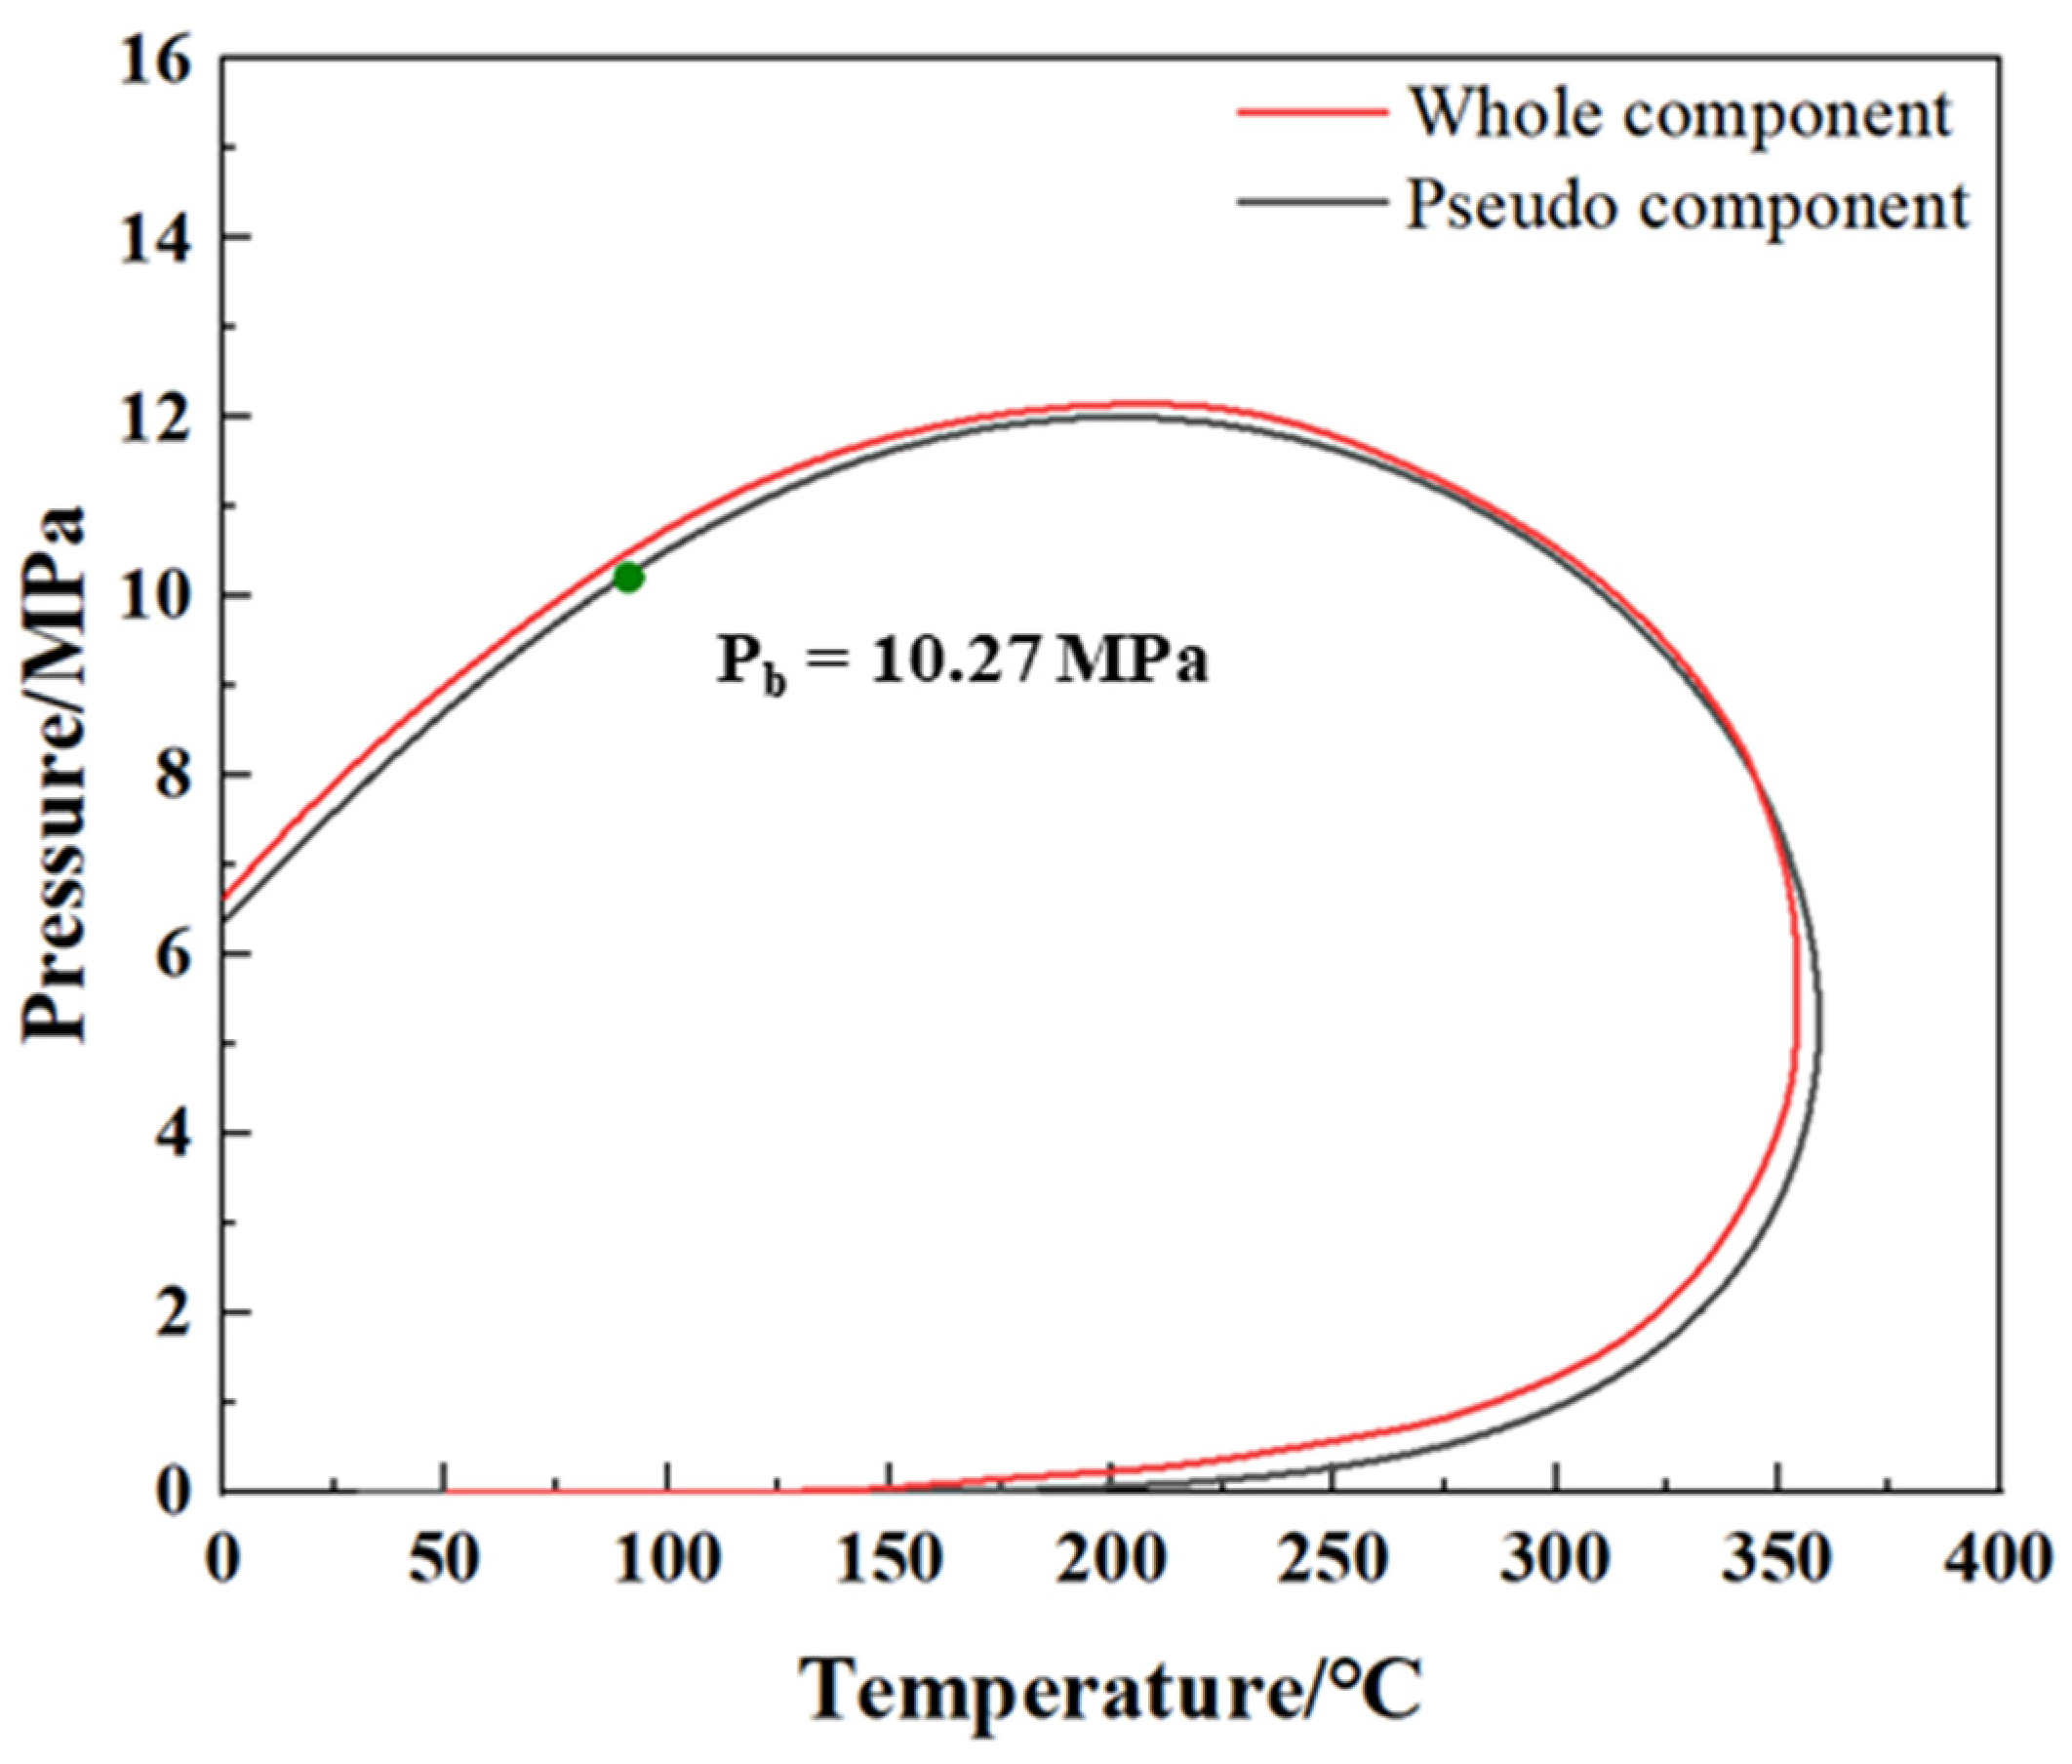
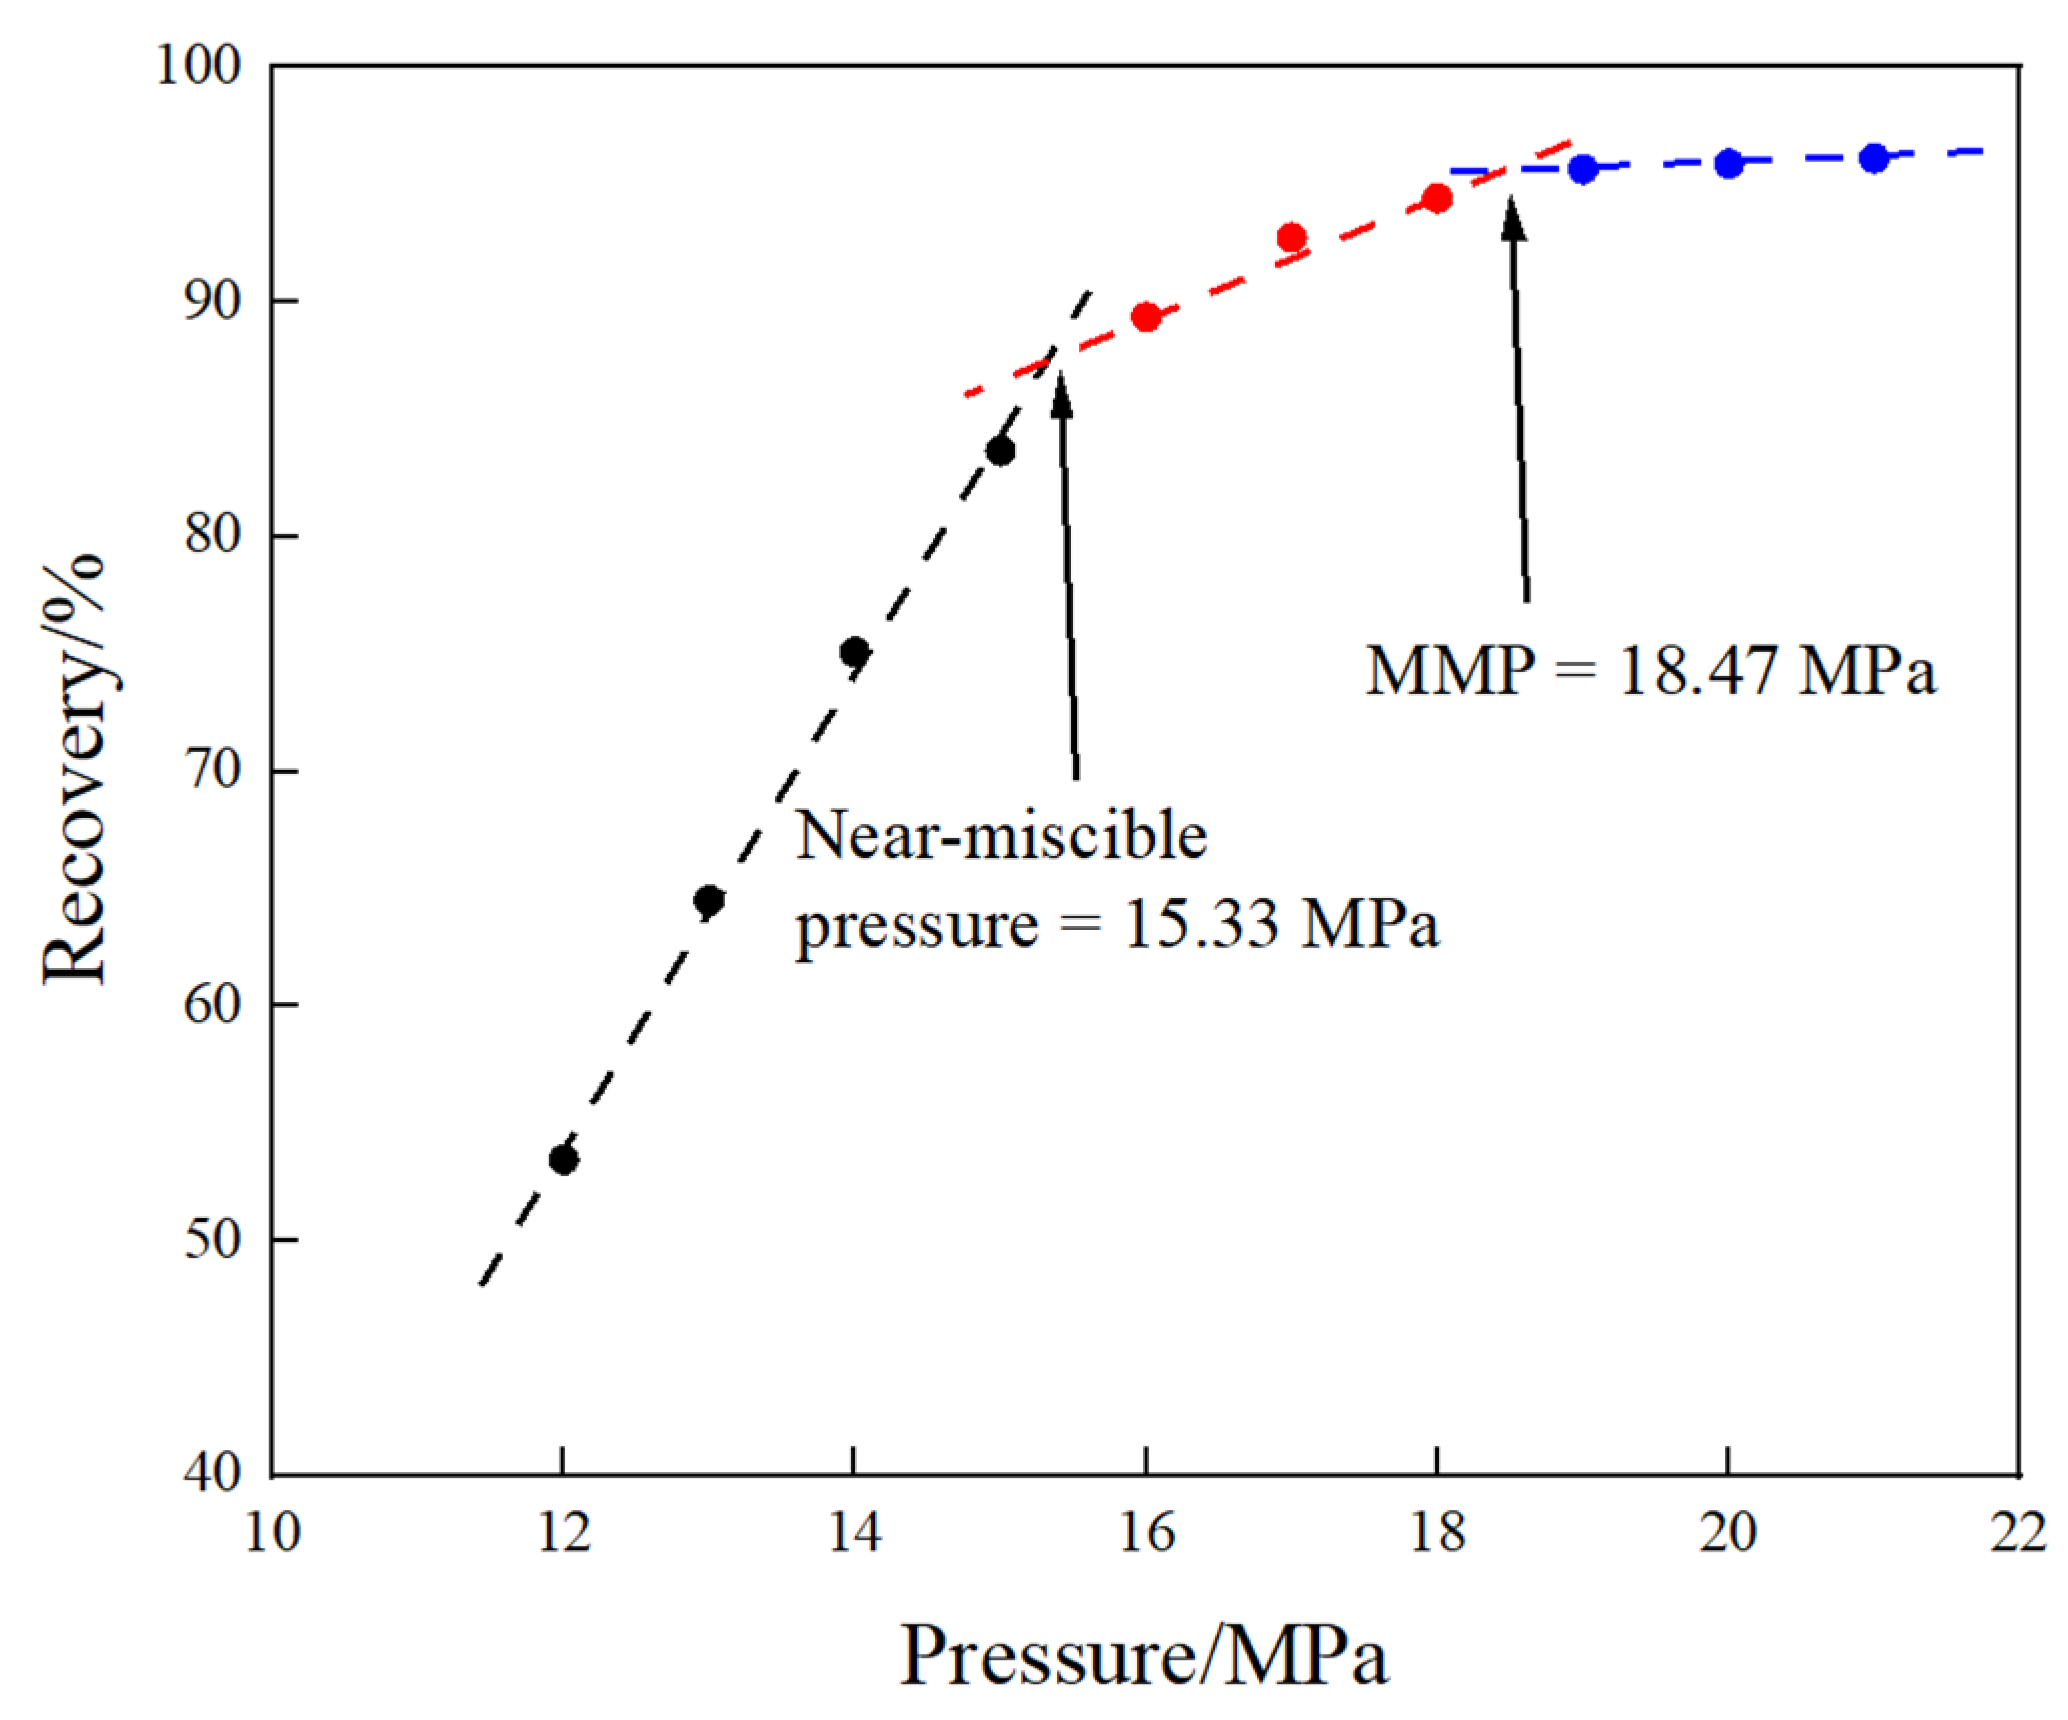
3.1.1. MMP and Near-Miscibility Pressure Interval
3.1.2. Oil Recovery
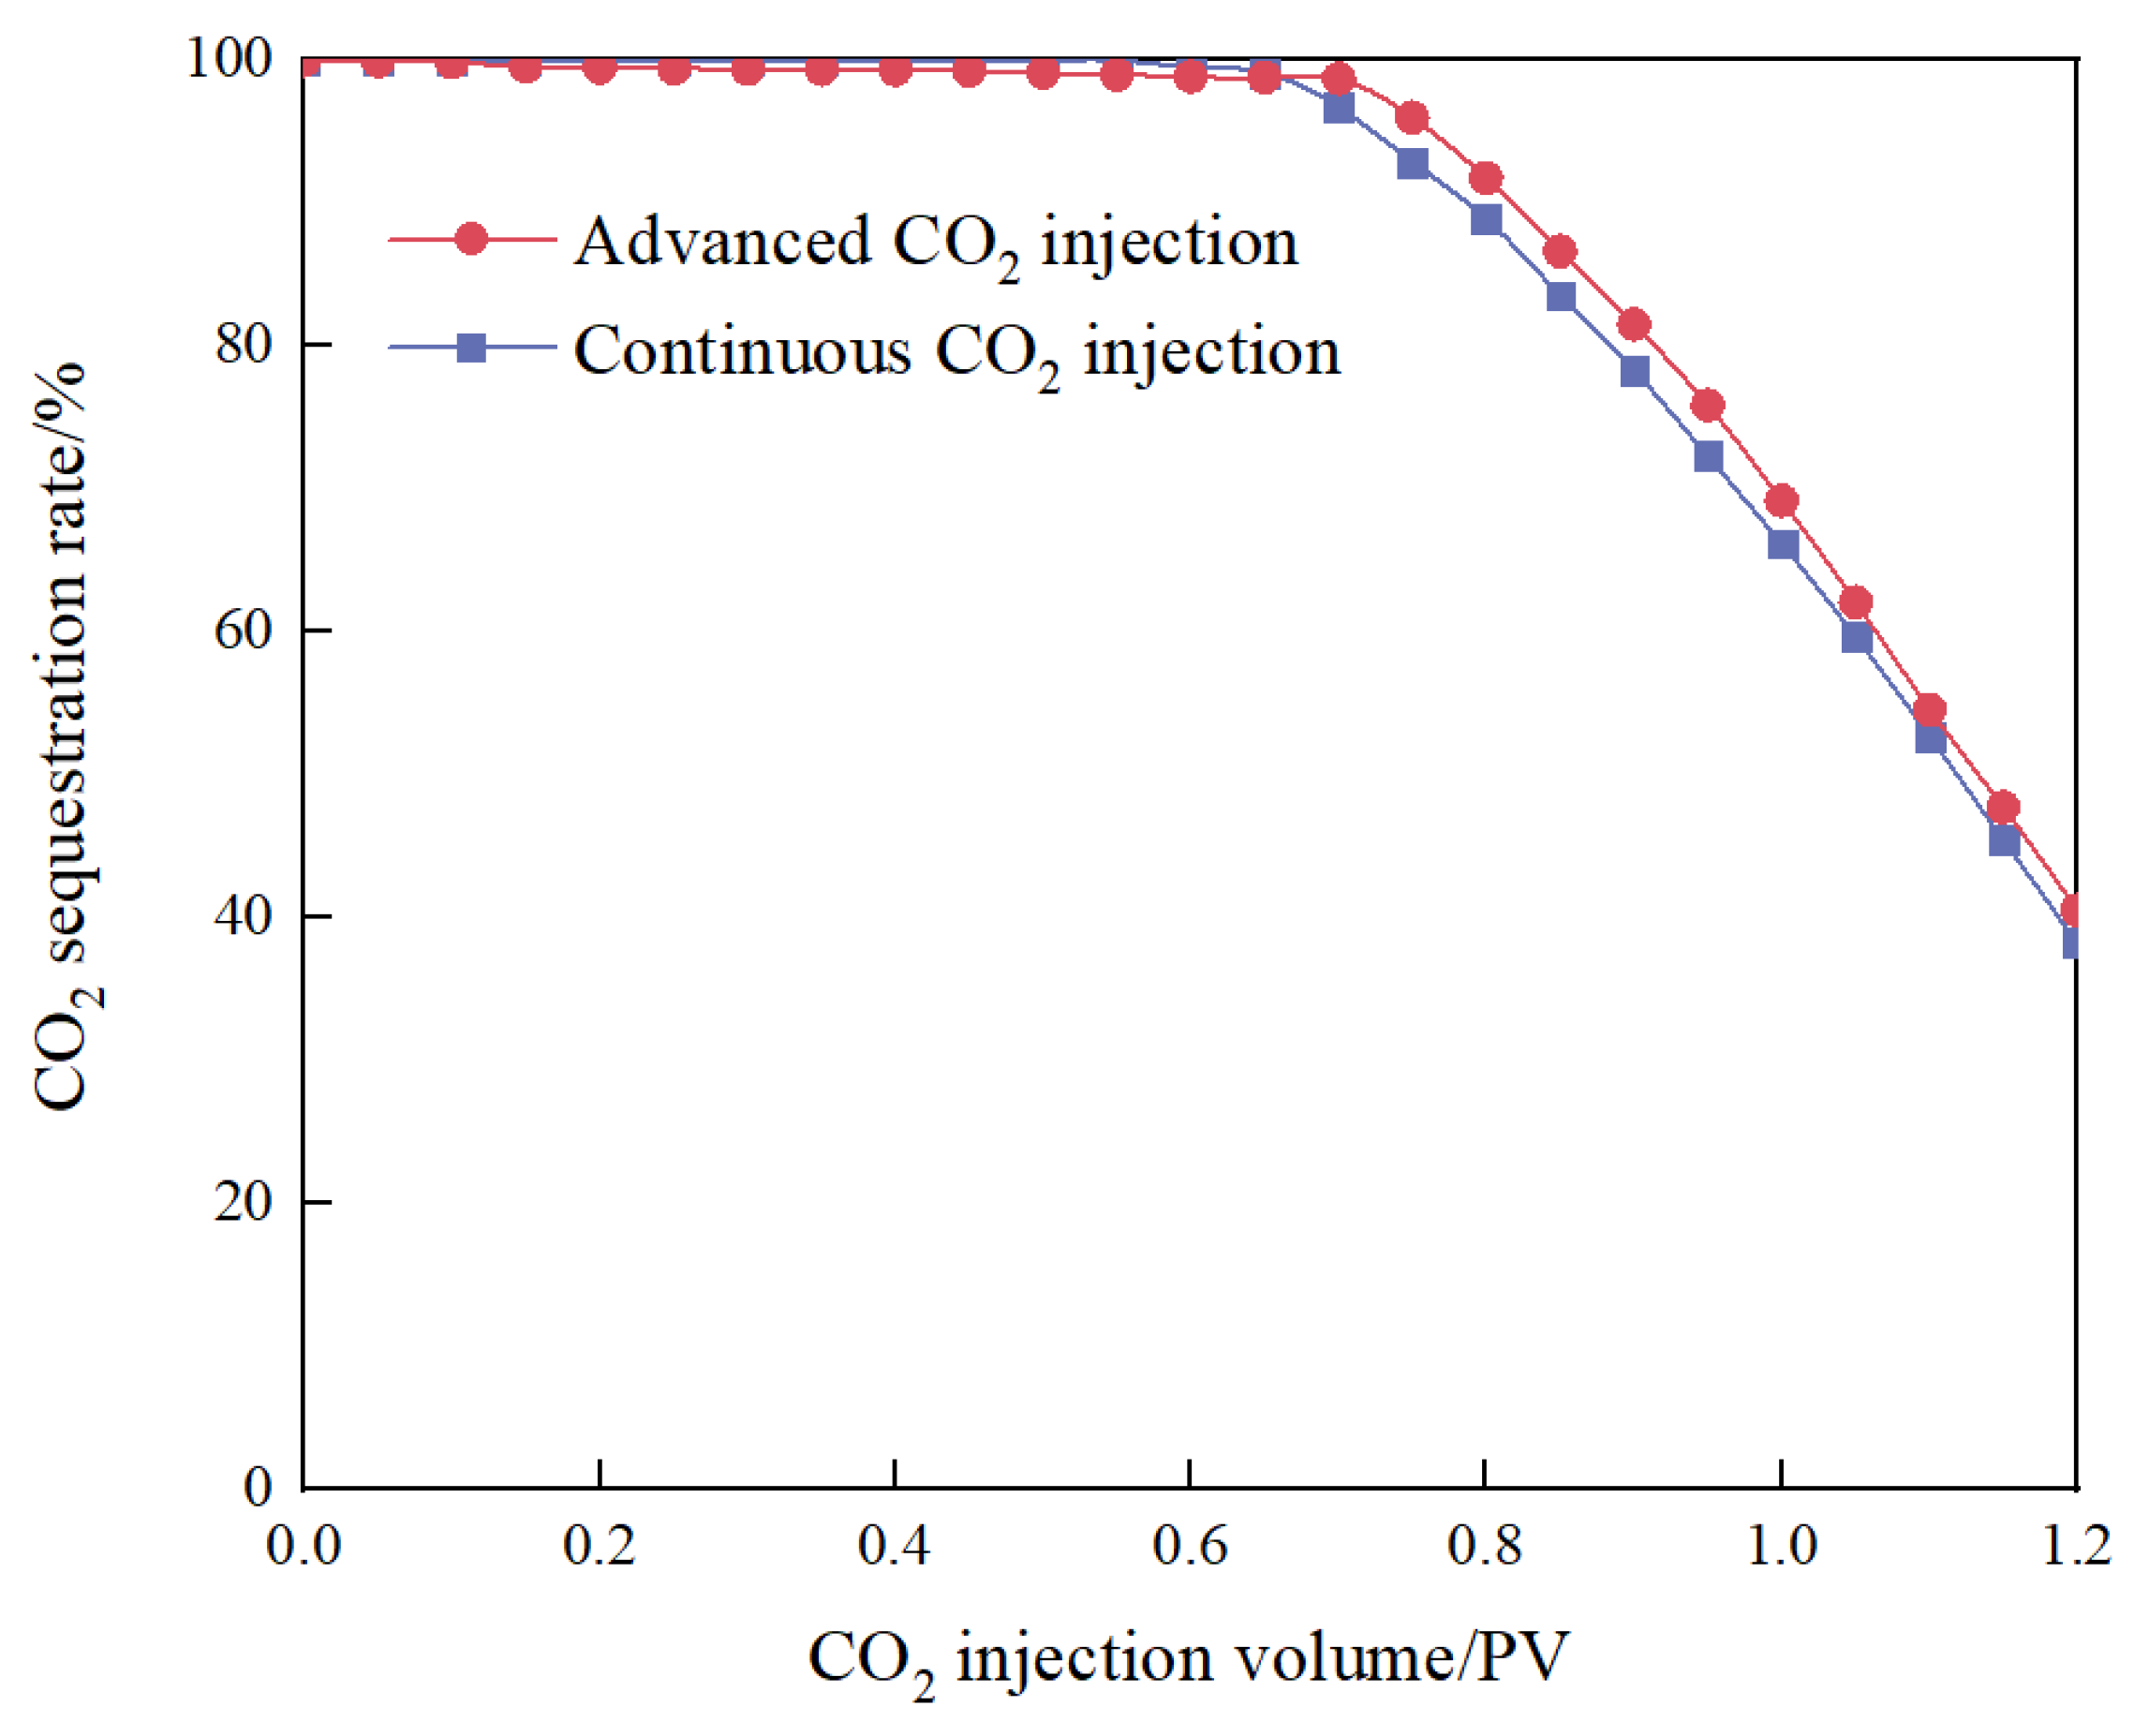
3.1.3. CO2 Storage
3.2. Simulation Results
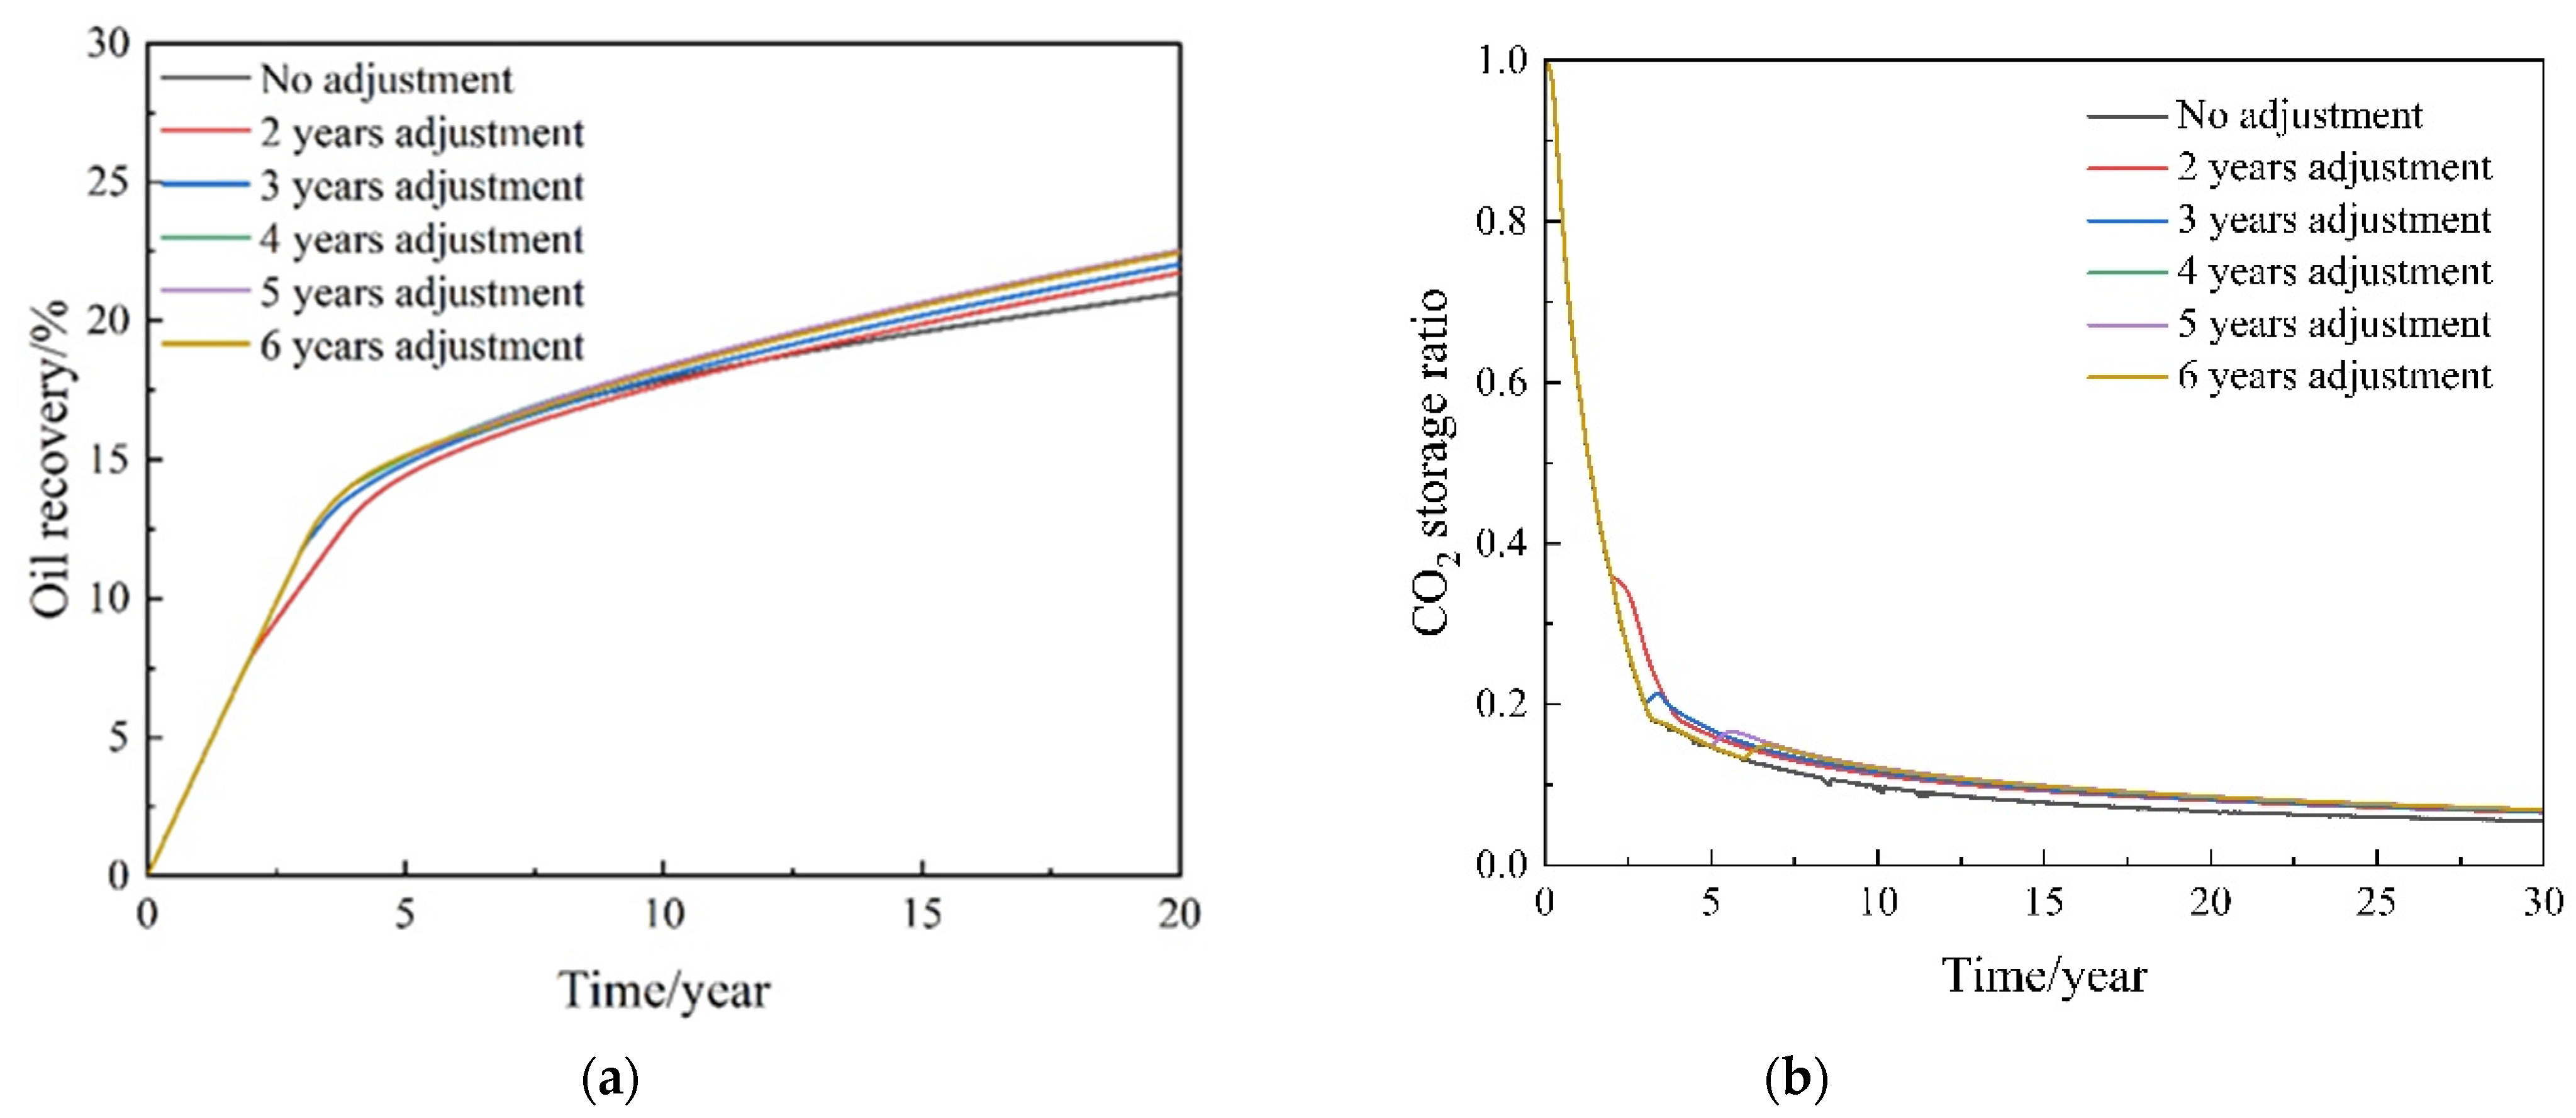
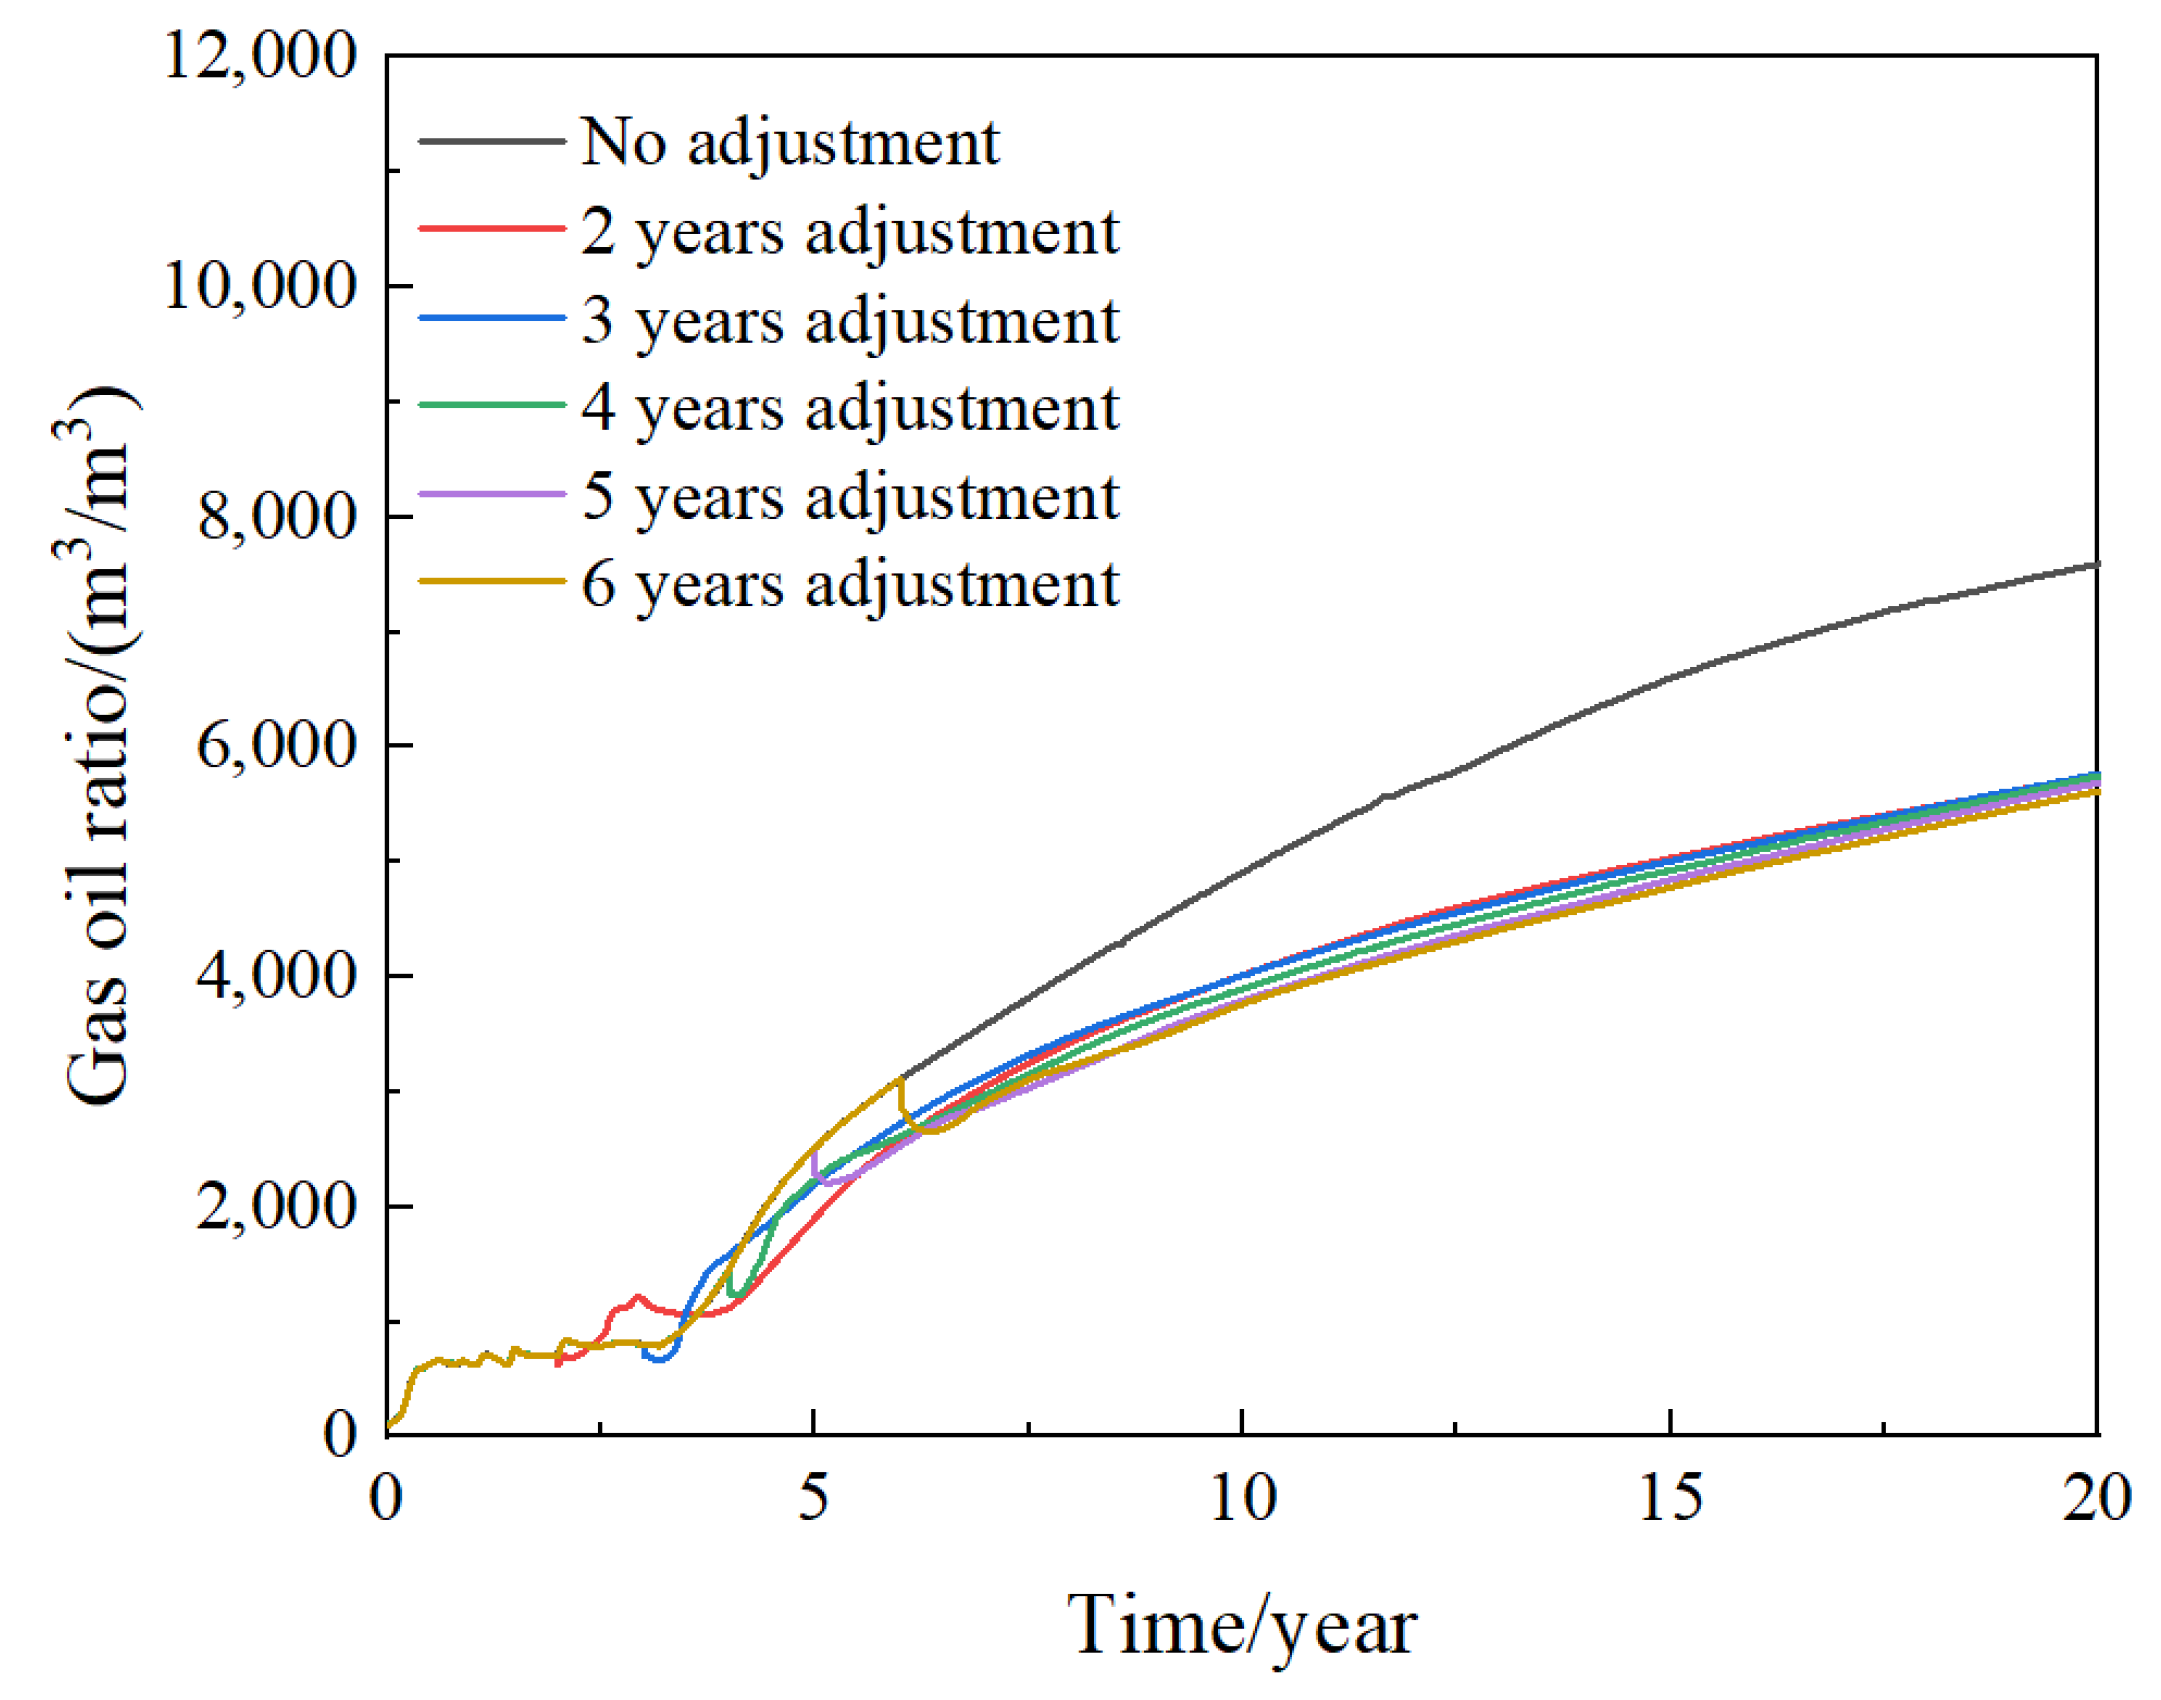
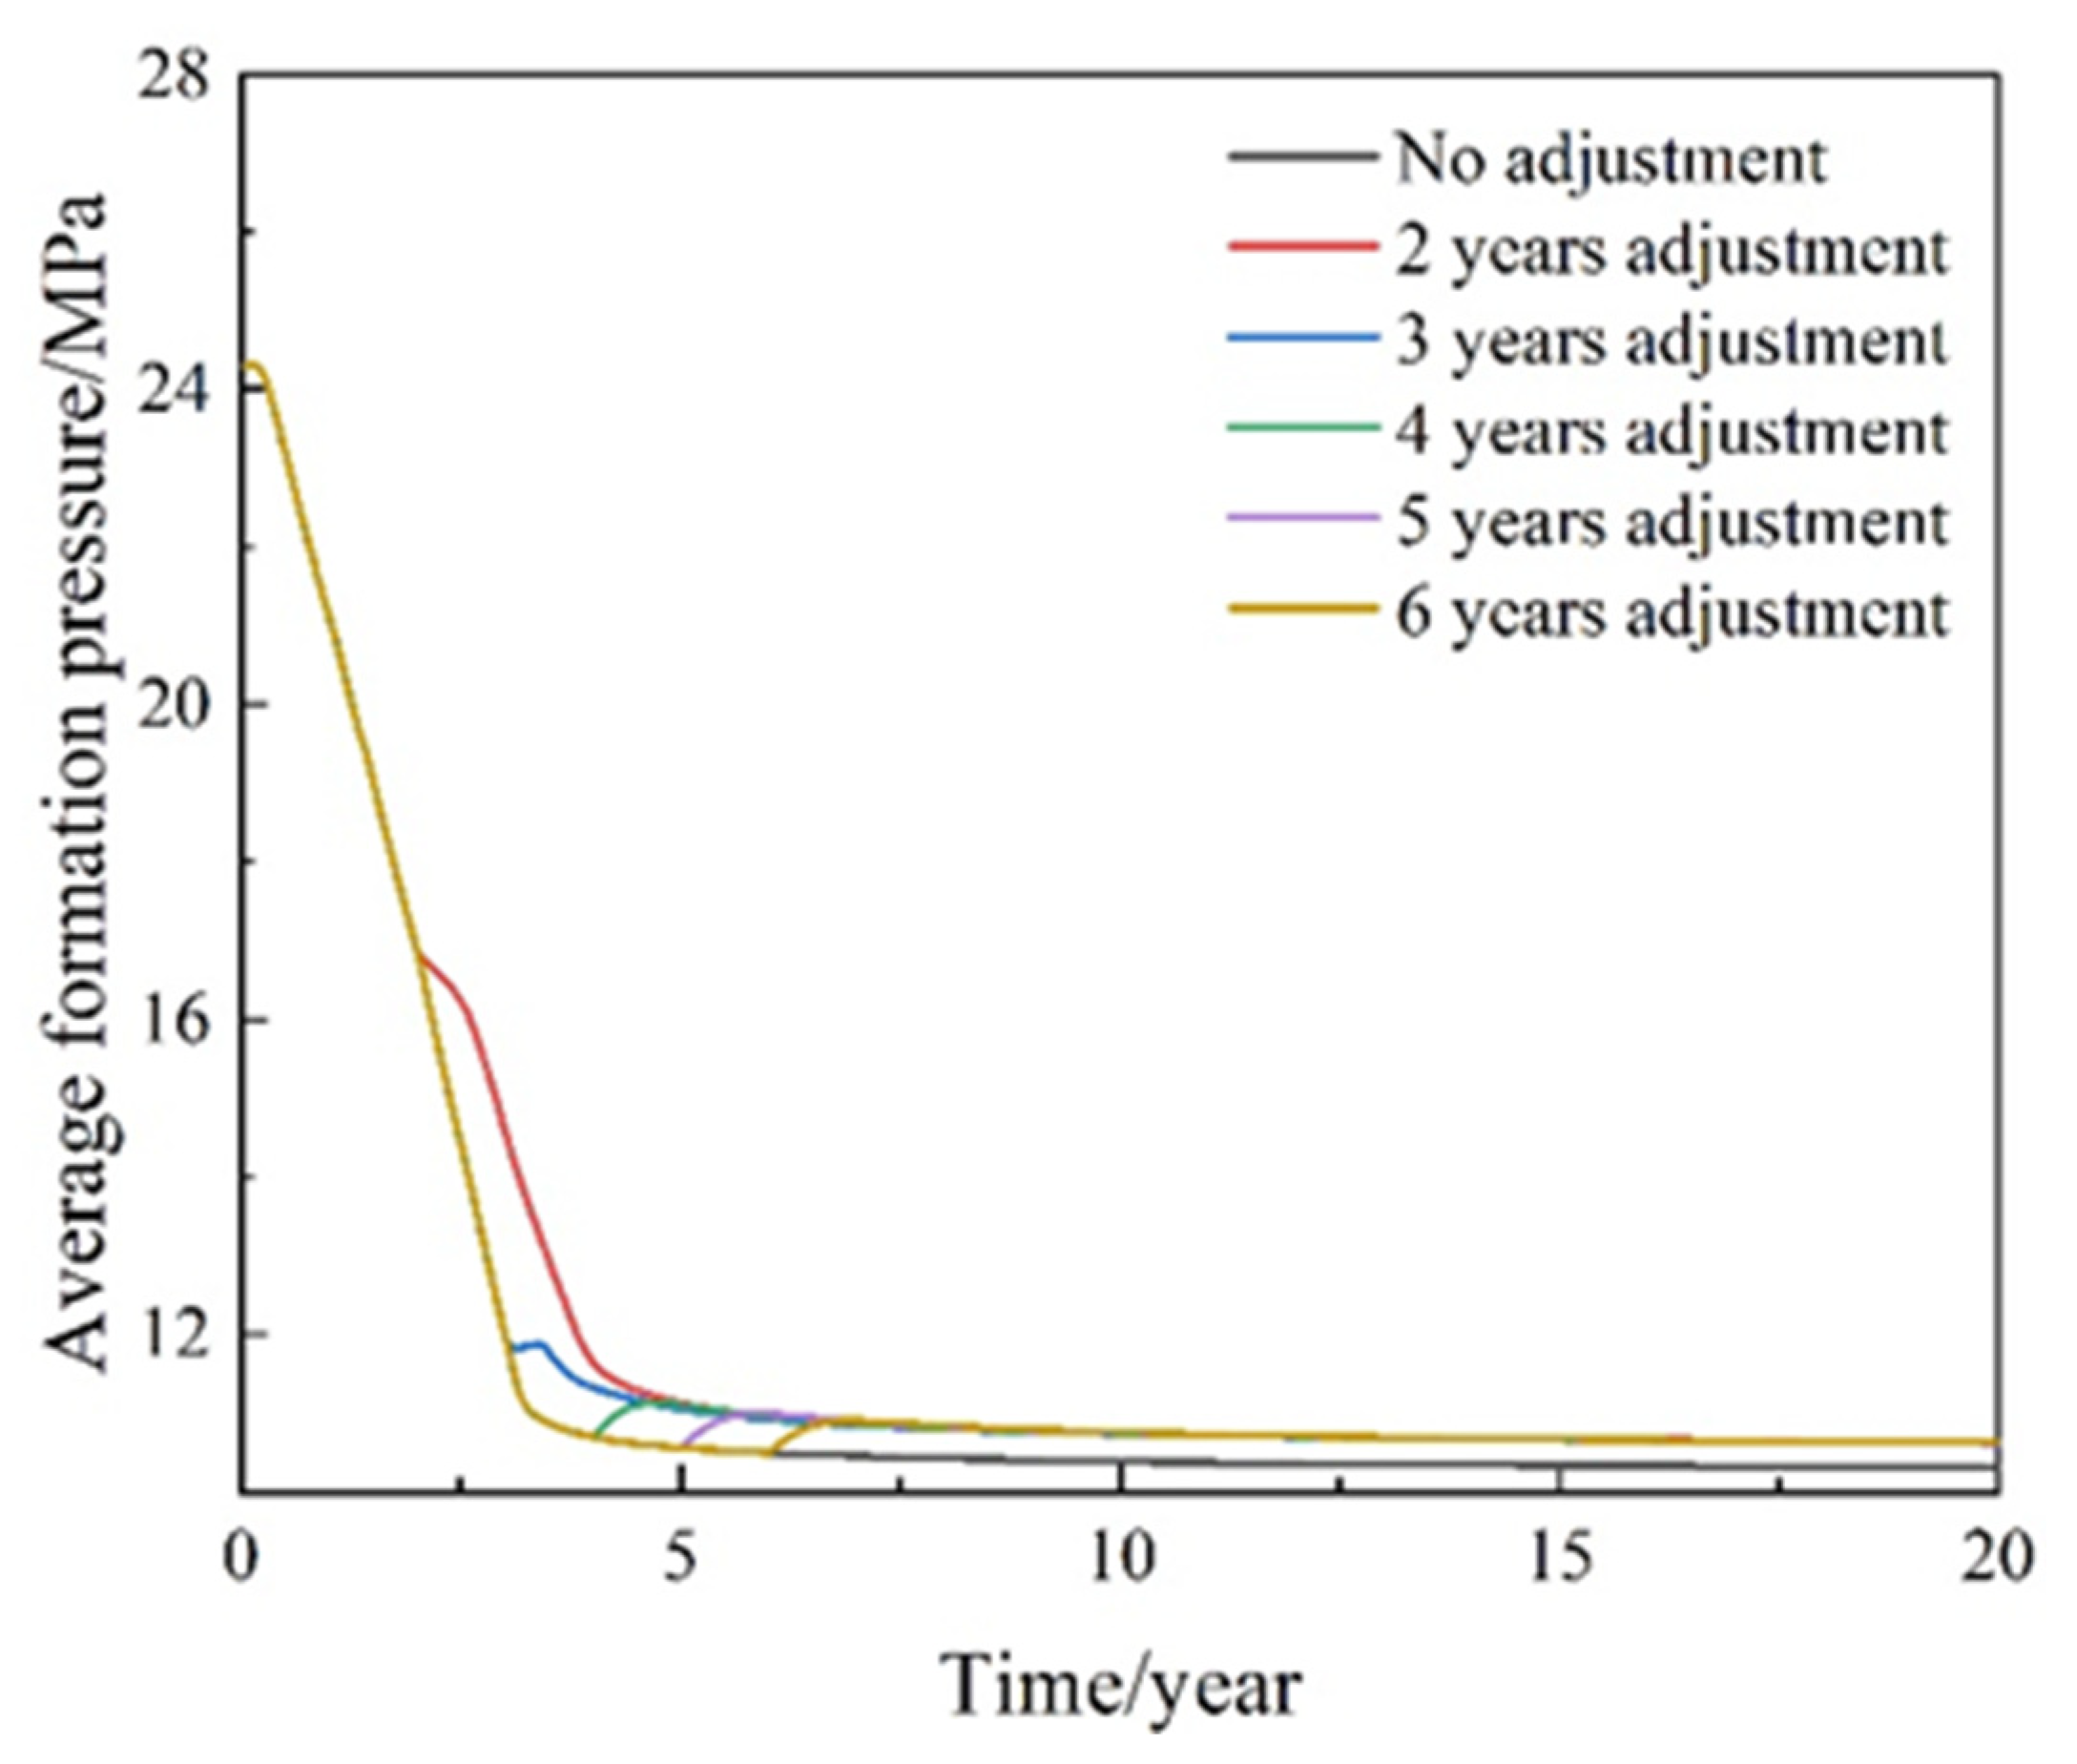
3.2.1. Optimization of Development Parameters
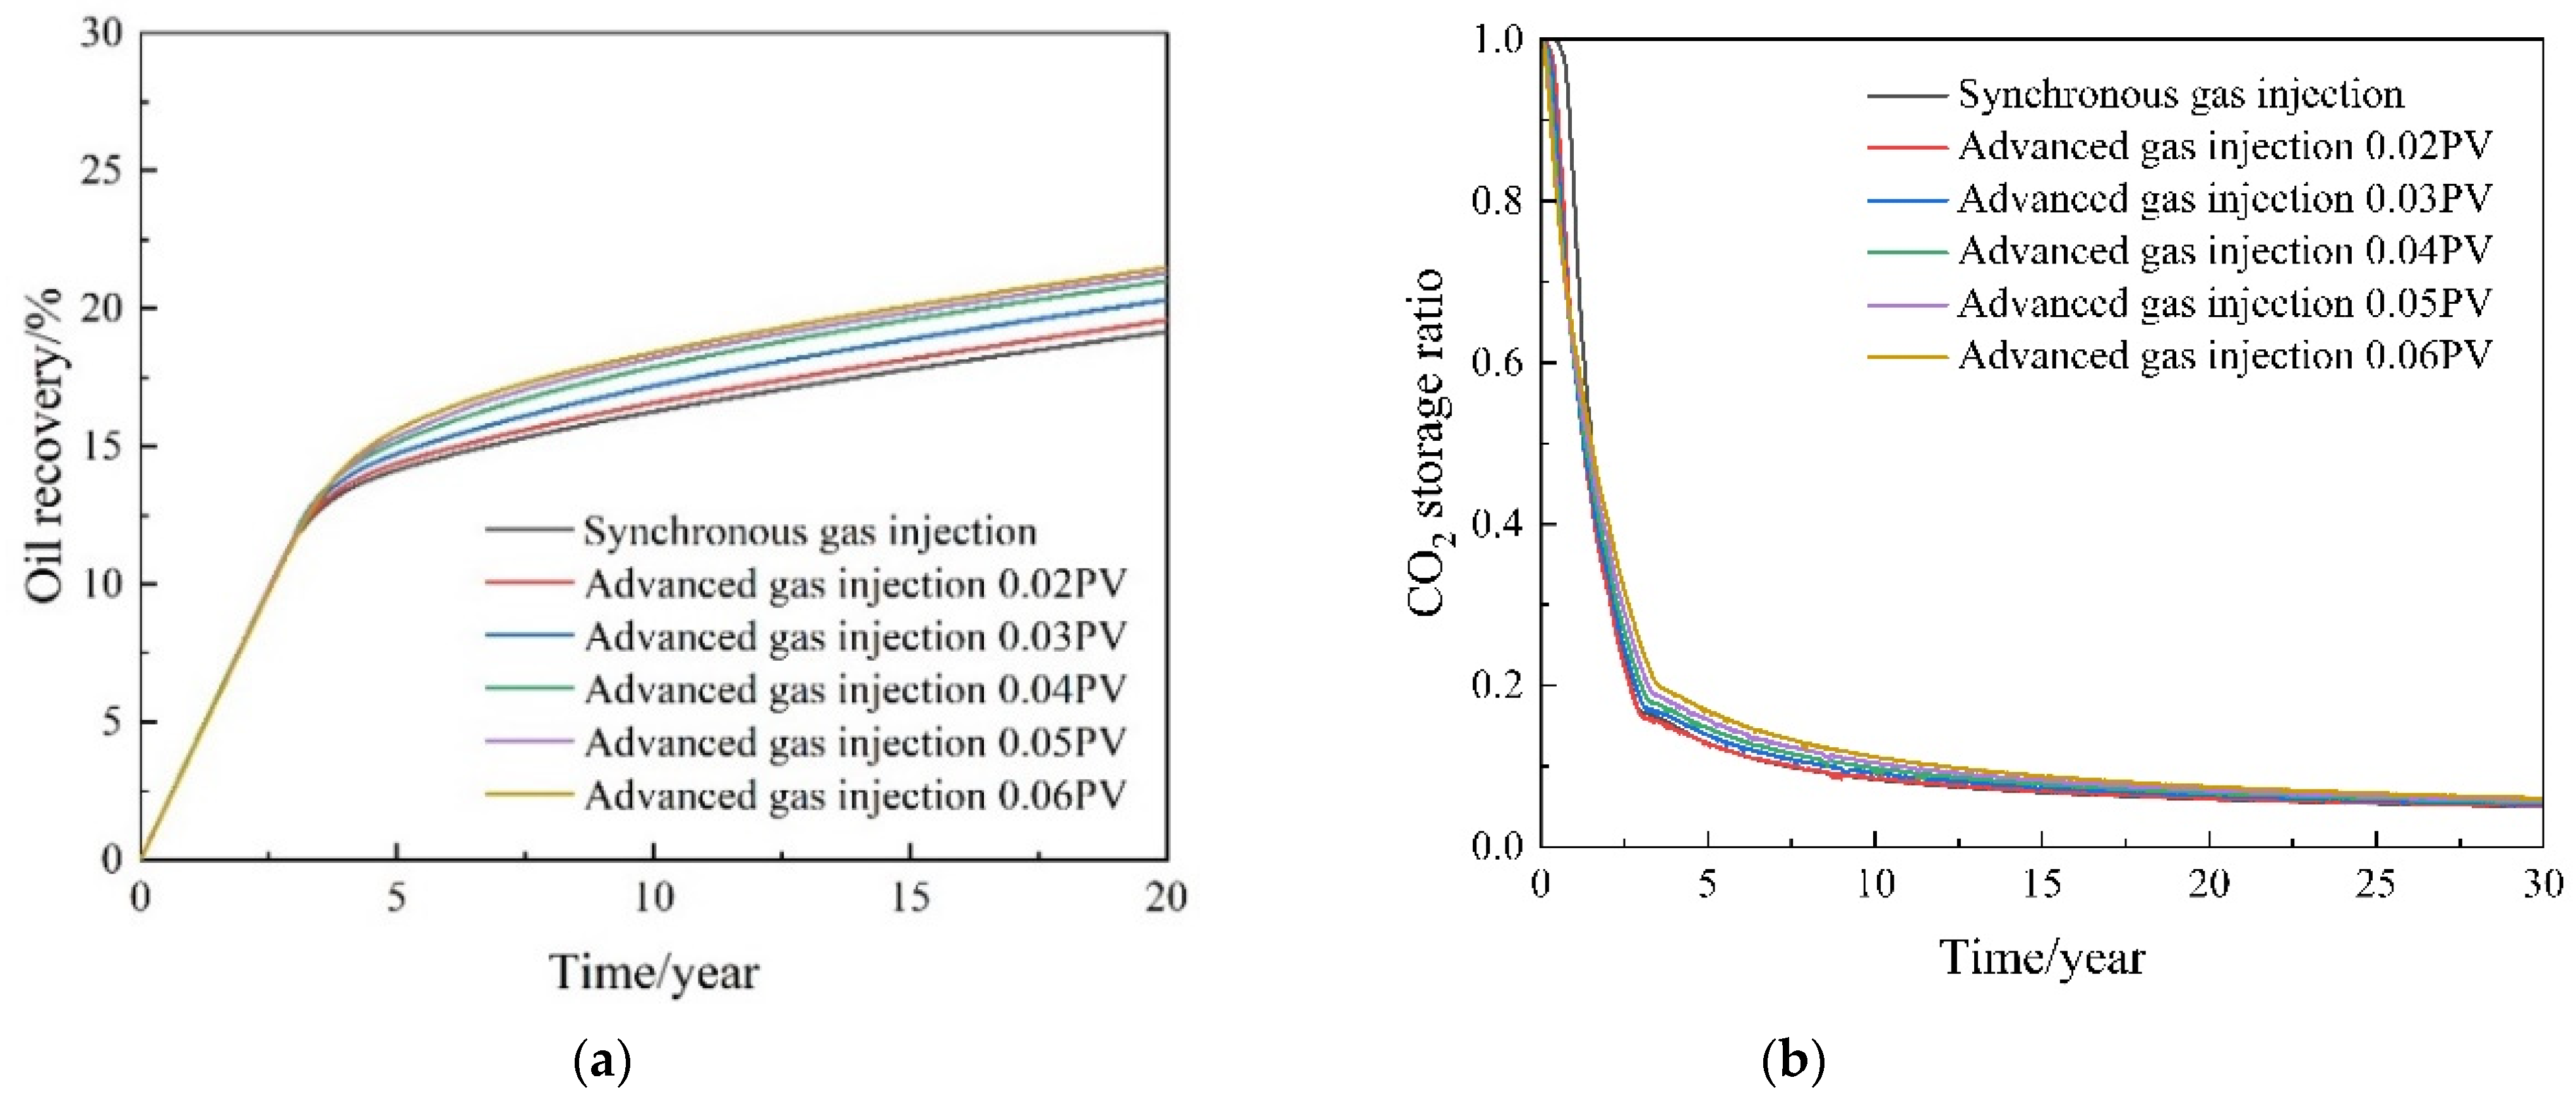
Injection Volume
Bottom-Hole Pressure
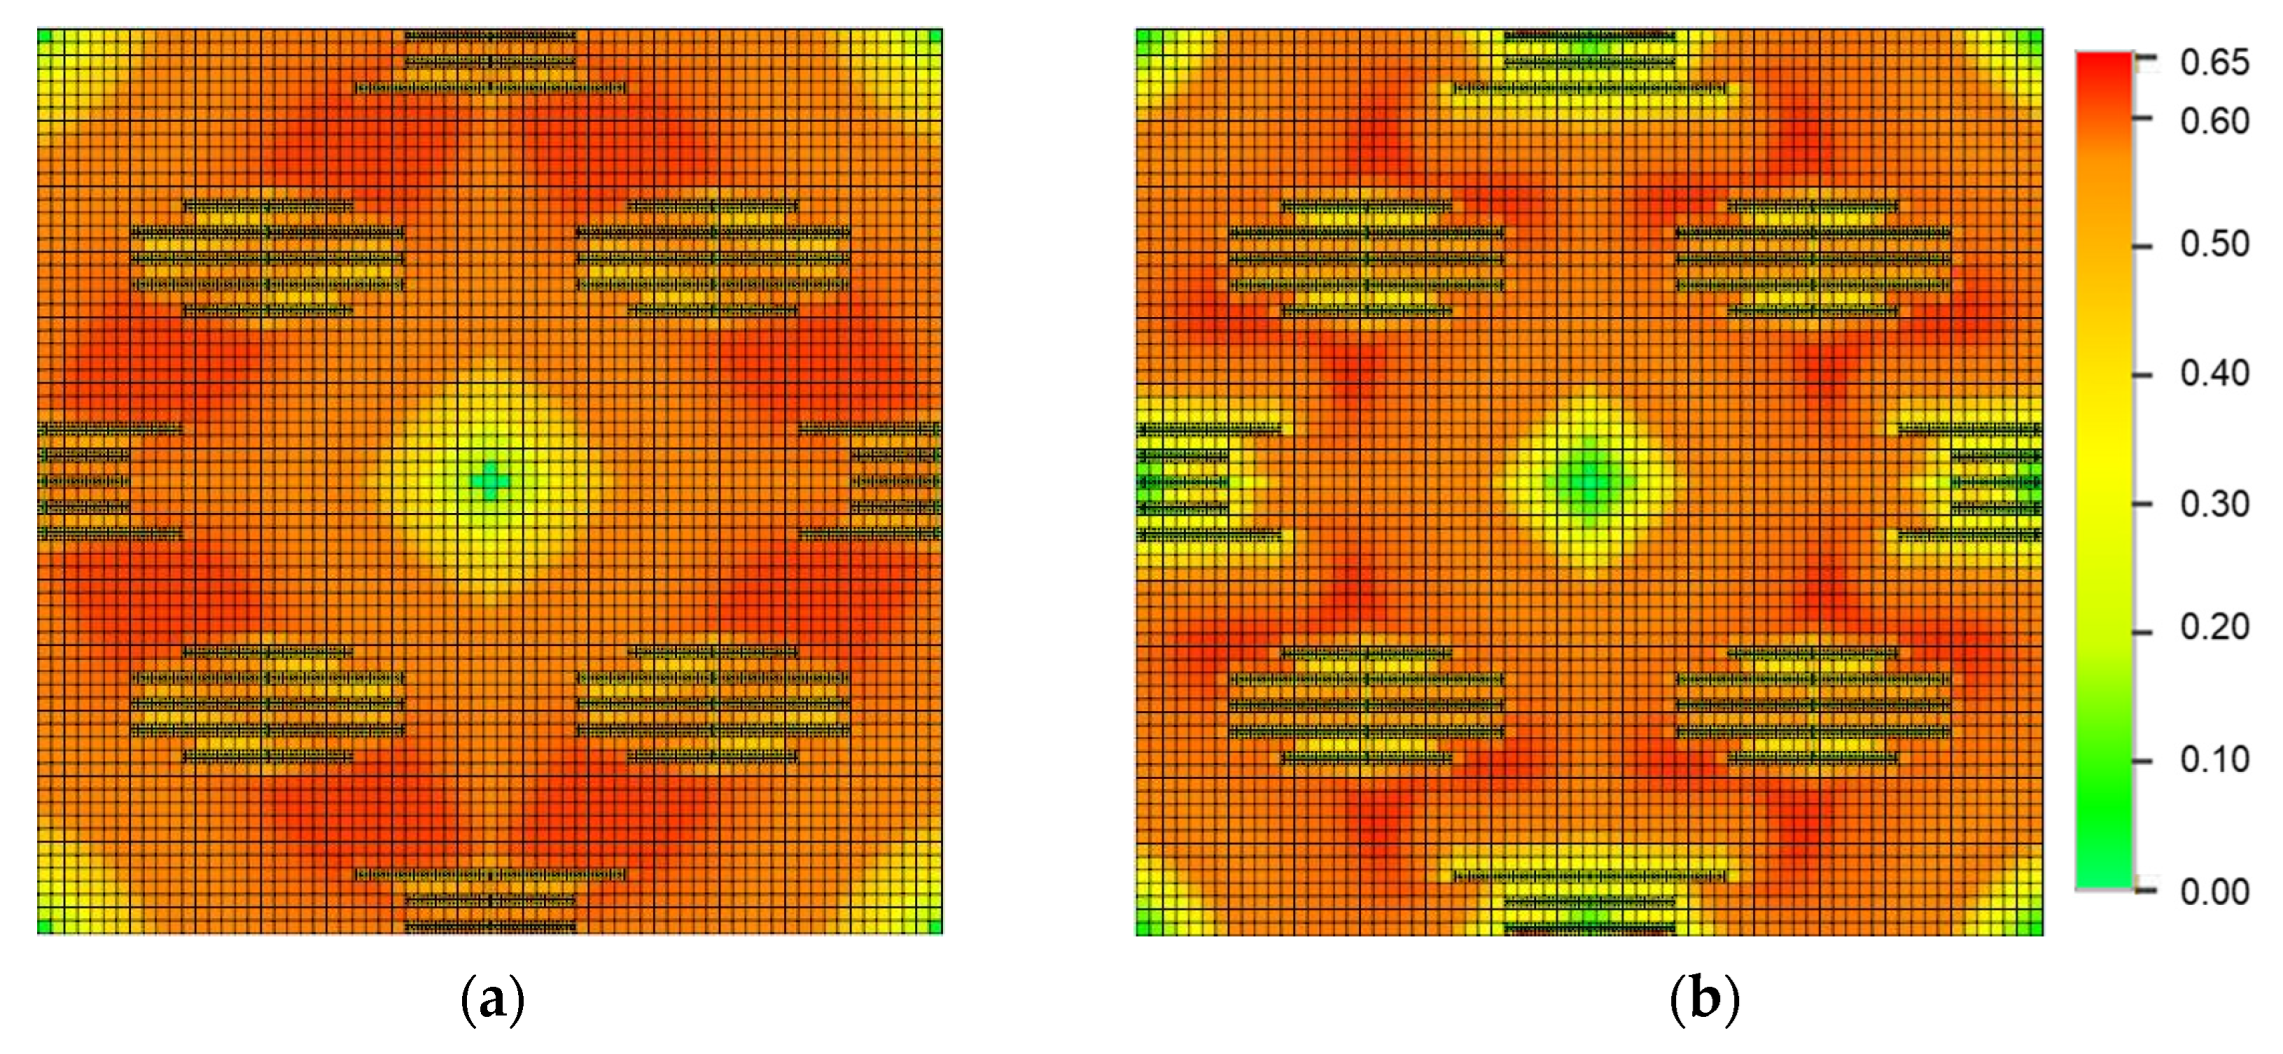
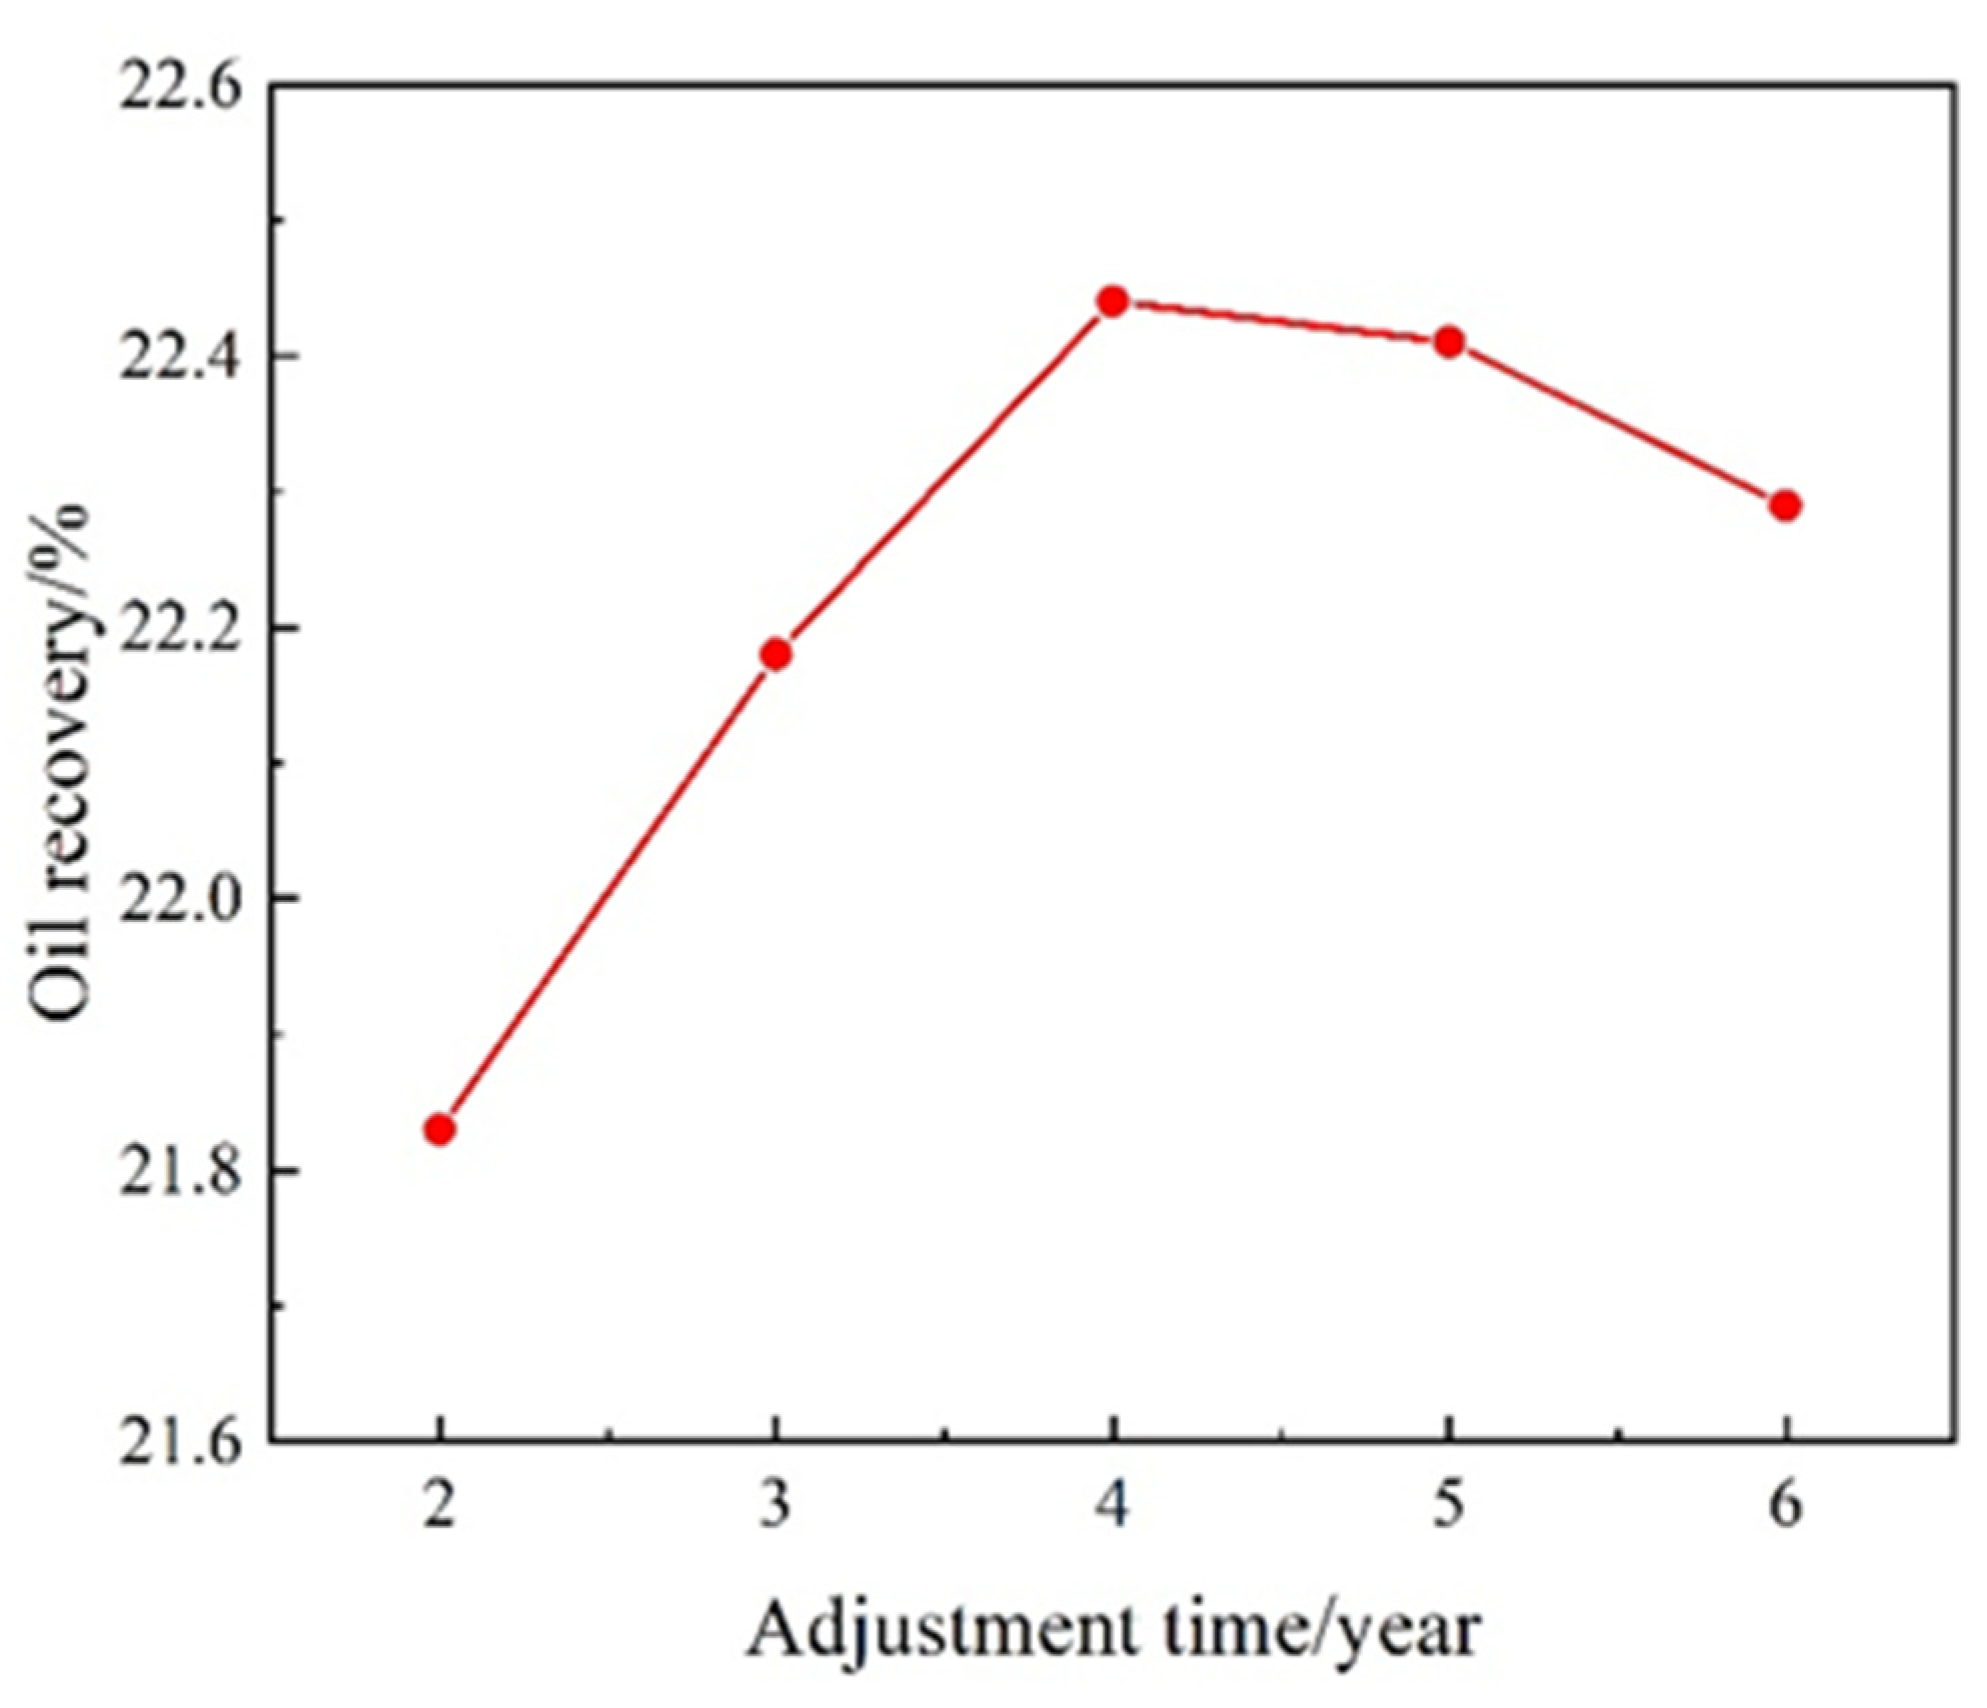
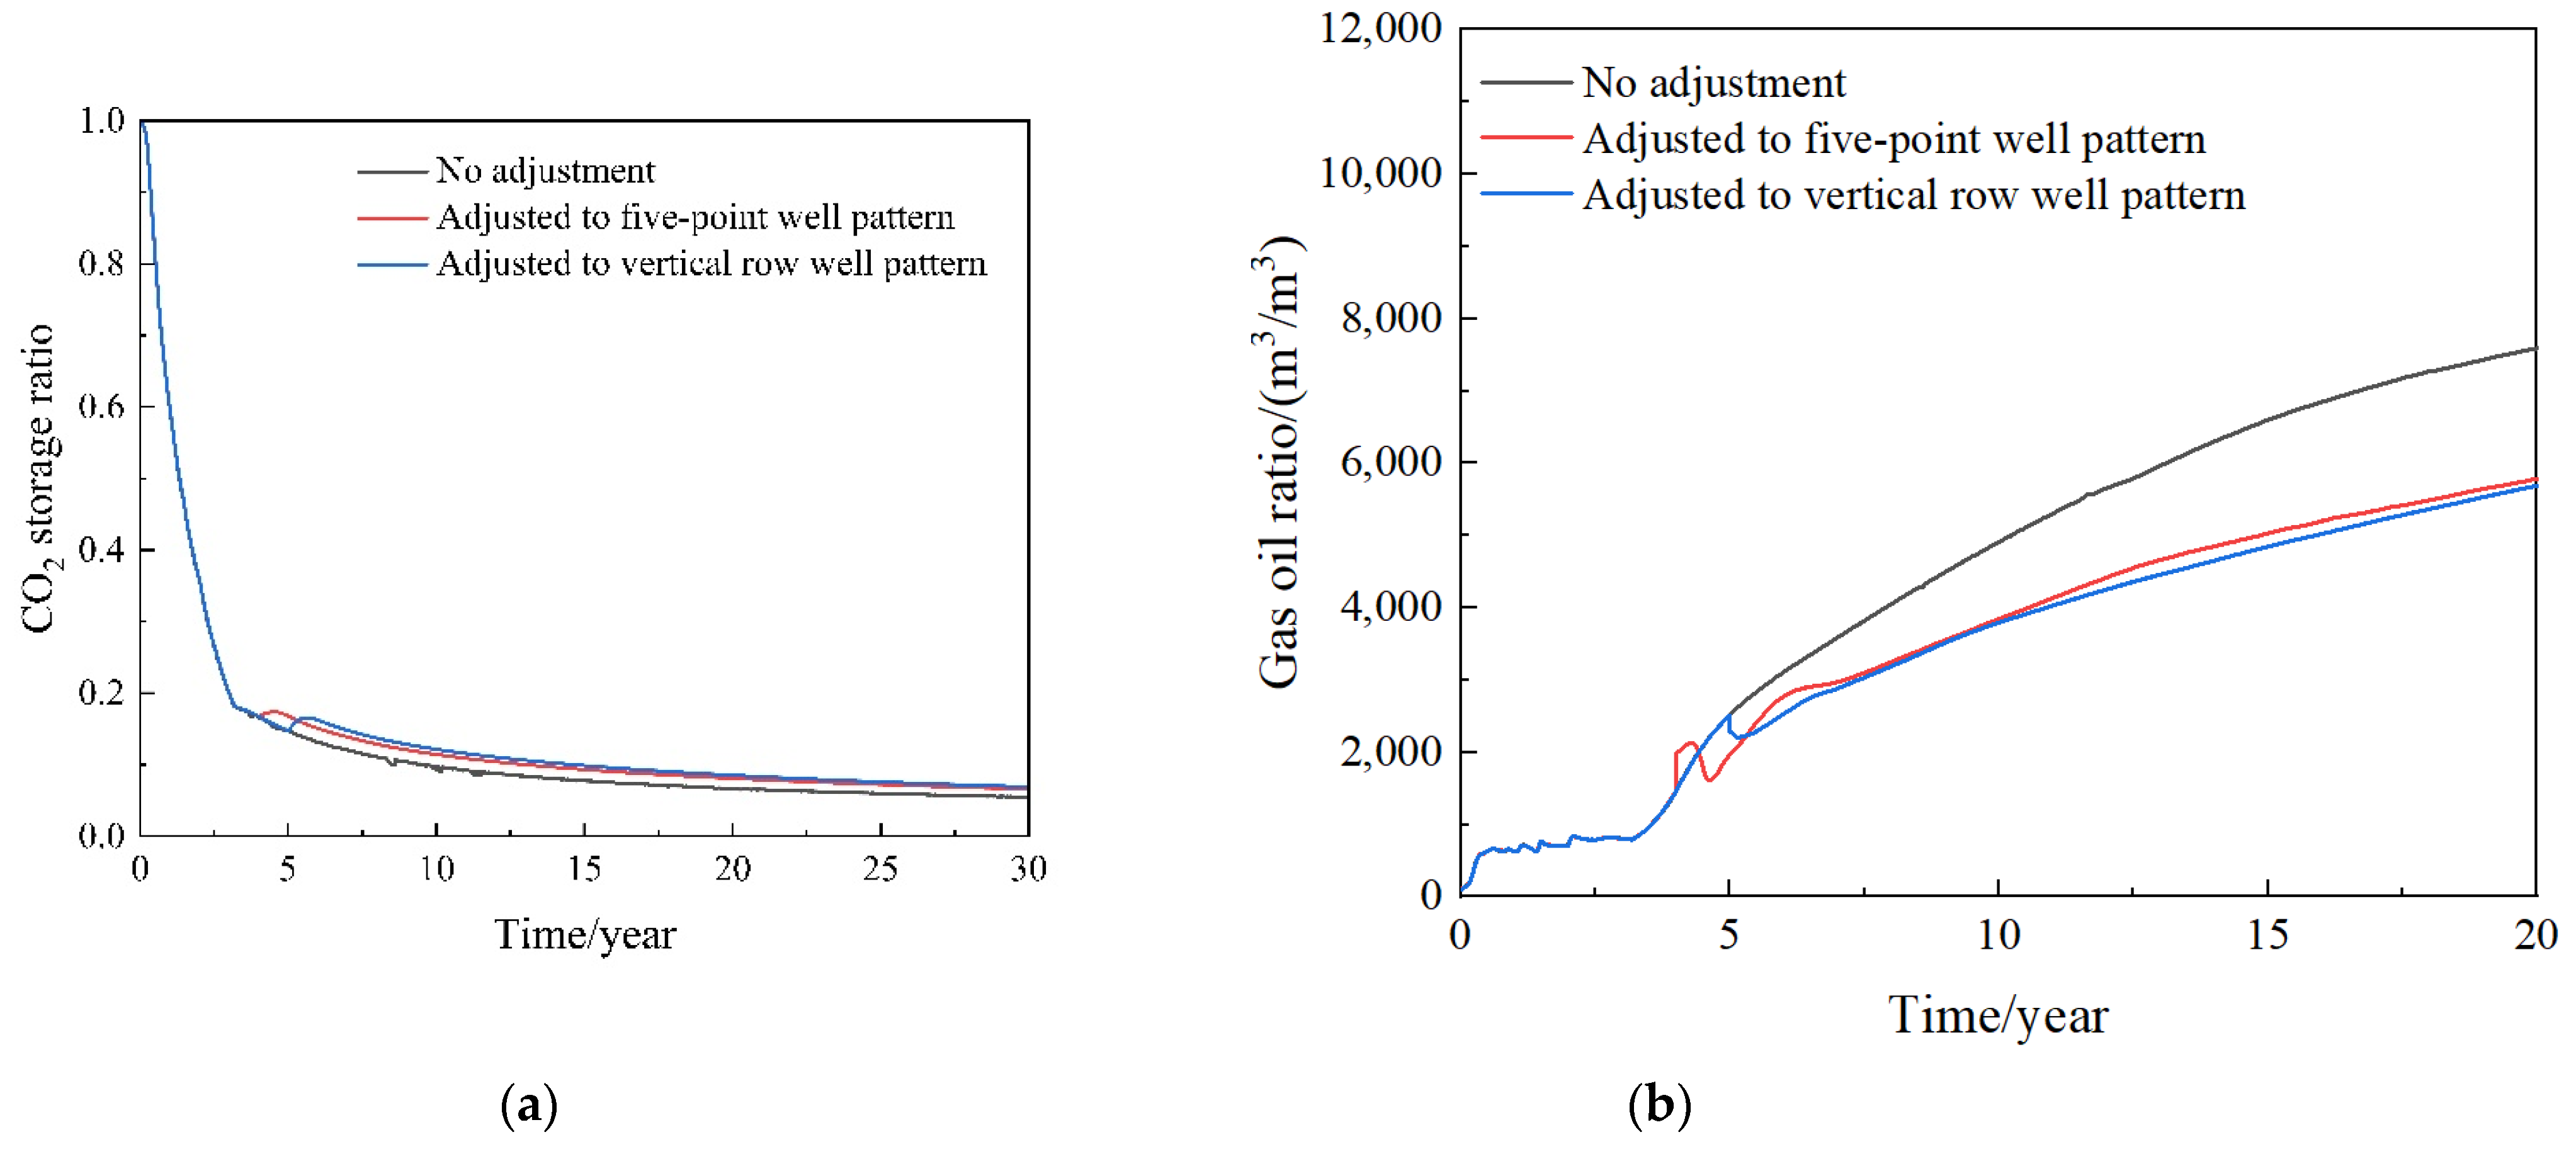
3.2.2. Well Pattern Adjustment
Transferring to Five-Point Well Pattern
Transferring to Row Well Pattern
Comparison of Well Pattern Adjustments
4. Conclusions
Author Contributions
Funding
Data Availability Statement
Conflicts of Interest
References
- Yu, H.; Yang, Z.; Ma, T.; Lei, Z.; Cheng, S.; Chen, H. The feasibility of asynchronous injection alternating production for multistage fractured horizontal wells in a tight oil reservoir. Pet. Sci. Bull. 2018, 3, 32–44. [Google Scholar]
- Guo, J.; Tao, L.; Zeng, F. Optimization of refracturing timing for horizontal wells in tight oil reservoirs: A case study of Cretaceous Qingshankou Formation, Songliao Basin, NE China. Pet. Explor. Dev. 2019, 46, 153–162. [Google Scholar] [CrossRef]
- Yu, H.; Yang, Z.; Luo, L.; Liu, J.; Cheng, S.; Qu, X.; Lei, Q.; Lu, J. Application of cumulative-in-situ-injection-production technology to supplement hydrocarbon recovery among fractured tight oil reservoirs: A case study in Changqing Oilfield, China. Fuel 2019, 242, 804–818. [Google Scholar] [CrossRef]
- Wang, Y.; Cheng, S.; Zhang, K.; He, Y.; Feng, N.; Qin, J.; Luo, L.; Yu, H. A Comprehensive Work Flow To Characterize Waterflood-Induced Fractures by Integrating Real-Time Monitoring, Formation Test, and Dynamic Production Analysis Applied to Changqing Oil Field, China. SPE Reserv. Eval. Eng. 2018, 22, 692–708. [Google Scholar] [CrossRef]
- Qi, S.; Yu, H.; Xie, F.; Hu, M.; Lu, J.; Wang, Y. Experimental Investigation on the CO2 Effective Distance and CO2-EOR Storage for Tight Oil Reservoir. Energy Fuels 2022, 37, 339–349. [Google Scholar] [CrossRef]
- Zhang, J.; Zhang, H.X.; Ma, L.Y.; Liu, Y.; Zhang, L. Performance evaluation and mechanism with different CO2 flooding modes in tight oil reservoir with fractures. J. Pet. Sci. Eng. 2020, 188, 106950. [Google Scholar] [CrossRef]
- Qin, G.; Dai, X.; Sui, L.; Geng, M.; Sun, L.; Zheng, Y.; Bai, Y. Study of massive water huff-n-puff technique in tight oil field and its field application. J. Pet. Sci. Eng. 2020, 196, 107514. [Google Scholar] [CrossRef]
- Ma, N.; Li, C.; Wang, F.; Liu, Z.; Zhang, Y.; Jiang, L.; Shu, Y.; Du, D. Laboratory Study on the Oil Displacement Process in Low-Permeability Cores with Different Injection Fluids. ACS Omega 2022, 7, 8013–8022. [Google Scholar] [CrossRef]
- Lashkarbolooki, M.; Ayatollahi, S. Experimental investigation on CO2-light crude oil interfacial and swelling behavior. Chin. J. Chem. Eng. 2018, 26, 373–379. [Google Scholar] [CrossRef]
- Tang, M.; Wang, C.; Deng, X.; Yang, H.; Lu, J.; Yu, H. Experimental investigation on plugging performance of nanospheres in low-permeability reservoir with bottom water. Adv. Geo Energy Res. 2022, 6, 95–103. [Google Scholar] [CrossRef]
- Yu, H.; Wang, S.; Yang, H.; Yang, Y.; Zhang, J.; Wang, Y.; Yang, W.; Lu, J. A Systematic Method to Investigate the EOR Mechanism of Nanospheres: Laboratory Experiments from Core to Micro Perspective. Energy Fuels 2023, 37, 2053–2065. [Google Scholar] [CrossRef]
- Qi, S.C.; Yu, H.-Y.; Han, X.-B.; Xu, H.; Liang, T.-B.; Jin, X.; Qu, X.-F.; Du, Y.-J.; Xu, K. Countercurrent imbibition in low-permeability porous media: Non-diffusive behavior and implications in tight oil recovery. Pet. Sci. 2023, 20, 322–336. [Google Scholar] [CrossRef]
- Yu, H.; Chen, Z.; Lu, X.; Cheng, S.; Xie, Q.; Qu, X. Review of enhanced oil recovery by carbonated water injection. Pet. Sci. Bull. 2020, 2, 204–228. [Google Scholar]
- Li, S.; Li, Z.; Dong, Q. Diffusion coefficients of supercritical CO2 in oil-saturated cores under low permeability reservoir conditions. J. CO2 Util. 2016, 14, 47–60. [Google Scholar] [CrossRef]
- Li, H.; Zheng, S.; Yang, D. Enhanced swelling effect and viscosity reduction of solvent (s)/CO2/heavy-oil systems. SPE J. 2013, 18, 695–707. [Google Scholar] [CrossRef]
- Zhang, C.; Xi, L.; Wu, P.; Li, Z. A novel system for reducing CO2-crude oil minimum miscibility pressure with CO2-soluble surfactants. Fuel 2020, 281, 118690. [Google Scholar] [CrossRef]
- Hemmati-Sarapardeh, A.; Ayatollahi, S.; Ghazanfari, M.H.; Masihi, M. Experimental determination of interfacial tension and miscibility of the CO2–crude oil system; temperature, pressure, and composition effects. J. Chem. Eng. Data 2014, 59, 61–69. [Google Scholar] [CrossRef]
- Abedini, A.; Mosavat, N.; Torabi, F. Determination of Minimum Miscibility Pressure of Crude Oil-CO2 System by Oil Swelling/Extraction Test. Energy Technol. 2014, 2, 431–439. [Google Scholar] [CrossRef]
- Cao, M.; Gu, Y. Oil recovery mechanisms and asphaltene precipitation phenomenon in immiscible and miscible CO2 flooding processes. Fuel 2013, 109, 157–166. [Google Scholar] [CrossRef]
- Xu, Z.X.; Li, S.Y.; Li, B.F.; Chen, D.Q.; Liu, Z.Y.; Li, Z.M. A review of development methods and EOR technologies for carbonate reservoirs. Pet. Sci. 2020, 17, 990–1013. [Google Scholar] [CrossRef]
- Guo, Y.; Liu, F.; Qiu, J.; Xu, Z.; Bao, B. Microscopic transport and phase behaviors of CO2 injection in heterogeneous formations using microfluidics. Energy 2022, 256, 124524. [Google Scholar] [CrossRef]
- Hao, H.; Hou, J.; Zhao, F.; Song, Z.; Hou, L.; Wang, Z. Gas channeling control during CO 2 immiscible flooding in 3D radial flow model with complex fractures and heterogeneity. J. Pet. Sci. Eng. 2016, 146, 890–901. [Google Scholar] [CrossRef]
- Zhao, F.; Wang, P.; Huang, S.; Hao, H.; Zhang, M.; Lu, G. Performance and applicable limits of multi-stage gas channeling control system for CO2 flooding in ultra-low permeability reservoirs. J. Pet. Sci. Eng. 2020, 192, 107336. [Google Scholar] [CrossRef]
- Zhang, Y.; Wang, Y.; Xue, F.; Wang, Y.; Ren, B.; Zhang, L.; Ren, S. CO2 foam flooding for improved oil recovery: Reservoir simulation models and influencing factors. J. Pet. Sci. Eng. 2015, 133, 838–850. [Google Scholar] [CrossRef]
- Liao, G.; He, D.; Wang, G.; Wang, L.; Wang, Z.; Su, C.; Qin, Q.; Bai, J.; Hu, Z.; Huang, Z.; et al. Discussion on the limit recovery factor of carbon dioxide flooding in a permanent sequestration scenario. Pet. Explor. Dev. 2022, 49, 1463–1470. [Google Scholar] [CrossRef]
- Guofeng, W. Carbon dioxide capture, enhanced-oil recovery and storage technology and engineering practice in Jilin Oilfield, NE China. Pet. Explor. Dev. 2023, 50, 245–254. [Google Scholar]
- Zhang, Y.; Di, Y.; Yu, W.; Sepehrnoori, K. A Comprehensive Model for Investigation of Carbon Dioxide Enhanced Oil Recovery with Nanopore Confinement in the Bakken Tight Oil Reservoir. SPE Reserv. Eval. Eng. 2018, 22, 122–136. [Google Scholar] [CrossRef]
- Afari, S.; Ling, K.; Sennaoui, B.; Maxey, D.; Oguntade, T.; Porlles, J. Optimization of CO2 huff-n-puff EOR in the Bakken Formation using numerical simulation and response surface methodology. J. Pet. Sci. Eng. 2022, 215, 110552. [Google Scholar] [CrossRef]
- Yu, W.; Lashgari, H.R.; Sepehrnoori, K. Simulation study of CO2 huff-n-puff process in Bakken tight oil reservoirs. In Proceedings of the SPE Western North American and Rocky Mountain Joint Meeting, Denver, CO, USA, 17–18 April 2014. [Google Scholar]
- Sun, J.; Zou, A.; Sotelo, E.; Schechter, D. Numerical simulation of CO2 huff-n-puff in complex fracture networks of unconventional liquid reservoirs. J. Nat. Gas Sci. Eng. 2016, 31, 481–492. [Google Scholar] [CrossRef]
- Kamali, F.; Hussain, F.; Cinar, Y. A Laboratory and Numerical-Simulation Study of Co-Optimizing CO2 Storage and CO2 Enhanced Oil Recovery. SPE J. 2015, 20, 1227–1237. [Google Scholar] [CrossRef]
- Sheng, J.J.; Chen, K. Evaluation of the EOR potential of gas and water injection in shale oil reservoirs. J. Unconv. Oil Gas Resour. 2014, 5, 1–9. [Google Scholar] [CrossRef]
- Sun, L.; Dou, H.; Li, Z.; Hu, Y.; Hao, X. Assessment of CO2 storage potential and carbon capture, utilization and storage prospect in China. J. Energy Inst. 2018, 91, 970–977. [Google Scholar] [CrossRef]
- Shiyi, Y.; Qiang, W. New progress and prospect of oilfields development technologies in China. Pet. Explor. Dev. 2018, 45, 698–711. [Google Scholar]
- Ren, B.; Duncan, I.J. Reservoir simulation of carbon storage associated with CO2 EOR in residual oil zones, San Andres formation of West Texas, Permian Basin, USA. Energy 2018, 167, 391–401. [Google Scholar] [CrossRef]
- Honarpour, M.M.; Nagarajan, N.R.; Grijalba, A.C.; Valle, M.; Adesoye, K. Rock-Fluid Characterization for Miscible CO2 Injection: Residual Oil Zone, Seminole Field, Permian Basin. In Proceedings of the SPE Annual Technical Conference and Exhibition, Florence, Italy, 19–22 September 2010. [Google Scholar]
- Jeschke, P.A.; Schoeling, L.; Hemmings, J. CO2 flood potential of California oil reservoirs and possible CO2 sources. In Proceedings of the SPE Annual Technical Conference and Exhibition, Dallas, TX, USA, 1–4 October 2000. [Google Scholar]
- Luo, P.; Luo, W.; Li, S. Effectiveness of miscible and immiscible gas flooding in recovering tight oil from Bakken reservoirs in Sas-katchewan, Canada. Fuel 2017, 208, 626–636. [Google Scholar] [CrossRef]
- Wang, X.; Luo, P.; Er, V.; Huang, S. Assessment of CO2 flooding potential for Bakken formation, Saskatchewan. In Proceedings of the SPE Canada Unconventional Resources Conference, Calgary, AB, Canada, 19–21 October 2010. [Google Scholar]
- Gong, Y.; Gu, Y. Miscible CO2 simultaneous water-and-gas (CO2-SWAG) injection in the Bakken formation. In Proceedings of the SPE/CSUR Unconventional Resources Conference, Calgary, AB, Canada, 20–22 October 2015. [Google Scholar]
- Li, Q.; Han, Y.; Liu, X.; Ansari, U.; Cheng, Y.; Yan, C. Hydrate as a by-product in CO2 leakage during the long-term sub-seabed sequestration and its role in preventing further leakage. Environ. Sci. Pollut. Res. 2022, 29, 77737–77754. [Google Scholar] [CrossRef] [PubMed]
- Li, Q.; Wang, F.; Wang, Y.; Forson, K.; Cao, L.; Zhang, C.; Zhou, C.; Zhao, B.; Chen, J. Experimental investigation on the high-pressure sand suspension and adsorption capacity of guar gum fracturing fluid in low-permeability shale reservoirs: Factor analysis and mechanism disclosure. Environ. Sci. Pollut. Res. 2022, 29, 53050–53062. [Google Scholar] [CrossRef] [PubMed]
- Yi, L.; Shenglai, Y.; Xing, Z. Experimental research on CO2 miscible flooding by advanced gas injection in low permeability reservoir. Pet. Geol. Recovery Effic. 2012, 19, 78–80. [Google Scholar]
- Wang, J.-F.; Jiang, T.-W.; Chen, Q.; Chen, J.; Ma, X.-L.; Gai, C.-C. Research on Synergistic Development Technology of Advanced Gas Injection and Oil Accumulation Jointed Under Gas-Oil-Geothermal Storage Based on Molecular Sieve and Component Gradient Effect. In Proceedings of the International Field Exploration and Development Conference, Xi’an, China, 16–18 November 2022; Springer Nature: Singapore, 2022; pp. 4338–4351. [Google Scholar]
- Liu, Y.; Rui, Z. A Storage-Driven CO2 EOR for a Net-Zero Emission Target. Engineering 2022, 18, 79–87. [Google Scholar] [CrossRef]
- Zhang, X.; Wei, B.; Shang, J.; Gao, K.; Pu, W.; Xu, X.; Wood, C.; Sun, L. Alterations of geochemical properties of a tight sandstone reservoir caused by supercritical CO2-brine-rock interactions in CO2-EOR and geosequestration. J. CO2 Util. 2018, 28, 408–418. [Google Scholar] [CrossRef]
- Liu, Y.; Rui, Z.; Yang, T.; Dindoruk, B. Using propanol as an additive to CO2 for improving CO2 utilization and storage in oil reservoirs. Appl. Energy 2022, 311, 118640. [Google Scholar] [CrossRef]
- Ren, B.; Jeong, H. Influence of injection strategies on local capillary trapping during geological carbon sequestration in saline aquifers. J. CO2 Util. 2018, 27, 441–449. [Google Scholar] [CrossRef]
- Syed, F.I.; Muther, T.; Van, V.P.; Dahaghi, A.K.; Negahban, S. Numerical trend analysis for factors affecting EOR performance and CO2 storage in tight oil reservoirs. Fuel 2022, 316, 123370. [Google Scholar] [CrossRef]
- Yu, H.; Lu, X.; Fu, W.; Wang, Y.; Xu, H.; Xie, Q.; Qu, X.; Lu, J. Determination of minimum near miscible pressure region during CO2 and associated gas injection for tight oil reservoir in Ordos Basin, China. Fuel 2019, 263, 116737. [Google Scholar] [CrossRef]
- Chen, H.; Liu, X.L.; Jia, N.H.; Zhang, K.; Yang, R.; Yang, S. Prospects and key scientific issues of CO2 near-miscible flooding. Pet. Sci. Bull. 2020, 5, 392–401. [Google Scholar]
- Chen, H.; Li, B.; Zhang, X.; Wang, Q.; Wang, X.; Yang, S. Effect of gas contamination and well depth on pressure interval of CO2 near-miscible flooding. J. Pet. Sci. Eng. 2019, 176, 43–50. [Google Scholar] [CrossRef]
- Bachu, S.; Bonijoly, D.; Bradshaw, J.; Burruss, R.; Holloway, S.; Christensen, N.P.; Mathiassen, O.M. CO2 storage capacity estimation: Methodology and gaps. Int. J. Greenh. Gas Control 2007, 1, 430–443. [Google Scholar] [CrossRef]
- Ji, M.; Kwon, S.; Choi, S.; Kim, M.; Choi, B.; Min, B. Numerical investigation of CO2-carbonated water-alternating-gas on enhanced oil recovery and geological carbon storage. J. CO2 Util. 2023, 74, 102544. [Google Scholar] [CrossRef]


| Core | Diameter (cm) | Length (cm) | Porosity (%) | Permeability (mD) | Experiment |
|---|---|---|---|---|---|
| 1 | 2.528 | 7.974 | 5.79 | 0.37 | Continuous CO2 injection |
| 2 | 2.524 | 7.983 | 5.95 | 0.21 | |
| 3 | 2.524 | 7.966 | 6.35 | 0.27 | |
| 4 | 2.523 | 7.924 | 7.9 | 0.33 | |
| 5 | 2.525 | 7.959 | 8.04 | 0.23 | |
| 6 | 2.531 | 7.973 | 8.07 | 0.34 | |
| 7 | 2.528 | 7.971 | 7.43 | 0.48 | |
| 8 | 2.521 | 7.939 | 6.84 | 0.3 | |
| 9 | 2.521 | 7.956 | 7.06 | 0.3 | Advanced CO2 injection |
| 10 | 2.531 | 7.955 | 6.76 | 0.21 | |
| 11 | 2.521 | 7.966 | 7.92 | 0.36 | |
| 12 | 2.526 | 7.969 | 8.26 | 0.33 | |
| 13 | 2.521 | 7.955 | 7.64 | 0.24 | |
| 14 | 2.531 | 7.954 | 9.06 | 0.34 | |
| 15 | 2.523 | 7.981 | 8.49 | 0.32 | |
| 16 | 2.524 | 7.993 | 8.56 | 0.522 |
| Component | Mole Fraction (%) | Component | Mole Fraction (%) |
|---|---|---|---|
| CO2 | 0.051 | C14 H30 | 2.455 |
| N2 | 0.952 | C15 H32 | 2.764 |
| CH4 | 20.959 | C16 H34 | 2.214 |
| C2H6 | 7.283 | C17 H36 | 2.148 |
| C3H8 | 11.595 | C18 H38 | 1.955 |
| iC4H10 | 2.774 | C19 H40 | 1.892 |
| nC4H10 | 4.889 | C20 H42 | 1.811 |
| iC5H12 | 2.256 | C21 H44 | 1.724 |
| nC5H12 | 2.211 | C22 H46 | 1.431 |
| C6H14 | 3.096 | C23 H48 | 1.346 |
| C7H16 | 2.987 | C24 H50 | 1.037 |
| C8H18 | 2.599 | C25 H52 | 0.985 |
| C9H20 | 2.659 | C26 H54 | 0.797 |
| C10H22 | 2.598 | C27 H56 | 0.743 |
| C11H24 | 2.643 | C28 H58 | 0.548 |
| C12 H26 | 2.658 | C29 H60 | 0.498 |
| C13 H28 | 2.609 | C30+ | 0.837 |
| Cationic (mg·L−1) | Anionic (mg·L−1) | Mineralization (mg·L−1) | Hydrated | PH | ||||
|---|---|---|---|---|---|---|---|---|
| K+ + Na+ | Ca2+ | Mg2+ | Cl– | SO42– | HCO3– | |||
| 6619 | 4742 | 325 | 22,919 | 716 | 186 | 35.4235,420 | CaCl2 | 6.62 |
| Model Parameter | Value |
|---|---|
| Number of grid blocks, x y z | 69 × 69 × 1 |
| Dimensions, x y z (m) | 12.5 × 12.5 × 8.5 |
| Length of horizontal well (m) | 100 |
| Horizontal-well spacing (m) | 425 |
| Long/short hydraulic-fracture half-length (m) | 125/75 |
| Hydraulic-fracture spacing (m) | 25 |
| Hydraulic-fracture conductivity (mD·m) | 100 |
| Matrix porosity (%) | 8.1 |
| Matrix permeability (mD) | 0.28 |
| Natural-fracture porosity (%) | 0.5 |
| Natural-fracture permeability (mD) | 2.8 |
| Natural-fracture spacing (m) | 25 |
| Initial oil saturation (%) | 65 |
| Reservoir temperature (℃) | 91.73 |
| Original formation pressure (MPa) | 19.74 |
| Component | C1 | C2 | C3 | C4 | C5 | C6-C13 | C14-C19 | C20-C30+ | CO2 | N2 |
|---|---|---|---|---|---|---|---|---|---|---|
| Content (%) | 20.959 | 7.283 | 11.595 | 7.663 | 4.467 | 21.849 | 13.427 | 11.754 | 0.051 | 0.952 |
Disclaimer/Publisher’s Note: The statements, opinions and data contained in all publications are solely those of the individual author(s) and contributor(s) and not of MDPI and/or the editor(s). MDPI and/or the editor(s) disclaim responsibility for any injury to people or property resulting from any ideas, methods, instructions or products referred to in the content. |
© 2023 by the authors. Licensee MDPI, Basel, Switzerland. This article is an open access article distributed under the terms and conditions of the Creative Commons Attribution (CC BY) license (https://creativecommons.org/licenses/by/4.0/).
Share and Cite
Zhang, L.; Sun, T.; Han, X.; Shi, J.; Zhang, J.; Tang, H.; Yu, H. Feasibility of Advanced CO2 Injection and Well Pattern Adjustment to Improve Oil Recovery and CO2 Storage in Tight-Oil Reservoirs. Processes 2023, 11, 3104. https://doi.org/10.3390/pr11113104
Zhang L, Sun T, Han X, Shi J, Zhang J, Tang H, Yu H. Feasibility of Advanced CO2 Injection and Well Pattern Adjustment to Improve Oil Recovery and CO2 Storage in Tight-Oil Reservoirs. Processes. 2023; 11(11):3104. https://doi.org/10.3390/pr11113104
Chicago/Turabian StyleZhang, Lijun, Tianwei Sun, Xiaobing Han, Jianchao Shi, Jiusong Zhang, Huiting Tang, and Haiyang Yu. 2023. "Feasibility of Advanced CO2 Injection and Well Pattern Adjustment to Improve Oil Recovery and CO2 Storage in Tight-Oil Reservoirs" Processes 11, no. 11: 3104. https://doi.org/10.3390/pr11113104
APA StyleZhang, L., Sun, T., Han, X., Shi, J., Zhang, J., Tang, H., & Yu, H. (2023). Feasibility of Advanced CO2 Injection and Well Pattern Adjustment to Improve Oil Recovery and CO2 Storage in Tight-Oil Reservoirs. Processes, 11(11), 3104. https://doi.org/10.3390/pr11113104