Article

Investigation of Pressure Variations in Hose Pumps under Different Flow Regimes Using Bidirectional Fluid–Structure Interaction

1
College of Mechanical and Electrical Engineering, Shihezi University, Shihezi 832003, China
2
Xinjiang Production and Construction Corps Key Laboratory of Modern Agricultural Machinery, Shihezi 832003, China
3
Key Laboratory of Northwest Agricultural Equipment, Ministry of Agriculture and Rural Affairs, Shihezi 832003, China
4
Bingtuan Energy Development Institute, Shihezi University, Shihezi 832003, China
5
Professional Basic Teaching Department, Chifeng Industrial Vocational Technical College, Chifeng 024005, China
6
School of Mechanical Engineer, North China University of Water Resources & Elect Power, Zhengzhou 450045, China
*
Author to whom correspondence should be addressed.
Processes 2023, 11(11), 3079; https://doi.org/10.3390/pr11113079
Submission received: 4 October 2023 / Revised: 16 October 2023 / Accepted: 24 October 2023 / Published: 26 October 2023

Abstract

:
Hose pumps, renowned for their ability to efficiently transport highly viscous and corrosive fluids, hold an irreplaceable position in numerous engineering domains. With a wide range of fluid types being transported by hose pumps, the study of pressure variations during the conveyance of different fluid states is of paramount importance, as it positively contributes to optimizing hose pump structures, reducing noise, and enhancing hose pump longevity. To investigate pressure variations in hose pumps during the conveyance of varying fluid states, this paper employs a bidirectional fluid–structure coupling method and utilizes commercial finite element software, ANSYS. The research validates the causes of variations in hose pumps during fluid conveyance and examines the overall pressure distribution within the fluid domain of hose pumps conveying different fluid states at varying rotor speeds. The results indicate that when the fluid within the hose pump is in a turbulent state, pressure variations exhibit multiple minor amplitude oscillations, whereas in a laminar state, pressure variations display fewer oscillations but with more significant amplitudes. Moreover, higher rotor speeds exacerbate pressure variations. Recommendations include optimizing the shape of the squeezing roller and enhancing pressure variation control through shell angle optimization.

1. Introduction

Hose pumps, also known as peristaltic pumps, represent a distinct category within positive displacement pumps [1]. They find extensive applications across a wide range of engineering fields, including wastewater treatment, chemical industries, food production, brewing, sugar manufacturing, paper and ceramics industries, construction, and mining [2,3,4,5,6]. As a complex engineering apparatus, a hose pump comprises critical components such as the pump casing, hose, squeezing rollers, couplings, and an electric motor. Its operational principle involves the rotation of a rotor, driven by an electric motor, which causes the squeezing rollers to exert pressure on the hose, leading to the displacement of fluid material within the hose towards the outlet. When the squeezing rollers disengage from the hose, the hose’s inherent elasticity allows it to rapidly return to its original shape, thereby creating a negative pressure environment that draws external liquid into the hose, completing the process of fluid intake and discharge [7]. This operating principle bestows hose pumps with outstanding performance in conveying highly viscous and corrosive fluids across multiple industrial applications, exhibiting remarkable reliability and operational efficiency. However, this operational principle also introduces periodic fluctuations in fluid parameters within the hose [8]. The presence of such variation impacts the noise and vibration levels of the hose pump, ultimately affecting its service life. In order to gain deeper insights into the unsteady fluid flow and pressure variations during the pumping process, this study aims to combine numerical simulations with experimental methods, focusing on comparing pressure variations in hose pumps under laminar and turbulent flow conditions.
Alexander Shamanskiy compared several Moving Mesh Techniques (MMT) applicable to fluid–structure interaction (FSI) problems and identified the most robust techniques as the BE and TIME methods, both capable of handling large grid motions without accumulating distortions [9]. Sun, Peng-Nan extended the developed FSI-SPH model to three-dimensional fluid-structure interaction by combining the multi-resolution delta(+)-SPH scheme with the Total Lagrangian SPH approach, presenting a new benchmark for free-surface FSI simulations, highlighting the model’s advantages in simulating free-surface viscous flows [10]. Han, Renkun developed a reduced-order model for fluid-structure interaction systems based on deep neural networks, offering rapid and accurate predictions of flow fields in fluid–structure interaction systems [11]. Yen Ting Ng proposed an effective 2D and 3D fluid–structure interaction method based on the discretization of the Navier–Stokes equations on irregular domains, demonstrating the ability to accurately reproduce fluid flow phenomena on irregular domains [12]. Majid Shahzad characterized hyperelastic materials and established appropriate strain energy functions (SEF) for rubber materials, presenting the constitutive model of hyperelastic materials [13]. Michał Stosiak, Mykola Karpenko, and others have elucidated the interplay between vibration and pressure variations. They have analyzed the potential for reducing valve bonnet vibrations by installing valves on vibrating surfaces. Furthermore, their research demonstrates that elastic body liners placed within the valve casing can be employed as supplementary or alternative solutions to mitigate the transmission of vibrations [14]. Gaetano Formato built a three-dimensional FSI model of an industrial peristaltic pump using ABAQUS software, enabling the prediction of von Mises stresses and flow fluctuations within the tubing while validating the model’s accuracy [15]. Gianluca Marinaro introduced a novel tool for simulating external gear pumps, reducing flow pulsations by controlling and smoothing backflow in the pump [16]. Bingchao Wang modeled and simulated axial piston pumps using the AMESim software, analyzing flow pulsations under various conditions [17]. Michael P. McIntyre focused on the entrance and exit velocities of the hose pump, proposing an alternative modeling approach for addressing volume flow rate, pulsating velocity mass, and pressure pulsations commonly found in peristaltic pumps, offering a highly adaptable solution [18]. Karpenko M, Prentkovskis O, and their team offer a valuable illustration of applying CFD simulation methods to analyze fluid dynamic phenomena. In their work, the authors examine the impact of local resistance on hydrodynamic phenomena within a hydraulic pipe and provide experimental validation [19]. Wendong Wang analyzed non-steady pressure fluctuations in hose pumps, simulating pressure variations under turbulent conditions to provide theoretical insights for optimizing hose pump design [20]. Xiao Ma employed fluid–structure interaction methods to analyze the variation and flow characteristics of hose pumps, proposing a shell optimization method to reduce variations [1]. Fu wen Liu introduced a mechanism optimization method based on a Response Surface Method (RSM) model, effectively reducing flow pulsations during hose pump operation [21]. Jinhui Yang et al. investigated velocity fluctuations under 1 Degree of Freedom (DoF) and 2 DoF conditions, modifying the exit sector’s wall contour and proposing a control strategy that combines nearly pulsation-free flow rates with slight velocity adjustments at the bottom of the periodic operating cycle [22]. Falk Esser provided an overview of the latest technologies in peristaltic pump systems, comparing them by emphasizing structural and functional differences and the advantages and disadvantages of technical implementations [23].
From the above literature, it is evident that most studies on the pressure variability of hose pumps are based on theoretical calculations and experimental comparisons. While some have investigated the variation characteristics of hose pumps, few have conducted comparative analyses of pressure variations in hose pumps when transporting fluids of varying viscosities. In practical applications, hose pumps transport a diverse range of fluids, making it essential to study pressure variations in hose pumps under different flow conditions. Such research contributes to the optimization of hose pump design and predictions of hose service life, offering value.

2. Simplified Model and Numerical Computational Methods

2.1. Geometric Model

To facilitate a comprehensive study of fluid flow and variation characteristics in hose pumps, a three-dimensional bidirectional fluid–structure interaction (FSI) model of the hose pump was established. ANSYS Workbench 19.0 was utilized, incorporating the Transient Structural module, Fluent module for fluid flow, and System Coupling module. In the ANSYS FSI algorithm, the solid domain analysis results are interpolated and transferred to the fluid domain. Subsequently, the fluid domain undergoes mesh updating, and the fluid domain analysis is conducted in conjunction with the interpolated results, convergence checks are performed. This process proceeds to the next iteration until all time steps are completed.
The FSI model of the hose pump consists of three squeezing rollers, a U-shaped hose, and a U-shaped base. The U-shaped base assembly confines the movement of the tubing during the squeezing phase. The model parameters of the hose pump are detailed in Table 1.
Subsequently, a computational domain comprising eight segments was established for numerical simulations, including the inlet and outlet, squeezing rollers, base, hose, base-to-hose contact surface, roller-to-tubing contact surface, and the fluid–structure coupling interface, as illustrated in Figure 1.

2.2. Mesh Generation

The deformation of the rubber hose caused by the squeezing rollers is a typical nonlinear simulation problem, characterized by geometric nonlinearity, material nonlinearity, contact nonlinearity, and convergence challenges, demanding high mesh accuracy. Mesh generation is divided into two parts: the fluid portion and the solid structural portion. To reduce simulation pre-processing time, accelerate computational speed, and enhance mesh density, high-order tetrahedral elements (Solid187) were employed.
Since the movement of the fluid boundary changes the fluid shape over time, dynamic meshing is activated, along with the use of two meshing methods, Smoothing and Remeshing.
To verify the grid independence, we conducted a grid independence study. The total number of grids used for this model calculation was 4.6 × 10⁵. We placed five monitoring points at the outlet and used pressure as a reference quantity independent of the grid. We set the grid numbers at 3.0 × 10⁵, 4.0 × 10⁵, 5.0 × 10⁵, and 6.0 × 10⁵, respectively. The study revealed that when the grid number exceeded 4.0 × 10⁵, the pressure difference at the monitoring points was relatively small. Therefore, it is considered that grid independence has been achieved when the grid number is 4.0 × 10⁵. Hence, the model grid meets the requirements for computational accuracy and speed.

2.3. Simulation Model Establishment

In the process of fluid–structure interaction analysis, fluid flow is influenced by the deformation and rebound of the hose, resulting in suction and pressure zones. Within the hose, the fluid undergoes flow, and different fluids have different Reynolds number ranges. For liquid fertilizer, the Reynolds number ranges from 10 to 30, while for water, it ranges from 6000 to 15,000, at 25 °C as shown in Table 2.
To simulate the actual flow within the hose, the Realizable k-ε turbulence model is considered. The Realizable k-ε model consists of two key equations: the k-equation and the ε-equation, which describe the transfer of turbulent kinetic energy and turbulent dissipation rate, respectively. Simultaneously, Standard Wall Functions are used for wall settings.
The turbulence model Is described by the transport equations for turbulent kinetic energy (k) and turbulent dissipation rate (ε) [24]:
ρ D k D t = x j μ + μ t σ k k x j + G k + G b ρ ε Y M
ρ D ε D t = x j μ + μ i σ i ε x j + ρ C 1 S ε ρ C 2 ε 2 k + ν ε + C 1 ε ε k C 3 ε G b
in the formula:
Turbulent viscosity factor μ t = ρ C μ k 2 E .
C μ is the average strain rate as a function of the degree of spin.
C 1 = max 0.43 , η η + 5 ,   η = S k ε , S = 2 S i j S i j ,   S i j = 1 2 ( u j x i + u i x j )
u i , u j are velocity components.
ρ is the fluid density, k is the turbulent kinetic energy, ε is the dissipation rate, μ is the absolute viscosity, G k denotes turbulent kinetic energy production due to the mean velocity gradient, G b is for turbulent energy generation due to buoyancy effects; Y M is the effect of pressurizable velocity turbulent pulsating expansion on the total dissipation rate. C 2 , C 1 ε , and C 3 ε are constants; σ k , σ ε are the turbulent Prandtl numbers of the turbulent kinetic energy and its dissipation rate, respectively. In FLUENT, as a default value constant, C 1 ε = 1.44 , C 3 ε = 1 , C 2 = 1.9 , σ k = 1.0 , σ ε = 1.2 .
The hose material is considered a nearly incompressible hyperelastic material, and its mechanical behavior is described using the two-parameter Mooney–Rivlin hyperelastic model [25]:
W = C 10 ( I 1 3 ) + C 01 ( I 2 3 )
in the formula:
I 1 = λ 1 2 + λ 2 2 + λ 3 2 I 2 = 1 / λ 1 2 + 1 / λ 2 2 + 1 / λ 3 2 , λ i ( i = 1 , 2 , 3 ) is the elongation ratio in the i direction.
I1 and I2 are invariants of the strain tensor Cij, and C10 and C01 are Mooney–Rivlin model material constants determined by the material properties as shown in Table 3.

2.4. Contact Settings

Assuming there is no friction between the hose and the base, self-contact of the hose is excluded. In the transient analysis, as a consequence of the continuous squeezing action applied by the rollers, substantial deformations occur, leading to direct contact between the outer surface of the hose and the rollers, as well as between the hose and the outer base. To model these contact interactions, the TARGE170 and CONTA174 contact surface elements are employed. TARGE170 represents a three-dimensional target surface, and CONTA174 is used to define the contact and sliding between this three-dimensional target surface (TARGE170) and the deformable surface defined by the element. This element combination is suitable for contact analysis in three-dimensional structures and coupled field analysis. Frictionless contact conditions are assumed for the interaction between the hose and the squeezing rollers. The augmented Lagrangian formulation is adopted as the contact algorithm. In the solid region, to ensure convergence, a sparse matrix direct solution solver (SPAR) is employed, and the option for handling large deformations is enabled.

2.5. Observation Surface Settings

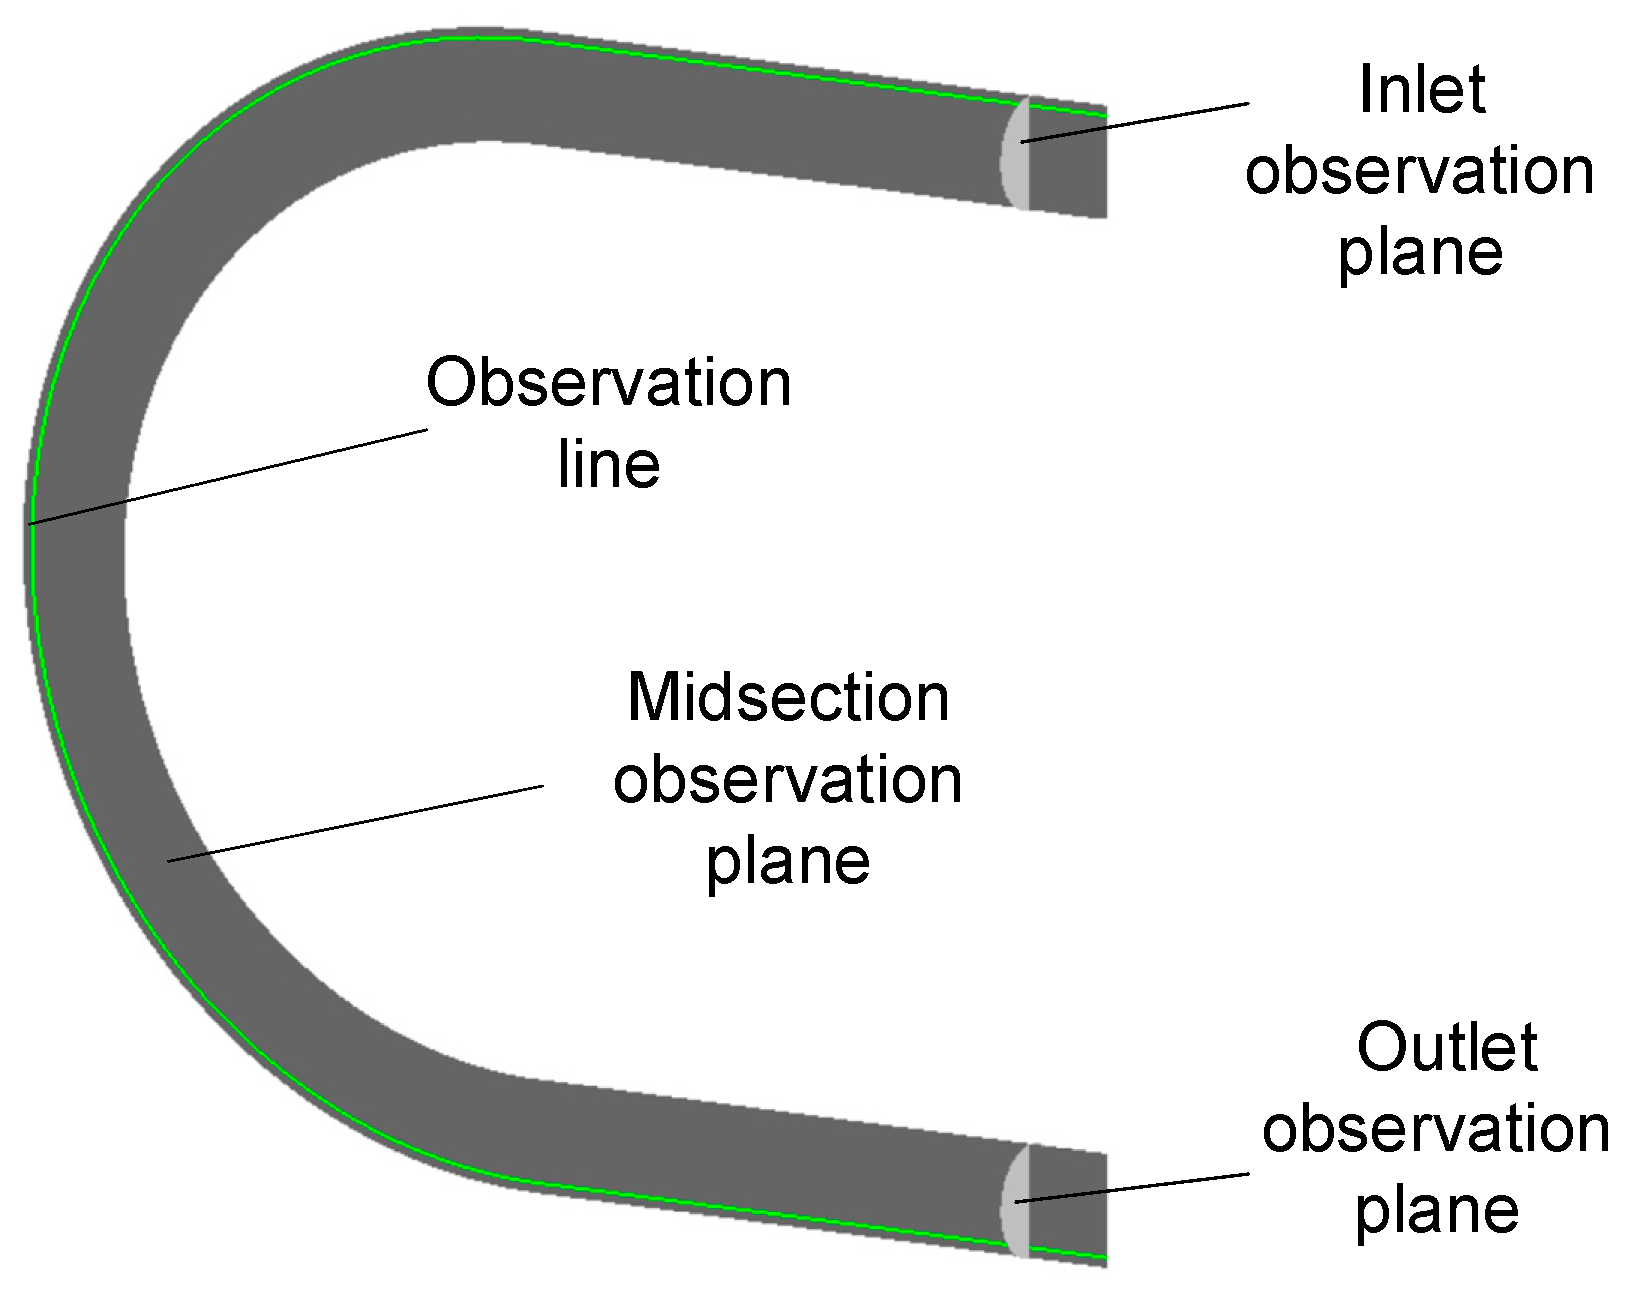
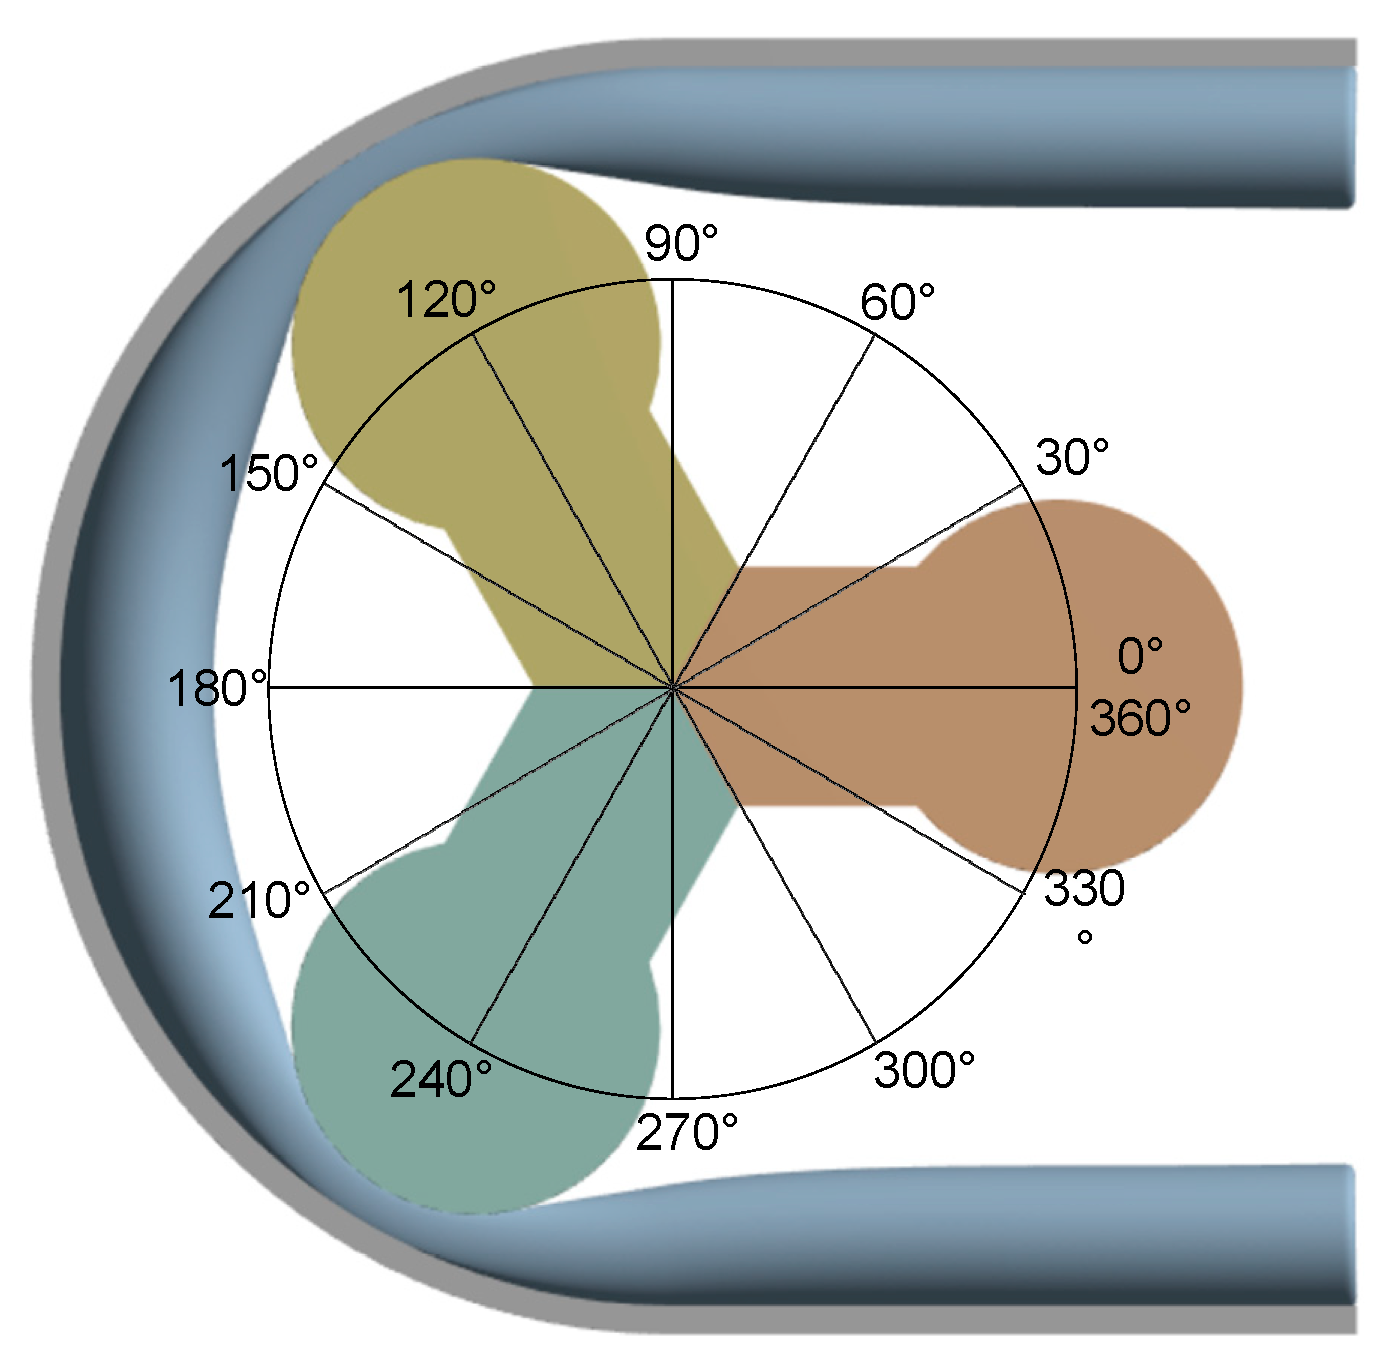
To analyze the flow field and pressure fluctuation characteristics inside the hose, simulations are conducted under two power frequency conditions: 35 Hz and 65 Hz. Observation surfaces are set at three locations: 24 mm from the hose outlet, 24 mm from the hose inlet, and the mid-section of the hose. These surfaces are used to observe pressure contours. Additionally, an observation line is placed at the midpoint of the hose during squeezing. This observation line consists of 300 observation points numbered from 0 to 299 in the direction from the inlet to the outlet, as shown in Figure 2. The rotor is divided into 360° segments, as depicted in Figure 3. Under the 65 Hz power frequency condition, three observation time points are selected for each observation surface at times 1.53 s, 1.73 s, and 1.83 s. Under the 35 Hz power frequency condition, three observation time points are chosen for each observation surface at times 1.6 s, 2.12 s, and 2.5 s, corresponding to rotor rotation angles of 60°–150°, 150°–210°, and 210°–270°, respectively.

3. Experimental Setup

Description of the Experimental Rig

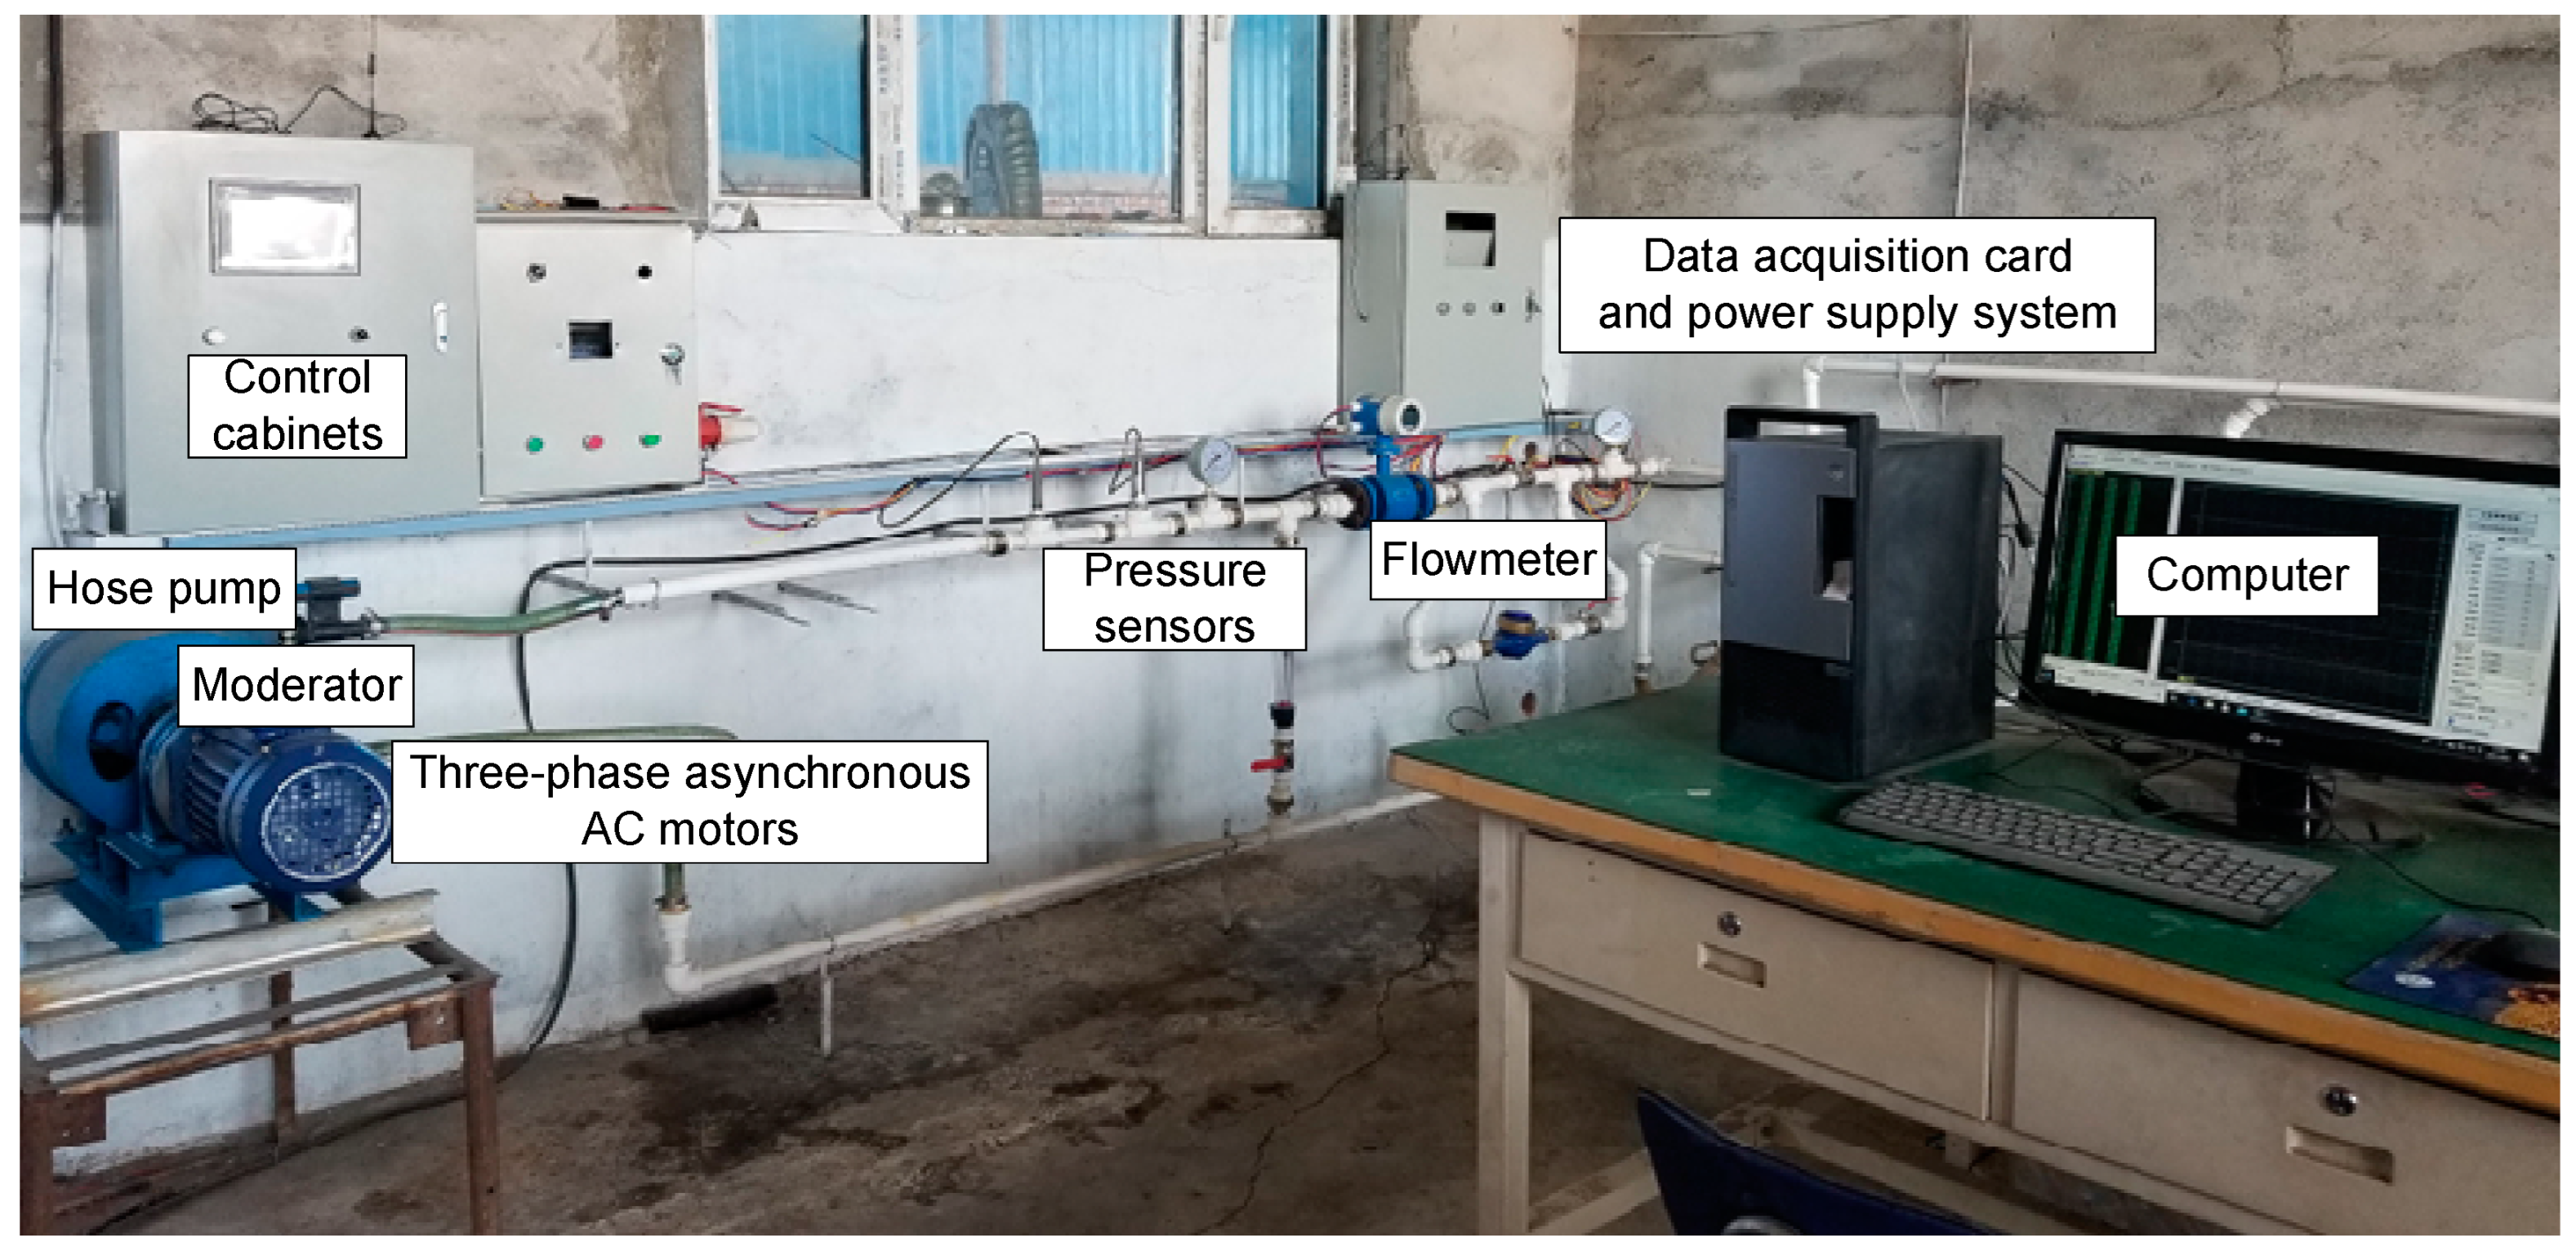
The experimental tests were conducted within an open-loop test bench system. We assembled the test bench using components such as valves, a variation pressure sensor (0–5 V), an electromagnetic flowmeter, pipes with a length of 3 m, an inner diameter of 25 mm and an outer diameter of 32 mm, and a hose pump, as depicted in Figure 4. The valve’s opening and closing were adjusted to control the outlet pressure, while a high-precision variation pressure sensor was used to measure pressure fluctuations. An electromagnetic flowmeter was employed to measure the average in flow rate under different pressure variations. Data from the entire test rig were collected in real-time using a data acquisition card. The pump was started following all standard startup procedures and operated until suitable operating conditions were achieved. To ensure consistency between numerical simulations and experimental results, we selected 2.5 s of data to calculate flow parameters in the pipeline under fixed outlet pressure conditions at different velocities, and pressure variation characteristics were assessed based on measured variables.

4. Results and Analysis

4.1. Experimental Result Validation

Common operating conditions for the hose pump include power frequencies of 35 Hz and 65 Hz, corresponding to the low-speed and high-speed levels of the hose pump, respectively. In these conditions, the rotor speed of the hose pump can be calculated as follows:
n = 2 π f ( 1 s ) i p
where f is the power frequency, s is the slip ratio (typically taken as 0.07), i is the reduction ratio (taken as 29), and p is number of poles (taken as 2), with f = 65 Hz, taken as a result of 6.549 rad/s, and f = 35 Hz, taken as a result of 3.526 rad/s.
The frequency of pressure variations is calculated based on the rotor speed of the hose pump. It is defined from the moment when one squeezing roller completely leaves the hose to when the next adjacent squeezing roller does the same, constituting one full cycle or a rotor rotation of 120 degrees. When the power supply frequency is 35 Hz, the rotor speed is 3.526 rad/s, resulting in a pressure variation cycle of 0.594 s and a pressure variation frequency of 1.686 Hz. When the power supply frequency is 65 Hz, the rotor speed is 6.549 rad/s, with a pressure variation cycle of 0.32 s and a pressure variation frequency of 3.127 Hz.
In the actual assembly of the hose pump, the squeezing rollers completely compress the hose. However, in simulations, a 2.5 mm gap is maintained on the inner wall of the hose to ensure energy conservation and achieve good convergence. Flow leakage can have a certain impact on the variations in the flow field within the hose. During the pressure loading process, the leakage gradually increases with the increase in maximum pressure but stabilizes under high-speed flow conditions.
Based on the hose pump flow rate calculation formula [26]:
v = C d n r
where Cd is the conversion coefficient due to hose deformation (typically taken as 0.7–0.8), n is the rotor speed in rad/s, and r is the rotor radius (typically taken as 0.121 m).
In the experiments, the fluid inlet-side velocities were approximately 0.3 m/s and 0.6 m/s. In the simulations, a deformation conversion coefficient of Cd = 0.74 was used, resulting in inlet velocities of 0.32 m/s and 0.6 m/s. The outlet pressure was set to 0.1 MPa, and water was selected as the fluid material. A comparison of the experimental and simulated volume flow rates of the hose pump is shown in Figure 5.
The error between the experiment and simulation is controlled within 5%, confirming the correctness of the model. We conducted five repeated experiments, and, based on the Bessel formula, the measurement uncertainty is approximately 0.0025.

4.2. Simulation Results Analysis

We set the power frequency to 35 Hz and 65 Hz, with an outlet pressure of 0.1 MPa, and the fluid materials chosen were liquid fertilizer and water. During the operation of the hose pump, as the main shaft of the pump continuously rotates, the squeezing rollers alternately compress the hose. When a squeezing roller reaches the outlet of the hose pump, it releases the hose, causing the pressure on the hose to rapidly decrease. The hose immediately rebounds and returns to its non-compressed state, rapidly increasing the fluid flow space inside the hose. At this moment, the other squeezing roller inside the pump continues to compress the other end of the hose, creating a negative pressure inside the hose. The liquid at the outlet is sucked back, and some of it flows back into the deformation recovery zone of the hose. It can be observed that the liquid flow at the pump’s outlet suddenly decreases, leading to the appearance of variations.
This phenomenon occurs due to the alternating compression and relaxation of the hose as it is squeezed by the rollers. The rapid changes in the internal volume of the hose result in fluctuations in fluid flow, leading to the observed variations in the pump’s outlet. The simulation results capture this behavior, providing valuable insights into the pressure variations in the hose pump during operation.
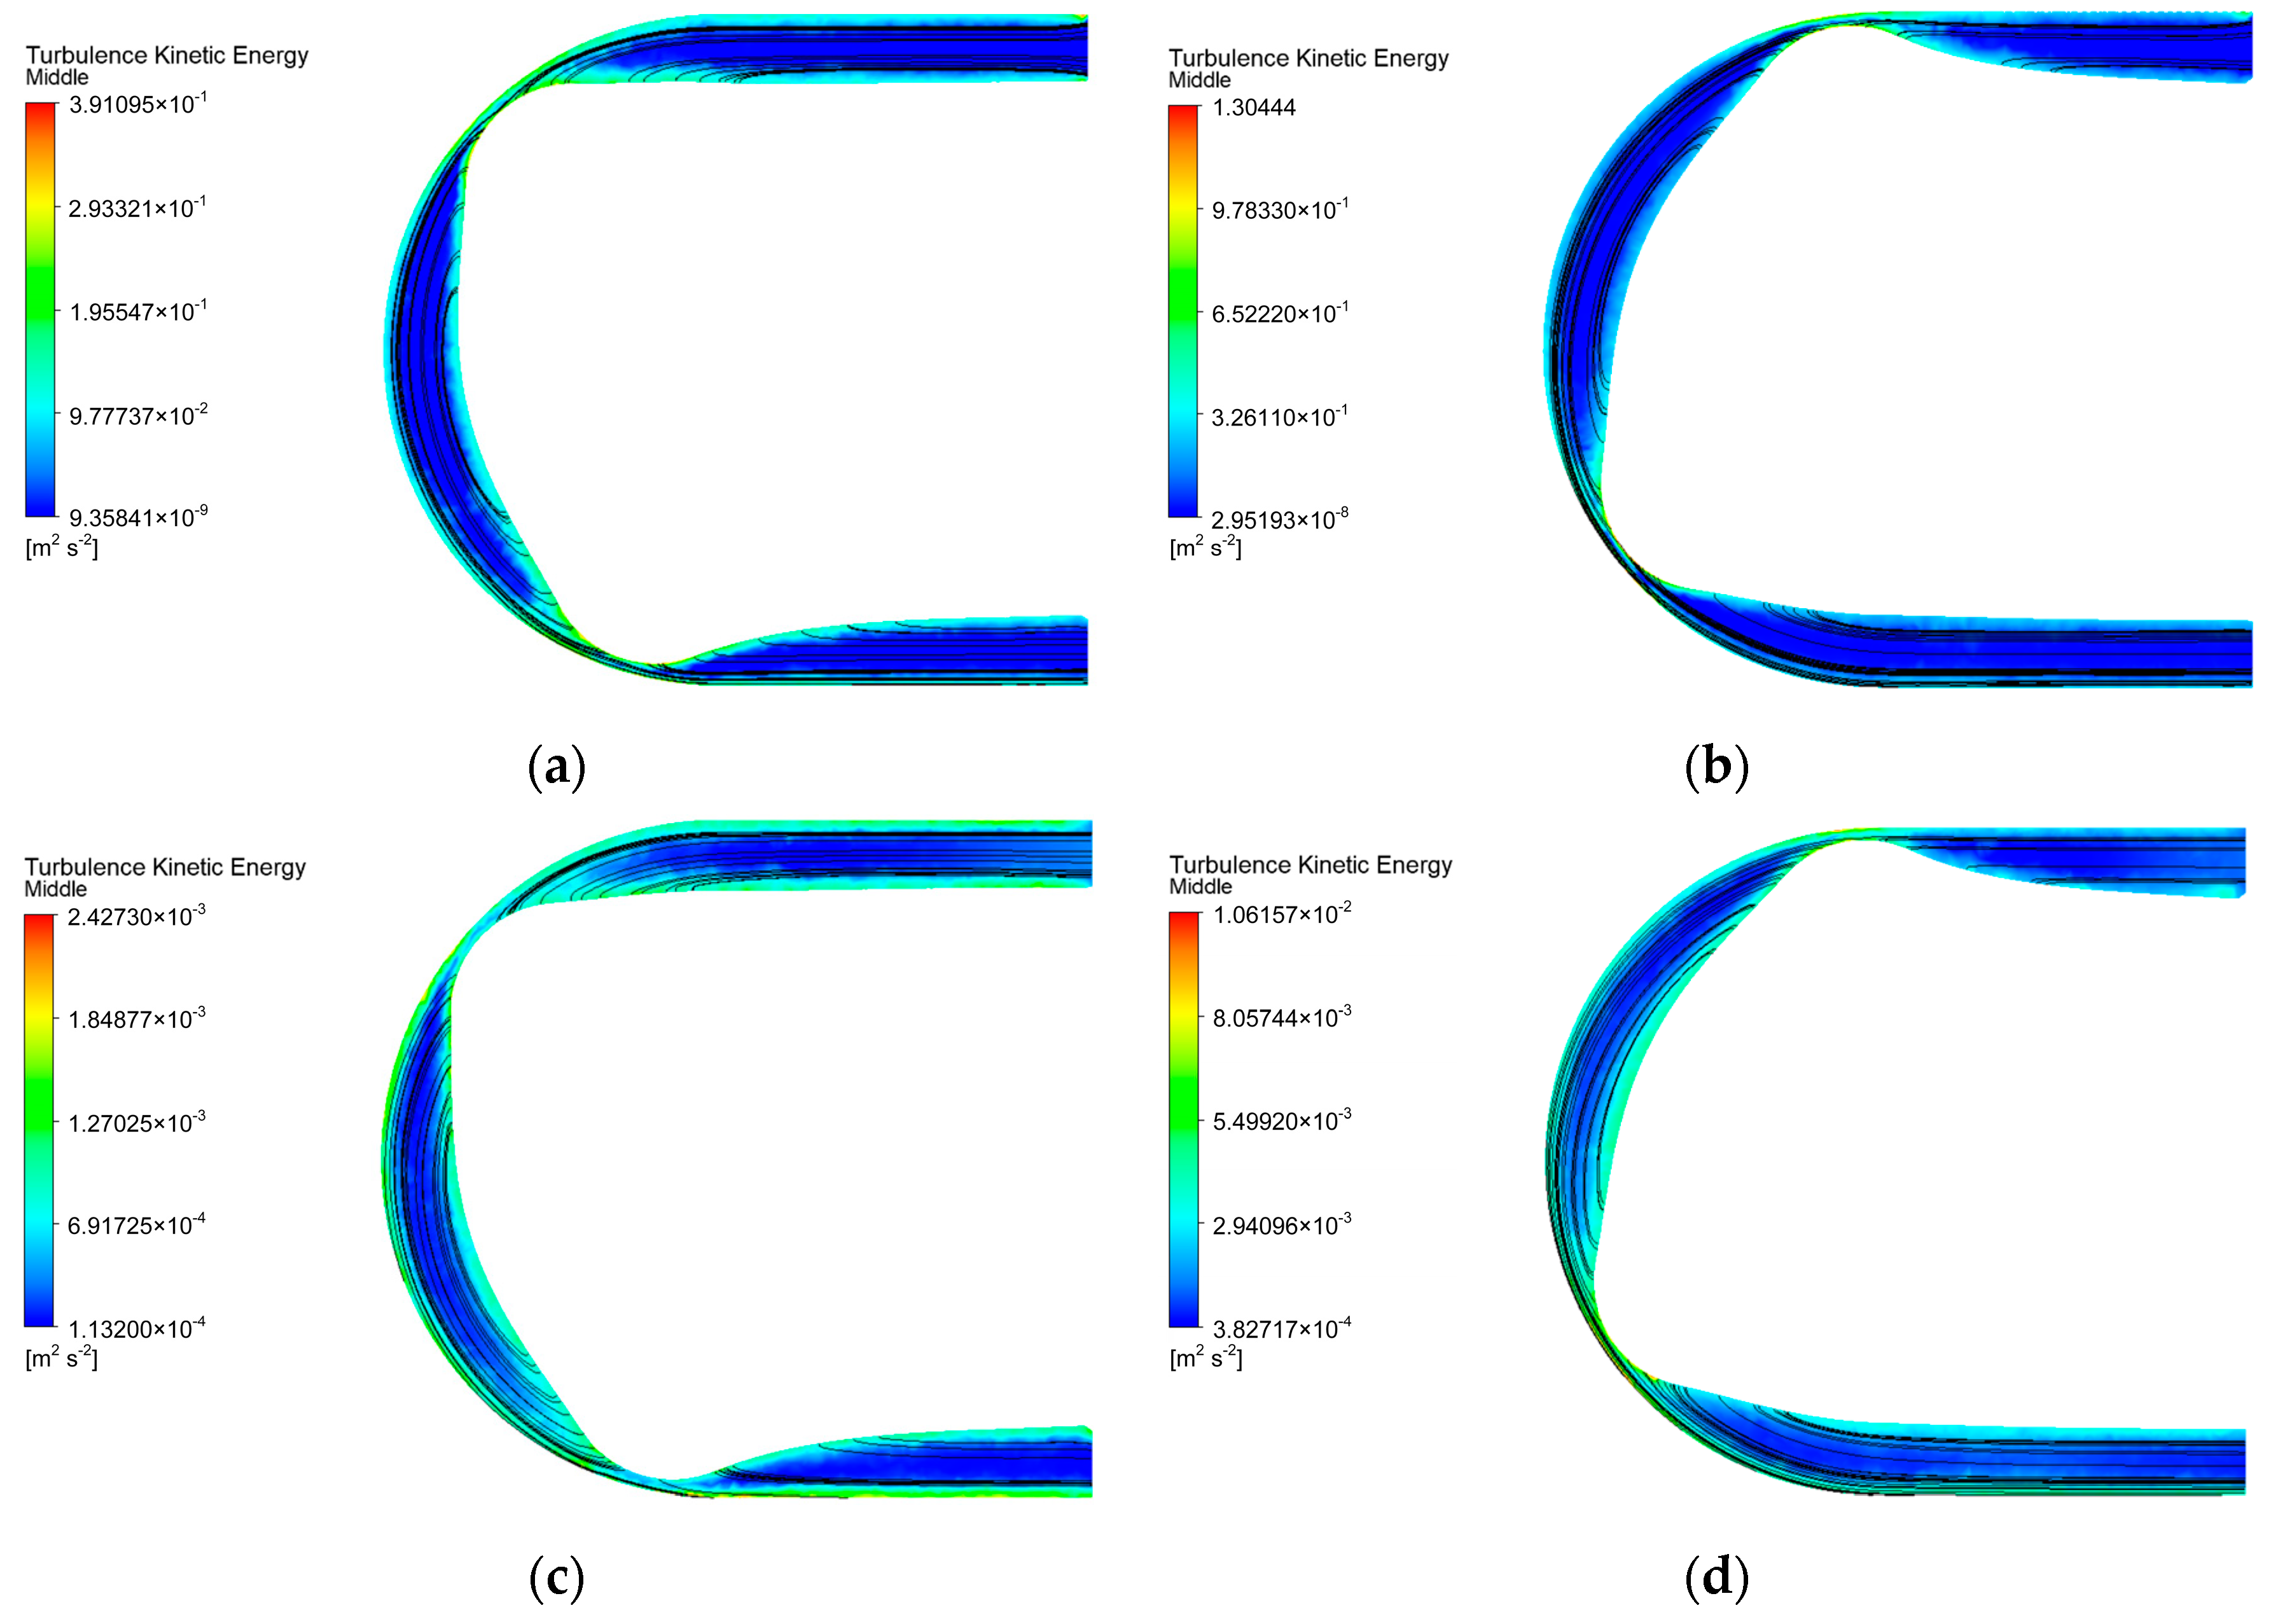
From Figure 6, we can observe that the streamlines bend and fold back at the squeezing positions. For the same rotational speed and time, the turbulent kinetic energy in liquid fertilizer is lower than in water, which validates the principle of pressure variation generation in the hose pump during liquid transfer.
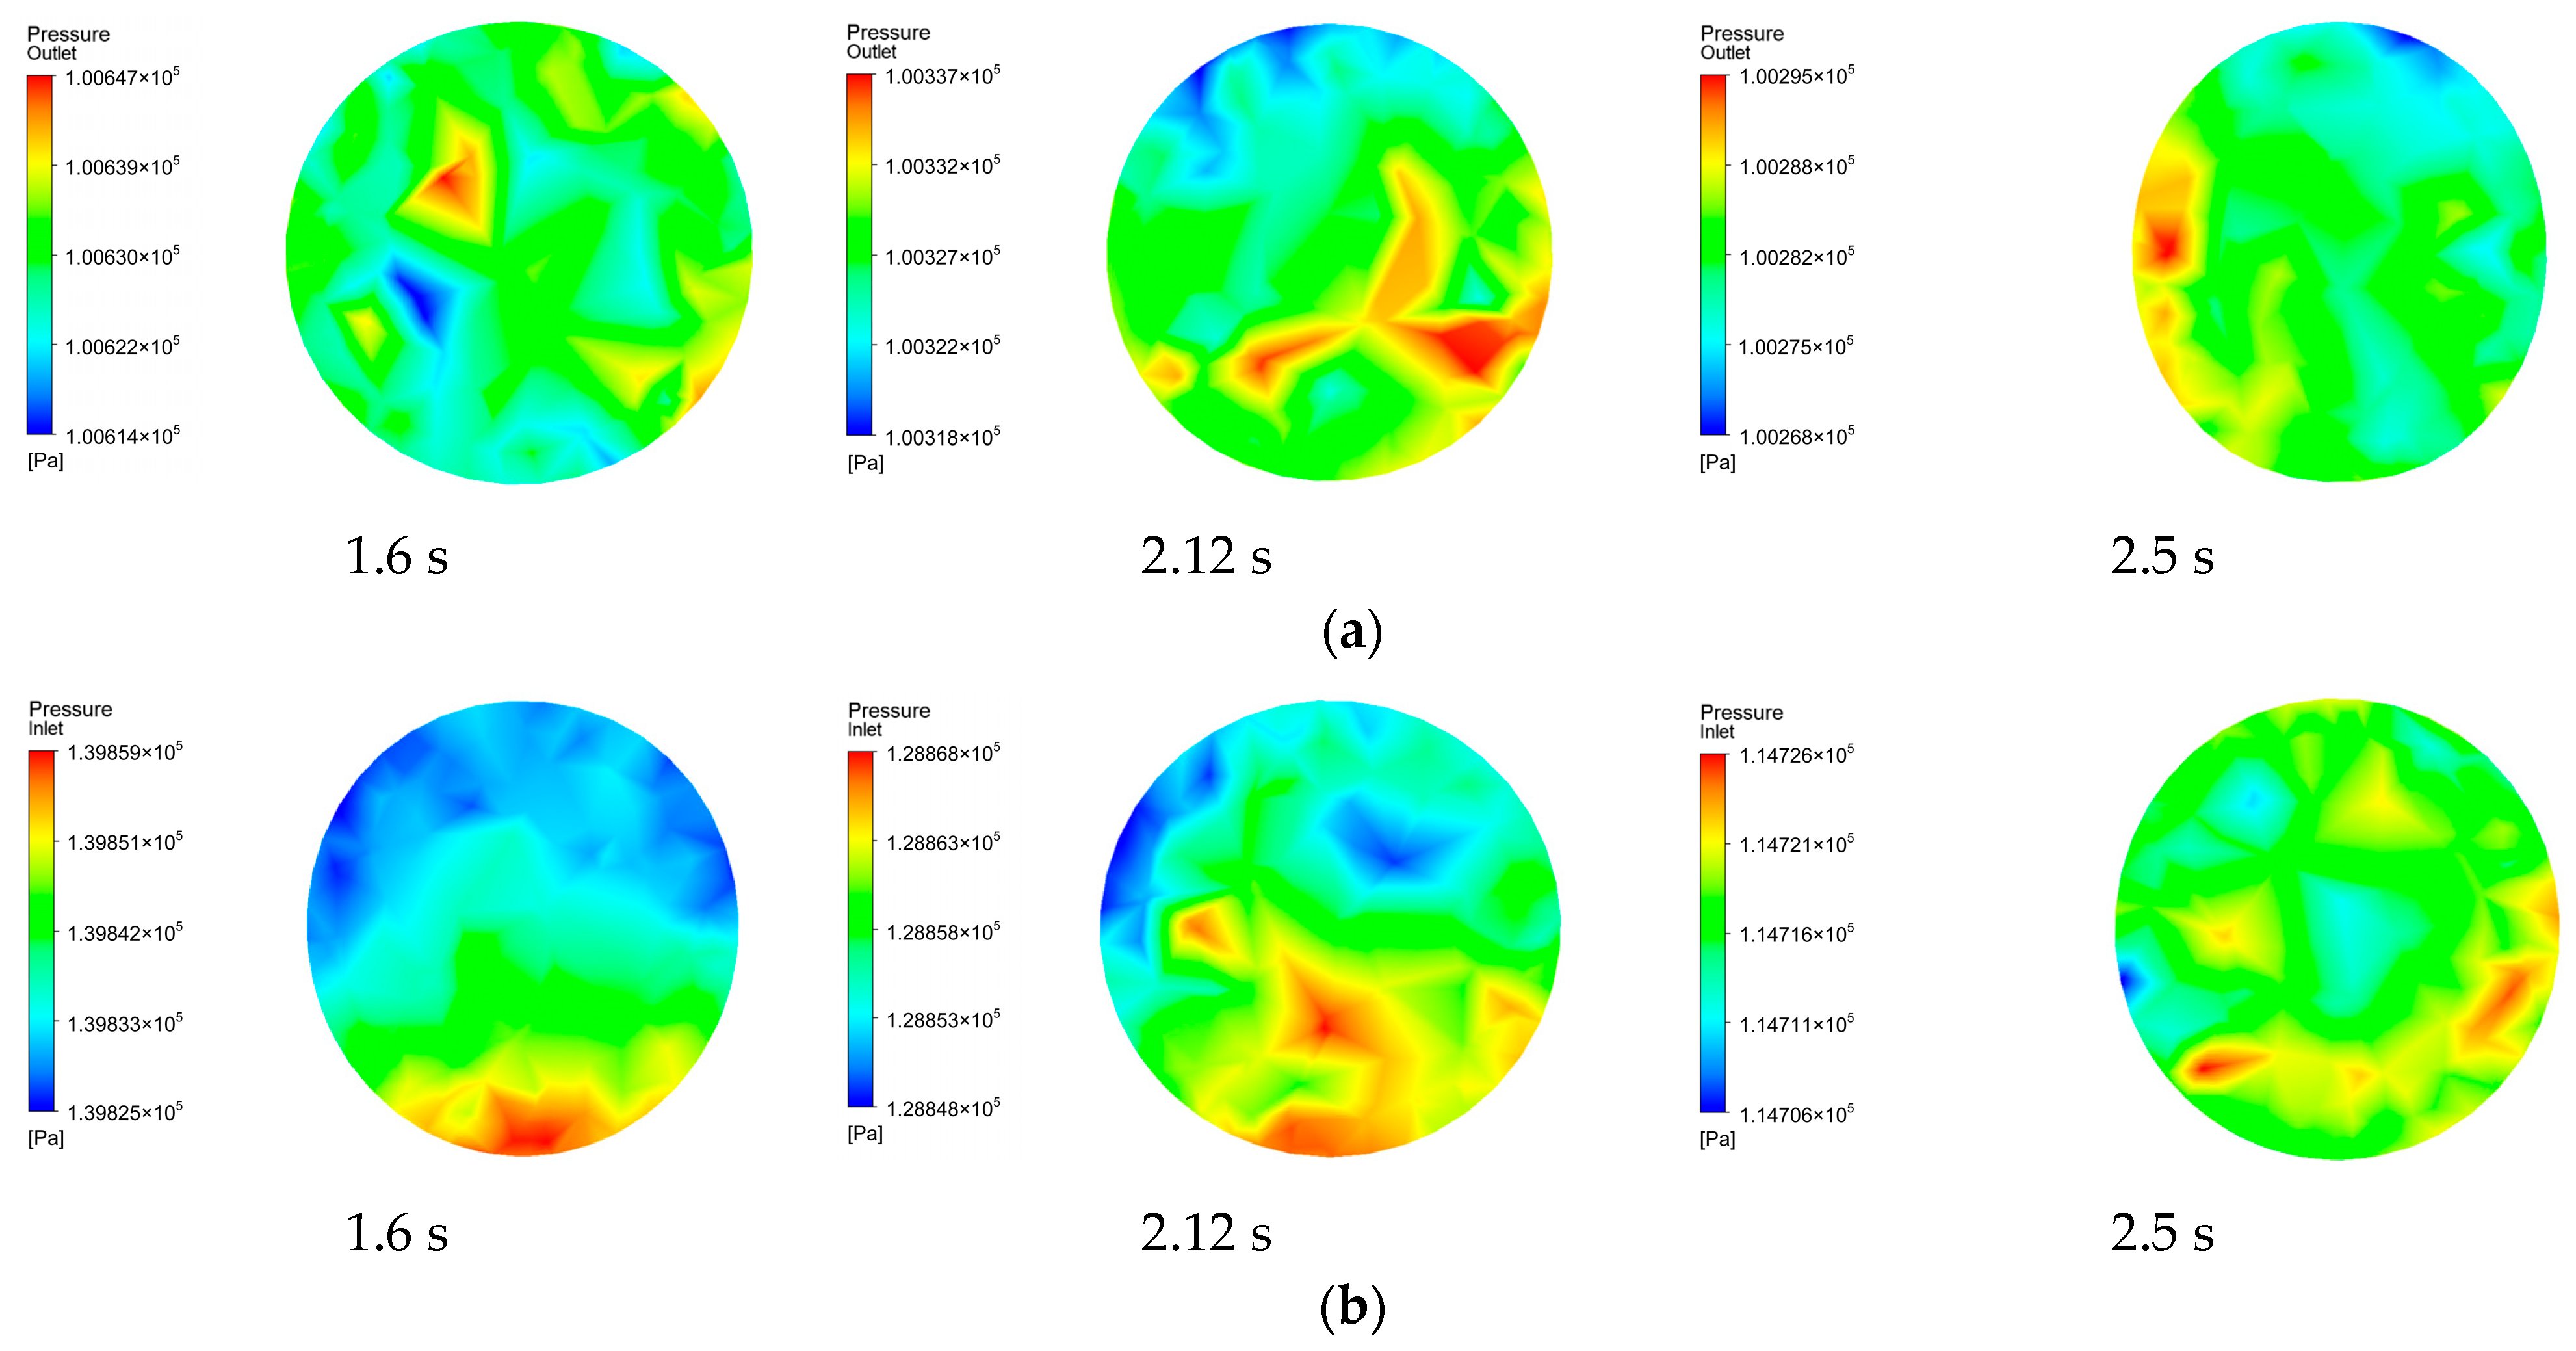
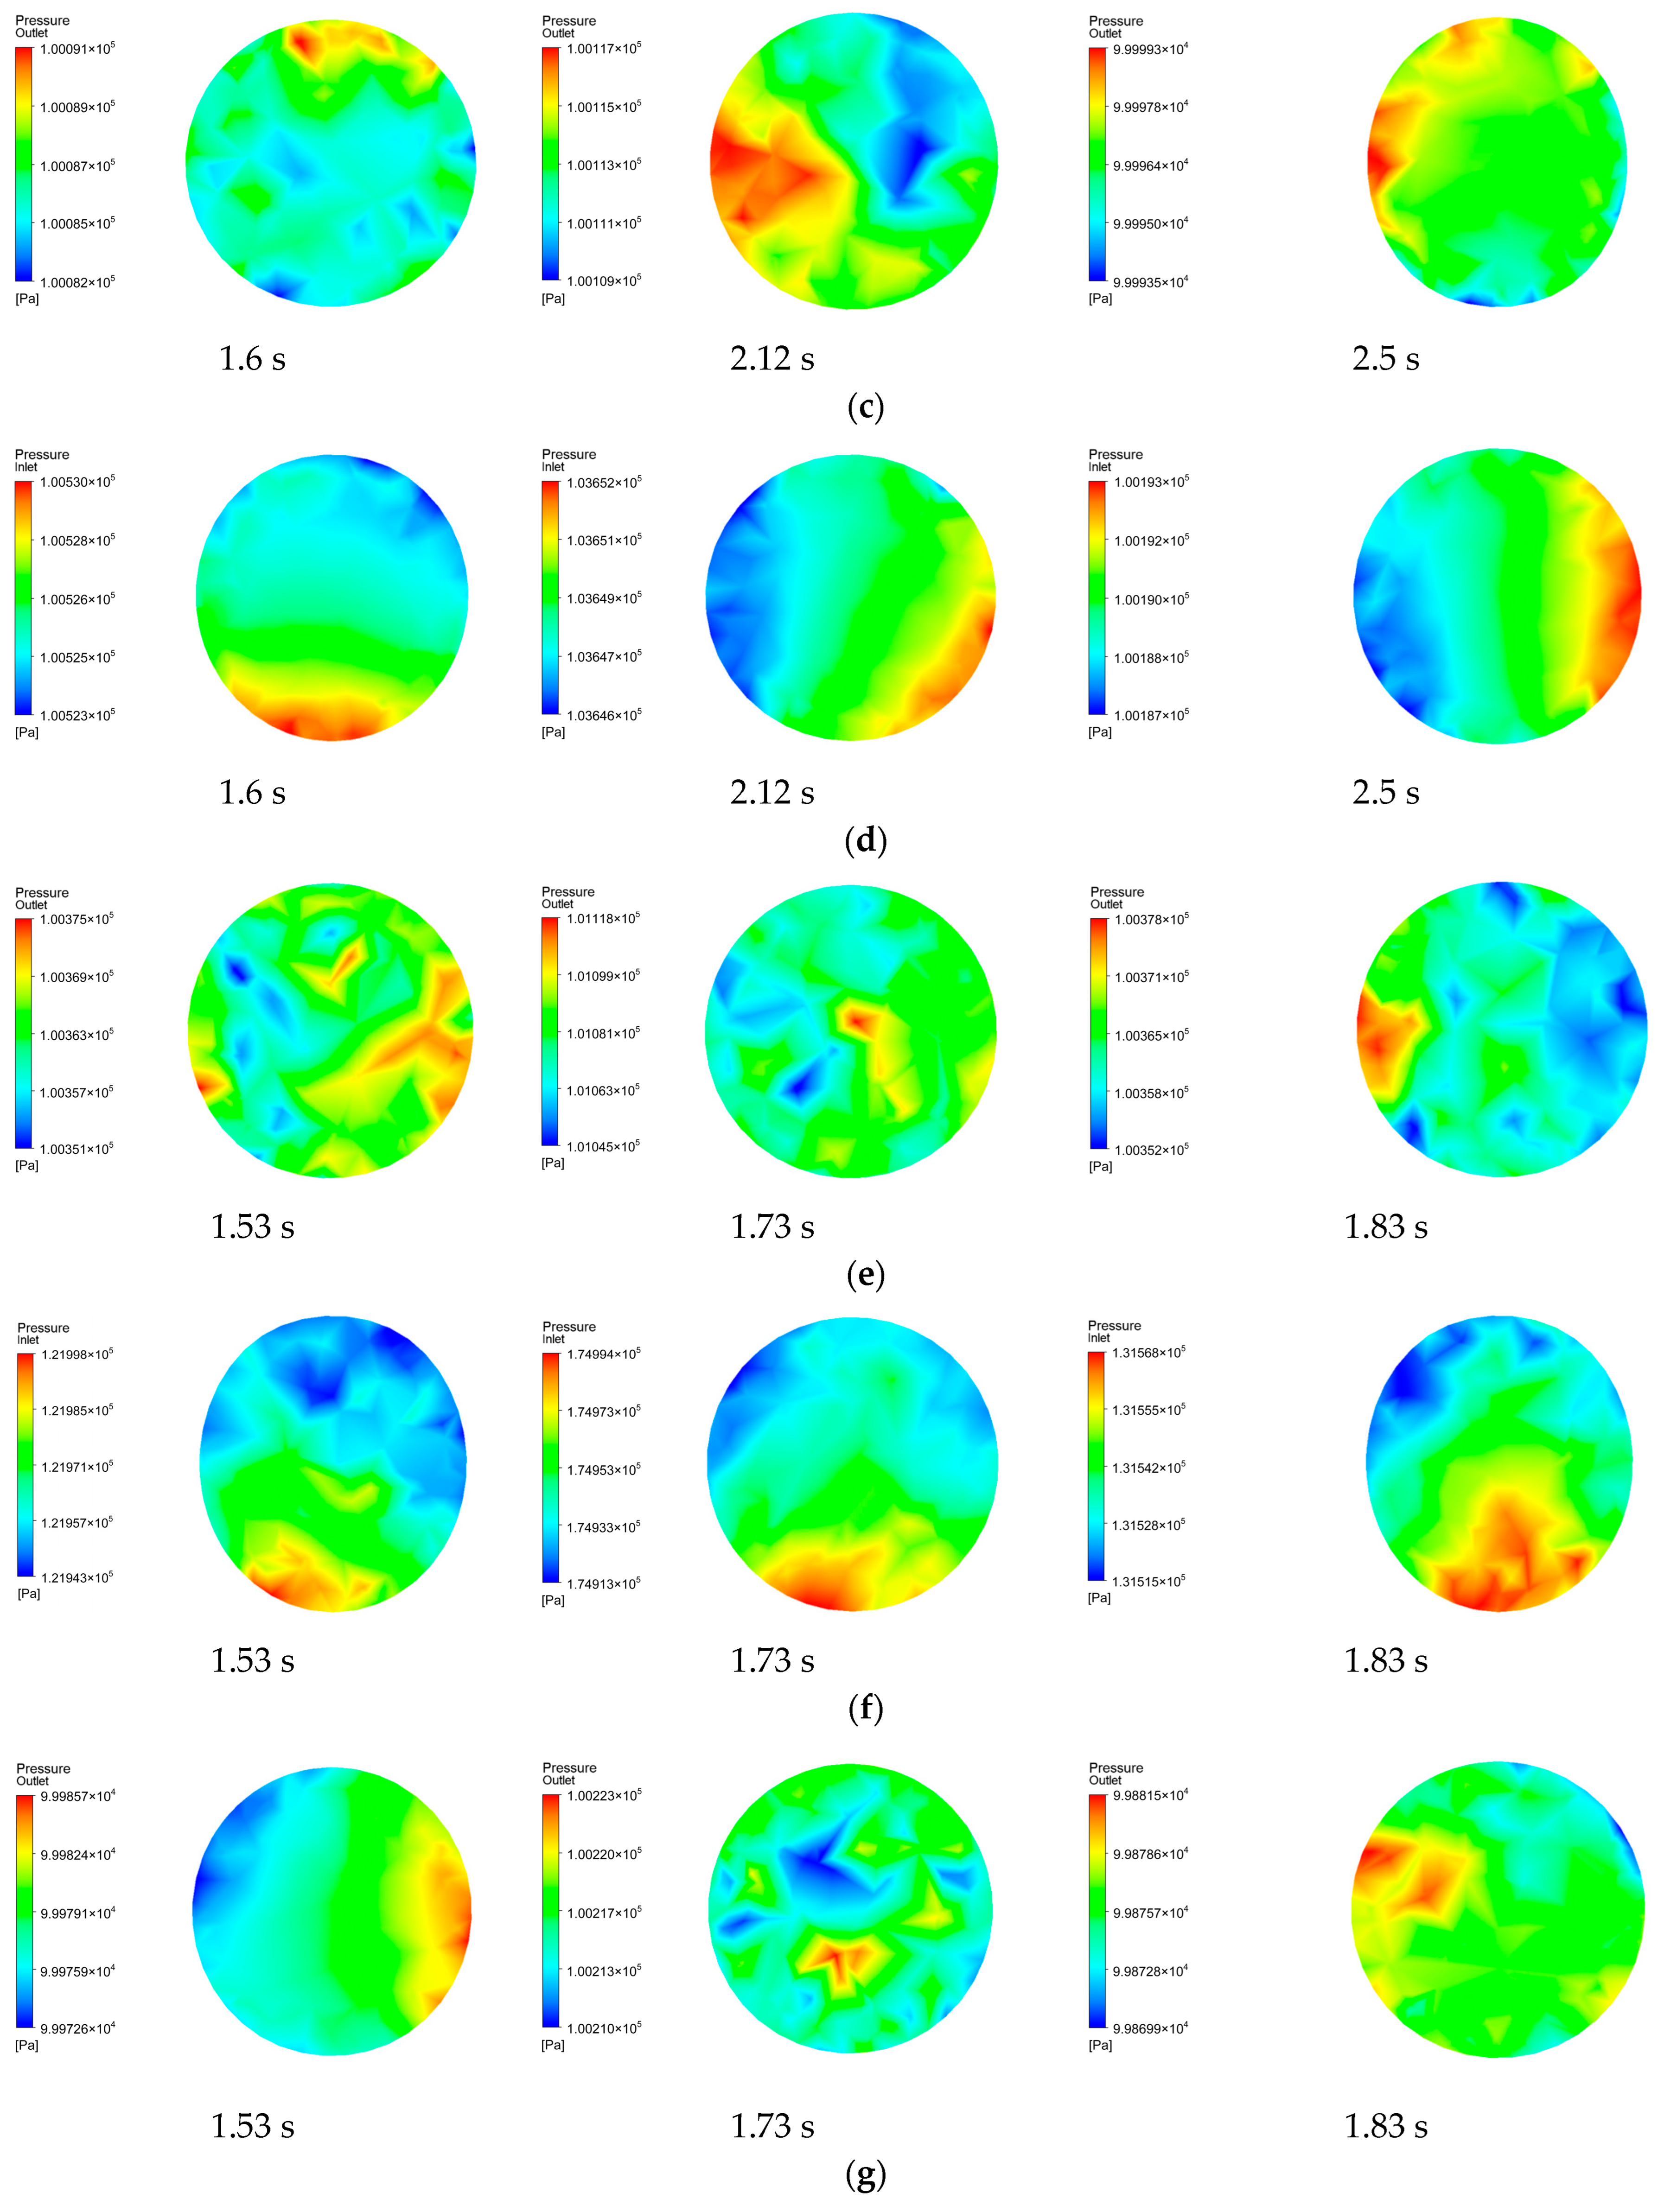
In order to analyze the variation effects during the transportation of fluid in the hose pump, we examined pressure contour plots at both the outlet and inlet surfaces, as depicted in Figure 7.
As depicted in Figure 7a,b, in the case of liquid fertilizer where laminar flow is observed, and with an electrical frequency of 35 Hz, the comparison between outlet and inlet pressures yielded the following results:
At 1.6 s, the maximum outlet pressure is 1.00647 × 10⁵ Pa, while the maximum inlet pressure is 1.39859 × 10⁵ Pa. This results in an outlet pressure lower than the inlet pressure, resulting in a pressure difference of −0.39212 × 10⁵ Pa. At 2.12 s, the maximum outlet pressure is 1.00337 × 10⁵ Pa, and the maximum inlet pressure is 1.28868 × 10⁵ Pa. Once again, the outlet pressure is lower than the inlet pressure, with a pressure difference of −0.28531 × 10⁵ Pa. At 2.5 s, the maximum outlet pressure is 1.00259 × 10⁵ Pa, and the maximum inlet pressure is 1.11278 × 10⁵ Pa. The outlet pressure remains lower than the inlet pressure, resulting in a pressure difference of −0.11019 × 10⁵ Pa. Overall, the pressure difference exhibits an initial increase followed by a decrease trend.
As demonstrated in Figure 7c,d, for water, which exhibits turbulent flow behavior at an electrical frequency of 35 Hz:
At 1.6 s, the maximum outlet pressure is 1.00091 × 10⁵ Pa, and the maximum inlet pressure is 1.0053 × 10⁵ Pa. The outlet pressure is lower than the inlet pressure, leading to a pressure difference of −0.00439 × 10⁵ Pa. At 2.12 s, the maximum outlet pressure is 1.00117 × 10⁵ Pa, and the maximum inlet pressure is 1.03652 × 10⁵ Pa. The outlet pressure remains lower than the inlet pressure, with a pressure difference of −0.03535 × 10⁵ Pa. At 2.5 s, the maximum outlet pressure is 0.99999 × 10⁵ Pa, and the maximum inlet pressure is 1.00193 × 10⁵ Pa. Once again, the outlet pressure is lower than the inlet pressure, with a pressure difference of −0.001937 × 10⁵ Pa. The overall trend of the pressure difference shows an initial increase followed by a decrease, similar to the laminar flow case, but with smaller variations.
As depicted in Figure 7e,f, in the case of liquid fertilizer at an electrical frequency of 65 Hz:
At 1.53 s, the maximum outlet pressure is 1.00375 × 10⁵ Pa, while the maximum inlet pressure is 1.21998 × 10⁵ Pa. The outlet pressure is lower than the inlet pressure, resulting in a pressure difference of −0.21623 × 10⁵ Pa. At 1.73 s, the maximum outlet pressure is 1.01118 × 10⁵ Pa, and the maximum inlet pressure is 1.74994 × 10⁵ Pa. The outlet pressure is lower than the inlet pressure, with a pressure difference of −0.73876 × 10⁵ Pa. At 1.83 s, the maximum outlet pressure is 1.00378 × 10⁵ Pa, and the maximum inlet pressure is 1.31568 × 10⁵ Pa. Once again, the outlet pressure is lower than the inlet pressure, resulting in a pressure difference of −0.3119 × 10⁵ Pa. The overall trend of pressure difference exhibits an initial increase followed by a decrease, and in this case, the pressure difference is significantly smaller compared to the 35 Hz case.
In Figure 7g,h, for water at an electrical frequency of 65 Hz:
At 1.53 s, the maximum outlet pressure is 0.99986 × 10⁵ Pa, and the maximum inlet pressure is 0.98796 × 10⁵ Pa. The outlet pressure is lower than the inlet pressure, resulting in a pressure difference of −0.0119 × 10⁵ Pa. At 1.73 s, the maximum outlet pressure is 1.00223 × 10⁵ Pa, and the maximum inlet pressure is 1.07033 × 10⁵ Pa. The outlet pressure is lower than the inlet pressure, with a pressure difference of −0.0681 × 10⁵ Pa. At 1.83 s, the maximum outlet pressure is 0.99882 × 10⁵ Pa, and the maximum inlet pressure is 0.95147 × 10⁵ Pa. However, in this case, the outlet pressure is higher than the inlet pressure, resulting in a positive pressure difference of 0.04735 × 10⁵ Pa. Once again, the overall trend of pressure difference exhibits an initial increase followed by a decrease, and the flow field instability is more pronounced compared to the previous cases.
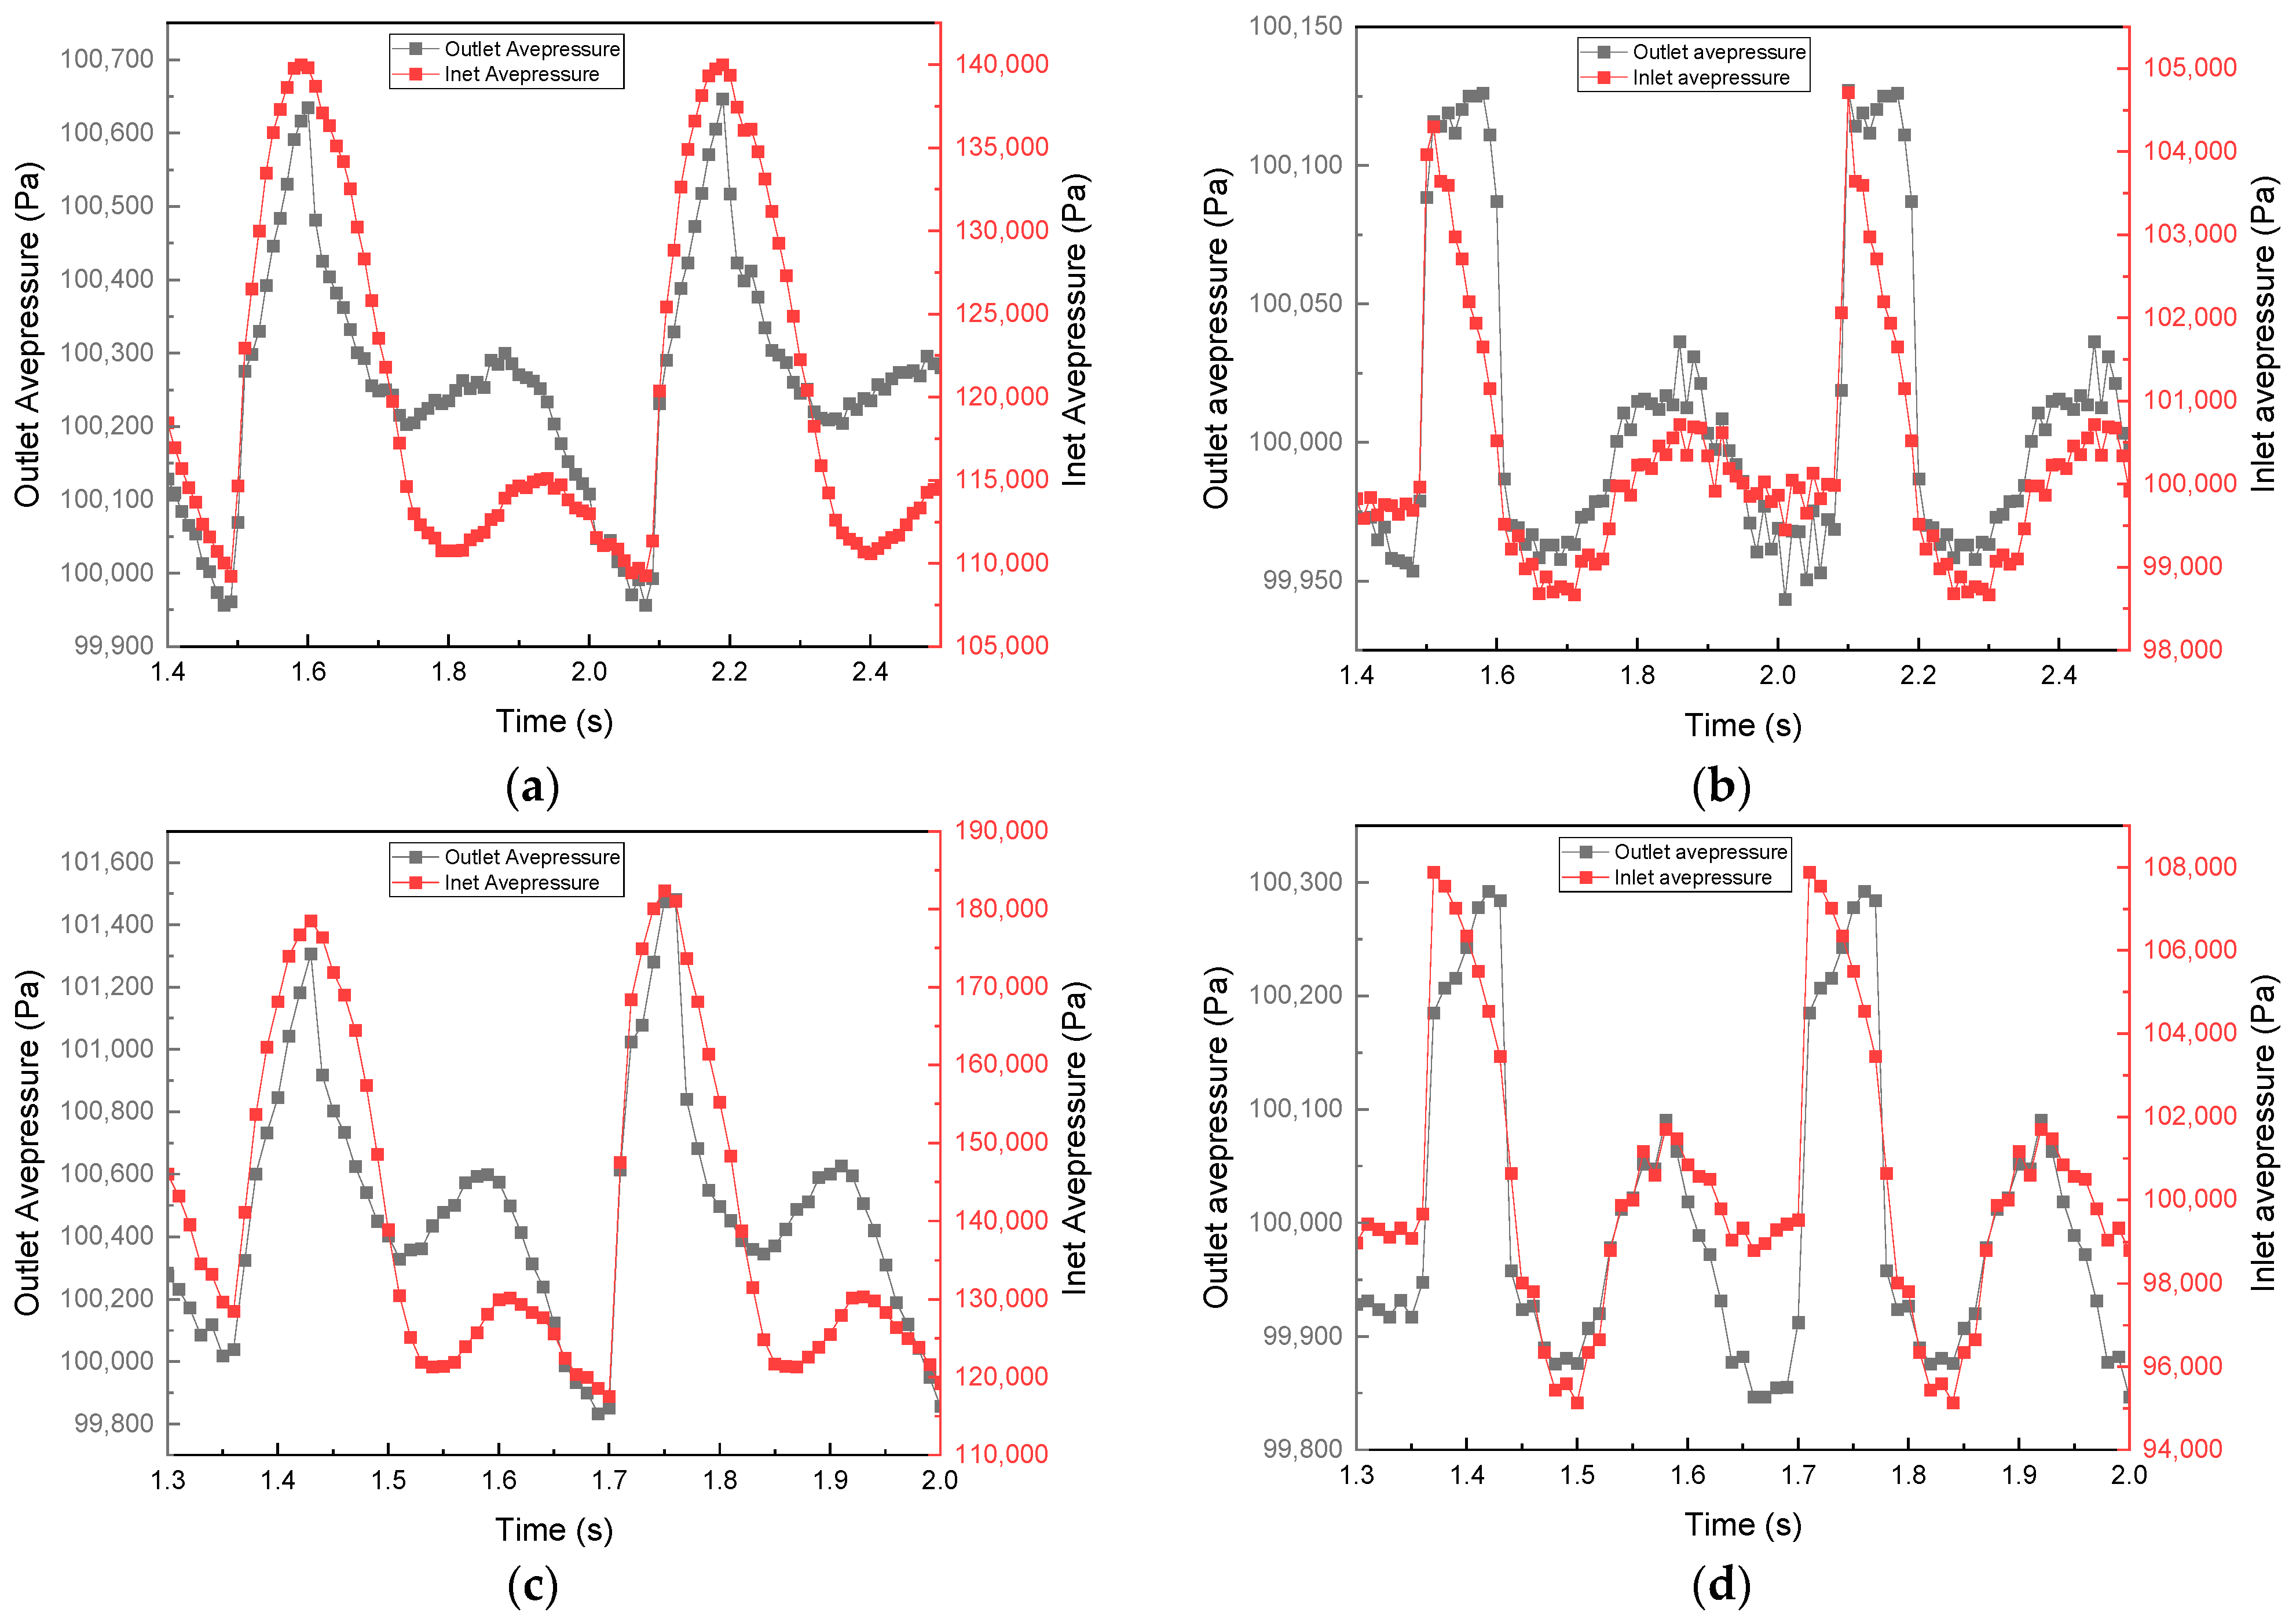
To visually observe the pressure variations at the outlet and inlet under different conditions, we created a coordinate system with time on the x-axis and average pressure on the y-axis, as presented in Figure 8.
From Figure 8, it can be observed that, in turbulent conditions, the flow field instability is significantly higher than in laminar conditions, characterized by “many small peaks and valleys”. The term “many small peaks and valleys” refers to the pressure variation at the inlet and outlet when transporting fertilizer as compared to when transporting water. During the transportation of water, the pressure variation exhibits more noticeable minor oscillations throughout the entire cycle. To depict this vividly, we have chosen to refer to it as “many small peaks and valleys.” However, both conditions still exhibit periodic pressure fluctuations, with the variation frequency depending on the frequency of the roller squeezing the hose. In turbulent conditions, the pressure amplitude is notably lower than in laminar conditions. Under the 35 Hz power frequency, the maximum average outlet pressure for liquid fertilizer is around 1.006 × 10⁵ Pa, with the minimum around 0.999 × 10⁵ Pa. The maximum average inlet pressure is around 1.4 × 10⁵ Pa, with the minimum around 1.1 × 10⁵ Pa. When transporting water at the same power frequency, the maximum average outlet pressure is around 1.00125 × 10⁵ Pa, with the minimum around 0.995 × 10⁵ Pa, and the maximum average inlet pressure is around 1.4 × 10⁵ Pa, with the minimum around 0.985 × 10⁵ Pa. In turbulent conditions, both flow materials exhibit more fluctuations and smaller amplitude compared to laminar conditions. Overall, turbulent conditions lead to more minor but frequent fluctuations, while laminar conditions result in larger but less frequent fluctuations.
When comparing power frequencies of 35 Hz and 65 Hz, it is evident that the average pressure curves at both the outlet and inlet exhibit similar shapes. The primary distinction arises from the frequency variations due to different rotor speeds. Notably, at 65 Hz, the amplitude of the average pressure is substantially higher than at 35 Hz, aligning with conventional expectations. This suggests that increased rotor speeds, whether in laminar or turbulent conditions, result in more pronounced variations. However, this effect is particularly pronounced during laminar flow.
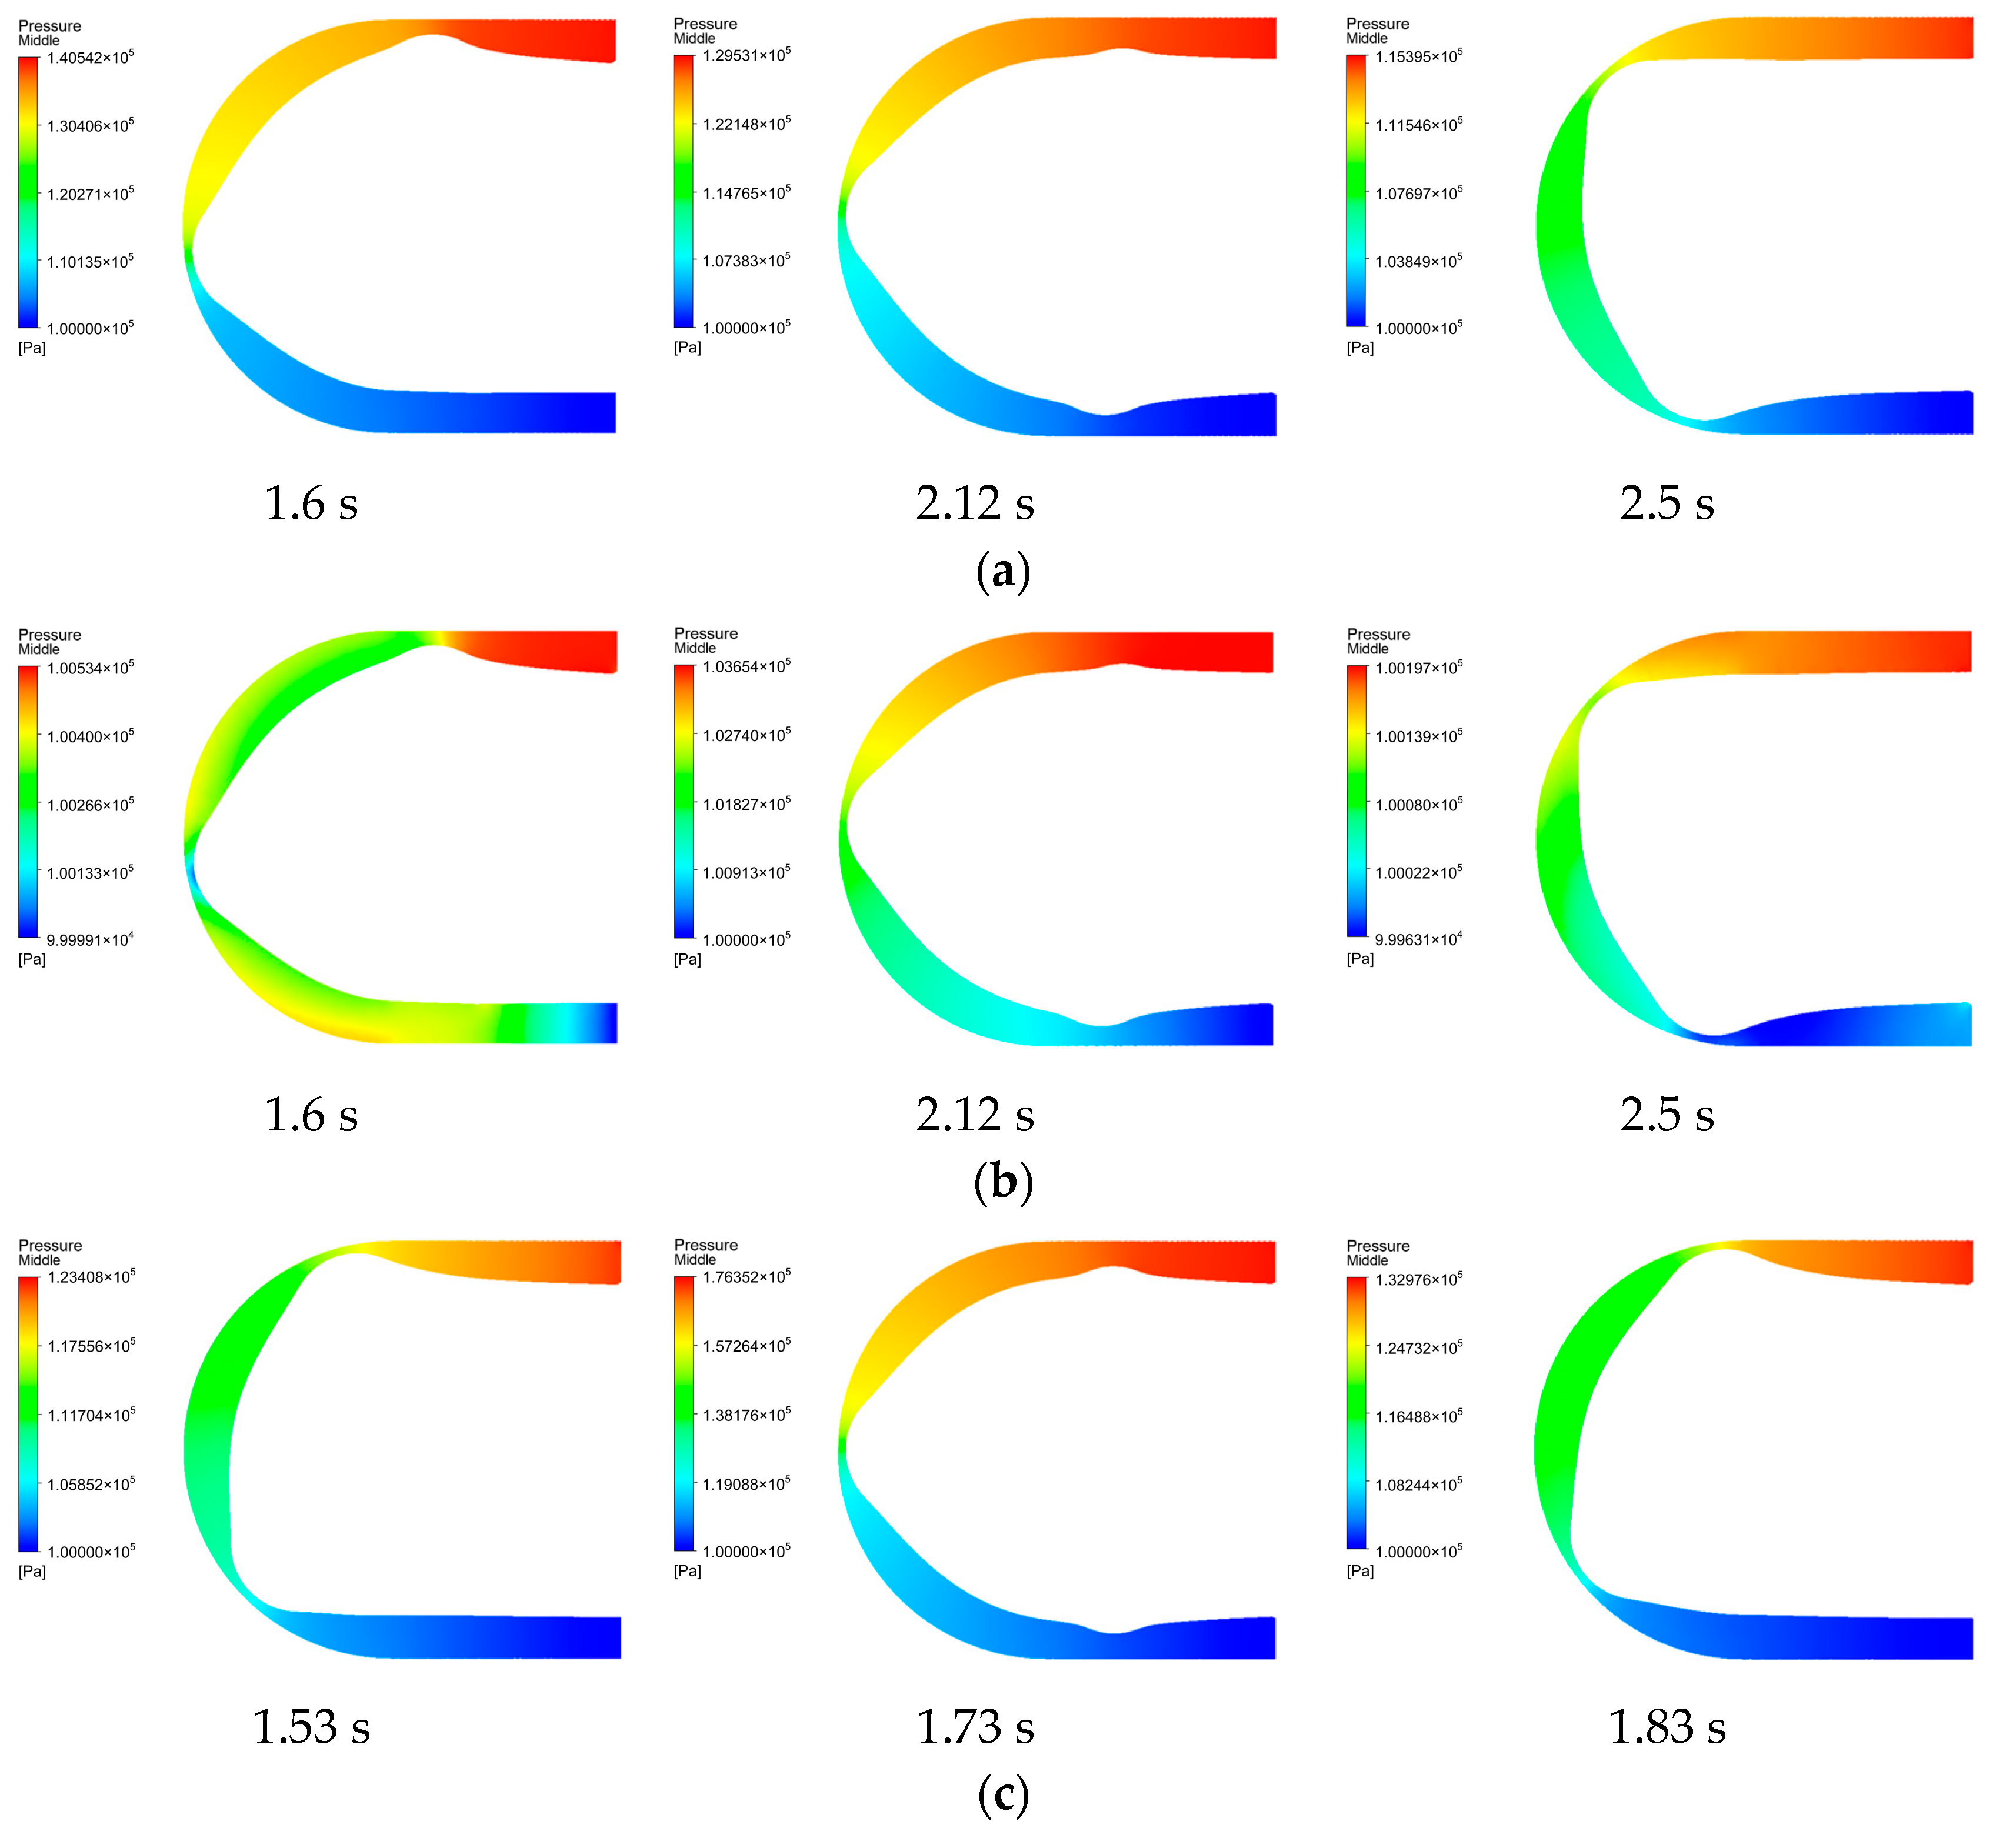
To obtain a comprehensive understanding of pressure fluctuations within the entire hose, we conducted an analysis of pressure contour plots at the middle surface, as depicted in Figure 9.
From the middle surface pressure contour plots, we can observe that the overall pressure gradient in laminar conditions is higher than in turbulent conditions, confirming the earlier analysis of outlet and inlet pressure fluctuations. In turbulent conditions, there is significant pressure non-uniformity along the cross-section parallel to the outlet and inlet, which may be due to turbulent vortices. This non-uniformity contributes to unstable variations and numerous small oscillations.
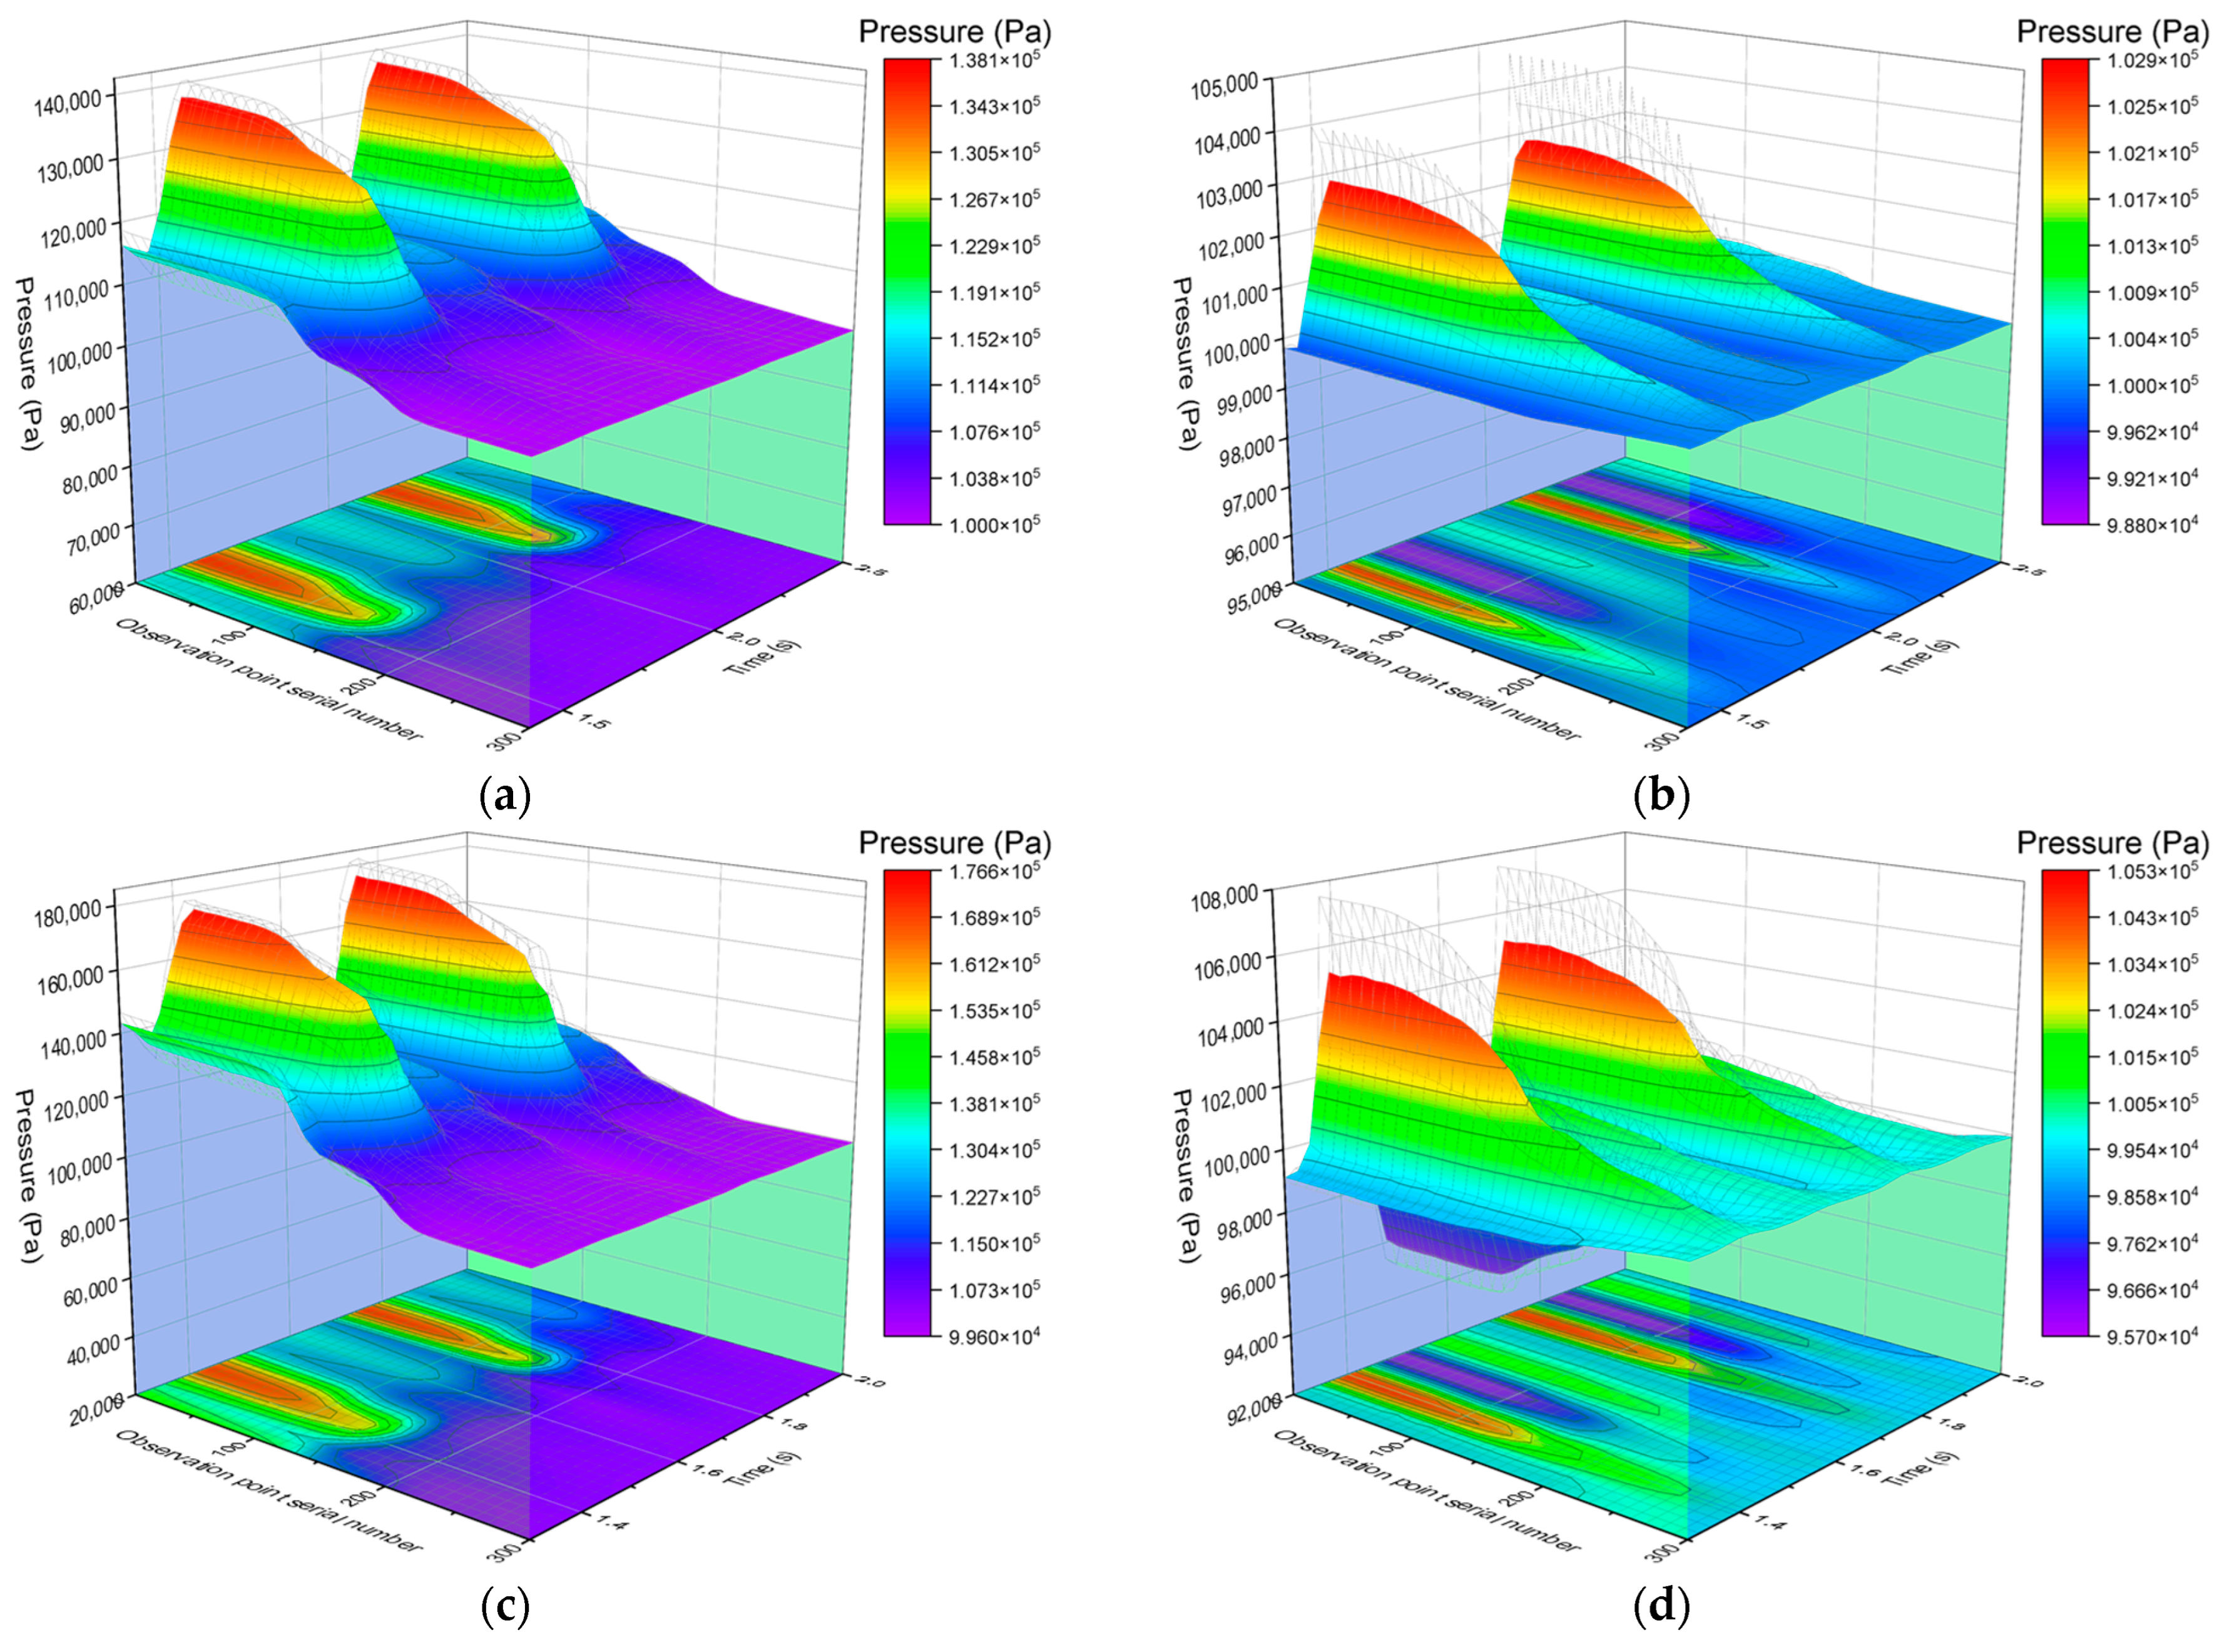
When examining water transport in the hose pump at power frequencies of 35 Hz and 65 Hz, a noteworthy observation is that the inlet pressure occasionally falls below the outlet pressure. However, during the transportation of liquid fertilizer, the pressure gradually increases from the outlet to the inlet in both scenarios. The primary distinction lies in the magnitude of pressure fluctuations at different power frequencies. To provide a clearer representation of pressure distribution across the entire hose, we plotted the pressure distribution for 300 observation points over time, focusing on the time intervals of 1.5–2.5 s at 35 Hz and 1.5–2 s at 65 Hz, as showcased in Figure 10.
From Figure 10, we can visually observe the pressure distribution throughout the entire cycle of fluid transport in the hose pump. Comparing different flow states, under turbulent conditions, pressure fluctuations are smoother, but there are more low-frequency fluctuations. In contrast, under laminar flow conditions, pressure fluctuations are more intense but have a stable frequency and less noise. Under turbulent conditions, at both power frequencies, there is a situation where the outlet pressure is higher than the inlet pressure, typically occurring when the rotor is between 90° and 150°. This phenomenon becomes more pronounced as the rotor speed increases. In laminar flow conditions, this situation does not occur; instead, the outlet pressure is higher than the inlet pressure, exacerbating liquid backflow, making the flow field more unstable, and increasing the vibration of the hose pump.
Comparing power frequencies of 35 Hz and 65 Hz, at a power frequency of 35 Hz, for both flow states, the pressure distribution in the flow domain shows a common trend of initially increasing and then decreasing with rotor rotation, similar to the case with a power frequency of 65 Hz. However, the pressure transitions are relatively smoother at 35 Hz. Additionally, there is a more pronounced pressure drop near the squeezing rollers at a power frequency of 65 Hz, which exacerbates the variation phenomenon.

5. Conclusions

The pressure variations in the hose pump during the transportation of liquid primarily originate from hose deformation. When the hose is gradually released by the squeezing rollers during the fluid extrusion process, it rebounds, causing liquid backflow and generating pressure variations. There is a noticeable pressure drop in the hose squeezing region, and the higher the rotor speed, the more pronounced the pressure drop and pressure variations become.
When operating under real-world conditions, the variation behavior at the pump’s outlet and inlet exhibits distinct features. In turbulent scenarios, we observe a greater number of variations, albeit with smaller amplitudes. Conversely, in laminar conditions, variations are fewer in number but possess larger amplitudes. Notably, in both flow regimes, both the frequency and amplitude of these variations escalate with increasing rotor speed. The variation frequency predominantly correlates with the rotational speed of the squeezing rollers. Elevated amplitudes contribute to heightened noise levels and more pronounced backflow tendencies, which can potentially diminish the operational longevity of the hose pump.
The pressure distribution within the hose’s flow field is inherently non-uniform. Distinctions are observed between turbulent and laminar conditions. In turbulent environments, there are instances wherein the outlet pressure exceeds the inlet pressure when both squeezing rollers are actively compressing the hose. This exacerbates backflow and amplifies variation amplitudes. However, in a broader context, the pressure distribution typically exhibits a gradual increment from the outlet to the inlet pressure. Consequently, the inlet region of the hose pump becomes more susceptible to fatigue-related failures.
Drawing insights from the aforementioned findings, it is advisable to undertake measures aimed at diminishing pressure variations and enhancing the operational durability of the hose pump. Such measures may include optimizing the design of the squeezing rollers and adjusting the angles of the pump’s shell.

Author Contributions

Conceptualization, M.W. and L.Z.; Data curation, M.W. and L.Z.; Formal analysis, M.W.; Investigation, M.W. and X.C.; Methodology, M.W.; Software, M.W.; Writing—original draft, M.W.; Writing—review and editing, M.W.; Funding acquisition, L.Z.; Resources, L.Z.; Supervision, L.Z. and X.M.; Project administration, W.W.; Validation, X.H.; Visualization, J.Z. All authors have read and agreed to the published version of the manuscript.

Funding

This research was funded by Major Science and Technology Projects in Xinjiang Uygur Autonomous Region, grant number 2022A02012-4. This research was also funded by Xinjiang Agricultural Machinery R&D, Manufacturing, Promotion and Application Integration Project, grant number YTHSD2022-03. This research was also funded by National Natural Science Foundation of China, grant number 52065055.

Institutional Review Board Statement

Not applicable.

Informed Consent Statement

Not applicable.

Data Availability Statement

All relevant data presented in the article are stored according to institutional requirements and, as such, are not available online. However, all data used in this manuscript can be made available upon request to the authors.

Conflicts of Interest

The authors declare no conflict of interest.

References

  1. Ma, X.; Zhang, L.; Wang, W.; Yan, Y.; Du, C. The shell shape optimization and fluid–structure interaction simulation of hose pump in water-fertilizer integrated fertilizer application. Sci. Rep. 2022, 12, 3284. [Google Scholar] [CrossRef] [PubMed]
  2. Wu, X.; Cui, Q.Z. Structure Analyses and Flow Rate Model of Peristaltic Pump of Cement Foaming Machine. In Advanced Engineering Forum; Trans Tech Publications Ltd.: Bach, Switzerland, 2011; Volume 2, pp. 852–855. [Google Scholar]
  3. Busono, P.; Iswahyudi, A.; Rahman, M.A.A.; Fitrianto, A. Design of Embedded Microcontroller for Controlling and Monitoring Blood Pump. Procedia Comput. Sci. 2015, 72, 217–224. [Google Scholar] [CrossRef]
  4. Postma, T.; Achten, E. High-pressure peristaltic pumps tackle petrochemicals. World Pumps 2005, 2005, 24–26. [Google Scholar] [CrossRef]
  5. Kondrashchenko, V.I.; Emelianova, I.A.; Chaika, D.O. Features of the Use of a Universal Hose Concrete Pump in the Construction Site. In IOP Conference Series: Earth and Environmental Science; IOP Publishing: Bristol, UK, 2019; p. 272. [Google Scholar]
  6. Postma, T. Bredel Hose Pumps invests in advanced grinding machinery. World Pumps 2002, 2002, 32–35. [Google Scholar] [CrossRef]
  7. Aitavade, E.N.; Patil, S.D.; Kadam, A.N.; Mulla, T.S. An overview of peristaltic pump suitable for handling of various slurries and liquids. J. Mech. Civ. Eng. 2012, 2, 19–24. [Google Scholar]
  8. Liu, W.; Liu, X.; Tan, R. Research on peristaltic pump design based on patent analysis. J. Eng. Des. 2013, 20, 361–367. [Google Scholar]
  9. Shamanskiy, A.; Simeon, B. Mesh deformation techniques in fluid-structure interaction: Robustness, accumulated distortion and computational efficiency. arXiv 2020, arXiv:2006.14051. [Google Scholar] [CrossRef]
  10. Sun, P.N.; Le Touze, D.; Oger, G.; Zhang, A.M. An accurate FSI-SPH modeling of challenging fluid-structure interaction problems in two and three dimensions. Ocean Eng. 2021, 221, 108552. [Google Scholar] [CrossRef]
  11. Han, R.; Wang, Y.; Qian, W.; Wang, W.; Zhang, M.; Chen, G. Deep neural network based reduced-order model for fluid–structure interaction system. Phys. Fluids 2022, 34, 073610. [Google Scholar] [CrossRef]
  12. Ng, Y.T.; Min, C.; Gibou, F. An efficient fluid–Solid coupling algorithm for single-phase flows. J. Comput. Phys. 2009, 228, 8807–8829. [Google Scholar] [CrossRef]
  13. Shahzad, M.; Kamran, A.; Siddiqui, M.Z.; Farhan, M. Mechanical Characterization and FE Modelling of a Hyperelastic Material. Mater. Res. 2015, 18, 918–924. [Google Scholar] [CrossRef]
  14. Stosiak, M.; Karpenko, M.; Prentkovskis, O.; Deptuła, A.; Skačkauskas, P. Research of vibrations effect on hydraulic valves in military vehicles. Def. Technol. 2023. [Google Scholar] [CrossRef]
  15. Formato, G.; Romano, R.; Formato, A.; Sorvari, J.; Koiranen, T.; Pellegrino, A.; Villecco, F. Fluid–Structure Interaction Modeling Applied to Peristaltic Pump Flow Simulations. Machines 2019, 7, 50. [Google Scholar] [CrossRef]
  16. Marinaro, G.; Frosina, E.; Senatore, A. A Numerical Analysis of an Innovative Flow Ripple Reduction Method for External Gear Pumps. Energies 2021, 14, 471. [Google Scholar] [CrossRef]
  17. Wang, B.; Wang, Y. The research on flow pulsation characteristics of axial piston pump. In Proceedings of the Seventh International Conference on Electronics and Information Engineering, Nanjing, China, 17–18 September 2017; Volume 10322, pp. 888–892. [Google Scholar]
  18. McIntyre, M.P.; van Schoor, G.; Uren, K.R.; Kloppers, C.P. Modelling the pulsatile flow rate and pressure response of a roller-type peristaltic pump. Sens. Actuators A Phys. 2021, 325, 112708. [Google Scholar] [CrossRef]
  19. Karpenko, M.; Prentkovskis, O.; Šukevičius, Š. Research on high-pressure hose with repairing fitting and influence on energy parameter of the hydraulic drive. Eksploatacja Niezawodność 2022, 24, 25–32. [Google Scholar] [CrossRef]
  20. Wang, W.; Zhang, L.; Ma, X.; Hu, Z.; Yan, Y. Experimental and numerical simulation study of pressure pulsations during hose pump operation. Processes 2021, 9, 1231. [Google Scholar] [CrossRef]
  21. Liu, F.; Li, Q.; Wang, S.; Zhang, Y.; Song, X. Flow Pulsation Optimization of Peristaltic Pump Based on Surrogate Model. In International Joint Conference on Energy, Electrical and Power Engineering; Springer Nature: Singapore, 2022; pp. 63–72. [Google Scholar]
  22. Yang, J.; Hirata, K.; Nakamura, Y.; Okano, K.; Katoh, K. Model-based design of tube pumps with ultra-low flow rate pulsation. SICE J. Control. Meas. Syst. Integr. 2022, 15, 172–181. [Google Scholar] [CrossRef]
  23. Esser, F.; Masselter, T.; Speck, T. Silent Pumpers: A Comparative Topical Overview of the Peristaltic Pumping Principle in Living Nature, Engineering, and Biomimetics. Adv. Intell. Syst. 2019, 1, 1900009. [Google Scholar] [CrossRef]
  24. Shaheed, R.; Mohammadian, A.; Kheirkhah Gildeh, H. A comparison of standard k–ε and realizable k–ε turbulence models in curved and confluent channels. Environ. Fluid Mech. 2019, 19, 543–568. [Google Scholar] [CrossRef]
  25. Kim, B.; Lee, S.B.; Lee, J.; Cho, S.; Park, H.; Yeom, S.; Park, S.H. A comparison among Neo-Hookean model, Mooney-Rivlin model, and Ogden model for chloroprene rubber. Int. J. Precis. Eng. Manuf. 2012, 13, 759–764. [Google Scholar] [CrossRef]
  26. Chen, J.; Yao, L.; Wang, N.; Zhou, X. Theoretical research prospects for hose pumps of guest soil sprayers for greening. For. Mach. Woodwork. Equip. 2006, 34, 19–22. [Google Scholar]
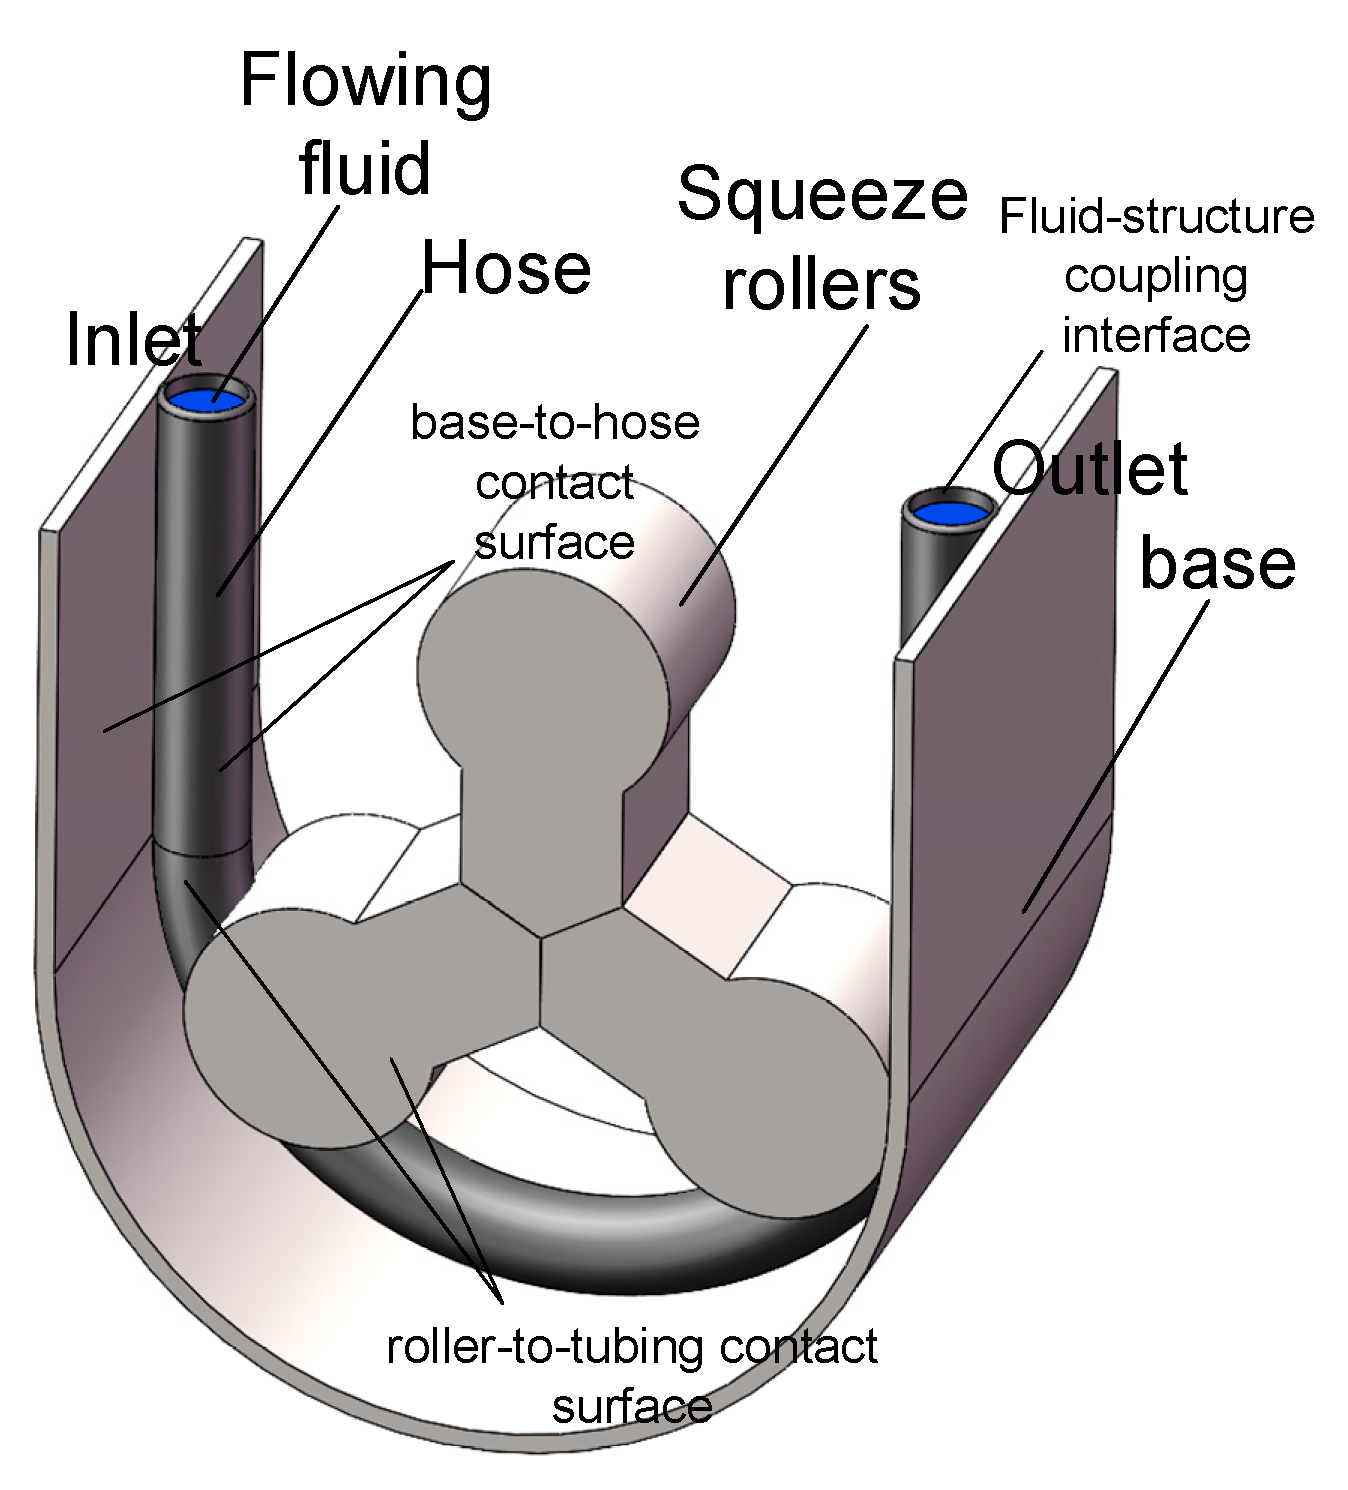
Figure 1. Schematic 3D modeling diagram.
Processes 11 03079 g001
Figure 2. Distribution of observation surfaces.
Processes 11 03079 g002
Figure 3. Rotor rotation angle.
Processes 11 03079 g003
Figure 4. Test system of the test pump.
Processes 11 03079 g004
Figure 5. Experimental and simulated flow rate curves for outlet pressure of 0.1 MPa.
Processes 11 03079 g005
Figure 6. Flow lines and turbulent kinetic energy distribution at the intermediate observation plane in the flow field. (a) Transporting liquid fertilizer for 2.5 s at a power frequency of 35 Hz; (b) Transporting liquid fertilizer for 1.83 s at a power frequency of 65 Hz; (c) Transporting water for 2.5 s at a power frequency of 35 Hz; (d) Transporting water for 1.83 s at a power frequency of 65 Hz.
Processes 11 03079 g006
Figure 7. Pressure distribution contour plots at different power frequencies and for different transported materials at the outlet and inlet. (a) Pressure contour plots at the outlet for liquid fertilizer at a power frequency of 35 Hz and an outlet pressure of 0.1 MPa; (b) Pressure contour plots at the inlet for liquid fertilizer at a power frequency of 35 Hz and an outlet pressure of 0.1 MPa; (c) Pressure contour plots at the outlet for water at a power frequency of 35 Hz and an outlet pressure of 0.1 MPa; (d) Pressure contour plots at the inlet for water at a power frequency of 35 Hz and an outlet pressure of 0.1 MPa; (e) Pressure contour plots at the outlet for liquid fertilizer at a power frequency of 65 Hz and an outlet pressure of 0.1 MPa; (f) Pressure contour plots at the inlet for liquid fertilizer at a power frequency of 65 Hz and an outlet pressure of 0.1 MPa; (g) Pressure contour plots at the outlet for water at a power frequency of 65 Hz and an outlet pressure of 0.1 MPa; (h) Pressure contour plots at the inlet for water at a power frequency of 65 Hz and an outlet pressure of 0.1 MPa.
Processes 11 03079 g007aProcesses 11 03079 g007bProcesses 11 03079 g007c
Figure 8. Pressure variations at the inlet and outlet. (a) Transporting liquid fertilizer at a power frequency of 35 Hz; (b) Transporting water at a power frequency of 35 Hz; (c) Transporting liquid fertilizer at a power frequency of 65 Hz; (d) Transporting water at a power frequency of 65 Hz.
Processes 11 03079 g008
Figure 9. Pressure contours at the midsection for different power frequencies and transported materials. (a) Pressure contour at the midsection of liquid fertilizer at an outlet pressure of 0.1 MPa and a power frequency of 35 Hz; (b) Pressure contour at the midsection of water at an outlet pressure of 0.1 MPa and a power frequency of 35 Hz; (c) Pressure contour at the midsection of liquid fertilizer at an outlet pressure of 0.1 MPa and a power frequency of 65 Hz; (d) Pressure contour at the midsection of water at an outlet pressure of 0.1 MPa and a power frequency of 65 Hz.
Processes 11 03079 g009aProcesses 11 03079 g009b
Figure 10. Pressure distribution across the entire cycle. (a) Transporting liquid fertilizer at a power frequency of 35 Hz; (b) Transporting water at a power frequency of 35 Hz; (c) Transporting liquid fertilizer at a power frequency of 65 Hz; (d) Transporting water at a power frequency of 65 Hz.
Processes 11 03079 g010
Table 1. Material parameters of the hose.
Power Supply Frequency (Hz)Number of RollersDrum Diameter (mm)Outer Circle Diameter (mm)Hose Inlet Diameter (mm)Hose Outer Diameter (mm)
35/653692602525
Table 2. Fluid parameters.
Density (kg/m3)Dynamic Viscosity (kg/(m s))
Liquid Fertilizer13000.7
Water998.20.001003
Table 3. Material parameters for the hose.
Density (kg/m3)Material Constant C10Material Constant C01
11005.2 × 1071.3 × 107
Disclaimer/Publisher’s Note: The statements, opinions and data contained in all publications are solely those of the individual author(s) and contributor(s) and not of MDPI and/or the editor(s). MDPI and/or the editor(s) disclaim responsibility for any injury to people or property resulting from any ideas, methods, instructions or products referred to in the content.