Article

Performance Optimization of a Spoon Precision Seed Metering Device Based on a Maize Seed Assembly Model and Discrete Element Method

1
College of Mechanical and Vehicle Engineering, Taiyuan University of Technology, Taiyuan 030024, China
2
Department of Educational Administration, Taiyuan University of Science and Technology, Taiyuan 030024, China
3
School of Mechanical and Aerospace Engineering, Jilin University, Changchun 130025, China
*
Authors to whom correspondence should be addressed.
Processes 2023, 11(11), 3076; https://doi.org/10.3390/pr11113076
Submission received: 10 October 2023 / Revised: 24 October 2023 / Accepted: 25 October 2023 / Published: 26 October 2023
(This article belongs to the Section Particle Processes)

Abstract

:
To improve the sowing performance of the spoon wheel maize seeding machinery, in this paper, two varieties of maize seed are selected as examples. The maize spoon precision seed metering device, a core component of the spoon wheel seeding machinery, is used as the research object. The maize seed assembly model is first established based on the maize seed assembly modeling method. Its validity is verified by the sowing experiment and corresponding DEM simulation under the different revolving speeds of the seed metering wheel. Secondly, the performance of the spoon precision seed metering device is optimized by integrating the maize seed assembly model and multivariate nonlinear regression method. Therefore, the number of sub-spheres of the horse tooth, spherical cone, and spheroid maize seed model are 10–14, 18, and 6, respectively. The results show that the performance of the seed metering device improved when the revolving speed of the seed metering wheel, handing angle, and seed spoon radius are 25 r/min, 40°, and 7 mm, respectively. There is good agreement between the expected results and experimental ones with relative errors of less than 5%, and the optimized seed metering device facilitates the process of seed guiding and seed delivery during the sowing process.

1. Introduction

The discrete element method (DEM), as a professional numerical simulation method of the multi-particle system [1,2,3,4,5], has become an important means of agricultural machinery design [6,7,8,9,10], the pharmaceutical industry [11], and other industries [12,13,14]. To accurately optimize the performance of agricultural machinery based on the DEM, in this paper, it is necessary to build a DEM analysis model of maize seed particle assemblies [15,16,17,18]. The validity of the seed particle assembly model was initially verified in the literature [19] in terms of the piling and “self-flow screening” tests. However, maize is one of the bulk crops [20,21,22,23], its sowing process is an important factor affecting maize yield, and the seed metering device is a key machine that can interact with maize seeds. Therefore, the work process of the seed metering device, as a microscopic verification method, can more effectively reflect the validity and practicability of the established maize seed model of the DEM, and this method represents the macroscopic validity of the maize seed assembly model through the microscopic interaction of the maize seed particles with the seed metering components.
At present, it has become a research hotspot that the performance of the seed metering device is optimized using the DEM [24,25,26], and the performance of the seed metering device has been improved to varying degrees. However, there are still some issues that need to be improved. Firstly, the maize seed model of the DEM is relatively simple and cannot fully reflect the characteristics of actual maize seed particle assemblies. For example, Shi et al. [24,27,28] established differently shaped DEM models such as spheres, pies, and wedges. Sun et al. [29,30,31,32,33,34] established a corresponding DEM model for differently shaped maize seeds based on the multi-sphere filling method, and a single maize seed DEM model was generated according to the corresponding percentage in the simulation process. The generated maize seed model has a population characteristic, to a certain extent, consistent with the actual maize seed, and the size of the above-mentioned DEM model is a uniform distribution, but the size of the actual maize seed is approximately a normal distribution [19,26,35]. However, the effect of size distribution and shape on particle behavior is crucial [36,37]; so, it necessarily affects the accuracy of the seed model, which will lead to a decline in the reliability of the simulation results. Secondly, the performance of the pneumatic seed metering device, combined inner hole seeding device, type hole wheel seed metering device, and finger-type seed metering devices were researched and optimized for most scholars. However, there are relatively few studies on the spoon precision seed metering device. To optimize the performance of the spoon precision seed metering device, the revolving speed of the seed metering wheel (RSSW), handing angle (HA), length of the seed spoon, tangential angle, and many more were selected by some scholars [25,38,39] as influencing factors. Secondly, most of the current studies on the optimization of the seed metering device do not consider the effect of maize seed population characteristics and seed spoon radius (SR). Further, it is one of the most commonly used precision mechanical seed metering devices and is also the most used seed metering device for small maize planting machines in China [40]. Therefore, optimization research of the spoon precision seed metering device by the DEM will have an important significance for improving the performance of maize planting equipment in China.
In summary, Jiping 1 and Ping’an 11 maize seeds are taken as examples. Firstly, the spoon precision seed metering device is used to further verify the validity of the maize seed assembly modeling method. On this basis, the revolving speed of the seed metering wheel, handing angle, and seed spoon radius are selected as experimental factors, and the experimental scheme is a multivariate nonlinear orthogonal regression design (L8(27)). Finally, the maize seed assembly model is used to optimize the performance of the spoon precision seed metering device.

2. Materials and Methods

2.1. Maize Seed Assembly Model

Referring to the literature [19], the maize seed assembly model is built based on the maize seed assembly modeling method. It is a set consisting of a horse tooth seed model with 10–14 sub-spheres, a spherical cone seed model with 18 sub-spheres, and a spheroid seed model with 6 sub-spheres, as shown in Figure 1. The modeling process is as follows. First, 100 grains of horse tooth, spherical cone, and spheroid seeds are randomly selected from the same variety of maize seeds. Their primary size is measured, and their mean value is calculated. This mean value is considered the final primary size of a single particle for a corresponding maize seed shape, and other sizes are calculated according to the functional relationship between them and the primary size. Therefore, the coordinates of the center of mass and the radius of each filling sphere are calculated, and the particle model of a single maize seed is built using the multi-sphere filling method. On this basis, the particle model of a single maize seed mentioned above is taken as a template, and the primary size is generated according to the corresponding normal distribution (see Table 1). By repeating the above process for each maize seed, a particle assembly can be built. Finally, according to the ratio of the horse tooth, spherical cone, and spheroid seeds, a mixture of differently shaped particles with a corresponding quantity is generated. In this way, the maize seed assembly model is close to the natural one.

2.2. The Spoon Precision Seed Metering Device

The structure of the spoon precision seed metering device is shown in Figure 2a. It consists of a seed-filling shell, seed spoon, seed plate, guiding wheel, and guiding shield, and it has an axial dimension of 64.3 mm and a radial dimension of 245 mm. The inner chamber of the seed metering device can be divided into a filling zone, cleaning zone, handing zone, guiding zone, and dropping zone, according to their function, as shown in Figure 2b. The filling zone, cleaning zone, and handing zone are located between the seed-filling shell and the seed plate. Furthermore, the filling zone is located in the lower right part of the inner cavity, and it is mainly used to put the maize seeds into the seed spoon, and the maize seeds run simultaneously with the seed spoon into the cleaning zone on the left side. The cleaning zone is used to release the excess maize seeds from the seed spoon and returns them to the filling zone under the action of complex external forces. The handing zone is located in the upper right side of the inner chamber and corresponds to the seed delivery opening of the seed plate, and it is used to transfer the maize seeds from the seed spoon to the seed chamber of the guiding wheel. The guiding zone and the dropping zone are located between the seed plate and the guiding wheel, the dropping zone is located at the bottom of the inner chamber, and the guiding zone is located on the upper right side of the dropping zone. Here, the maize seeds move synchronously with the seed chamber of the guiding wheel and enter the dropping zone, where the maize seeds gradually approach the seed export and finally fall through the seed export (60.34 × 18.3 mm) to the conveyor belt. The working principle of the spoon precision seed metering device is as follows.
The seed metering device moves along the x-axis direction during its operation, the maize seeds are located in the inner cavity of the seed-filling shell, and the seed spoon and the guiding wheel are synchronously rotated in a clockwise (ω) direction. Meanwhile, the seed spoon picks up the maize seeds from the filling zone, passes through the clearing zone, removes the excess maize seeds, passes through the handing zone, transfers the seeds in the spoon to the guiding wheel, and finally successively passes the guiding zone and dropping zone, and the seeds are discharged from the seed export.
In the filling zone, maize seeds are balanced under the combined action of collision friction between seeds, self-gravity, the friction of the seed plate, support force of the seed spoon, centrifugal force, etc., so as to ensure that seeds are stable in the seed spoon and smooth movement synchronously with the seed spoon. They are basically free from collision friction between seeds when seeds enter into the clearing zone, as shown in Figure 2c. According to D’Alembert’s principle, the following equations can be obtained.
Tan gential   direction : G cos ( ω t ) + f F t = m a t Radial   direction : G sin ( ω t ) F n = F
where G—gravity of a single maize seed (N), direction: straight down, ωt—rotation angle of the seed spoon (deg), f—friction of the seed to seed (N), direction: opposite to the direction of mutual movement between seeds, Ft—tangential support force of the seed spoon (N), direction: parallel to the contact surface of the seed spoon, Fn—radial support force of the seed spoon (N), direction: perpendicular to the contact surface of the seed spoon, m—mass of a single maize seed (kg), at—tangential acceleration of the seed (m/s2), F—centrifugal force (mR1ω2, N), and R1—rotatary radius of the seed (m).
For the second-order derivation of the angular velocity ω with Equation (1), Equation (2) is obtained:
d 2 F n d ω 2 = m ( g t 2 sin ( ω t ) + 2 R 1 )
The range of the seed spoon rotation angle is 0 ° ,   90 ° . When the maize seed is located in the handing zone, m ( g t 2 sin ( ω t ) + 2 R 1 ) < 0 , it shows that radial support force increases first and then decreases with the increase of the rotation speed of the seed spoon; that is, there is a rotation speed ω, so the radial support force between the seed spoon and the seed is at the maximum. At this time, the seed can be firmly placed in the seed spoon, thereby reducing the cavity rate.
According to the structure diagram of the spoon precision seed metering device in Figure 2a, the corresponding DEM analysis model is established in the Creo. At the same time, to reproduce the movement of the seed metering device in the actual working condition (x-axis direction), a three-dimensional DEM analysis model of the conveyor belt is established (Figure 2d) for subsequent use in the DEM simulation, and it has a length of 1000 mm and a width of 100 mm.

2.3. The Parameter Selection in the DEM Simulation

According to the actual situation of the spoon precision seed metering device, the material of the seed filling shell is plexiglass, the materials of the seed spoon, seed plate, guiding wheel, and guide shield are made of an aluminum alloy, and the material of the conveyor belt is rubber. The density, Poisson’s ratio, shear modulus, and interaction parameters between maize seeds and other mechanical components of the above-mentioned materials are referenced in the literature [19,38] and the American Society of Agricultural Engineers Standards [41]. It is worth noting that to prevent the seed model from producing a bounce phenomenon on the conveyor belt, the restitution coefficient, static friction coefficient, and rolling friction coefficient between the seed model and the conveyor belt are set to 0.0001, 1, and 2, respectively, in this paper, as shown in Table 2. Due to the limitation of the EDEM 2018 software, the primary size distributions of maize seeds are equivalently transformed into a volume distribution, and the maize seed model is generated according to its volume distribution. The average value and standard deviation of maize seed volume are listed in Table 3.

2.4. Performance Research of the Seed Meter

In this section, the validity of the maize seed assembly model is first verified. Then, the performance of the seed metering device is simulated and optimized. Finally, the optimization results are verified by an experiment.

2.4.1. Verification Simulation of the Maize Seed Assembly Model

In this paper, EDEM 2018 is used to simulate the seeding process of seed meters at different RSSWs (25, 26, 26.5, 27, 28 r/min), as shown in Figure 3. The size of the calculation domain, including the seed meter and the conveyor belt, is [x, y, z] = [140.25, 1063.35, 334.05], and the unit is mm. The simulation time is 15 s, the time step is 1 × 10⁻⁶ s, the minimum grid size is 3Rmin, Rmin is the radius of minimum sub-sphere, the seed mass is 0.2 kg, SR is 9 mm, HA is 50°, and the contact forces between particles and between particles and boundaries, including normal force (Fnormal) and tangential force (Ftangential), are calculated based on the Hertz–Mindlin (no—slip) contact model [42]. The normal force and tangential force are calculated according to Equations (3) and (4). Further, when the tangential force is greater than the maximum static friction force (μsFnormal), the maximum static friction force is used as the tangential force at this time.
F n o r m a l = 4 3 E * R * U n 3 2 - 2 5 6 β k n m * v n r e l
where E * —equivalent Young’s modulus, R * —equivalent radius, U n —normal overlap, β—damping coefficient, k n —normal stiffness, m * —equivalent mass, and v n r e l —normal relative velocity.
F t a n g e n t i a l = k t U t 2 5 6 β k t m * v t r e l ,   k t U t + 2 5 6 β k t m * v t r e l μ S F n o r m a l μ S F n o r m a l ,   k t U t + 2 5 6 β k t m * v t r e l μ S F n o r m a l
where k t —tangential stiffness, U t —tangential overlap, v t r e l —tangential relative velocity, and μ S —coefficient of static friction.
To characterize the rolling effect of maize seed particles, rolling friction is introduced and is accounted for by applying a rolling torque to the contacting surfaces between maize seed particles. The rolling torque can be expressed as:
τ i = 4 3 μ r E * R * U n 3 2 R i ω i
where μ r —coefficient of rolling friction, R i —distance of the contact point from the centroid, and ω i —unit angular velocity vector of the object at the contact point.
Referring to the literature [43], the theoretical seed distance is set to 270 mm, and the corresponding conveyor belt speed can be obtained according to the relationship between the theoretical seed distance and the revolving speed of the seed metering wheel. Each case is repeated 3 times. When the DEM simulation is completed, the indoor seed surface inclination angle β and the performance index of the seed meter are counted during the seeding process. Here, the seed surface inclination angle is the acute angle formed by the free surface of the maize seed pile and the horizontal level. The performance indexes of the seed meter [44] include the qualification index (A) and the replay index (D). The relevant calculation method is as follows.
v c = 1 60 z n p l 1 A = n 1 N × 100 % D = n 2 N × 100 %
where vc—speed of the conveyor belt, z—number of seed spoons, np—revolving speed of the seed metering wheel (r/min), ll—theoretical seed distance (mm), n1—number of qualified maize seeds, n2—number of replays of maize seeds, and N′—number of intervals.

2.4.2. Optimization Simulation of the Seed Metering Device

To reflect the practical value of the established maize seed assembly model, in this section, the model is used to optimize the performance of the spoon precision seed metering device. Referring to the literature [38,39,45], the RSSW, HA, and SR are selected as experimental factors. A reasonable range of 7–9 mm for SR is obtained by means of DEM simulation tests, while the ranges for RSSW and HA are obtained by consulting the manufacturer and the design specifications, and the value of each factor is listed in Table 4. The maize seed assembly model is a 10-18-6 and 14-18-6 combined particle model; namely, the sub-sphere number of the horse tooth shape, spherical cone shape, and spheroid shape is 10/18/6 and 14/18/6, respectively. The experimental scheme is a multivariate nonlinear orthogonal regression design that is a method of mathematical and statistical analysis specifically designed to deal with nonlinear mapping relationships between multiple variables and the corresponding responses. The performance of the seed metering device under different experimental factors is reproduced using DEM simulation, and the values of related simulation parameters are the same as the ones in Table 2 and Table 3.

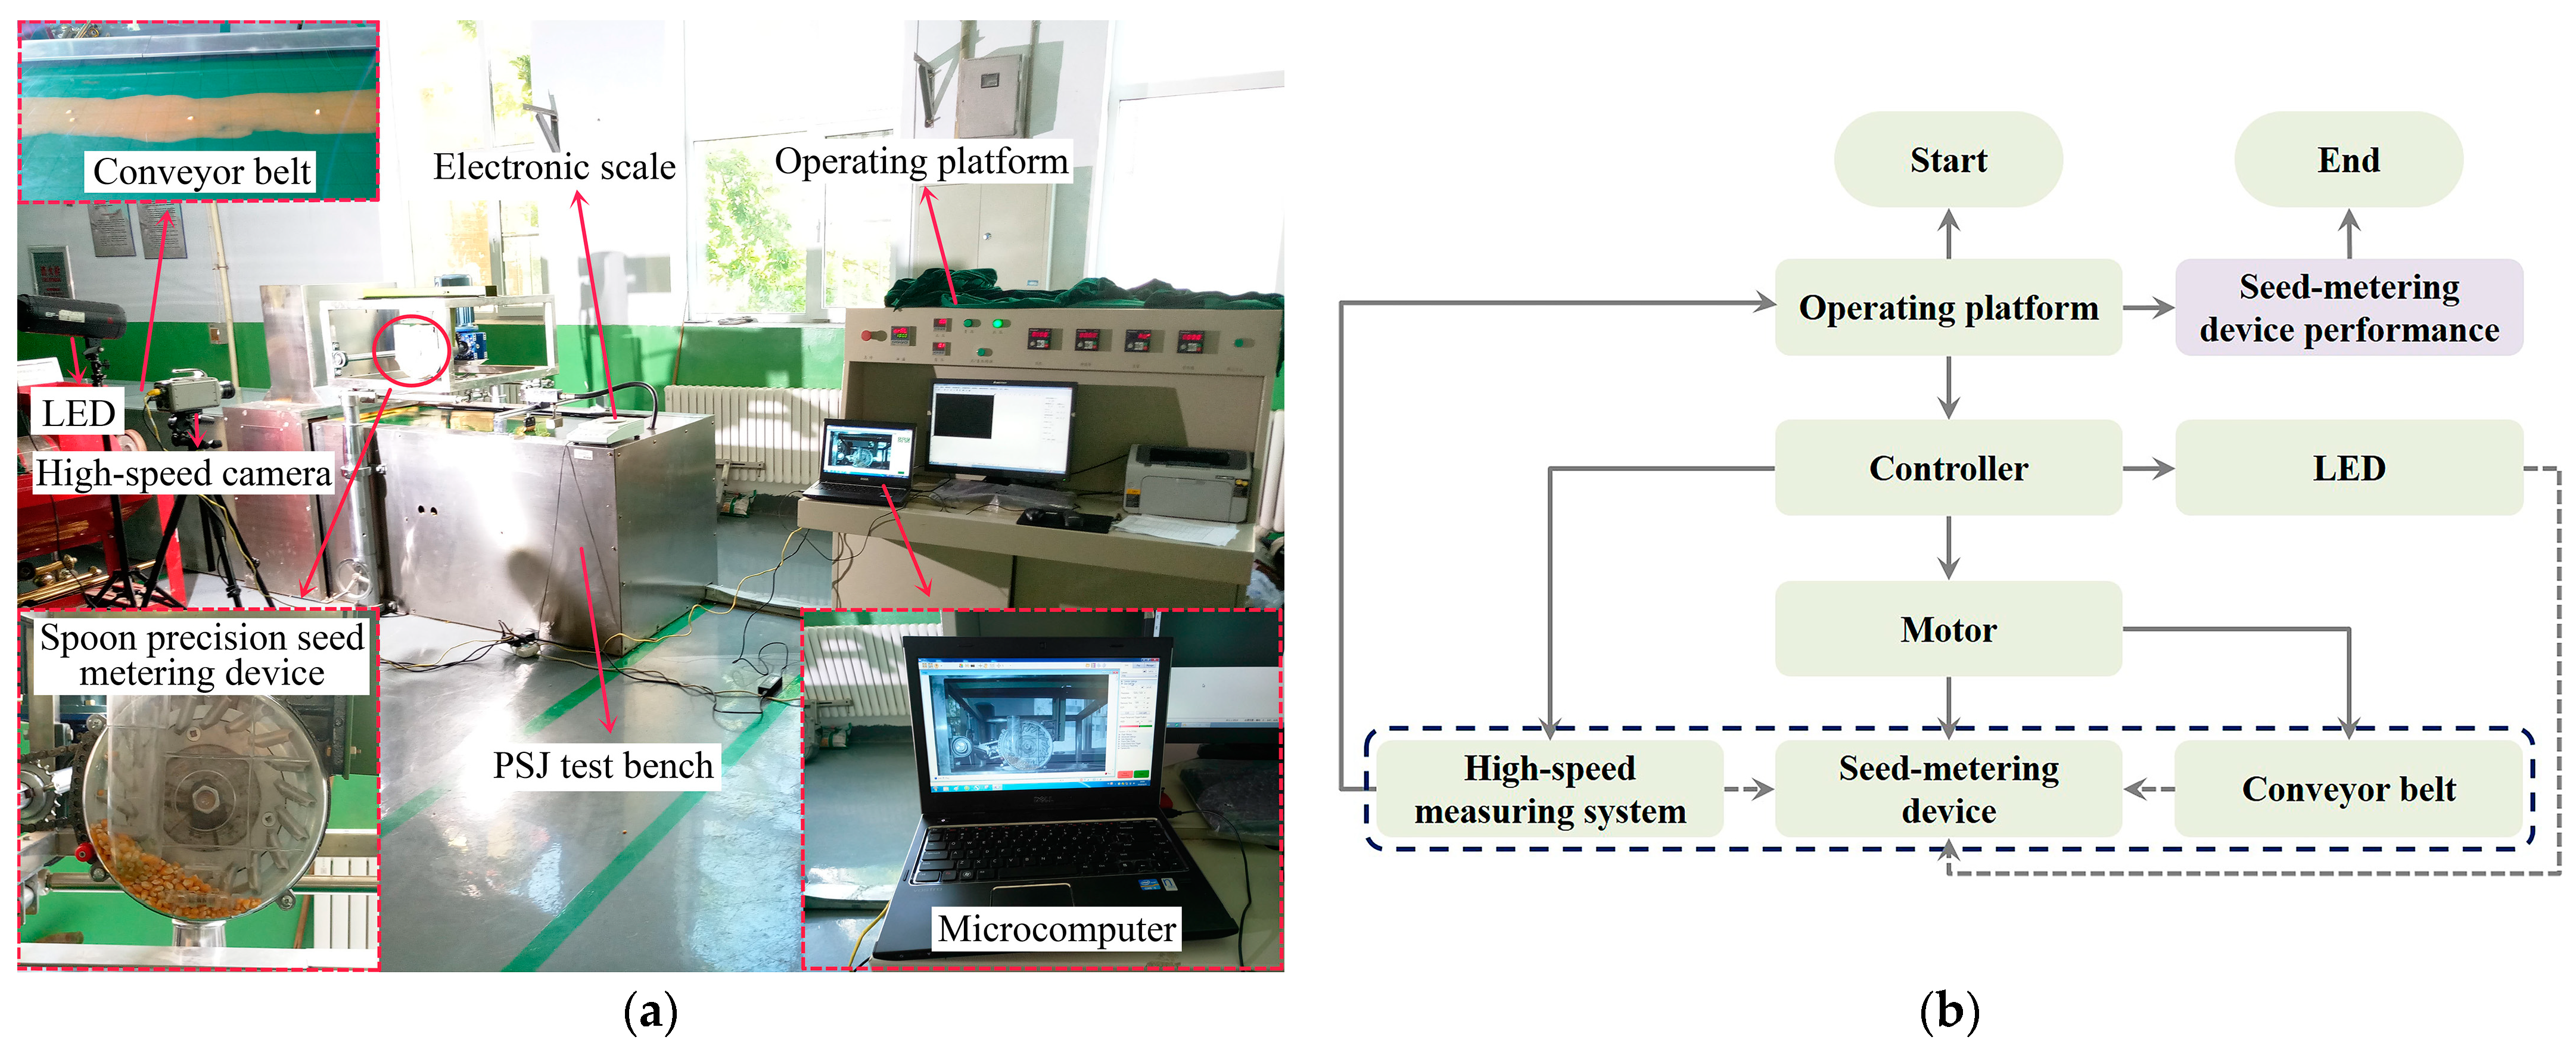
3. Experiment Verification

The experimental scheme is the same as in Section 2.4.1. The mass, shape composition, and size distribution of maize seed used in the experiments are consistent with the corresponding DEM simulations, and the mass is determined to pass the electronic scale. The seeding experiment of the spoon precision seed metering device is performed at five RSSWs of 25, 26, 26.5, 27, and 28 r/min. To facilitate subsequent measurement of the seed surface inclination angle β, a Phantom v7.3 high-speed camera is used to record the seeding process of the seed metering device, and a high-performance microcomputer is used to store images, and it runs in parallel with the operating platform. To obtain high-definition images, LED lights are used to enhance the light, as shown in Figure 4a. Here, to reproduce the actual fall of the maize seeds into the soil, butter on the conveyor belt is used to bind the maize seeds that fall on it. Here, the PSJ test bench is used to conduct the corresponding experiment that mainly includes the verification experiment of the maize seed assembly model and the seed meter performance optimization verification experiment. The working principle of the PSJ test bench is as follows.
As shown in Figure 4b, the operating platform sends control signals to the controller, which drives the motors. Power is transmitted from the motor to the seed metering device mounted on the test bench via the transmission system, so the seed metering device is in synchronous operation. At the same time, the conveyor belt and the high-speed measuring system installed inside the test bench start working simultaneously, and the high-speed measuring system is located directly above the conveyor belt so that the seeding situation of the seed meter is obtained in real time. Finally, the information obtained by the high-speed measuring system is transferred to the processor of the operating platform, and it is transformed into performance data of the seed metering device.
According to the optimization results in Section 2.4.2, the corresponding bench verification experiment for Jiping 1 and Ping’an 11 is carried out, and the qualification index (A), replay index (D), and indoor seed surface inclination angle β are obtained. The coefficient of variation is calculated at this time, each group of experiments is repeated three times, and the average value is taken as the final test result.

4. Results and Discussion

First, the maize seed particle behavior during sowing is analyzed based on the maize seed assembly model in this section. On this basis, the performance of the spoon precision seed metering device is analyzed in relation to the behavior of maize seed particles.

4.1. Validation Analysis of the Maize Seed Assembly Model

4.1.1. Maize Seed Particle Behavior

The maize seed particle behavior of the 10-18-6 combined particle model at different revolving speeds in the seed metering wheel is shown in Figure 5. To clearly describe the behavior of the maize seed particles, the inner chamber of the seed metering device is divided into different zones based on the seed particle movement characteristics and the actual structure of the seed metering device. The Cartesian coordinate system is set up with the x-axis horizontal to the right, and the origin (point O) of the coordinates coinciding with the rotation center of the seed metering device. The right boundary OO2 of Zone A is the y-axis, and the left boundary OO1 coincides with the filling zone boundary. Zone B is adjacent to Zone A on the left, the upper boundary O6O1 is in a horizontal state, and OO6 is approximated as 61 mm. The left boundary O5O7 is the free surface of the maize seed. Zone D is adjacent to Zone B with the free surface of the maize seed on the left border. Zone C, adjacent to Zone B and Zone D, is located at the outermost part of the inner cavity of the seed metering device with an overall curved band shape and an approximate thickness O2O8 of 15 mm. The upper boundary is the x-axis, and the left boundary is the y-axis. Zone E is located above Zone D and is located in the first quadrant.
It can be seen that the maize seeds in Zone A are basically in a stable state, the majority of maize seeds in Zone B are in a disturbed state, and the maize seeds in Zone D are in a mixed state. This is due to the higher bulk density of maize seeds in Zone B. With more locations of contact between maize seed particles, a disturbance from the seed spoon spreads between maize seed particles, which in turn makes the disturbed proportion of maize seeds in this area larger. With the increase in the RSSW, the velocity of maize seeds kept increasing, especially for maize seeds in Zone C, which indicates that the perturbation of maize seeds by seed spoons became obvious. Maize seeds in Zone D are perturbed with increased intensity, and this should be due to the obvious phenomenon of perturbation of maize seeds in Zone B and Zone C, which caused external perturbation to maize seeds in Zone D other than seed spoons.
From the perspective of the seed spoon pressure from the maize seeds, the pressure of the whole seed spoons located in Zone B is higher, indicating a significant interaction between the seed spoons and the maize seeds, which is consistent with the disturbance phenomenon of the maize seeds described above. Compared with other parts of the seed spoon, the pressure on the head of the seed spoon in Zone E is higher because of the presence of maize seeds in the seed spoon and the interaction between maize seeds and the seed spoon under the complex force of gravity, friction, and centrifugal force, which also reflects whether the maize seeds can pass through the guiding zone and enter the handing zone. This is because the maize seeds in the seed spoon have been delivered to the guiding wheel in the handing zone, but some maize seeds fail to be delivered and fall out of the seed spoon back to the filling zone, which may cause an increase in the cavity rate to some extent.

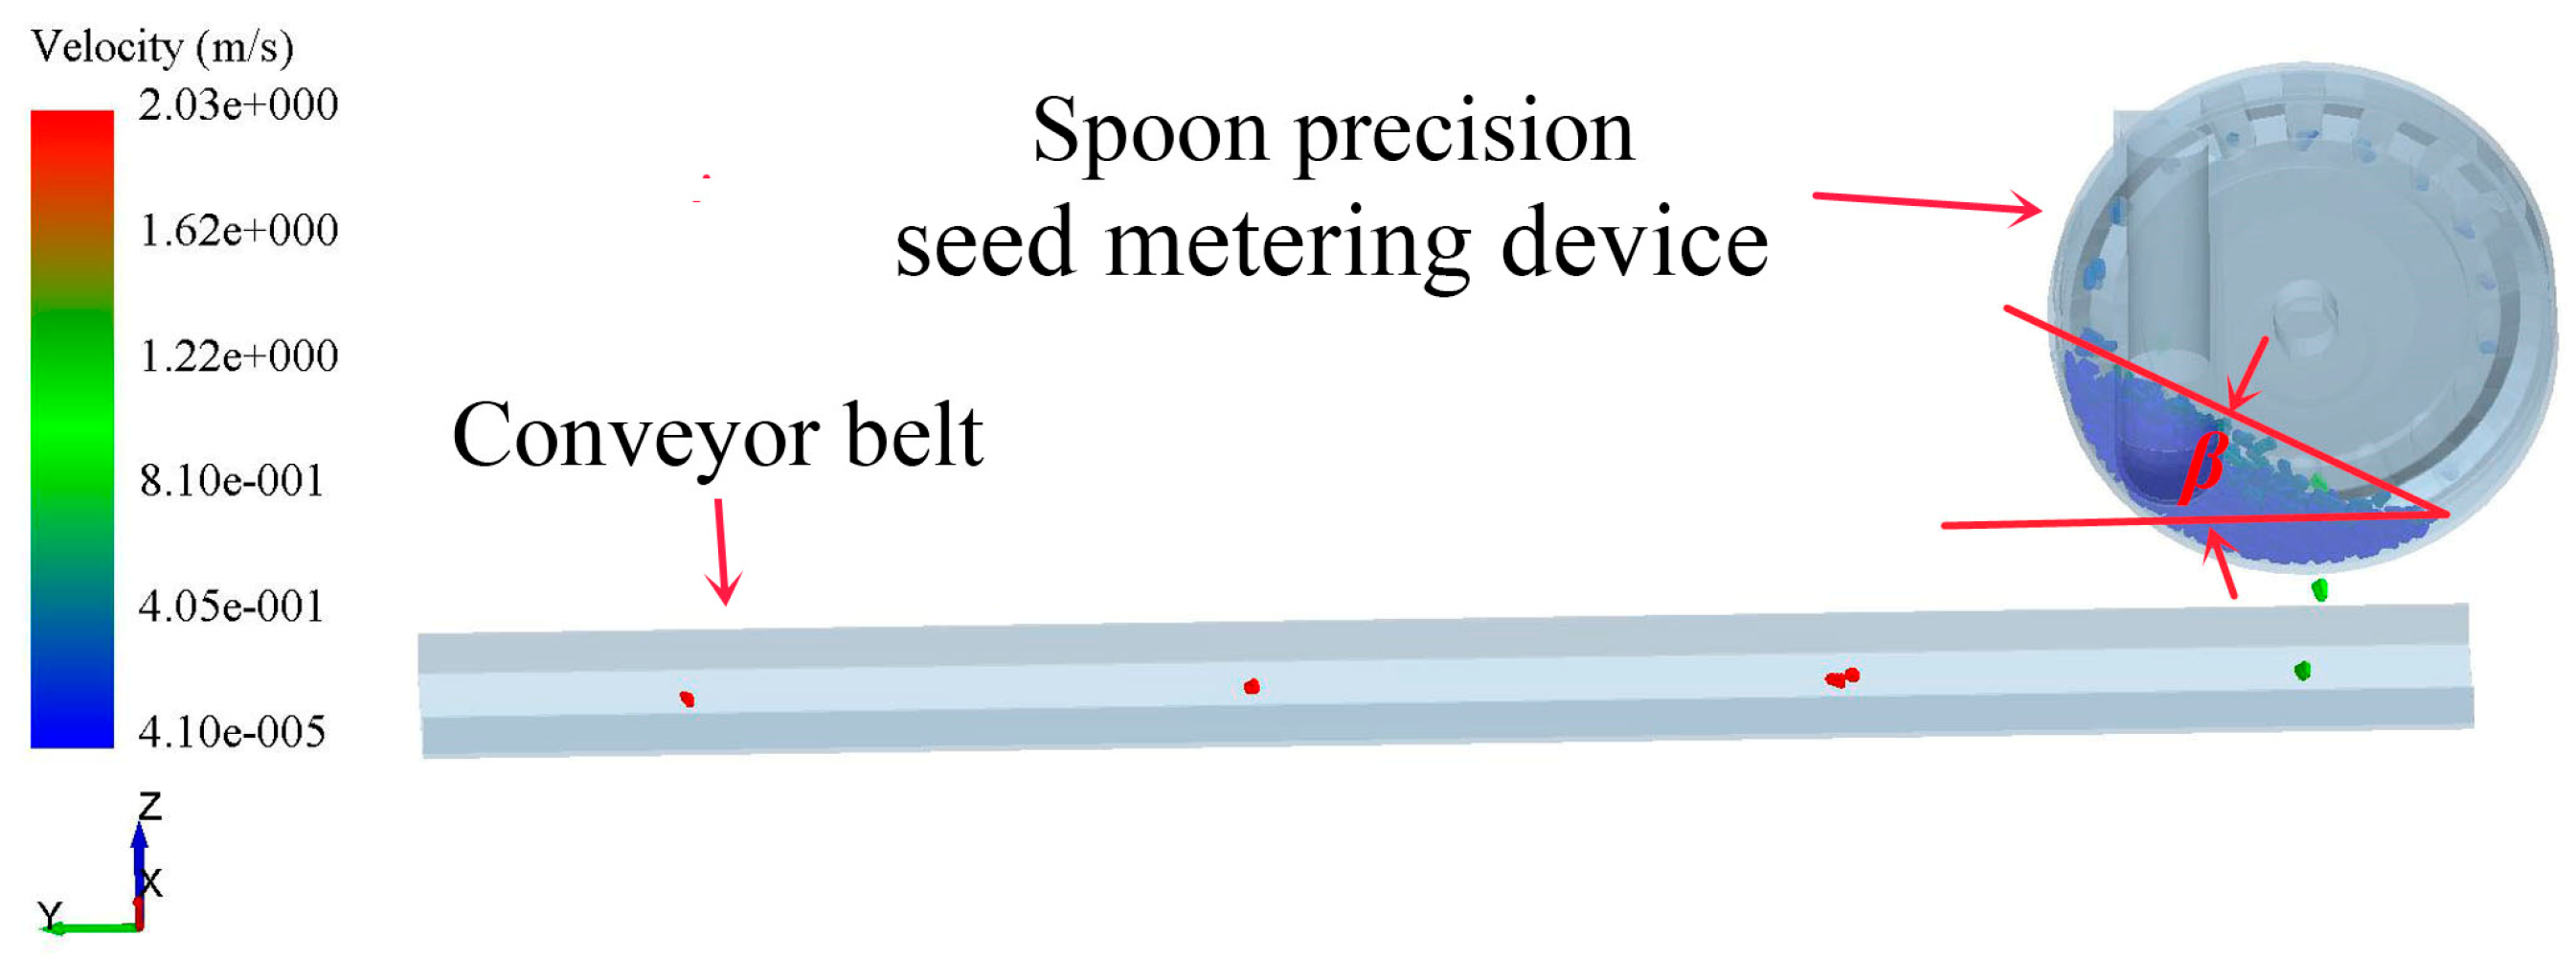
4.1.2. Seed Surface Inclination Angle

The comparisons of the simulated results and the experimental ones for the seed surface inclination angle for Jiping 1 and Piang’an 11 are shown in Figure 6. The green area in the figure is the standard deviation of the experimental results. It can be seen that the seed surface inclination angle increases first and then decreases with the increase in the RSSW, and this may be because when the RSSW is low, the contact time between the seed spoon and the seed inside the seed metering device is longer, so maize seeds located in Zone B and Zone D move to the upper right, making the seed surface inclination angle larger. When the RSSW is high, the contact time between the seed spoon and the seed inside the seed metering device is less, and the maize seeds located in Zone D show a backflow phenomenon, making the height of Zone D increase slowly, while the height of Zone B increased faster, so the seed surface inclination angle decreased. Further, the seed surface inclination angles reach the maximum when the RSSW of Jiping 1 and Piang’an 11 are between 26.0 r/min and 27.0 r/min. In addition, the comparison shows that the simulated results of the 10-18-6 and 14-18-6 combined particle models converge to the experimental values.

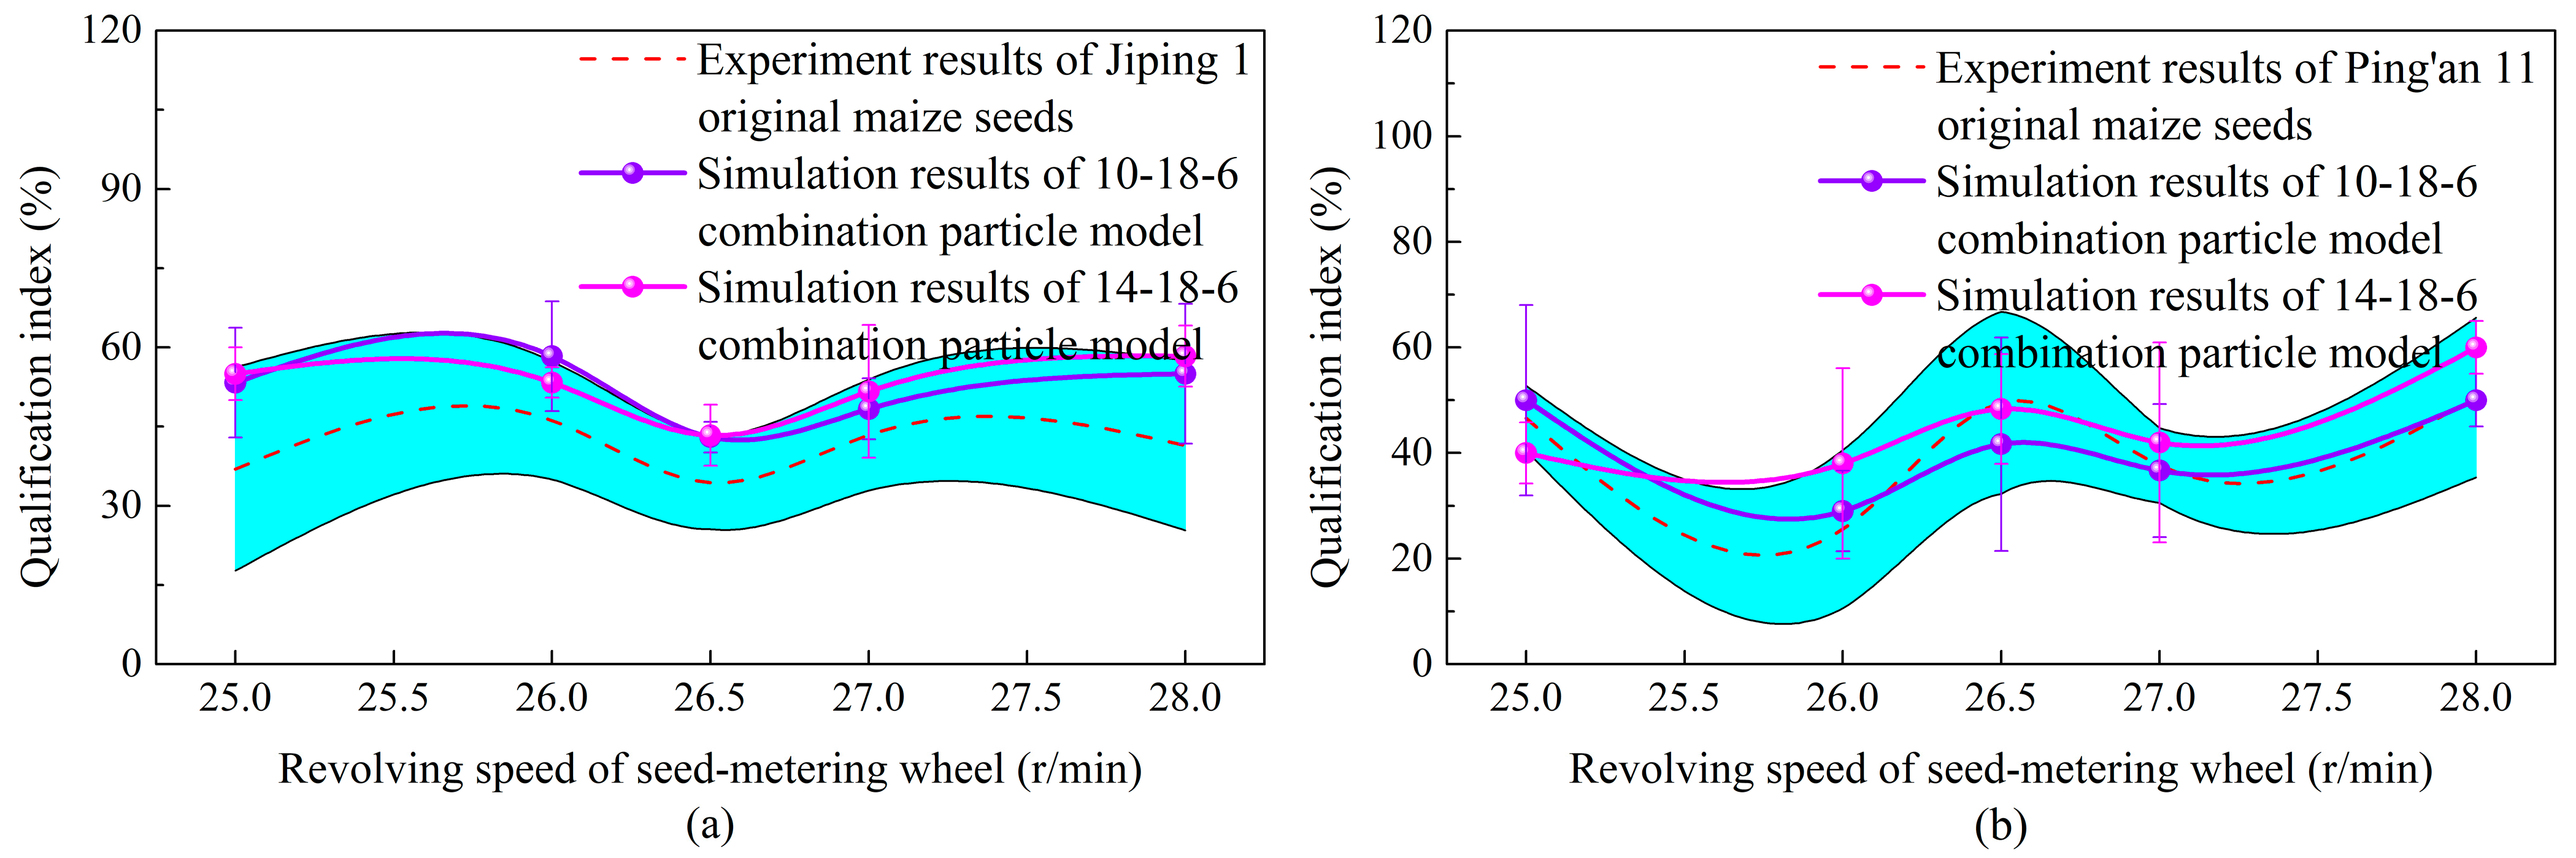
4.1.3. Qualification Index
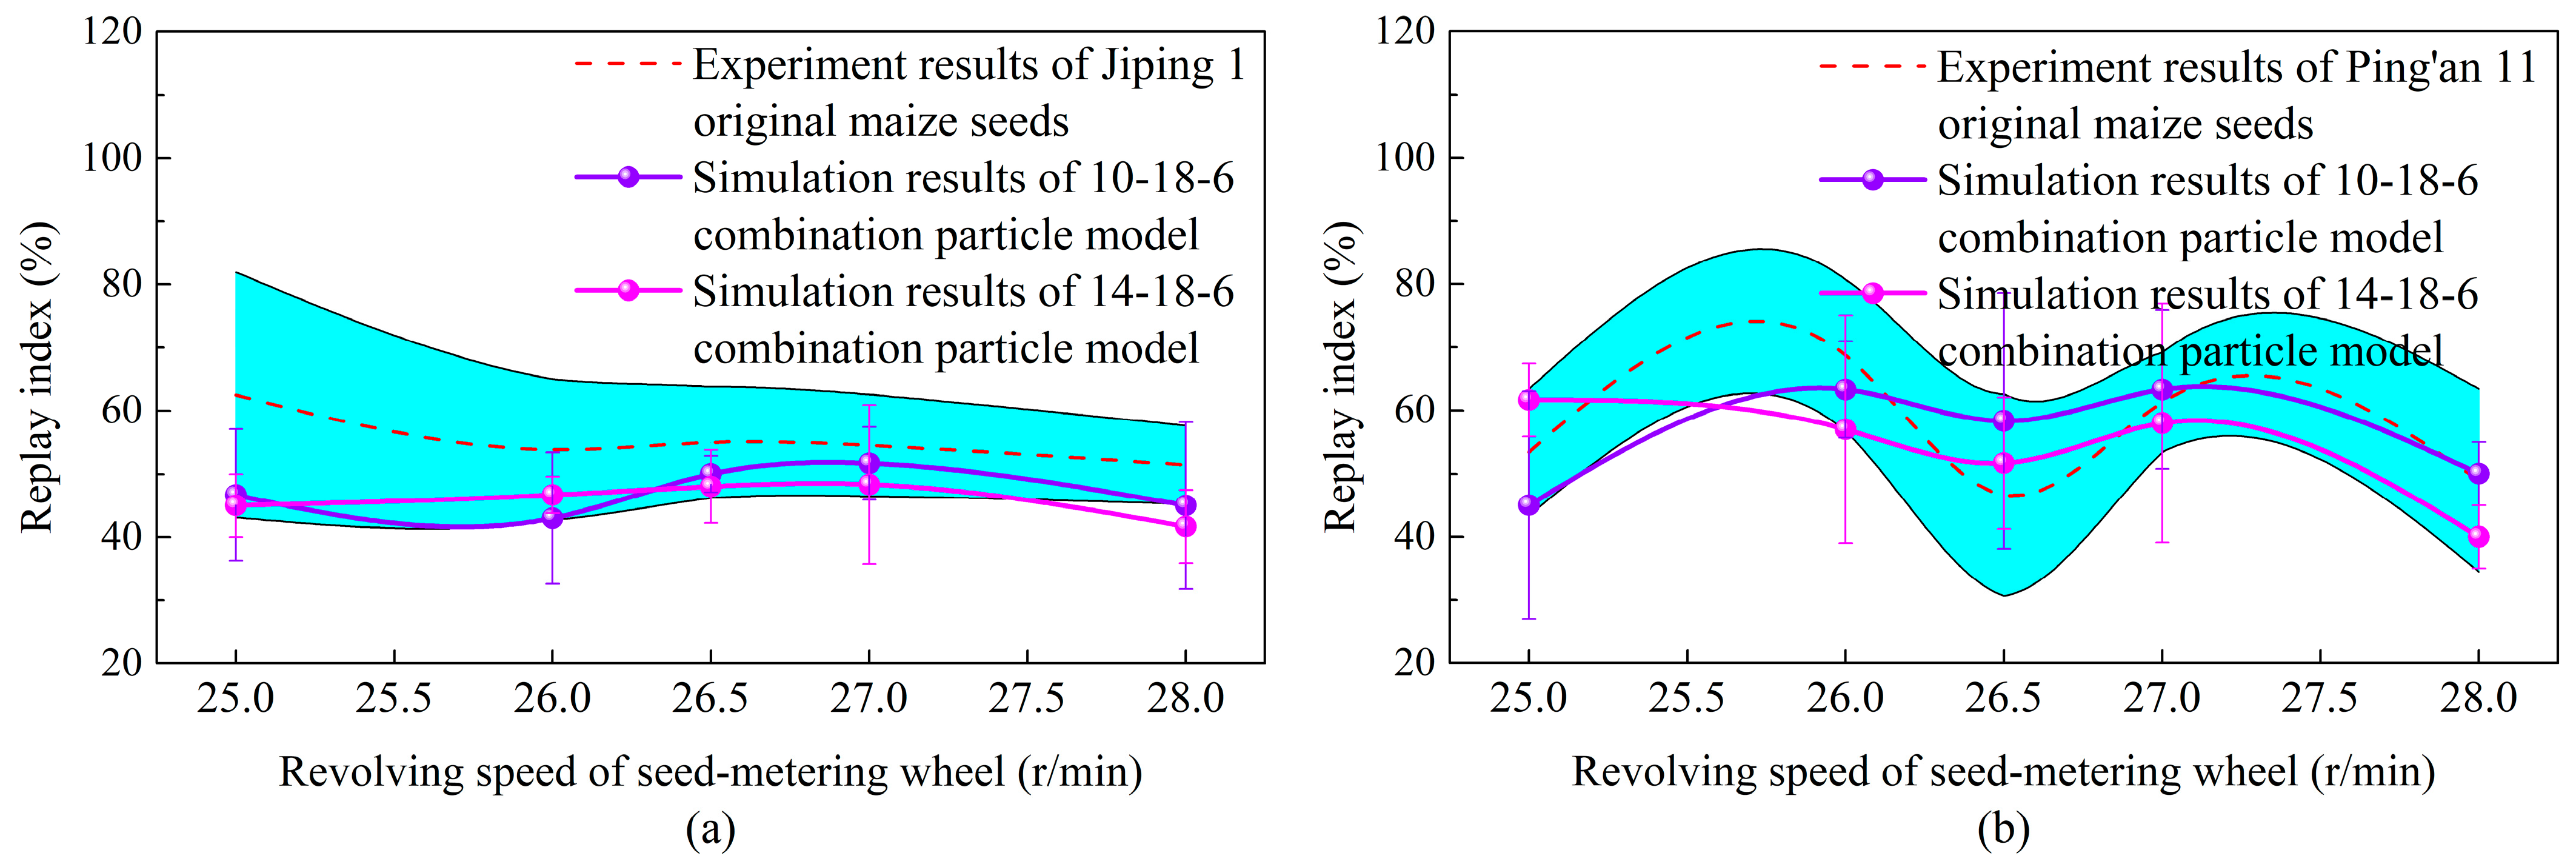
The comparisons of the simulated results and the experimental ones for the seed qualification index (A) for Jiping 1 and Piang’an 11 are shown in Figure 7. The green area in the figure is the standard deviation of the experimental results. It can be seen that the qualification index fluctuates with the increase in the RSSW. This may be due to the interaction between the RSSW and other influencing factors. Secondly, the fluctuation of the experimental value of the qualification index gradually decreases with the increase in the RSSW, and the distribution is basically between 37.7% and 50.5%. This shows that the seeding performance of the seed metering device tends to be stable when the RSSW is high. When the RSSW is small, the qualification index is low overall. The reason is that the maize seeds are not significantly disturbed at this time, and the interactions between the maize seeds located in the seed spoon and other seeds are weaker when the seed spoon is passing through Zone B and Zone D, and the interactions between the maize seeds and the seed spoons are stronger, which can be verified by the distribution of seed spoon pressure. In addition, the comparison shows that the simulation results of the 10-18-6 and 14-18-6 combined particle models both converge to the experimental values.

4.1.4. Replay Index

The comparisons of the simulated results and the experimental ones for the seed replay index (D) for Jiping 1 and Piang’an 11 are shown in Figure 8. The green area in the figure is the standard deviation of the experimental results. It can be seen that the replay index fluctuates with the increase in the RSSW, and the reason is that the interaction between the RSSW and other influencing factors exists; the RSSW is not always the main influencing factor of the replay index. When the RSSW is large, the replay index gradually decreases and is at a low level. This is because the disturbance between the maize seeds located in the seed spoons and other maize seeds becomes obvious at this time so that the maize seeds that are not in direct contact with the seed spoons are easily separated from the seed spoons by the external disturbance. Finally, only the single maize seed in contact with the seed spoon enters the handing zone with the movement of the seed spoon, thus reducing the replay index. In addition, the comparison shows that the simulation results of the 10-18-6 and 14-18-6 combined particle models both converge to the experimental values.
In summary, the comparisons of the simulated results and experimental ones of the seed surface inclination angle, qualification index, and replay index during the process of seeding by a seed metering device show, at the macroscopic and microscopic levels, the validity of the maize seed assembly model.

4.2. Optimization Analysis of Seed Metering Device Performance

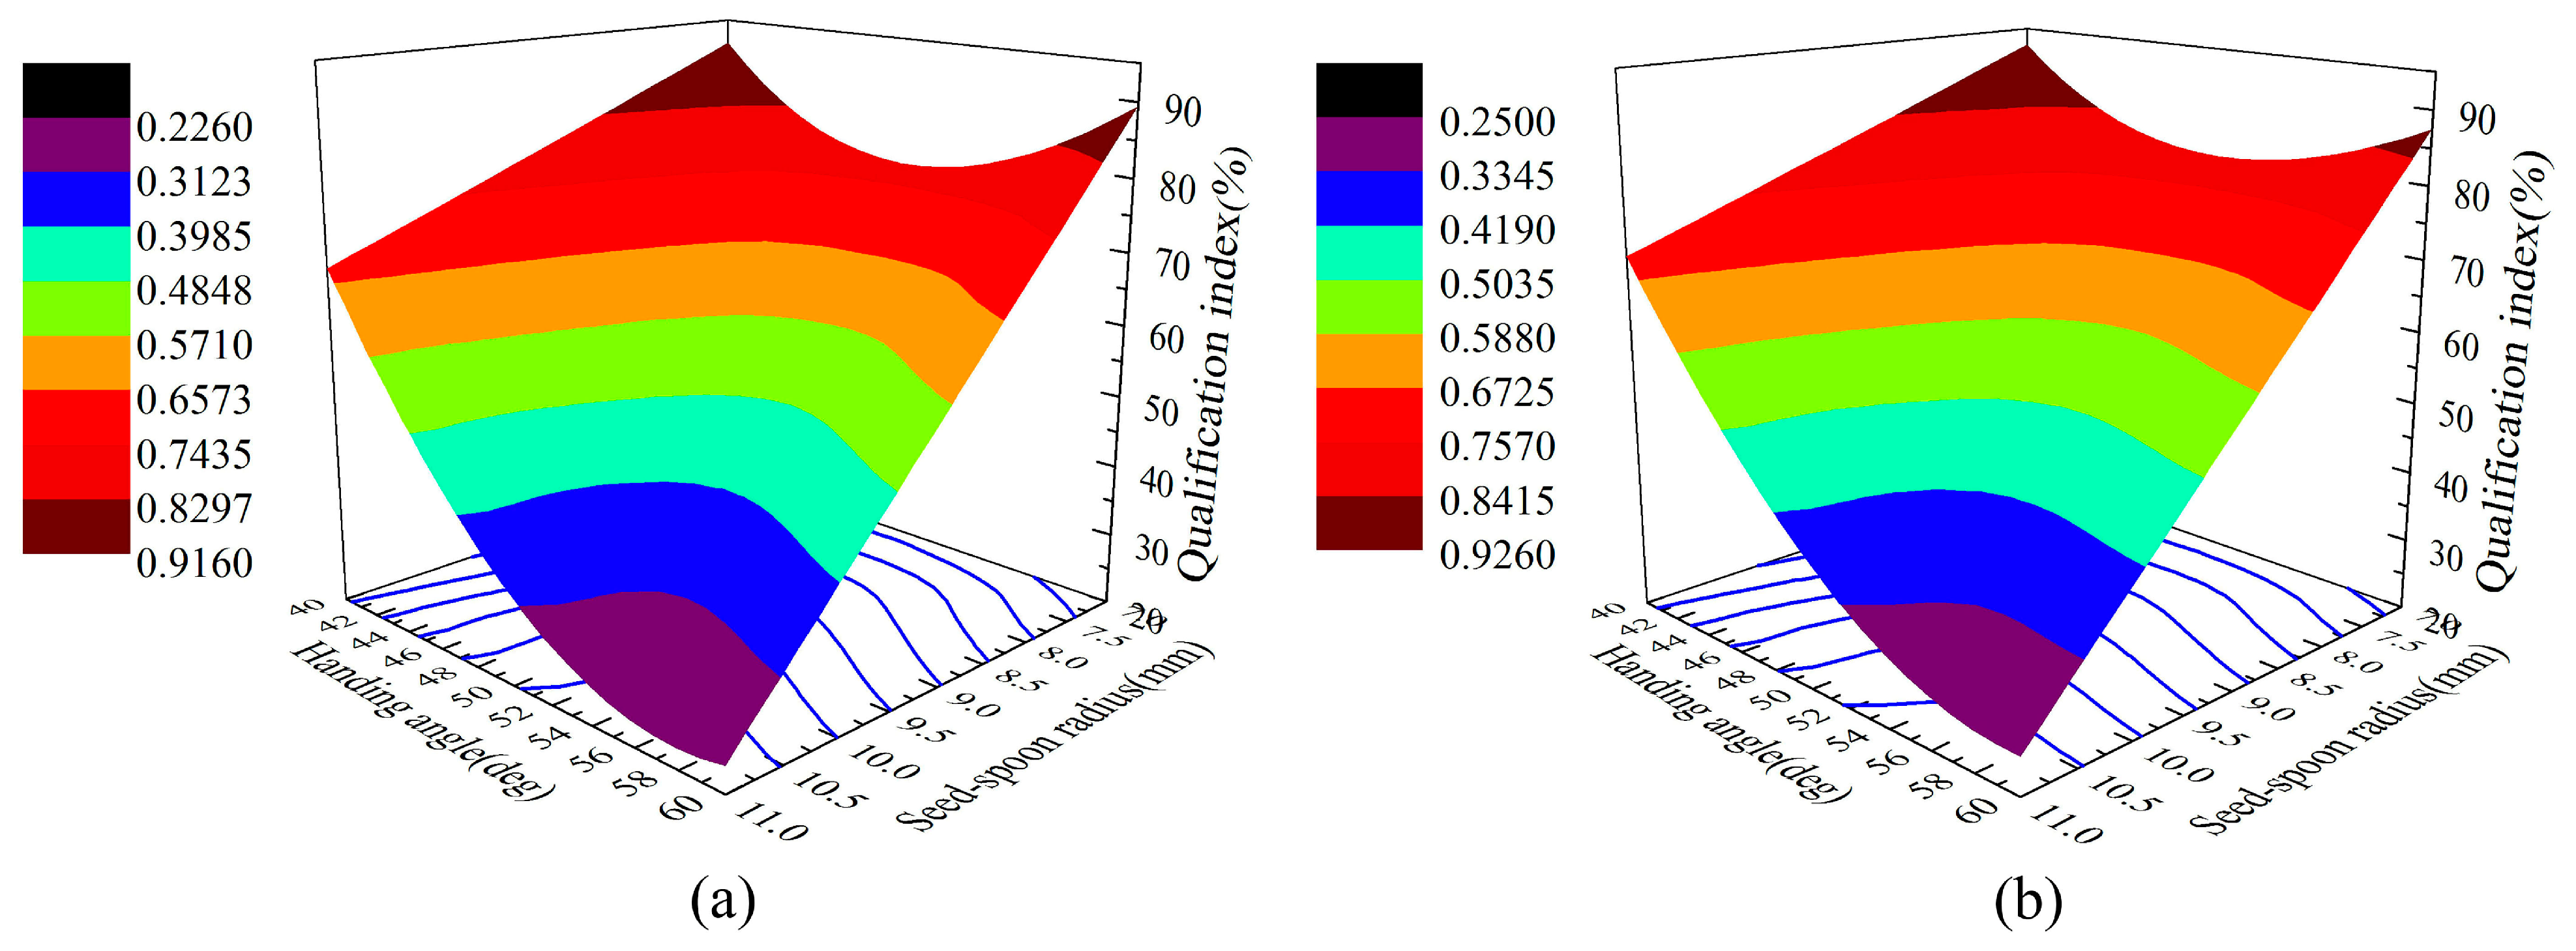
4.2.1. Simulation Optimization

The simulation results of the qualification index of Jiping 1 and Ping’an 11 are shown in Table 5. x1, x2, and x3 represent the SR, HA, and RSSW, respectively. y1i and y2i represent the simulation results of Jiping 1 and Ping’an 11, respectively.
Considering that the multivariate nonlinear regression method showed superior performance in data fitting, it is used to obtain the prediction model between the qualified index (y1i, y2i) and the three factors (z1, z2, z3) based on the following principle.
The predictive model in the coding space can be expressed in Equation (7):
y = f ( x 1 , x 2 , x 3 ) = b 0 + j = 1 3 b j x j + i j b i j x i x j + j = 1 3 b j j x j 2
where y—response, x i —the SR, HA, and RSSW in the coding space, and b—regression coefficient in the coding space, which can be described as follows:
b 0 = 1 N k = 1 N y k b j = k = 1 N x k j y k / k = 1 N x k j 2 b i j = k = 1 N x k i x k j y k / k = 1 N x k i x k j 2 b j j = k = 1 N ( x k j 2 1 N k = 1 N x k j 2 ) y k / k = 1 N ( x k j 2 1 N k = 1 N x k j 2 )
where N—number of simulations.
When the prediction model in the coding space is obtained, the coding Equation (9) is introduced into Equation (7) to obtain the predictive model in the natural space, as seen in Equation (10).
x j , = x j x 0 j / Δ j
where x 0 j —zero level of the influence factor and Δ j —level increment of the influence factor.
y = f ( x 1 , x 2 , x 3 , x 4 ) = β 0 + j = 1 4 β j x j + i j β i j x i x j + j = 1 4 β j j x j 2
where x—influence factor in the natural space and β —regression coefficient in the natural space.
By performing multivariate nonlinear regression analysis on the above results, the performance prediction models between the qualified index (y1i, y2i) and the three factors (z1, z2, z3) are obtained and are, respectively, expressed as:
y 1 i = Coding   space : 0.62 0.23 x 1 0.12 x 2 0.04 x 3 0.11 x 1 x 2 Natural   space : 0.487 + 0.160 z 1 + 0.0375 z 2 0.0267 z 3 0.0055 z 1 z 2
y 2 i = Coding   space : 0.64 0.21 x 1 0.13 x 2 0.04 x 3 0.10 x 1 x 2 Natural   space : 0.6435 + 0.1435 z 1 + 0.0325 z 2 0.025 z 3 0.005 z 1 z 2
Analysis of variance [46] is carried out for the above-mentioned performance prediction models, and the results are listed in Table 5. Here, Dj, Bj, bj, Sj, Fj, S, fhui, Sif, fif, Se, and fe are all statistics used in the analysis of variance, where αj—significance level. It can be seen that the SR has the greatest influence, and the influence of the RSSW is the smallest. In addition, the SR·HA interaction has a significant influence and shows an antagonistic effect. Further, the performance prediction model F values of the qualification index for Jiping 1 and Ping’an 11 can be calculated based on Equations (13) and (14); the corresponding p-values are 0.10 and 0.05, respectively, indicating that the performance prediction models are significant. According to Equations (15) and (16), the F values of the lack of fit can be obtained, and the corresponding p-values are both greater than 0.05, respectively, indicating that the performance prediction models can describe the actual functional relationship between the qualification index and the three influence factors, which can reliably predict the qualification index.
F h u i Jiping   1 = S h u i Jiping   1 / f h u i S R / f R = S h u i Jiping   1 / f h u i S S h u i Jiping   1 / f R = 4.67 > F 0.10 ( 5 , 5 )
F h u i Ping an   11 = S h u i Ping an   11 / f h u i S R / f R = S h u i Ping an   11 / f h u i S S h u i Ping an   11 / f R = 6.69 > F 0.05 ( 5 , 5 )
F i f Jiping   1 = S i f Jiping   1 / f i f S e Jiping   1 / f e = 16.89   <   F 0.05 ( 3 , 2 )
F i f Ping an   11 = S i f Ping an   11 / f i f S e Ping an   11 / f e = 7.55   <   F 0.1 ( 3 , 2 )
By further analyzing the data in Table 4 based on an analysis of extreme variance, it is concluded that with the increase in the RSSW, the qualification index decreases slightly. Moreover, as the HA and the SR increase together, the qualification index also shows a downward trend, and the corresponding response surface is shown in Figure 9. Therefore, the qualification index is optimal, when the SR, HA, and RSSW are 7 mm, 40°, and 25 r/min, respectively. The expected results of the qualification index for Jiping 1 and Ping’an 11 are calculated according to the performance prediction models, and they are 90.0% and 92.3%, respectively.

4.2.2. Verification Analysis

The optimized qualification indexes of the experimental results are listed in Table 6. It can be seen that the qualified indexes of the experimental results for Jiping 1 and Ping’an 11 are 89.45% to 92.40% and 88.05% to 93.53%, respectively, which are greater than the ones of the unoptimized seed metering device (the results in Section 4.1.3). The reason may be that the small SR increases the contact area between the maize seeds and the seed spoon, and the small RSSW can effectively reduce the vibration problem of the seed metering device, which enables the maize seeds to move synchronously with the seed plate in the cleaning zone. Secondly, the small HA reduces the delivery time of the maize seeds and also greatly reduces the possibility of the maize seeds falling from the seed spoon. Further, the relative errors between the expected results in Section 4.2.1 and experimental results are all within 5%, and they have a good agreement, which reflects the practical value of the maize seed assembly model. In addition, the replay indexes of Jiping 1 and Ping’an 11 are less than 10%, the coefficient of variation is less than 25%, and they both meet the corresponding technical requirements in the machinery industry standard—JB/T 10293-2013. The results show that the seed spacing is relatively stable.
The optimized maize seed particle behavior of the 10-18-6 combined particle model is shown in Figure 10. It can be seen the optimized Zone E has a larger radial length, which facilitates the process of seed guiding and seed delivery during the sowing process. The seed distribution in Zone E shows that as the maize seed height increases, the phenomenon of only one seed in the seed spoon becomes common, and the maize seed is reliably in contact with the seed spoon at this time, which can be verified by the distribution of the seed spoon pressure. Secondly, the majority of maize seeds in Zone F are singular and uniformly distributed, which is consistent with the high qualification index described above. Further, the absence of seed spoon pressure in Zone F suggests that excess maize seeds in the seed spoon fall back into the clearing zone. So, the performance of the spoon precision seed metering device is good and optimized.

5. Conclusions

In this paper, the validity of the maize seed assembly model is verified through the sowing process, and the performance of the maize spoon precision seed metering device is optimized based on the the maize seed assembly model and multivariate nonlinear regression method. The main conclusions are as follows:
(1)
The validity of the maize seed assembly model is verified based on the sowing process, and the seed surface inclination angle increases first and then decreases with the increase in the revolving speed of the seed metering wheel;
(2)
The optimized Zone E has a larger radial length, which facilitates the process of seed guiding and seed delivery during the sowing process, and the replay index and the coefficient of variation both meet the corresponding technical requirements, which shows that the seed spacing is relatively stable;
(3)
With the increase in the revolving speed of the seed metering wheel, the perturbation of maize seeds by seed spoons became obvious, and the pressure on the head of the seed spoon in Zone E is higher;
(4)
In terms of the seed metering device performance, the seed spoon radius and the SR·HA interaction have a significant influence, and the SR·HA interaction shows an antagonistic effect.

Author Contributions

Conceptualization, Z.C. and D.X.; methodology, Z.C. and W.G.; software, Z.L.; validation, Z.C., Z.L. and J.G.; formal analysis, Z.C.; investigation, Z.C.; writing—original draft preparation, Z.C. and D.X.; writing—review and editing, Z.C. and D.X.; supervision, J.G.; funding acquisition, Z.C. and D.X. All authors have read and agreed to the published version of the manuscript.

Funding

This research was financially supported by the National Natural Science Foundation of China, grant number 52305275, the Fundamental Research Program of Shanxi Province, grant number TZLH20230818004, the Talent Research Start-up Funding Project of Taiyuan University of Science and Technology, grant numbers 20232076 and 20232069, the Shanxi Provincial Higher Education Science and Technology Innovation Project, grant number 2023L183, the Open Project of the State Key Laboratory of Engine and Powertrain System, grant number skleps-sq-2023-015, and the Graduate Innovation Fund of Jilin University, grant number 451230411085.

Data Availability Statement

Data sharing not applicable.

Conflicts of Interest

The authors declare no conflict of interest.

References

  1. Cundall, P.A.; Strack, O.D. A discrete numerical model for granular assemblies. Geotechnique 1979, 29, 47–65. [Google Scholar] [CrossRef]
  2. Boac, J.M.; Ambrose, R.P.K.; Casada, M.E.; Maghirang, R.G.; Maier, D.E. Applications of discrete element method in modeling of grain postharvest operations. Food Eng. Rev. 2014, 6, 128–149. [Google Scholar] [CrossRef]
  3. Ketterhagen, W.R. Modeling the motion and orientation of various pharmaceutical tablet shapes in a film coating pan using DEM. Int. J. Pharm. 2011, 409, 137–149. [Google Scholar] [CrossRef]
  4. Anand, A.; Curtis, J.S.; Wassgren, C.R.; Hancock, B.C.; Ketterhagen, W.R. Predicting discharge dynamics from a rectangular hopper using the discrete element method (DEM). Chem. Eng. Sci. 2008, 63, 5821–5830. [Google Scholar] [CrossRef]
  5. Whittles, D.N.; Kingman, S.; Lowndes, I.S.; Griffiths, R. An investigation into the parameters affecting mass flow rate of ore material through a microwave continuous feed system. Adv. Powder Technol. 2005, 16, 585–609. [Google Scholar] [CrossRef]
  6. Fu, H.; Wang, C.R.; Jin, C.; Yu, J.Q. Development of digital design software platform AgriDEM for agricultural machinery parts. Trans. Chin. Soc. Agric. Eng. 2017, 33, 1–9. [Google Scholar]
  7. Yu, J.Q.; Fu, H.; Li, H.; Shen, Y.F. Application of discrete element method to research and design of working parts of agricultural machines. Trans. Chin. Soc. Agric. Eng. 2005, 21, 1–6. [Google Scholar]
  8. He, Y.M.; Wu, M.L.; Xiang, W.; Yan, B.; Wang, J.Y.; Bao, P.F. Application progress of discrete element method in agricultural engineering. Chin. Agric. Sci. Bull. 2017, 33, 133–137. [Google Scholar]
  9. Wang, X.; Zhang, S.; Pan, H.; Zheng, Z.; Huang, Y.; Zhu, R. Effect of soil particle size on soil-subsoiler interactions using the discrete element method simulations. Biosyst. Eng. 2019, 182, 138–150. [Google Scholar] [CrossRef]
  10. Li, X.; Du, Y.; Liu, L.; Zhang, Y.; Guo, D. Parameter calibration of corncob based on DEM. Adv. Powder Technol. 2022, 33, 103699. [Google Scholar] [CrossRef]
  11. Yasunaga, T.; Yoshida, M.; Shimosaka, A.; Shirakawa, Y.; Andoh, T.; Ichikawa, H.; Ogawa, N.; Yamamoto, H. Mathematical modeling of coating time in dry particulate coating using mild vibration field with bead media described by DEM simulation. Adv. Powder Technol. 2022, 33, 103779. [Google Scholar] [CrossRef]
  12. Chen, Z.; Xue, D.; Guan, W.; Liu, Z.; Guo, J.; Wang, G.; Wang, S. Research on the disturbance behaviour of the track chassis to the sand-gravel pavement during the steering process of the electric shovel based on DEM. Adv. Powder Technol. 2022, 33, 103731. [Google Scholar] [CrossRef]
  13. Chen, Z.; Wang, G.; Xue, D.; Cui, D. Simulation and optimization of crushing chamber of gyratory crusher based on the DEM and GA. Powder Technol. 2021, 384, 36–50. [Google Scholar] [CrossRef]
  14. Liu, Z.; Wang, G.; Guan, W.; Guo, J.; Sun, G.; Chen, Z. Research on performance of a laboratory-scale SAG mill based on DEM-EMBD. Powder Technol. 2022, 406, 117581. [Google Scholar] [CrossRef]
  15. Shi, L.; Zhao, W.; Yang, X. Effects of typical corn kernel shapes on the forming of repose angle by DEM simulation. Int. J. Agric. Biol. Eng. 2022, 15, 248–255. [Google Scholar] [CrossRef]
  16. Yan, D.; Yu, J.; Wang, Y.; Zhou, L.; Sun, K.; Tian, Y. A review of the application of discrete element method in agricultural engineering: A case study of soybean. Processes 2022, 10, 1305. [Google Scholar] [CrossRef]
  17. Zhou, L.; Yu, J.; Liang, L.; Yu, Y.; Yan, D.; Sun, K.; Wang, Y. Study on key issues in the modelling of maize seeds based on the multi-sphere method. Powder Technol. 2021, 394, 791–812. [Google Scholar] [CrossRef]
  18. Wang, S.; Yu, Z.; Zhang, W. Aorigele, Study on the modeling method of sunflower seed particles based on the discrete element method. Comput. Electron. Agric. 2022, 198, 107012. [Google Scholar] [CrossRef]
  19. Chen, Z.; Yu, J.; Xue, D.; Wang, Y.; Zhang, Q.; Ren, L. An approach to and validation of maize-seed-assembly modelling based on the discrete element method. Powder Technol. 2018, 328, 167–183. [Google Scholar] [CrossRef]
  20. Rocha-Villarreal, V.; Hoffmann, J.F.; Vanier, N.L.; Serna-Saldivar, S.O.; Garcia-Lara, S. Hydrothermal treatment of maize: Changes in physical, chemical, and functional properties. Food Chem. 2018, 263, 225–231. [Google Scholar] [CrossRef] [PubMed]
  21. James, A.; Zikankuba, V.L. Mycotoxins contamination in maize alarms food safety in sub-Sahara Africa. Food Control 2018, 90, 372–381. [Google Scholar] [CrossRef]
  22. Yang, G.; Wang, Q.; Liu, C.; Wang, X.B.; Fan, S.X.; Huang, W.Q. Rapid and visual detection of the main chemical compositions in maize seeds based on Raman hyperspectral imaging. Spectrochim. Acta A Mol. Biomol. Spectrosc. 2018, 200, 186–194. [Google Scholar] [CrossRef] [PubMed]
  23. Tenaillon, M.I.; Charcosset, A. A European perspective on maize history L’histoire du maïs cultivé vue sous un angle européen. C. R. Biol. 2011, 334, 221–228. [Google Scholar] [CrossRef] [PubMed]
  24. Shi, S. Design and Experimental Research of the Pneumatic Maize Precision Seedmetering Device with Combined Holes; China Agricultural University: Beijing, China, 2015. [Google Scholar]
  25. Zhang, C.L.; Chen, L.Q.; Wu, R. Simulation analysis of seeding performance of spoon-wheel seed metering device based on the discrete element method. J. AnHui Agric. Univ. 2016, 43, 848–852. [Google Scholar]
  26. Yang, M.F. Study on Digital Design Method of Corn Seed-Metering Device Based on DEM; Jilin University: Changchun, China, 2009. [Google Scholar]
  27. Zhang, Y.; Li, C.H.; Ji, Y.J.; Sun, Y.J. Simulation analysis of seeding process for corn seed metering device based on discrete element method. J. Shenyang Ligong Univ. 2015, 34, 1–4. [Google Scholar]
  28. Zhao, S.H.; Chen, J.Z.; Wang, J.Y.; Chen, J.Q.; Yang, C.; Yang, Y.Q. Design and experiment on V-groove dialing round type guiding-seed device. Trans. Chin. Soc. Agric. Mach. 2018, 49, 146–158. [Google Scholar]
  29. Sun, S.C. Simulation Analysis of Working Process of Air Suction Corn Precision Seed-Metering Device Based on DEM-CFD Coupling Method; Jilin University: Changchun, China, 2016. [Google Scholar]
  30. Wang, Y.X.; Liang, Z.J. Calibration method of contact characteristic parameters for corn seeds based on EDEM. Trans. Chin. Soc. Agric. Eng. 2016, 32, 36–42. [Google Scholar]
  31. Wang, J.W.; Tang, H.; Wang, Q.; Zhou, W.Q.; Yang, W.P.; Shen, H.G. Numerical simulation and experiment on seeding performance of pickup finger precision seed-metering device based on EDEM. Trans. Chin. Soc. Agric. Eng. 2015, 31, 43–50. [Google Scholar]
  32. Wang, J.; Tang, H.; Wang, J.; Li, X.; Huang, H. Optimization design and experiment on ripple surface type pickup finger of precision maize seed metering device. Int. J. Agric. Biol. Eng. 2017, 10, 61–71. [Google Scholar]
  33. Zhang, K.; Yi, S.J. Simulation and experimental optimization on filling seeds performance of seed metering device with roller of air-suction. Trans. Chin. Soc. Agric. Mach. 2018, 7, 78–86. [Google Scholar]
  34. Han, D.D.; Zhang, D.X.; Yang, L.; Li, K.H.; Zhang, T.L.; Wang, Y.X.; Cui, T. EDEM-CFD simulation and experiment of working performance of inside-filling air-blowing seed metering device in maize. Trans. Chin. Soc. Agric. Eng. 2017, 33, 23–31. [Google Scholar]
  35. Zhou, L.; Yu, J.Q.; Wang, Y.; Yan, D.X.; Yu, Y.J. A study on the modelling method of maize-seed particles based on the discrete element method. Powder Technol. 2020, 374, 353–376. [Google Scholar] [CrossRef]
  36. Kudo, Y.; Yasuda, M.; Matsusaka, S. Effect of particle size distribution on flowability of granulated lactose. Adv. Powder Technol. 2020, 31, 121–127. [Google Scholar] [CrossRef]
  37. Pasha, M.; Hare, C.; Ghadiri, M.; Gunadi, A.; Piccione, P.M. Effect of particle shape on flow in discrete element method simulation of a rotary batch seed coater. Powder Technol. 2016, 296, 29–36. [Google Scholar] [CrossRef]
  38. Wang, X.Y.; Wang, J.W.; Tang, H.; Jiang, D.X.; Li, C.; Gao, J.W. Improve design and experiment on spoon of spoon precision seed metering device. J. Northeast Agric. Univ. 2015, 46, 79–85. [Google Scholar]
  39. Zhao, S.H.; Zhou, Y.; Liu, H.J.; Tan, H.W.; Zhang, X.M.; Yang, Y.Q. Design of reseed shift speed system of scoop-type metering device of corn. Trans. Chin. Soc. Agric. Mach. 2016, 47, 38–44. [Google Scholar]
  40. Yang, L.; Yan, B.X.; Zhang, D.X.; Zhang, T.L.; Wang, Y.X.; Cui, T. Research progress on precision planting technology of maize. Trans. Chin. Soc. Agric. Mach. 2016, 47, 38–48. [Google Scholar]
  41. ASAE Standards 2002: Standards Engineering Practices 49; Compression Test of Food Materials of Convex Shape. American Society of Agricultural Engineers: St. Joseph, MI, USA, 2002; pp. 592–599.
  42. Horabik, J.; Molenda, M. Parameters and contact models for DEM simulations of agricultural granular materials: A review. Biosyst. Eng. 2016, 147, 206–225. [Google Scholar] [CrossRef]
  43. Liu, Y.F.; Lin, J.; Li, B.F.; Ma, T.; Song, J.P.; Tian, Y. Design and experiment of horizontal disc seed metering device for maize seeder. Trans. Chin. Soc. Agric. Eng. 2017, 33, 37–46. [Google Scholar]
  44. Tang, H.; Xu, C.; Guo, F.; Yao, Z.; Jiang, Y.; Guan, R.; Sun, X.; Wang, J. Analysis and experiment on the seed metering mechanism of multi-grain cluster air suction type rice (Oryza sativa L.) hill direct seed metering device. Agriculture 2022, 12, 1094. [Google Scholar] [CrossRef]
  45. Ji, Y.J.; Xue, H.D.; Li, C.H. Simulation analysis of seed metering procedure in scoop metering device based on discrete element method. Appl. Mech. Mater. 2012, 157–158, 550–557. [Google Scholar] [CrossRef]
  46. Kim, T.K. Understanding one-way ANOVA using conceptual figures. Korean J. Anesthesiol. 2017, 70, 22–26. [Google Scholar] [CrossRef] [PubMed]
Figure 1. Maize seed assembly model using different sub-spheres.
Processes 11 03076 g001
Figure 2. Spoon precision seed metering device: (a) structure diagram; (b) fundamental diagram; (c) partial enlargement at A; (d) simulation model diagram based on the DEM; 1. seed-filling shell, 2. seed spoon, 3. seed plate, 4. guiding wheel, 5. guiding shield, 6. seed export, 7. conveyor belt, I. filling zone, II. cleaning zone, III. handing zone, IV. guiding zone, V. dropping zone, α—handing angle, which is the angle between the upper boundary of the cleaning zone and the positive direction of the y-axis, R—seed spoon radius, which is the geometric radius of the contact site with the maize seed in the seed spoon, as shown in (c).
Processes 11 03076 g002
Figure 3. Seeding simulation process of the spoon precision seed metering device.
Processes 11 03076 g003
Figure 4. Experimental equipment: (a) PSJ test bench; (b) schematic diagram of the experimental system.
Processes 11 03076 g004
Figure 5. Maize seed particle behavior at different revolving speeds of the seed metering wheel.
Processes 11 03076 g005
Figure 6. Variation of seed surface inclination angle with the different revolving speeds of the seed metering wheel: (a) Jiping 1, (b) Ping’an 11.
Processes 11 03076 g006
Figure 7. Variation of qualification index with the different revolving speeds of the seed metering wheel: (a) Jiping 1, (b) Ping’an 11.
Processes 11 03076 g007
Figure 8. Variation of replay index with the different revolving speeds of the seed metering wheel: (a) Jiping 1, (b) Ping’an 11.
Processes 11 03076 g008
Figure 9. Response surface of qualification index: (a) Jiping 1, (b) Ping’an 11.
Processes 11 03076 g009
Figure 10. Optimized maize seed particle behavior for the optimized spoon precision seed metering device.
Processes 11 03076 g010
Table 1. Maize seed size distribution and percentage of quantity.
VarietySeed ShapePrimary Size Distribution (mm)Percentage of Quantity (%)
MeanStandard DeviationOriginalNormalization
Jiping 1horse tooth5.500.7986.1488.97
spherical cone5.100.815.816.00
spheroid7.810.894.875.03
Ping’an 11horse tooth5.250.8076.5780.77
spherical cone5.030.769.8010.21
spheroid7.820.868.439.02
Table 2. Physical and mechanical parameters used in the DEM simulations.
ParametersSymbolJiping 1Ping’an 11
MaizeOrganic
Glass
Aluminum AlloyRubberMaizeOrganic
Glass
Aluminum AlloyRubber
Density (kg/m3)ρ12761800270091001306180027009100
Poisson’s ratiov0.40.350.340.450.40.350.340.45
Shear modulus (Pa)G1.37 × 1081.30 × 1092.5 × 10101 × 1061.37 × 1081.30 × 1092.5 × 10101 × 106
Restitution coefficiente0.78260.69830.7740.00010.65260.73730.8180.0001
Static friction coefficientμ0.120.3330.30710.120.33680.2841
Rolling friction coefficientμr0.020.060.05120.020.060.0512
Table 3. Volume parameters used in the DEM simulations.
ParametersJiping 1Ping’an 11
Horse ToothSpherical ConeSpheroidHorse ToothSpherical ConeSpheroid
Mean of volumes (V, mm3)339.21346.93351.59328.46348.99353.19
Standard deviation of volumes (σ, mm3)0.130.170.200.160.150.17
Table 4. The level value of all experimental factors.
LevelExperimental Factors
Seed Spoon Radius (z1, mm)Handing Angle (z2, deg)Revolving Speed of Seed Metering Wheel (z3, r/min)
−174025.0
095026.5
1116028.0
Table 5. Simulation results of qualification index for Jiping 1 and Ping’an 11.
No.Experimental FactorQualification Index
x0x1(z1)x2(z2)x3(z3)x1·x2x1·x3x2·x3y1iy2i
111111110.200.19
2111−11−1−10.270.31
311−11−11−10.600.62
411−1−1−1−110.750.78
51−111−1−110.820.80
61−11−1−11−10.970.95
71−1−111−1−10.950.99
81−1−1−11110.880.86
910000000.450.51
1010000000.500.57
1110000000.400.45
Analysis of variance
Dj 11888888S = 0.7468
f = 10
S = 0.6819
f = 10
BjJiping 16.79−1.8−0.92−0.30−0.84−0.14−0.14Se-Jiping 1 = 0.0050
fe = 2
Se-Ping’an 11 = 0.0072
fe = 2
Ping’an 117.03−1.7−10.3−0.80.26−0.24
bjJiping 10.62−0.23−0.12−0.04−0.11−0.02−0.02 S h u i Jiping   1 = j = 1 6 S j = 0.6152 S h u i Ping an   11 = j = 1 6 S j = 0.5932
Ping’an 110.64−0.21−0.13−0.04−0.10−0.03−0.03
SjJiping 14.200.410.110.010.090.0020.002fhui = 6fhui = 6
Ping’an 114.4930.3610.1250.0110.080.0080.007
FjJiping 1167716242.324.5035.280.980.98 S i f Jiping   1 = S S h u i Jiping   1     S e = 0.1267 S i f Ping an   11 = S S h u i Ping an   11     S e = 0.0815
Ping’an 111248100.334.723.12522.222.3472
αjJiping 1 0.010.050.250.05>0.25>0.25 f i f = f f h u i f e = 3 f i f = f f h u i f e = 3
Ping’an 11 0.010.050.250.05>0.250.25
Table 6. Experimental verification results of optimization.
VarietiesQualification Index (%)Relative Error (%)Replay Index (%)Coefficient of Variation (%)
Experiment ResultsPredicted Results
Jiping 191.5590.001.697.8614.46
92.4090.002.607.5013.35
89.4590.000.618.3419.02
Ping’an 1188.0592.304.609.8520.59
93.5392.301.337.2313.63
90.5692.301.898.4615.21
Disclaimer/Publisher’s Note: The statements, opinions and data contained in all publications are solely those of the individual author(s) and contributor(s) and not of MDPI and/or the editor(s). MDPI and/or the editor(s) disclaim responsibility for any injury to people or property resulting from any ideas, methods, instructions or products referred to in the content.

