Article

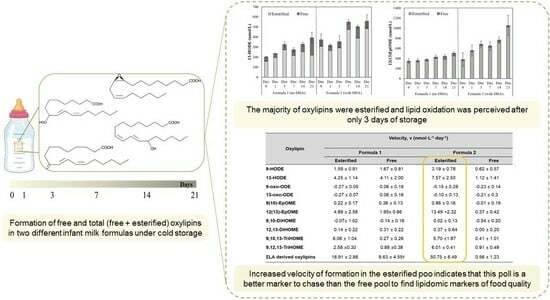
Storage Duration and Added Docosahexaenoic Acid Modify the Rates of Esterified and Free Oxylipin Formation in Infant Milk Formula

by
Fernanda Furlan Gonçalves Dias
1,
Bianca Ferraz Teixeira
1,2,
Thais Maria Ferreira de Souza Vieira
2,
Juliana Maria Leite Nobrega de Moura Bell
1,3 and
Ameer Y. Taha
1,*
1
Department of Food Science and Technology, University of California, One Shields Avenue, Davis, CA 95616, USA
2
ESALQ Food, College of Agriculture “Luiz de Queiroz”, University of São Paulo, 11 Pádua Dias Avenue, Piracicaba 13418-900, SP, Brazil
3
Department of Biological and Agricultural Engineering, University of California, One Shields Avenue, Davis, CA 95616, USA
*
Author to whom correspondence should be addressed.
Processes 2023, 11(10), 3045; https://doi.org/10.3390/pr11103045
Submission received: 15 August 2023 / Revised: 28 September 2023 / Accepted: 6 October 2023 / Published: 23 October 2023
(This article belongs to the Special Issue Advances in Lipid Chemistry: Extraction, Process and Analysis)

Abstract

:
Infant milk formulas often contain docosahexaenoic acid (DHA), a highly unsaturated fatty acid that is prone to oxidation. Previously, we reported in oil that the esterified lipid pool is more prone to lipid oxidation than the free pool. However, it is unknown whether added DHA modifies lipid oxidation in infant formula. In the present study, we quantified lipid oxidation rates in infant milk formula containing canola oil (F1) or canola oil supplemented with DHA-ethyl ester (F2). Lipid oxidation kinetics were determined by quantifying esterified and free oxylipins using liquid chromatography-tandem mass spectrometry (LC-MS/MS) during storage for 21 days at 4 °C. Esterified oxylipins increased in concentration within 3 and 7 days of storage in F2 (with DHA) and F1, respectively. Free oxylipins appeared 7 and 14 days later in F2 and F1, respectively. The kinetic estimates revealed that esterified oxylipins formed at a faster rate in both formulas compared to free oxylipins. Surprisingly, in F2 (which contains DHA), the rates of formation of both esterified and free linoleic acid and alpha-linolenic acid-derived oxylipins were higher than in F1. This study demonstrated that in food systems, DHA promotes the oxidation of other PUFAs, and that triacylglycerol/esterified lipids are preferentially oxidized over free fatty acids, highlighting the role of triacylglycerols in lipid oxidation.

Graphical Abstract

1. Introduction

Infant milk formulas are currently used as an alternative to human milk [1,2]. Therefore, they represent the sole source of nutrition for a considerable number of infants during their initial months of life. [2]. Infant formulas available in the United States exhibit slight variations in nutrient composition; nevertheless, they are required to adhere to the Infant Formula Act which is projected through the FDA’s specified minimum and maximum nutrient composition guidelines for essential components such as protein (1.4–2.2%), carbohydrates (6–10%), fats (3–4%), vitamins, and minerals [2,3,4]. These mandatory standards are meant to ensure that infant formulas provide essential nutrients in quantities that align with the nutritional needs of growing infants [2,5].
The lipid base in infant formulas is typically derived from bovine milk, vegetable oils, or fish oils. Thus, lipids in infant formula can be rich in polyunsaturated fatty acids (PUFAs) and often contain long-chain polyunsaturated fatty acids (LC-PUFAs) such as omega-3 docosahexaenoic acid (DHA, 22:6n–3) [1,3,6], which may make infant milk formulas highly susceptible to lipid oxidation. PUFAs can undergo free radical or singlet oxygen auto-oxidation to generate hydroperoxides, which can transform to more stable compounds such as hydroxy, ketone, or epoxy PUFAs, known as oxylipins or primary oxidation products [7]. Oxylipins can auto-degrade into secondary volatile compounds, which can result in off-flavor and reduced product shelf life [8,9].
There are two proposed mechanisms by which lipid oxidation is thought to occur in food. The first involves the hydrolytic release of fatty acids from phospholipids or triglycerides, resulting in free fatty acids (FFAs), which can oxidize to form oxylipins. The second involves the direct oxidation of triglycerides. Recently, we reported that triglycerides are indeed the primary substrates for lipid oxidation in thermally treated oil [10]. Although the hydrolytic release of FFAs was rapid, FFAs oxidized up to 265 times slower compared to triglycerides (i.e., esterified lipids) [10]. Studies in our lab have also shown that the majority (>95%) of oxylipins in oil, bovine milk, and human breast milk are esterified within triglycerides or phospholipids, further confirming that lipid oxidation primarily occurs in esterified lipid pools [10,11,12].
Our prior studies involved measuring free and esterified oxylipins in intact food matrices or thermally treated oil. However, two unknowns remain unsettled. First, the effects of storage on the rates of free and esterified oxylipin formation have not been determined. This is a critical knowledge gap to address, because if the hypothesis that esterified lipids are the primary substrates for lipid oxidation is true, then it is expected that esterified oxylipins preferentially form over free oxylipins under storage conditions that do not involve accelerated oxidation (i.e., via thermal treatment). Second, it has always been assumed that longer-chain fatty acids such as omega-3 docosahexaenoic acid (DHA) are more susceptible to oxidation than shorter-chain fatty acids such as alpha-linolenic acid (ALA) [13]. However, this assumption has yet to be validated by the use of modern mass-spectrometry techniques that quantify oxylipins derived from ALA and DHA.
In the present study, we evaluated the kinetics of free and esterified oxylipin formation in infant milk formula containing canola oil, with and without DHA, as the lipid base. Because of the high perishability of liquid milk formula, the samples were stored under refrigeration for 21 days and collected on Days 0 (baseline), 1, 3, 7, 14, and 21. We hypothesized that storage would lead to a faster oxidation of esterified lipids than FFAs and that the DHA-containing milk formula would oxidize faster [14]. Recently, we reported the progression of only free oxylipin generation in infant milk samples [15]. In the present study, we measured esterified oxylipins and applied kinetic modeling on both the free and esterified oxylipin pools to determine the preferred substrate for lipid oxidation, as well as the impact of lipid composition on free and esterified oxylipin kinetics.

2. Materials and Methods

2.1. Infant Milk Formula Samples

Infant formulas were prepared using instant nonfat dry milk, canola oil, lecithin, maltodextrin, and docosahexaenoic acid ethyl ester (DHA-EE) as the formulation ingredients (Supplementary Table S1 contains the full list of ingredients and materials used in this paper). One formula was prepared using only canola oil (Formula (1)—no DHA), and the other contained both canola oil and DHA-EE (Formula (2)—with DHA) as the primary sources of lipids [15]. Formulas were prepared in accordance with the requirements for infant formula macronutrient composition [5] by mixing maltodextrin (8% weight), milk protein concentrate (1.3% weight), lipids (4% weight), lecithin (0.01% weight), and water (89.69% weight), as described in Table 1. The 4% lipid base contained 100% canola oil in Formula (1), whereas Formula (2) had 99.7% canola oil and 0.3% DHA-EE. The concentration of DHA in infant formula was based on the average content of DHA found in human milk, which is typically around 0.3% of total lipids [1]. The selection and use of the DHA-EE form was due to its higher shelf life and stability in comparison with the FFA form [16].
The mixture was homogenized in a Polytron (Kinematica, Bohemia, NY, USA) for 5 min at 20,000 rpm. A total of 2 L was prepared, separated in 500 mL, and stored at 4 °C for 21 days. Each formula was aliquoted at 0 (baseline), 1, 3, 7, 14, and 21 days (n = 3 per formula per time point). Aliquots (1 mL) were stored at −80 °C in 2 mL centrifuge tubes until further analysis.

2.2. Oxylipins Quantification

2.2.1. Folch Extraction

A total of 200 µL of each milk formula was mixed with 3.0 mL of 2:1 (v/v) chloroform/methanol containing 0.002% (w/v) BHT. Then, 560 µL of 0.9% (w/v) NaCl solution containing 1 mM Na2-EDTA, and 190 µL of water were added to the samples to achieve chloroform/methanol/water ratio of 8:4:3. Samples were centrifuged at 740× g for 10 min at 0 °C. The organic phase was collected in another tube, and chloroform (2 mL) was added to the aqueous phase, which was then centrifuged. The two organic phases were combined and dried under nitrogen. The samples were reconstituted in 200 µL of chloroform/methanol mixture (2:1 v/v).

2.2.2. Sample Preparation and Hydrolysis

Aliquots equivalent to 2 mg of total lipids of the extract were placed in a 2 mL centrifuge tube and dried under nitrogen as described by Teixeira et al. [15]. Samples were resuspended in 200 µL of ice-cold methanol containing 0.1% acetic acid and 0.1% BHT, proceeded by the addition of 10 µL of an antioxidant solution containing 0.2 mg/mL BHT, EDTA, and TPP in water/methanol mixture (1:1 v/v). The samples were spiked with 10 µL of surrogate standard mix solution containing 2 µM of d11-11(12)-EpETrE, d11-14,15- DiHETrE, d4-6-keto-PGF1a, d4-9-HODE, d4-LTB4, d4-PGE2, d4-TXB2, d6- 20-HETE, and d8-5-HETE in methanol. For the hydrolysis, 200 µL of a 0.25 M sodium hydroxide solution was added to the mixture, which was then placed in a heating block at 60 °C for 30 min. After 5 min of cooling time, 25 µL acetic acid and 1575 µL MilliQ water were added.
Solid-phase extraction (SPE) was performed to separate the hydrolyzed oxylipins using an SPE cartridge (Waters Oasis HLB, Waters Corporation, Milford, CA, USA). The SPE column clean-up was performed with ethyl acetate (2 mL) followed by 2 washes of 2 mL of methanol. SPE preconditioning was performed with 2 × 2 mL washes of aqueous solution containing 0.1% acetic acid and 5% methanol. The hydrolyzed infant milk formula sample extracts were poured onto the columns, washed with 4 mL of aqueous solution containing 0.1% acetic acid and 5% methanol, and dried under vacuum for 20 min. Oxylipin extracts were eluted from the column with 0.5 mL methanol and 1.5 mL ethyl acetate, dried under nitrogen, and reconstituted in 100 µL LC-MS-grade methanol. The extracts were then filtered using centrifugal filters (Ultrafree-MC VV 0.1 µm; Millipore Sigma, Burlington, MA, USA) at 18,894× g for 5 min at 0 °C. The filtered samples were transferred to 2 mL amber vials and stored at −80 °C until LC-MS/MS analysis.

2.2.3. Liquid Chromatography–Mass Spectrometry (LC-MS/MS) Analysis

Oxylipins derived from linoleic acid (LA), dihomo gamma linolenic acid (DGLA), arachidonic acid (AA), ALA, eicosapentaenoic acid (EPA), and DHA were measured using a 1290 Infinity ultra-high-pressure liquid chromatography (UHPLC) system coupled with a 6460 QqQ MS/MS with electrospray ionization (ESI) via Jet Stream Technology (Agilent Technologies, Santa Clara, CA, USA). The separation of oxylipins was achieved using a ZORBAX Eclipse Plus C18 column (inner diameter: 2.1 mm; length: 150 mm; particle size: 1.8 µm; Agilent Technologies, Santa Clara, CA, USA).
The mobile phases consisted of the following: mobile phase A: 0.1% acetic acid in ultrapure water; mobile phase B: acetonitrile/methanol (80:15, v/v) with 0.1% acetic acid. The gradient program proceeded as follows: Mobile phase B was initially held at 35%, increased to 40% at 3 min, 48% at 4 min, 60% at 10 min, 70% at 20 min, and 85% at 24 min. At 24.6 min, it reached 100% and was then reduced to 35% at 26.1 min. The flow rate was maintained at 0.3 mL/min from 0 to 3 min, reduced to 0.25 mL/min between 3 and 24.5 min, increased to 0.35 mL/min from 24.6 to 27.5 min, and then reduced to 0.3 mL/min at 27.6 min. The total run time was 28 min. The injection volume was 10 µL per sample.
The analysis of oxylipins was conducted in negative ESI mode, with the drying gas temperature set at 300 °C at a flow rate of 10 L/min, the sheath gas temperature at 350 °C with a flow rate of 11 L/min, and a nebulizer pressure of 35 psi. For details on precursor ions, product ions, fragmentor voltage, collision energy, and retention times, please refer to Supplementary Table S2.
Surrogate recovery (%) was determined for each deuterated standard as follows (Equation (1)):
Recovery   ( % ) = A s a m p l e s A s t a n d a r d   m i x × 100
where A s a m p l e s is the average peak area of the deuterated standard in the sample and A s t a n d a r d   m i x is the average peak area of the deuterated standard in the oxylipin standard mix.
The matrix effect (ion suppression or enhancement) was determined using the post-extraction addition protocol by comparing the response of the analytes of interest in a standard solution to that of a sample spiked with the analyte at the same concentration [17,18]. The equation is described as follows:
Matrix   effect   ( % ) = A s a m p l e + s t a n d a r d   m i x   A s t a n d a r d   m i x + A s a m p l e   × 100  
where A s a m p l e + s t a n d a r d   m i x   is the peak area of the mixture of 50 μL of sample spiked with 10 μL of standard mix after extraction, A s t a n d a r d   m i x + A s a m p l e is the peak area of the mixture of 10 μL of standard mix plus 50 μL of methanol, and A s a m p l e   is the peak area of the mixture of 50 μL of sample plus 10 μL of methanol. In this context, a matrix effect value below 100% indicates ion suppression and a value greater than 100% indicates ion enhancement.

2.3. Kinetics Calculations

The concentration of esterified oxylipins was calculated as the difference between total oxylipins (determined as described in Section 2.2) and free oxylipins determined as described by Teixeira et al. [15]. Briefly, free oxylipins were extracted from the same infant milk formula samples using methanol. The sample clean-up was performed as described in Section 2.2.2, and the samples were analyzed by LC-MS/MS as described in Section 2.2.3.
The concentration and percentage of esterified oxylipins were calculated as indicated below (Equations (3) and (4)):
C e s t e r i f i e d   o x y l i p i n s = C t o t a l   o x y l i p i n s   C f r e e   o x y l i p i n s
E s t e r i f i e d   o x y l i p i n s   ( % ) = C e s t e r i f i e d   o x y l i p i n s C t o t a l   o x y l i p i n s   × 100
where C is the concentration of esterified, total, or free oxylipins expressed in nmol L−1.
Oxylipin concentrations in each of the three pools (total, free, and esterified) were fit to a linear model (best fit), and the velocity (v) or reaction rate over time was calculated as follows (Equation (5)):
v = d C d t = s l o p e
where v is the velocity (rate) of oxylipin formation in nmol·L−1·day−1, C is the oxylipin concentration in nmol L−1, and t is the storage time in days (from 0 to 21 days). Because the best-fit model was linear, the slope here represents the velocity of a zero-order reaction.

2.4. Statistical Analysis

All data were expressed as mean ± standard deviation (SD) and were analyzed using GraphPad Prism 8 (GraphPad Software, Inc., La Jolla, CA, USA). Three samples were analyzed per formula per time point (there were six different time points per sample—0, 1, 3, 7, 14, and 21 days). Data were analyzed using a two-way repeated-measures analysis of variance (ANOVA), where time is the repeated measure, and Formula ((1) vs. (2)) represents the treatment. Dunnett’s post hoc test (p < 0.05) was used to compare the different time points with baseline (Day 0). Differences between Formulas (1) and (2) for each storage day were determined using an unpaired t-test (p < 0.05). Kinetic differences between the two treatments and between free and esterified oxylipin velocities were analyzed by unpaired t-test (p < 0.05).

3. Results and Discussion

3.1. Oxylipin Profile in Infant Milk Formula: Matrix Effect and Recovery

Ion suppression or enhancement due to matrix effects may impact the accuracy of quantitative analysis for trace-level compounds and can therefore compromise the reproducibility of the method [19]. As shown in Table 2, matrix effects in the Formula (1) samples ranged from 87.5 to 103.6%, and matrix effects for the Formula (2) samples ranged from 86.3 to 102.0% (Table 2). Thus, matrix effects were minimal and within the acceptable range of 80–120% (a value of 100% means no matrix effects) [20]. The recovery (%) values in Formula (1) ranged from 76 to 93%, and for Formula (2), recovery values ranged from 74 to 89% (Table 3), which was also acceptable. The recovery values were not significantly different for all the compounds in both formulas within the storage days (i.e., no statistical difference between the control (Day 0) and the other storage days). Furthermore, no statistical differences were observed in the recovery values between Formulas (1) and (2) within each storage day. The relative standard deviation (RSD, %) of the recovery studies ranged from 0.5 to 18% (Supplementary Table S3), which is also within acceptable ranges [18].
Overall, these findings indicate that the effects of storage on oxylipin concentrations described below are real, and not due to confounding matrix effects or differences in the percent of recovery.

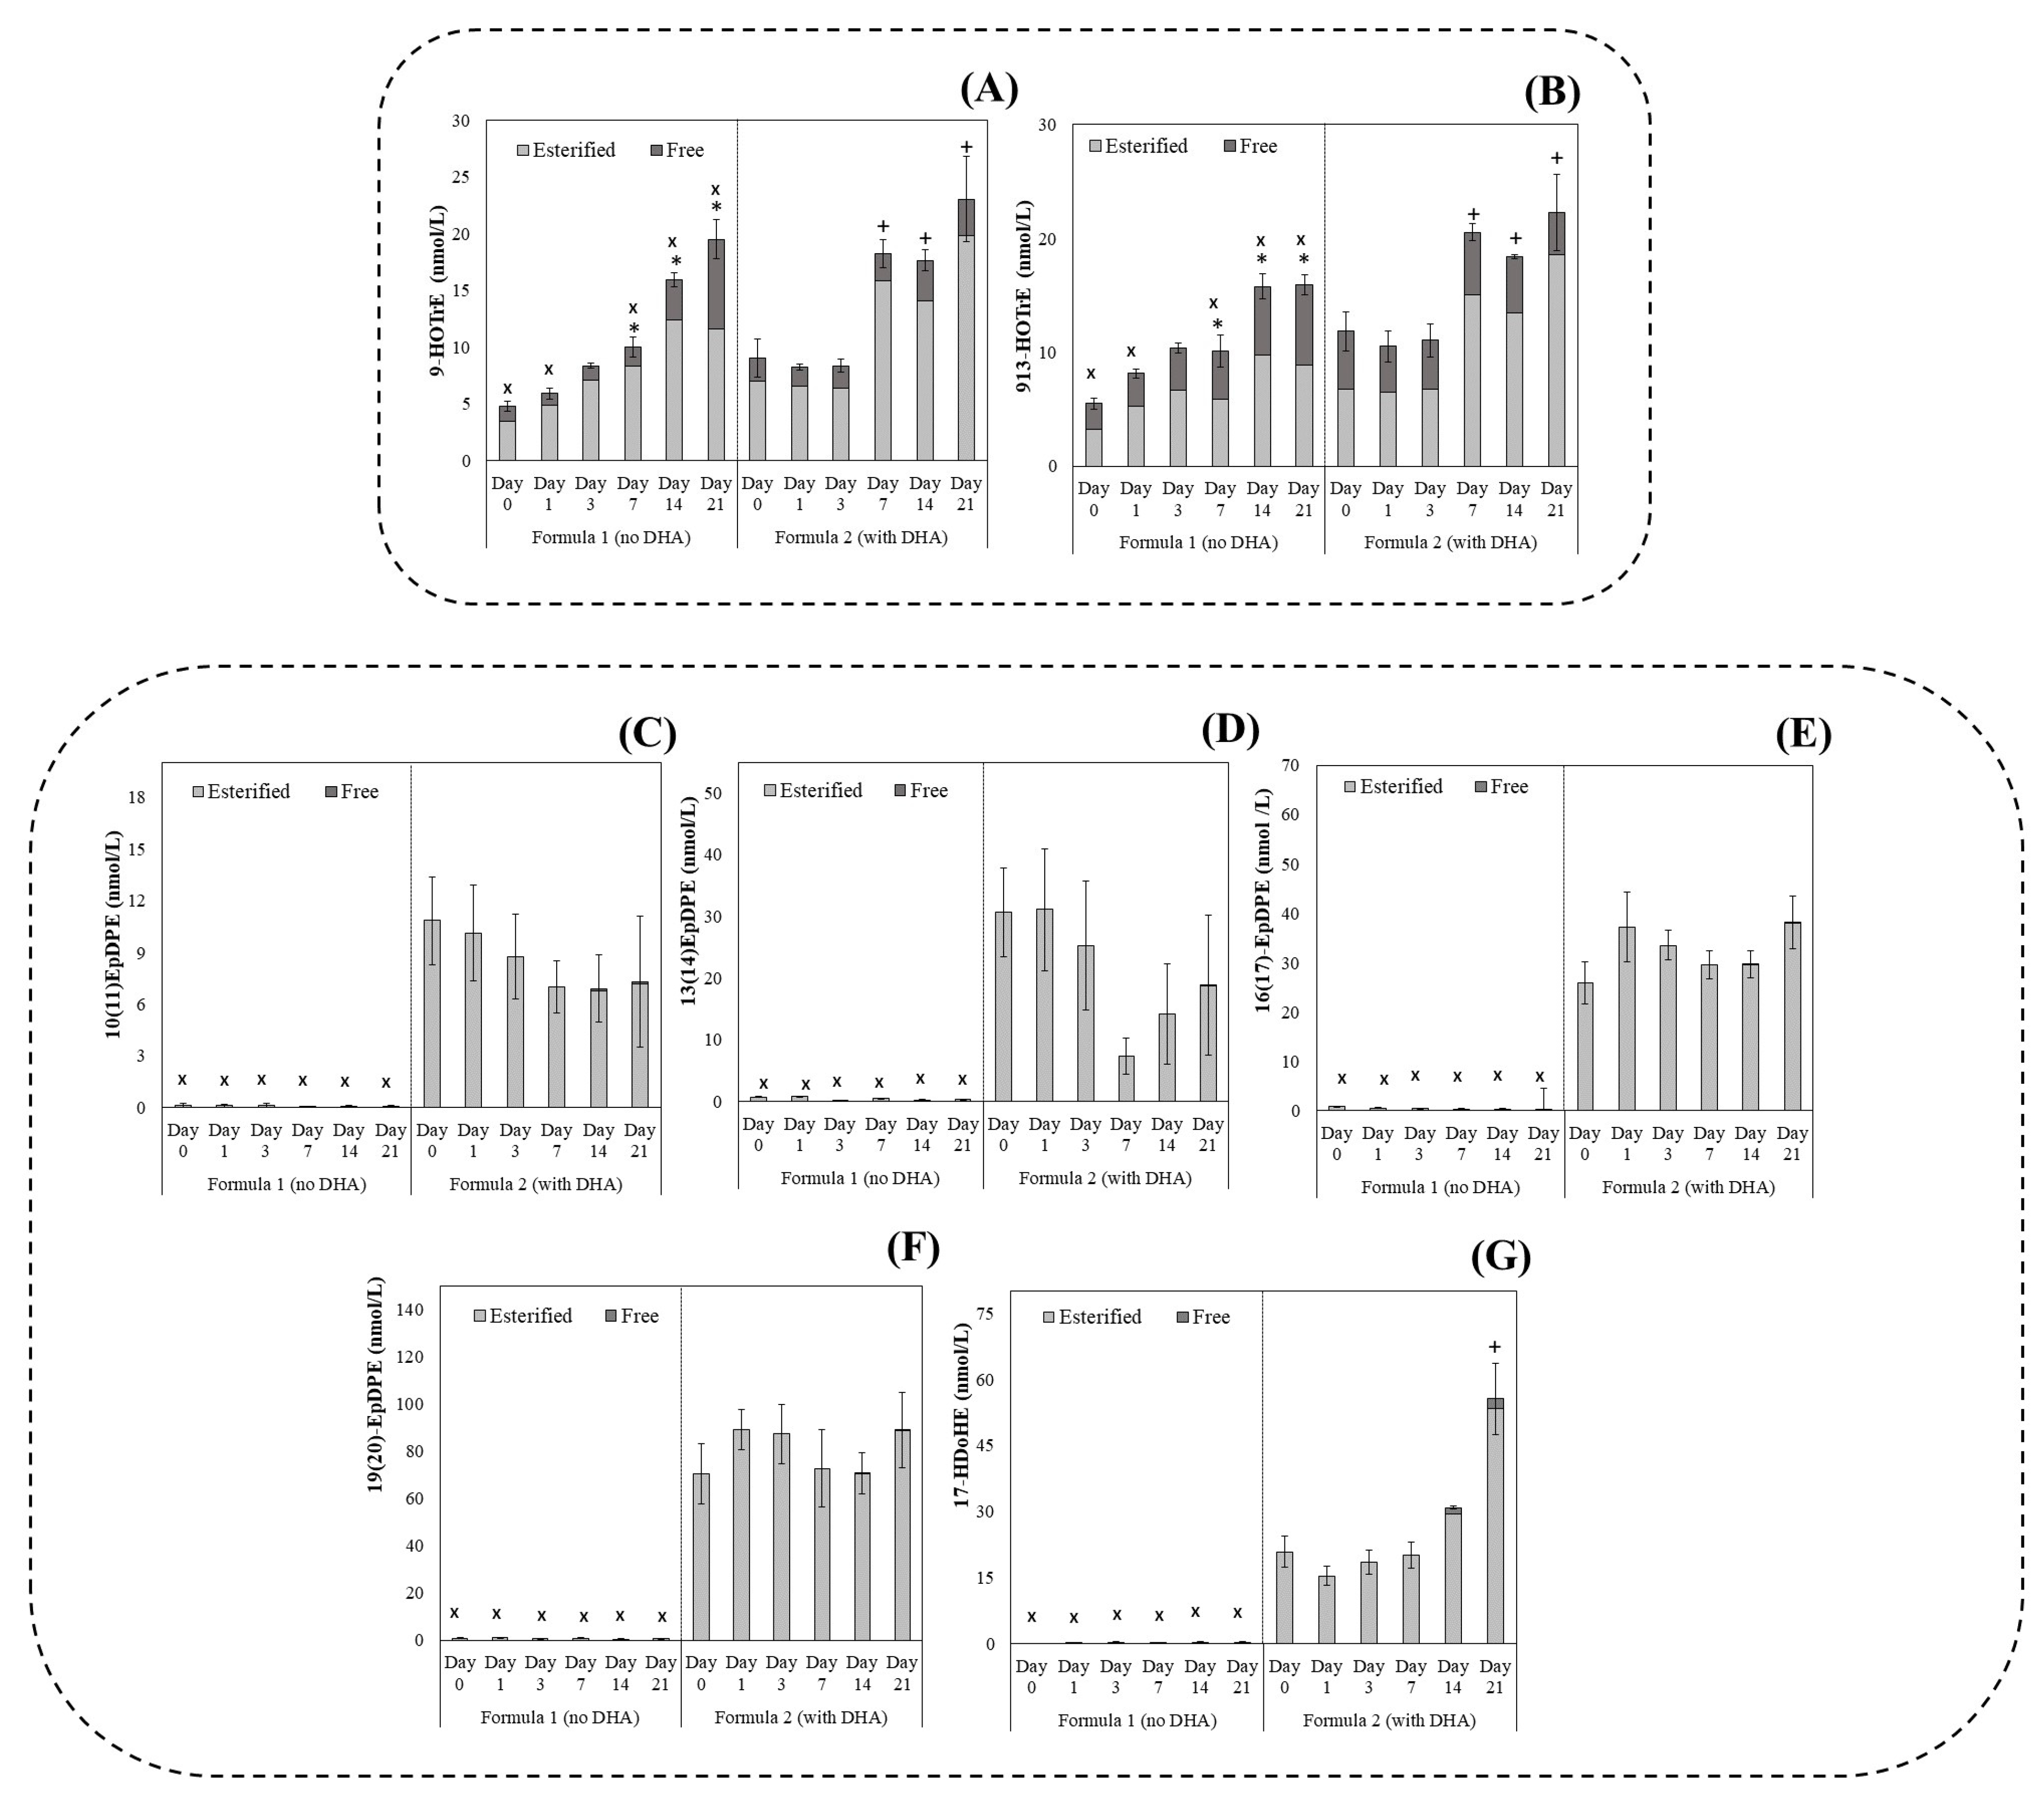
3.2. Oxylipin Profile in Infant Milk Formula: Effect of Lipid Composition and Storage Time under Refrigerated Conditions

At baseline (Day 0), the majority of oxylipins (>90% and >92% for Formulas (1) and (2), respectively) in the infant formula were esterified (Figure 1A). Thus, quantitatively, oxylipin concentrations in the esterified pool were significantly higher than free oxylipins derived from LA (Supplementary Tables S4–S13), ALA (Supplementary Tables S14 and S15), and DHA (Supplementary Tables S16–S20). Similar results were previously reported for bovine milk and soybean oil, where the majority of oxylipins (>95% in bovine milk and >99.7% in soybean oil) were present in the esterified form [10,12].
Moreover, the majority of oxylipins in the total pool were derived from LA, representing more than 95% of the oxylipins in both formulas (Figure 1B,C). This is in agreement with the findings of Teixeira et al. [12], who reported that LA-derived oxylipins are the main species present in the esterified and free pools in raw bovine milk. Other studies reported similar findings in high-LA plant oils [10].
Figure 2A–J show LA-derived free and esterified oxylipins over time, and Figure 3 shows ALA- (A,B) and DHA-derived (C–G) oxylipin concentrations over time. Both figures contain the free oxylipin data replotted from our published paper (Teixeira et al. [15]) to enable formula-specific comparisons between free and esterified oxylipin formation over time. As previously reported, and currently depicted in the dark grey bars of Figure 2 and Figure 3, 2(13)-epoxyoctadeenoic acid (12(13)-EpOME), 13-hydroxyo-ctadecadienoic acid (13-HODE), 9-hydroxyoctadecadienoic acid (9-HODE), hydroxyoctadecatrienoic acid (9-HoTrE), and -hydroxyoctadecatrienoic acid (13-HoTrE) free oxylipins increased in Formula (1) after 14 days of storage, whereas the 9-oxo-octadecadienoic acid (9-oxo-ODE)- and DHA-derived oxylipins (7-hydroxydocosahexaenoic acid (7-HDoHE), 19(20)-epoxydocosapentanoic acid (19(20)-EpDPE), 16(17)-EpDPE, and 10(11)-EpDPE) increased in Formula (2) after 7 and 14 days, respectively. The changes were detected in as early as 14 days in Formula (1) and 7 days in Formula (2).
PUFA-derived esterified oxylipins also increased with storage time for both formulas (Figure 2 and Figure 3); however, in Formula (2) (with DHA), the increase in LA, ALA, and DHA-derived oxylipins over time was more significant than in Formula (1) (no DHA). In Formula (2), a significant increase in the esterified oxylipin content was observed after only 3 days of storage for the LA-derived 12(13)-EpOME (from 358.2 on Day 0 to 657.4 nmol/L on Day 3 and to 1024.8 nmol/L on Day 21), while no significant differences were observed in Formula (1) (Figure 2F) relative to baseline. Esterified LA-derived 9- and 13-HODE were significantly higher after 7 days of storage for Formula (2), and after 14 and 21 days for Formula (1), respectively (Figure 2A,B). In both formulas, esterified 9,10-EpOME increased significantly after 14 days of storage (Figure 2E).
Esterified ALA-derived 9-HOTrE increased in both formulas on Day 7 compared to baseline (Figure 2A). ALA-derived 13-HOTrE significantly increased after 14 days in Formula (1), and after 7 days only in Formula (2) (Figure 2B). DHA-derived oxylipins were mainly detected in Formula (2), as expected, where an increase in esterified oxylipin concentration was observed after 21 days of storage for 17-HDoHE (Figure 2G). Other DHA-derived esterified oxylipins (DHA-epoxides) did not significantly change compared to baseline in Formula (2). DHA metabolites were barely seen in Formula (1), and when detected, they did not change significantly compared to baseline (Figure 3C–G).
Overall, Formula (2), which contained DHA, exhibited an earlier rise in esterified oxylipin formation (within 3 days) compared to Formula (1), which did not contain DHA (within 7 days). The increase in esterified oxylipins within Formula (2) was seen in non-DHA metabolites, specifically LA- and ALA-derived oxylipins. This means that the addition of DHA promoted lipid oxidation, captured here through the generation of primary esterified oxidation products. Similar results were seen in the free oxylipin pool (Figure 2 and Figure 3), as reported by Teixeira et al. [15], except that free oxylipins were detected after 7 days for only one compound and after 14 days for the majority of the oxylipins studied in Formula (2) (with DHA). Therefore, the results presented herein suggest that esterified oxylipins changed earlier than free oxylipins, which is consistent with our prior study showing that they form early in the oxidation process relative to free oxylipins [10].

3.3. Kinetics of LA-, ALA-, and DHA-Derived Oxylipin Formation in Infant Milk Formula under 21 Days of Cold Storage

Table 4 presents the velocities of total, esterified, and free oxylipin formation derived from the linear plot of oxylipin concentration (nmol/L) vs. time (days) plots. A positive slope (rate) means more product is formed over time, whereas a negative slope means more product is degraded over time. All of the plots for free, esterified, and total LA-, ALA-, and DHA- derived oxylipins can be found in the Supplementary Figures S1–S10A–F, S11 and S12A–F, and S13–S17A–F, respectively. Since the rate of total oxylipin formation was similar in value to the rate of esterified oxylipins (because over 90% of oxylipins were present in the esterified form in both formulas; Figure 1A), an unpaired t-test was used to compare free and esterified oxylipin formation rates within each formula. Possible differences between the free and esterified velocities in Formula (1) compared to Formula (2) were also evaluated using a t-test at p < 0.05.
The rate of formation was significantly higher for esterified than free oxylipins in both formulas, although greater changes reflecting more rapid oxidation were observed in Formula (2) compared to Formula (1). In Formula (1), the rates of esterified LA-derived 9,10,13-TriHOME and 9,12,13-TriHOME formation were significantly greater by 21.4-fold and 1.9-fold, respectively, than their respective free forms (p < 0.05). In Formula (2), the rates of esterified 9-HODE, 13-HODE, 9(10)-EpOME, 12(13)-EpOME, 9,10,13-TriHOME, 9,12,13-TriHOME, 9-HOTrE, and 13-HOTrE were significantly higher than their free forms by 4.1-, 6.45-, 87-, 35.5-, 12.9-, 5.6-, 8.7-, and 45-fold, respectively. Thus, more oxylipins were oxidized at a greater rate in Formula (2) compared to Formula (1). DHA-derived esterified 17-HDoHE, which was only detected in Formula (2), also showed a significantly higher rate (10.2-fold higher) of formation than the free form. Moreover, the rate of the sum of LA-derived esterified oxylipins was significantly higher (1.2 and 89.6-fold higher for Formulas (1) and (2), respectively) than the sum of free LA-derived oxylipins (p < 0.05), indicating that the esterified pool is the preferred substrate for LA-derived oxylipin formation in the two infant formulas. The rate of formation of the sum of ALA-derived oxylipins was 14.4-fold higher than in the free pool for Formula (2). Similar results were also reported by Shen et al. [10], where the velocities of the esterified LA-derived oxylipins were significantly higher than free oxylipins in thermally treated soybean oil.
Quantitatively, the rates of esterified oxylipin formation for LA-derived 9-HODE, 13-HODE, 9(10)-EpOME12(13)-EpOME, 9,10,13-TriHOME, and 9,12,13-TriHOME in Formula (2) were significantly higher than in Formula (1), highlighting the impact of formula composition in the velocities of oxylipin formation.
The addition of DHA to infant formula seems to promote lipid oxidation, specifically by oxidizing the esterified oxylipin pool at a greater rate than the free pool. Enhanced lipid oxidation via the presence of PUFA was also reported by Liang et al. [21]. The authors evaluated the lipid oxidation profile via the thiobarbituric acid reactive substances (TBARS) of n-3 PUFA-enriched eggs under cold storage (24 days at 4 °C). The authors reported that the PUFA-enriched eggs showed high lipid oxidation after 18 days of cold storage in comparison with normal eggs.
Overall, the rates of oxylipin formation were higher in the esterified pool, independent of the formula studied. Moreover, the esterified pool oxidized faster than the free pool, and the addition of 1% DHA in Formula (2) significantly enhanced lipid oxidation. Collectively, these data suggest that esterified fatty acids are preferentially oxidized over free fatty acids during storage. It is important to highlight that the kinetic model used herein is limited by the products monitored (only primary oxidation products); therefore, losses in free or bound oxylipins due to the formation of secondary volatile oxidation products may underestimate our current rates. Nevertheless, this limitation does not alter our conclusion that esterified oxylipins are the first species to form during lipid oxidation. Future studies are warranted to monitor the turnover of secondary volatile compounds within specific lipid pools.

4. Conclusions

This study provides evidence that oxidation during refrigerated storage preferentially targets esterified lipids, and that the lipid composition of infant formula highly influences esterified oxylipin formation. The esterified oxylipin pool appears to be a more sensitive marker of early lipid oxidation (within 3 days) in food systems compared to free oxylipins. The rate of oxylipin formation was notably higher for the esterified pool than for the free pool in both formulas. However, Formula (2) exhibited more substantial changes in esterified oxylipins, which is indicative of faster oxidation, compared to Formula (1). Therefore, adding DHA to infant milk formula accelerated lipid oxidation. The rates and mechanisms of oxidation elucidated by this kinetic study could lead to more accurate shelf-life estimations and guide the development of processing and storage conditions to enhance shelf life and ensure product nutritional and sensory qualities.

Supplementary Materials

The following supporting information can be downloaded at https://www.mdpi.com/article/10.3390/pr11103045/s1, Figures S1–S17 and Tables S1–S20.

Author Contributions

F.F.G.D.: Conceptualization, Methodology, Data Curation, Formal Analysis, Writing—Original Draft Preparation, and Writing—Reviewing and Editing. B.F.T.: Methodology, Data Curation, Formal Analysis, and Writing—Reviewing and Editing. T.M.F.d.S.V.: Supervision, Reviewing, and Editing. J.M.L.N.d.M.B.: Conceptualization, Supervision, Project Administration, Resources, Writing, Reviewing, and Editing. A.Y.T.: Conceptualization, Supervision, Project Administration, Resources, Writing, Reviewing, Editing, and Funding Acquisition. All authors have read and agreed to the published version of the manuscript.

Funding

This study was funded by the Center for Advanced Processing and Packaging Studies (CAPPS Award #735818-0) and the USDA National Institute of Food and Agriculture, Hatch/Taha (project number 1008787) and Hatch/Multi-State project (Bell) (1023517).

Data Availability Statement

The data presented in this study are available on the supplementary material and also on request from the corresponding author.

Conflicts of Interest

The authors declare no conflict of interest.

References

  1. Koletzko, B.; Bergmann, K.; Brenna, J.T.; Calder, P.C.; Campoy, C.; Clandinin, M.T.; Colombo, J.; Daly, M.; Decsi, T.; Demmelmair, H.; et al. Should formula for infants provide arachidonic acid along with DHA? A position paper of the European Academy of Paediatrics and the Child Health Foundation. Am. J. Clin. Nutr. 2020, 111, 10–16. [Google Scholar] [CrossRef] [PubMed]
  2. Decker, J.E.; Delahanty, M.T.; Davey, A.; Robson, S.M.; Trabulsi, J.C. Human Milk, Infant Formula, and Other Milks Fed to Infants and Toddlers in the United States, NHANES 2007–2018. J. Acad. Nutr. Diet. 2023, 123, 1320–1328.e3. [Google Scholar] [CrossRef] [PubMed]
  3. Koletzko, B.; Baker, S.; Cleghorn, G.; Neto, U.F.; Gopalan, S.; Hernell, O.; Hock, Q.S.; Jirapinyo, P.; Lonnerdal, B.; Pencharz, P.; et al. Global standard for the composition of infant formula: Recommendations of an ESPGHAN coordinated international expert group. J. Pediatr. Gastroenterol. Nutr. 2005, 41, 584–599. [Google Scholar] [CrossRef] [PubMed]
  4. Institute of Medicine (US) Committee on the Evaluation of the Addition of Ingredients New to Infant Formula. Infant Formula: Evaluating the Safety of New Ingredients; National Academies Press: Washington, DC, USA, 2004. [Google Scholar]
  5. Code of Federal Regulations Title 21. 21CFR106.3. US Food and Drug Administration, Department of Health and Human Services. Subchapter B—Food for Human Consumption. Available online: https://www.accessdata.fda.gov/scripts/cdrh/cfdocs/cfcfr/CFRSearch.cfm?fr¼106.3 (accessed on 15 September 2023).
  6. Salas Lorenzo, I.; Chisaguano Tonato, A.M.; de la Garza Puentes, A.; Nieto, A.; Herrmann, F.; Dieguez, E.; Castellote, A.I.; López-Sabater, M.C.; Rodríguez-Palmero, M.; Campoy, C. The effect of an infant formula supplemented with AA and DHA on fatty acid levels of infants with different FADS genotypes: The COGNIS study. Nutrients 2019, 11, 602. [Google Scholar] [CrossRef] [PubMed]
  7. Koch, E.; Löwen, A.; Kampschulte, N.; Plitzko, N.; Wiebel, M.; Rund, K.M.; Willenberg, I.; Schebb, N.H. Beyond Autoxidation and Lipoxygenases: Fatty Acid Oxidation Products in Plant OilsBeyond Autoxidation and Lipoxygenases: Fatty Acid Oxidation Products in Plant Oils. J. Agric. Food Chem. 2023, 71, 13092–13106. [Google Scholar] [CrossRef] [PubMed]
  8. Angulo, A.J.; Romera, J.M.; Ramírez, M.; Gil, A. Effects of storage conditions on lipid oxidation in infant formulas based on several protein sources. J. Am. Oil Chem. Soc. 1998, 75, 1603–1607. [Google Scholar] [CrossRef]
  9. German, J.B. Food Processing and Lipid Oxidation. In Advances in Experimental Medicine and Biology; Springer: Boston, MA, USA, 1999; Volume 459, pp. 23–50. ISBN 978-1-4615-4853-9. [Google Scholar] [CrossRef]
  10. Shen, Q.; Zhang, Z.; Emami, S.; Chen, J.; de Moura Bell, J.M.L.N.; Taha, A.Y. Triacylglycerols are preferentially oxidized over free fatty acids in heated soybean oil. npj Sci. Food 2021, 5, 7. [Google Scholar] [CrossRef] [PubMed]
  11. Koch, E.; Kampschulte, N.; Schebb, N.H. Comprehensive Analysis of Fatty Acid and Oxylipin Patterns in n3-PUFA Supplements. J. Agric. Food Chem. 2022, 70, 3979–3988. [Google Scholar] [CrossRef] [PubMed]
  12. Teixeira, B.F.; Dias, F.F.G.; Vieira, T.M.F.S.; de Moura Bell, J.M.L.N.; Taha, A.Y. Method optimization of oxylipin hydrolysis in nonprocessed bovine milk indicates that the majority of oxylipins are esterified. J. Food Sci. 2021, 86, 1791–1801. [Google Scholar] [CrossRef] [PubMed]
  13. Albert, B.B.; Cameron-Smith, D.; Hofman, P.L.; Cutfield, W.S. Oxidation of Marine Omega-Supplements and Human Health. Biomed Res. Int. 2013, 2013, 464921. [Google Scholar] [CrossRef] [PubMed]
  14. Daoud, S.; Bou-Maroun, E.; Waschatko, G.; Horemans, B.; Mestdagh, R.; Billecke, N.; Cayot, P. Detection of Lipid Oxidation in Infant Formulas: Application of Infrared Spectroscopy to Complex Food Systems. Foods 2020, 9, 1432. [Google Scholar] [CrossRef] [PubMed]
  15. Teixeira, B.F.; Dias, F.F.G.; Vieira, T.M.F.S.; Taha, A.Y.; de Moura Bell, J.M.L.N. Early detection of lipid oxidation in infant milk formula by measuring free oxylipins—Comparison with hydroperoxide value and thiobarbituric acid reactive substance methods. J. Food Sci. 2022, 87, 5252–5262. [Google Scholar] [CrossRef] [PubMed]
  16. Schuchardt, J.P.; Hahn, A. Bioavailability of long-chain omega-3 fatty acids. Prostaglandins Leukot. Essent. Fat. Acids 2013, 89, 1–8. [Google Scholar] [CrossRef] [PubMed]
  17. Van Eeckhaut, A.; Lanckmans, K.; Sarre, S.; Smolders, I.; Michotte, Y. Validation of bioanalytical LC–MS/MS assays: Evaluation of matrix effects. J. Chromatogr. B 2009, 877, 2198–2207. [Google Scholar] [CrossRef] [PubMed]
  18. Bioanalytical Method Validation, Office of Clinical Pharmacology in the Center for Drug Evaluation and Research and the Center for Veterinary Medicine at the Food and Drug Administration. 2018. Available online: fda.gov/media/70858/download (accessed on 15 September 2023).
  19. Zhou, W.; Yang, S.; Wang, P.G. Matrix effects and application of matrix effect factor. Bioanalysis 2017, 9, 1839–1844. [Google Scholar] [CrossRef] [PubMed]
  20. Amate, F.C.; Unterluggauer, H.; Fischer, R.J.; Fernández-Alba, A.R.; Masselter, S. Development and validation of a LC–MS/MS method for the simultaneous determination of aflatoxins, dyes and pesticides in spices. Anal. Bioanal. Chem. 2010, 397, 93–107. [Google Scholar] [CrossRef] [PubMed]
  21. Liang, K.; Zu, H.; Wang, X. Effect of storage on n-3 PUFA-enriched eggs. CyTA—J. Food 2020, 18, 102–107. [Google Scholar] [CrossRef]
Figure 1. Percentages of esterified (light grey bars) and free (dark grey bars) oxylipins (A) in infant milk formula and LA-, ALA-, and DHA-derived oxylipins in Formula (1) (B) and Formula (2) (C).
Processes 11 03045 g001
Figure 2. Concentrations (in nmol/L) of esterified (light grey bars) and free (dark grey bars) LA-derived oxidized fatty acids in infant milk formula: (A) 9-HODE, (B) 13-HODE, (C) 9-oxo-ODE, (D) 13-oxo-ODE, (E) 9(10)-EpOME, (F) 12(13)-EpOME, (G) 9,10-DiHOME, (H) 12,13-DiHOME, (I) 9,10,13-TriHOME, and (J) 9,12,13-TriHOME. Free oxylipins were derived and replotted from Teixeira et al. [15] (license number 5634370936405, John Wiley and Sons, Licensed Content Publication). * and + indicate significant statistical differences from the control (Day 01)by two-way repeated ANOVA followed by Dunnett’s post hoc test with p < 0.05 for Formulas (1) and (2), respectively. x indicates significant statistical difference between Formulas (1) and (2) for each time point via unpaired t-test with p < 0.05. Abbreviations: EpDPE (epoxydocosapentanoic acid), HDoHE (hydroxydocosahexaenoic acid), EpOME (epoxyoctadecenoic acid), DiHOME (dihydroxyoctadecenoic acid), TriHOME (trihydroxyoctademonoenoic acid), HODE (hydroxyoctadecadienoic acid), oxo-ODE (oxo-octadecadienoic acid), HOTrE (hydroxyoctadecatrienoic).
Processes 11 03045 g002
Figure 3. Concentrations (in nmol/L) of esterified (light grey bars) and free (dark grey bars) ALA-derived oxidized fatty acids: (A) 9-HOTrE; (B) 13-HOTrE. DHA oxidized fatty acids in infant milk formula: (C) 10(11)-EpDPE, (D) 13(14)-EpDPE, (E) 16(17)-EpDPE, (F) 19(20)-EpDPE, and (G) 17-HDoHE. Free oxylipins were derived and replotted from Teixeira et al. [15] (licence number 5634370936405). * and + indicate significant statistical differences from the control (Day 01) by two-way repeated ANOVA followed by Dunnett’s post hoc test with p < 0.05 for Formulas (1) and (2), respectively. x indicates significant statistical difference between Formulas (1) and (2) for each time point via unpaired t-test with p < 0.05. Abbreviations: EpDPE (epoxydocosapentanoic acid), HDoHE (hydroxydocosahexaenoic acid), EpOME (epoxyoctadecenoic acid), DiHOME (dihydroxyoctadecenoic acid), TriHOME (trihydroxyoctademonoenoic acid), HODE (hydroxyoctadecadienoic acid), oxo-ODE (oxo-octadecadienoic acid), HOTrE (hydroxyoctadecatrienoic acid).
Processes 11 03045 g003
Table 1. Infant milk formulas’ compositions.
Composition (%)
Ingredient (%)WaterLipidMaltodextrinMilk Protein ConcentrateLecithin
Formula (1)86.694 (100% canola oil)81.30.01
Formula (2)86.694 (99.7% canola and 0.3% DHA ethyl ester81.30.01
Table 2. Matrix effect (ion suppression (%) for total (free + esterified) oxylipins in infant milk formula without DHA (Formula (1)) or with DHA (Formula (2)).
CompoundsIon Suppression (%)
LA-derivedFormula (1)Formula (2)
9-HODE92.688.7
13-HODE91.889.9
9-oxo-ODE87.593.9
13-oxo-ODE91.1102.9
9(10)-EpOME89.893.6
12(13)-EpOME88.788.2
9,10-DiHOME98.394.8
12,13-DiHOME87.986.3
9,10,13-TriHOME91.491.4
9,12,13-TriHOME92.492.8
ALA-derived
9-HOTrE94.394.3
13-HOTrE93.389.4
DHA-derived
10(11)EpDPE94.093.7
13(14)EpDPE95.692.9
16(17)-EpDPE103.691
19(20)-EpDPE91.793.3
17-HDoHE90.5101.7
Abbreviations: EpDPE (epoxydocosapentanoic acid), HDoHE (hydroxydocosahexaenoic acid), EpOME (epoxyoctadecenoic acid), DiHOME (dihydroxyoctadecenoic acid), TriHOME (trihydroxyoctademonoenoic acid), HODE (hydroxyoctadecadienoic acid), oxo-ODE (oxo-octadecadienoic acid), HOTrE (hydroxyoctadecatrienoic acid).
Table 3. Recovery (%) of total (free + esterified) oxylipins oxidized fatty acid in infant milk Formulas (1) and (2).
CompoundsDay 0Day 01Day 03Day 07Day 14Day 21
LA-derivedF1F2F1F2F1F2F1F2F1F2F1F2
9-HODE88.95 ± 2.6980.58 ± 6.7383.17 ± 5.4579.23 ± 3.8685.28 ± 8.6578.77 ± 9.1684.91 ± 2.6586.35 ± 0.5586.2 ± 4.8177.37 ± 13.4488.33 ± 2.0680.1 ± 4.92
13-HODE86.95 ± 2.6981.58 ± 3.7383.17 ± 5.4579.23 ± 3.8685.28 ± 8.6578.77 ± 10.1684.91 ± 2.6586.35 ± 0.5586.2 ± 4.8178.37 ± 9.4488.33 ± 2.0680.29 ± 4.92
9-oxo-ODE82.16 ± 3.4876.11 ± 6.376.89 ± 4.3379.16 ± 5.3382.94 ± 4.8073.8 ± 8.2885.09 ± 6.7285.05 ± 4.8583.37 ± 2.6178.73 ± 8.0285.77 ± 0.6584.38 ± 4.12
13-oxo-ODE84.91 ± 8.2378.35 ± 6.1576.89 ± 4.3377.33 ± 5.289.24 ± 16.9175.13 ± 8.0985.09 ± 6.7283.08 ± 4.7385.75 ± 2.4977.04 ± 7.685.77 ± 0.6582.43 ± 4.02
12(13)-EpOME76.6 ± 7.02075.91 ± 4.5677.48 ± 6.9079.42 ± 7.2775.66 ± 7.2872.21 ± 4.2178.97 ± 1.3580.08 ± 0.4682.7 ± 4.5078.87 ± 8.0783.9 ± 6.6278.02 ± 2.84
9(10)-EpOME76.51 ± 9.1175.3 ± 4.6575.92 ± 7.0475.77 ± 7.4177.12 ± 7.4277.97 ± 5.0180.5 ± 1.3881.63 ± 0.4784.3 ± 4.5978.2 ± 8.4285.52 ± 6.7579.67 ± 3.14
9,10-DiHOME94.44 ± 4.2988.8 ± 6.0985.21 ± 3.4682.23 ± 3.5888.8 ± 10.0880.48 ± 9.690.51 ± 0.9183.69 ± 4.9388.03 ± 4.3978.54 ± 7.7589.79 ± 1.7882.02 ± 4.89
12,13-DiHOME92.54 ± 4.2190.62 ± 6.2187.5 ± 3.3983.92 ± 3.6587.02 ± 9.8882.13 ± 9.888.69 ± 0.8985.41 ± 5.0386.26 ± 4.380.15 ± 7.9184.07 ± 3.7683.7 ± 4.99
9,10,13-TriHOME85.99 ± 9.2675.58 ± 5.9983.14 ± 3.5676.04 ± 4.5278.03 ± 6.9774.6 ± 5.6778.14 ± 5.4677.03 ± 5.5278.64 ± 3.1077.49 ± 5.2974.87 ± 1.5686.05 ± 4.69
9,12,13-TriHOME78.53 ± 3.5674.52 ± 4.1578.16 ± 7.3879.1 ± 3.2777.36 ± 6.5279.99 ± 4.978.95 ± 4.1277.72 ± 7.0877.23 ± 1.3275.04 ± 9.2371.13 ± 1.9678.55 ± 3.32
ALA-derived
9-HOTrE88.95 ± 2.6981.8 ± 3.9383.17 ± 5.4583.53 ± 4.0785.28 ± 8.6583.05 ± 13.8785.4 ± 2.5591.05 ± 6.5886.2 ± 4.8176.31 ± 14.1788.33 ± 2.0680.44 ± 4.14
13-HOTrE93.78 ± 2.8477.58 ± 3.7387.69 ± 5.7579.23 ± 3.8689.92 ± 9.1278.77 ± 13.1690.04 ± 2.6986.35 ± 0.5590.88 ± 5.0778.37 ± 13.4493.13 ± 2.1782.37 ± 7.22
DHA-derived
10(11)EpDPE83.69 ± 7.0383.49 ± 5.7385.08 ± 7.8975.49 ± 5.4985.18 ± 6.4572.74 ± 13.2690.21 ± 1.5474.37 ± 8.1794.48 ± 5.1574.85 ± 7.2995.84 ± 7.5776.91 ± 3.27
13(14)EpDPE79.72 ± 6.778.26 ± 4.9681.05 ± 7.5173.91 ± 10.6781.14 ± 6.1475.77 ± 12.0285.94 ± 1.4780.26 ± 6.1390.00 ± 4.9074.95 ± 9.6691.30 ± 7.2185.05 ± 3.35
16(17)-EpDPE79.72 ± 6.775.54 ± 2.6981.05 ± 7.5172.52 ± 13.0481.14 ± 6.1475.00 ± 12.9985.94 ± 1.4777.65 ± 9.6190.00 ± 4.9071.72 ± 12.191.30 ± 7.2183.68 ± 4.78
19(20)-EpDPE89.3 ± 7.979.3 ± 2.8278.51 ± 3.1976.13 ± 13.6978.89 ± 6.7380.38 ± 11.4680.29 ± 5.2684.58 ± 6.1181.1 ± 4.0575.29 ± 13.179.04 ± 0.7187.84 ± 5.02
17-HDoHE91.81 ± 2.7880.08 ± 3.8585.85 ± 5.6281.78 ± 3.9988.03 ± 8.9281.31 ± 13.5887.64 ± 2.7489.13 ± 0.5788.97 ± 4.9774.7 ± 13.8791.17 ± 2.1382.67 ± 5.08
Data are shown as mean ± SD of n = 3 per time point. The absence of superscript letters indicates no statistically significant differences (p < 0.05) between the recoveries of Formula (1) (F1) and Formula (2) (F2) and between Day 0 and the other storage days.
Table 4. Velocities of the total, free, and esterified oxylipins in infant formulations stored at 4 °C for 21 days.
Formula (1)Formula (2)
OxylipinsTotalEsterifiedFreeTotalEsterifiedFree
9-HODE3.83 ± 0.411.59 ± 0.811.67 ± 0.815.29 ± 0.983.19 ± 0.78 *ϯ0.62 ± 0.57
13-HODE7.24 ± 1.854.25 ± 1.144.11 ± 2.0010.28 ± 3.037.57 ± 2.50 *ϯ1.12 ± 1.41
9-oxo-ODE−0.09 ± 0.05−0.27 ± 0.050.06 ± 0.18−0.07 ± 0.22−0.15 ± 0.28−0.23 ± 0.14
13-oxo-ODE−0.10 ± 0.04−0.27 ± 0.070.06 ± 0.16−0.07 ± 0.17−0.10 ± 0.13−0.21 ± 0.3
9(10)-EpOME0.59 ± 0.030.22 ± 0.170.36 ± 0.13¥1.54 ± 0.420.86 ± 0.16 *ϯ−0.01 ± 0.19
12(13)-EpOME7.21 ± 2.144.89 ± 2.581.95± 0.66¥25.22 ± 5.9513.49 + 2.32 *ϯ0.37 ± 0.42
9,10-DiHOME−0.37 ± 0.02−0.07± 1.02−0.14 ± 0.16−0.37 ± 0.110.02 ± 0.13−0.54 ± 0.20
12,13-DiHOME0.47 ± 0.060.14 ± 0.220.31 ± 0.220.70 ± 0.170.37 ± 0.640.00 ± 0.20
9,10,13-TriHOME6.33 ± 1.086.06 ± 1.04 *0.27 ± 0.266.32 ± 1.535.70 ± 1.87 *0.41 ± 1.01
9,12,13-TriHOME3.76 ± 0.772.58 ± 0.30 *0.88 ± 0.386.77 ± 1.706.01 ± 0.41 *ϯ0.91 ± 0.49
ΣLA-derived oxylipins27.85 ± 1.9018.91 ± 2.88 *8.63 ± 4.55 ϯ59.99 ± 7.8950.75 ± 6.49 *ϯ0.56 ± 1.23
9-HOTrE0.70 ± 0.080.52 ± 0.120.30 ± 0.10 ¥0.71 ± 0.160.68 ± 0.16 *0.07 ± 0.03
13-HOTrE0.47 ± 0.200.25 ± 0.110.19 ± 0.10 ¥0.55 ± 0.100.44 ± 0.15 *ϯ−0.01 ± 0.05
ΣALA-derived oxylipins1.17 ± 0.080.62 ± 0.180.54 ± 0.24 ¥0.71 ± 0.150.77 ± 0.17 *0.05 ± 0.04
10(11)-EpDPENDNDND−0.19 ± 0.17−0.20 ± 0.170.01 ± 0.00
13(14)-EpDPENDNDND−0.65 ± 0.48−0.65 ± 0.480.01 ± 0.00
16(17)-EpDPENDNDND−1.07 ± 0.75−1.07 ± 0.750.01 ± 0.00
19(20)-EpDPENDNDND−1.15 ± 1.63−1.16 ± 1.630.02 ± 0.00
17-HDoHE−0.03 ± 0.02−0.03 ± 0.02ND1.68 ± 0.361.57 ± 0.38 *ϯ0.14 ± 0.06
ΣDHA-derived oxylipins−0.03 ± 0.02−0.03 ± 0.02ND−1.38 ± 3.33−1.51 ± 3.360.16 ± 0.06
Velocity is expressed as mean ± SD of n = 3 for total, esterified, and free oxylipin fractions. Formula (1): canola oil as the lipid source; Formula (2): canola oil + 1% of DHA as the lipid source; ND: not detected. * Velocity of esterified oxylipin is significantly different from that of free oxylipin (p < 0.05) as detected by unpaired t-test. Ϯ Velocity of esterified oxylipin from Formulas (1) and (2) are significantly different (p < 0.05) as detected by unpaired t-test. ¥ Velocity of free oxylipin from Formulas (1) and (2) are significantly different (p < 0.05) as detected by unpaired t-test. Abbreviations: EpDPE (epoxydocosapentanoic acid), HDoHE (hydroxydocosahexaenoic acid), EpOME (epoxyoctadecenoic acid), DiHOME (dihydroxyoctadecenoic acid), TriHOME (trihydroxyoctademonoenoic acid), HODE (hydroxyoctadecadienoic acid), oxo-ODE (oxo-octadecadienoic acid), HOTrE (hydroxyoctadecatrienoic acid).
Disclaimer/Publisher’s Note: The statements, opinions and data contained in all publications are solely those of the individual author(s) and contributor(s) and not of MDPI and/or the editor(s). MDPI and/or the editor(s) disclaim responsibility for any injury to people or property resulting from any ideas, methods, instructions or products referred to in the content.

