Article

Optimization of the Parameters for Gravity Heat Pipes in Coal Gangue Hills by Measuring Thermal Power Generation

College of Safety and Emergency Management Engineering, Taiyuan University of Technology, Taiyuan 030600, China
*
Author to whom correspondence should be addressed.
Processes 2023, 11(10), 3040; https://doi.org/10.3390/pr11103040
Submission received: 21 September 2023 / Revised: 7 October 2023 / Accepted: 13 October 2023 / Published: 23 October 2023

Abstract

:
In order to effectively control high temperatures inside coal gangue hills, gravity heat pipes with specific spacings are vertically installed in coal gangue hills. Heat extracted from these heat pipes can be utilized for power generation through energy conversion. In this study, an equivalent model of gravity heat pipes in coal gangue hills was established and, in a laboratory setting, experimental research and optimization were conducted on power generation per unit area using the temperature difference of gravity heat pipes for electricity generation. To facilitate real-time testing of different heat pipe parameters and to display the experimental results, a multi-parameter measurement system was designed and constructed. This study systematically investigated the effects of various structural parameters such as inclination angle, heating temperature, initial absolute pressure, and working fluid height. Through single-factor experiments, it was determined that the inclination angle had no significant impact. The range of values for heating temperature, initial absolute pressure, and working fluid height were confirmed based on six sets of experiments. To maximize the performance of the thermoelectric generator, a response surface analysis experiment was conducted using the Design-Expert software. The optimal conditions were determined to be a working fluid height of 200.001 mm, an initial absolute pressure of 0.002 MPa, and a heating temperature of 413.15 K. Under these conditions, the power generation per unit area of the thermoelectric generator reached 0.122981 W/(m2·K). The accuracy of the theoretical experiments was verified through on-site industrial experiments. By calculations, it was determined that the maximum temperature difference power generation capacity per gravity heat pipe was 42.39 W. This provides a new solution for the management of coal mine gangue hills and the secondary utilization of waste energy.

1. Introduction

In recent years, since carbon reduction has become a global consensus, the issue of environmental pollution caused by coal gangue hills has become increasingly prominent. Investigating methods for addressing the damage caused by coal gangue hills to the environment has become a focus of discussion among many scholars. Coal gangue hills are formed from waste materials generated during coal mining and they contain a large amount of heavy metals and other harmful substances [1,2,3,4]. The internal elements such as carbon, sulfur, and nitrogen can generate a significant amount of hazardous gases after oxidation, leading to environmental pollution [5,6,7,8,9,10]. The remaining coal inside these hills can release a substantial amount of heat through slow atmospheric oxidation, resulting in high temperatures within the gangue hills. The internal temperatures can range from 573 K to 1473 K, while the surface temperatures can exceed 373 K [6,11,12,13,14,15], which severely impacts vegetation growth and has the potential to lead to disasters such as explosions [16,17,18,19]. Therefore, it is urgent to address the problem of effective treatment methods for coal gangue hills.
Heat pipes have found widespread applications as high-efficiency heat exchangers in various industries [20], including electronic component cooling [21], semiconductor fabrication [22], electric vehicle battery cooling [23], plastic injection molding [24], and hot water boiler heat exchange [25]. Different shapes and working fluids are used in the design of heat pipes to meet specific requirements. Hadi and Faramarz [26] conducted a study on the heat transfer coefficient of Al2O3-water nanofluids during nucleate pool boiling at low heat fluxes. The experimental results emphasized that the heat transfer coefficient was primarily influenced by the density of nucleation sites and bubble departure diameter. Tian et al. [27] investigated the main factors affecting the heat transfer limits of heat pipes. Wang [28] conducted experiments to study the dynamic characteristics of rotating heat pipes, including startup behavior, temperature fluctuation, and failure phenomena. The results indicated that rotational motion could significantly improve the performance of a rotating heat pipe during startup. Xuan [29] analyzed the effects of heat load and inclined angles on evaporation startup behaviors. Their findings revealed that trapezoidal grooves exhibited gradual startup, while inclined conditions led to sequential occurrences of both gradual startup and overshoot startup as the heat load increased. However, the above-mentioned studies have mainly focused on the characteristics of heat pipes within specific application fields. The water-cooling method has been adopted to measure the heat transfer performance of heat pipes. However, this method is not suitable for the natural conditions of coal mine gangue hills because it involves isolating heat pipes from the external environment. The gangue hill gravity heat pipe (GHP) is a technology that utilizes the high-efficiency heat transfer capacity of heat pipes to address the issue of internal temperature accumulation in coal gangue hills, and it effectively resolves the natural challenges associated with these hills. Peng and Jia [17] conducted research on the influence of GHPs on the internal temperature distribution of gangue hills, and they found that this technology holds significant reference value for promoting the treatment of coal gangue hills and for facilitating the recovery and utilization of low-temperature geothermal energy. Zhang [19] conducted experiments to validate the feasibility of extracting heat from underground coal dumps using heat pipes. The experimental results demonstrated that the application of heat pipes was beneficial for extinguishing coal fires and for energy recovery purposes, attributable to the inherent characteristics of GHPs.
Currently, there is a lack of research on the factors that impact the heat transfer performance of gangue hill GHPs, considering the unique natural conditions present in these hill sites. Gangue hills are characterized by their large size, harsh natural conditions, prolonged pollution, and arid and windy environment [2,3,18,30]. Compared to conventional GHPs, gangue hill GHPs do not have a distinct thermal insulation section. Heat is transferred from the inner part of the gangue hill to the outside through the heat pipes and ultimately dissipated by natural conditions [16].
To investigate the optimal parameters of GHPs in coal gangue hills, a laboratory-scale simulation experimental platform was constructed; the experimental procedure diagram of this study is illustrated in Figure 1. Unlike the conventional approach of evaluating the heat dissipation efficiency of GHPs using water circulation cooling, the evaluation index employed in this study was the power coefficient of thermoelectric power generation per unit area of the thermoelectric power generation chip ( C g ). This evaluation index better aligns with the application scenario of GHPs in coal gangue hills. This study focused on examining the effects of inclination angle, heating temperature, initial absolute pressure, and working fluid height on the heat transfer efficiency of GHPs. Furthermore, thermoelectric power generation chips were integrated into the heat dissipation section of GHPs to convert the thermal energy within coal gangue hills into electrical energy. This innovative approach offers a new solution for the secondary utilization of energy in coal gangue hills.

2. Experimental Setup and the Principle of Thermoelectric Power Generation

2.1. Introduction to Experimental Setup

The geographical location and on-site conditions of coal gangue hills are often harsh, making it inconvenient to deploy sensors and to collect data. Therefore, to study the relevant parameters of GHPs, it is necessary to construct a similar physical experimental platform in a laboratory, as shown in Figure 2.
The experimental setup primarily consisted of a glass GHP, a data acquisition device, a thermostat, and a vacuum pump, as depicted in Figure 2. The specifications of the heat pipe used in this study are presented in Table 1. Four temperature sensors were installed at distances of 30, 50, 70, and 96 mm from the GHP, respectively. A thermoelectric generator was mounted 90 mm from the GHP. The thermoelectric power generation film was attached to the heat dissipation section of the GHP, creating a temperature difference between the heat dissipation end of the GHP and the ambient temperature on both sides of the film. This temperature difference generated a voltage, enabling power generation. To ensure that the measurements aligned with natural conditions of coal gangue hills, the GHP was cooled using natural conditions. The heat transfer efficiency of the GHP was evaluated using the C g index. The glass material allowed us to observe the spring phenomenon and facilitated analysis of the isothermal performance. Furthermore, accumulated temperature in a coal gangue hill represents wasted energy; therefore, utilization of thermoelectric power generation can provide valuable insights for waste energy utilization.
Figure 1 illustrates the principle of thermoelectric power generation using a GHP. The heat emitted by the condensation section of the GHP was transferred to the thermoelectric generator, resulting in one side of the generator being heated, while the other side was cooled by the environment to generate a temperature difference and subsequently produce a potential difference. The potential difference generated voltage signals through the Hall voltage sensor and current signals through the Hall current sensor. Additionally, a 20 Ω current limiting resistor was connected in series with the current sensor.
The actual size of a GHP in a coal gangue hills is an inner diameter of 108 mm and a height of 6000 mm, with a length of 1500 mm embedded in the high-temperature region of the coal gangue hill. Based on a scale ratio of 6:1, the model used in this experiment was obtained.
Figure 3 illustrates the principle of thermoelectric power generation in the evaporation section of the GHP within this experimental setup. The GHP transfers heat from the evaporation section to the condensation section [18] and consequently heats the thermoelectric generator positioned in the condensation section, resulting in the generation of an electrical potential difference. The thermoelectric generator can convert heat energy from the condensation section of the GHP into electrical energy. It is an effective method for secondary utilization of waste energy, which reutilizes a portion of the heat energy while controlling the deep-seated temperature accumulation in coal gangue hills. A Hall current sensor was connected in series with a 20 Ω resistance, and then it was connected in parallel with a Hall voltage sensor and the output wire of the electrical potential difference. The signals acquired by the Hall current sensor and the Hall voltage sensor were linked to the GHP experimental system via an operational amplifier, enabling real-time display of voltage and current values on the computer.
The calculation formula for the power coefficient of thermoelectric power generation per unit area ( C g ) is as follows:
C g = P j A c ( T e T c )
T c = 1 / 4 ( T 1 + T 2 + T 3 + T 4 )
where P j is the thermoelectric generator power, A c is the area of the heat pipe where the thermoelectric generator is located, T e is the evaporator temperature, and T c is the average temperature of the condenser.

2.2. Uncertainty Analysis

The uncertainty analysis in this experiment was conducted using a Type B analysis, denoted as uB.
u B = a k
In the equation, a represents the half-width of the possible values of the measured quantity and k denotes the coverage factor. The instruments used for measurement in the actual heat pipe fabrication and engineering included rulers, vernier calipers, temperature sensors, and airflow sensors. The uncertainty analysis was performed on these measuring instruments, and the results are presented in Table 2.
Based on the obtained Type B uncertainty results mentioned above, it can be observed that the uncertainties associated with the theoretical analysis and the heat pipe experimental setup are relatively small. This indicates that the analysis results possess a higher level of accuracy.

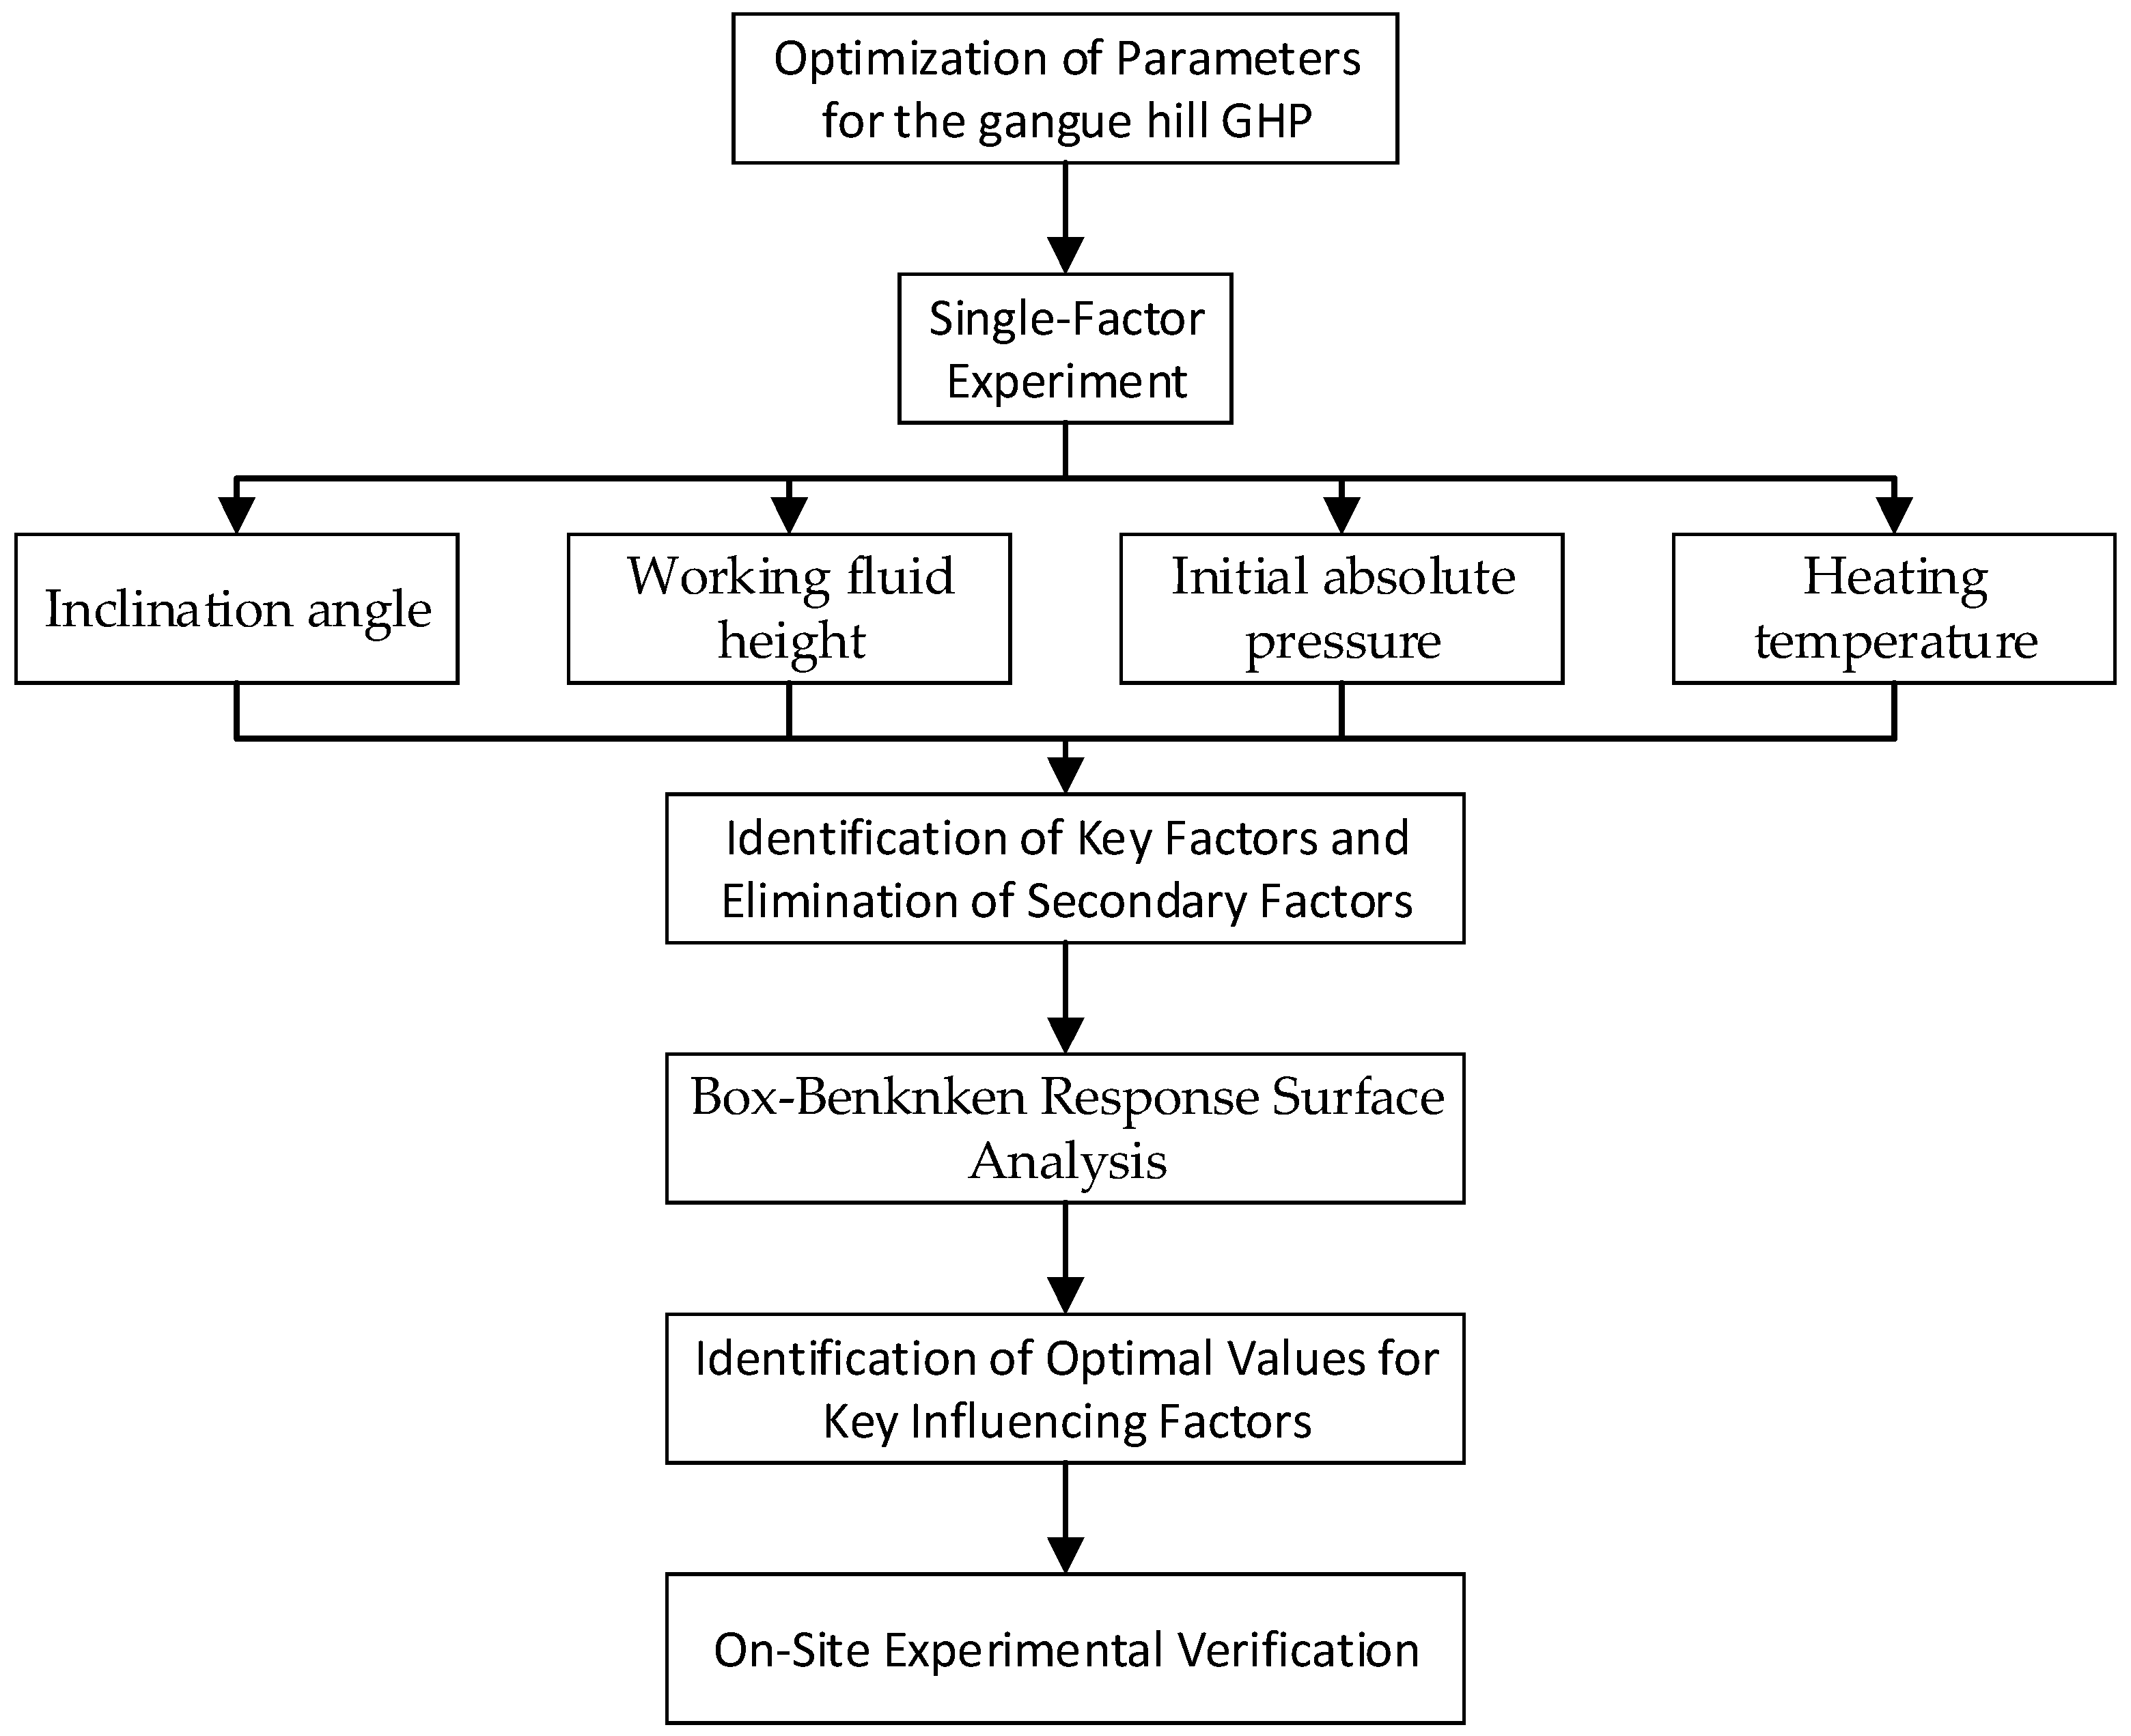
3. Single-Factor Experiments

Single-factor experiments were conducted to determine the significance of the following factors: inclination angle, height of working fluid, initial absolute pressure, and heating temperature. Prior to the experiments, a specified height of water was filled in the heat pipe, and the inclination of the heat pipe was adjusted to the preset angle. A vacuum tube was connected from the top of the heat pipe to the vacuum pump, and the internal air was extracted to achieve the specified vacuum degree. Then, the upper computer control program was initiated to monitor and store real-time data such as thermoelectric generation voltage and current, absolute pressure, and temperature at various positions along the heat pipe.

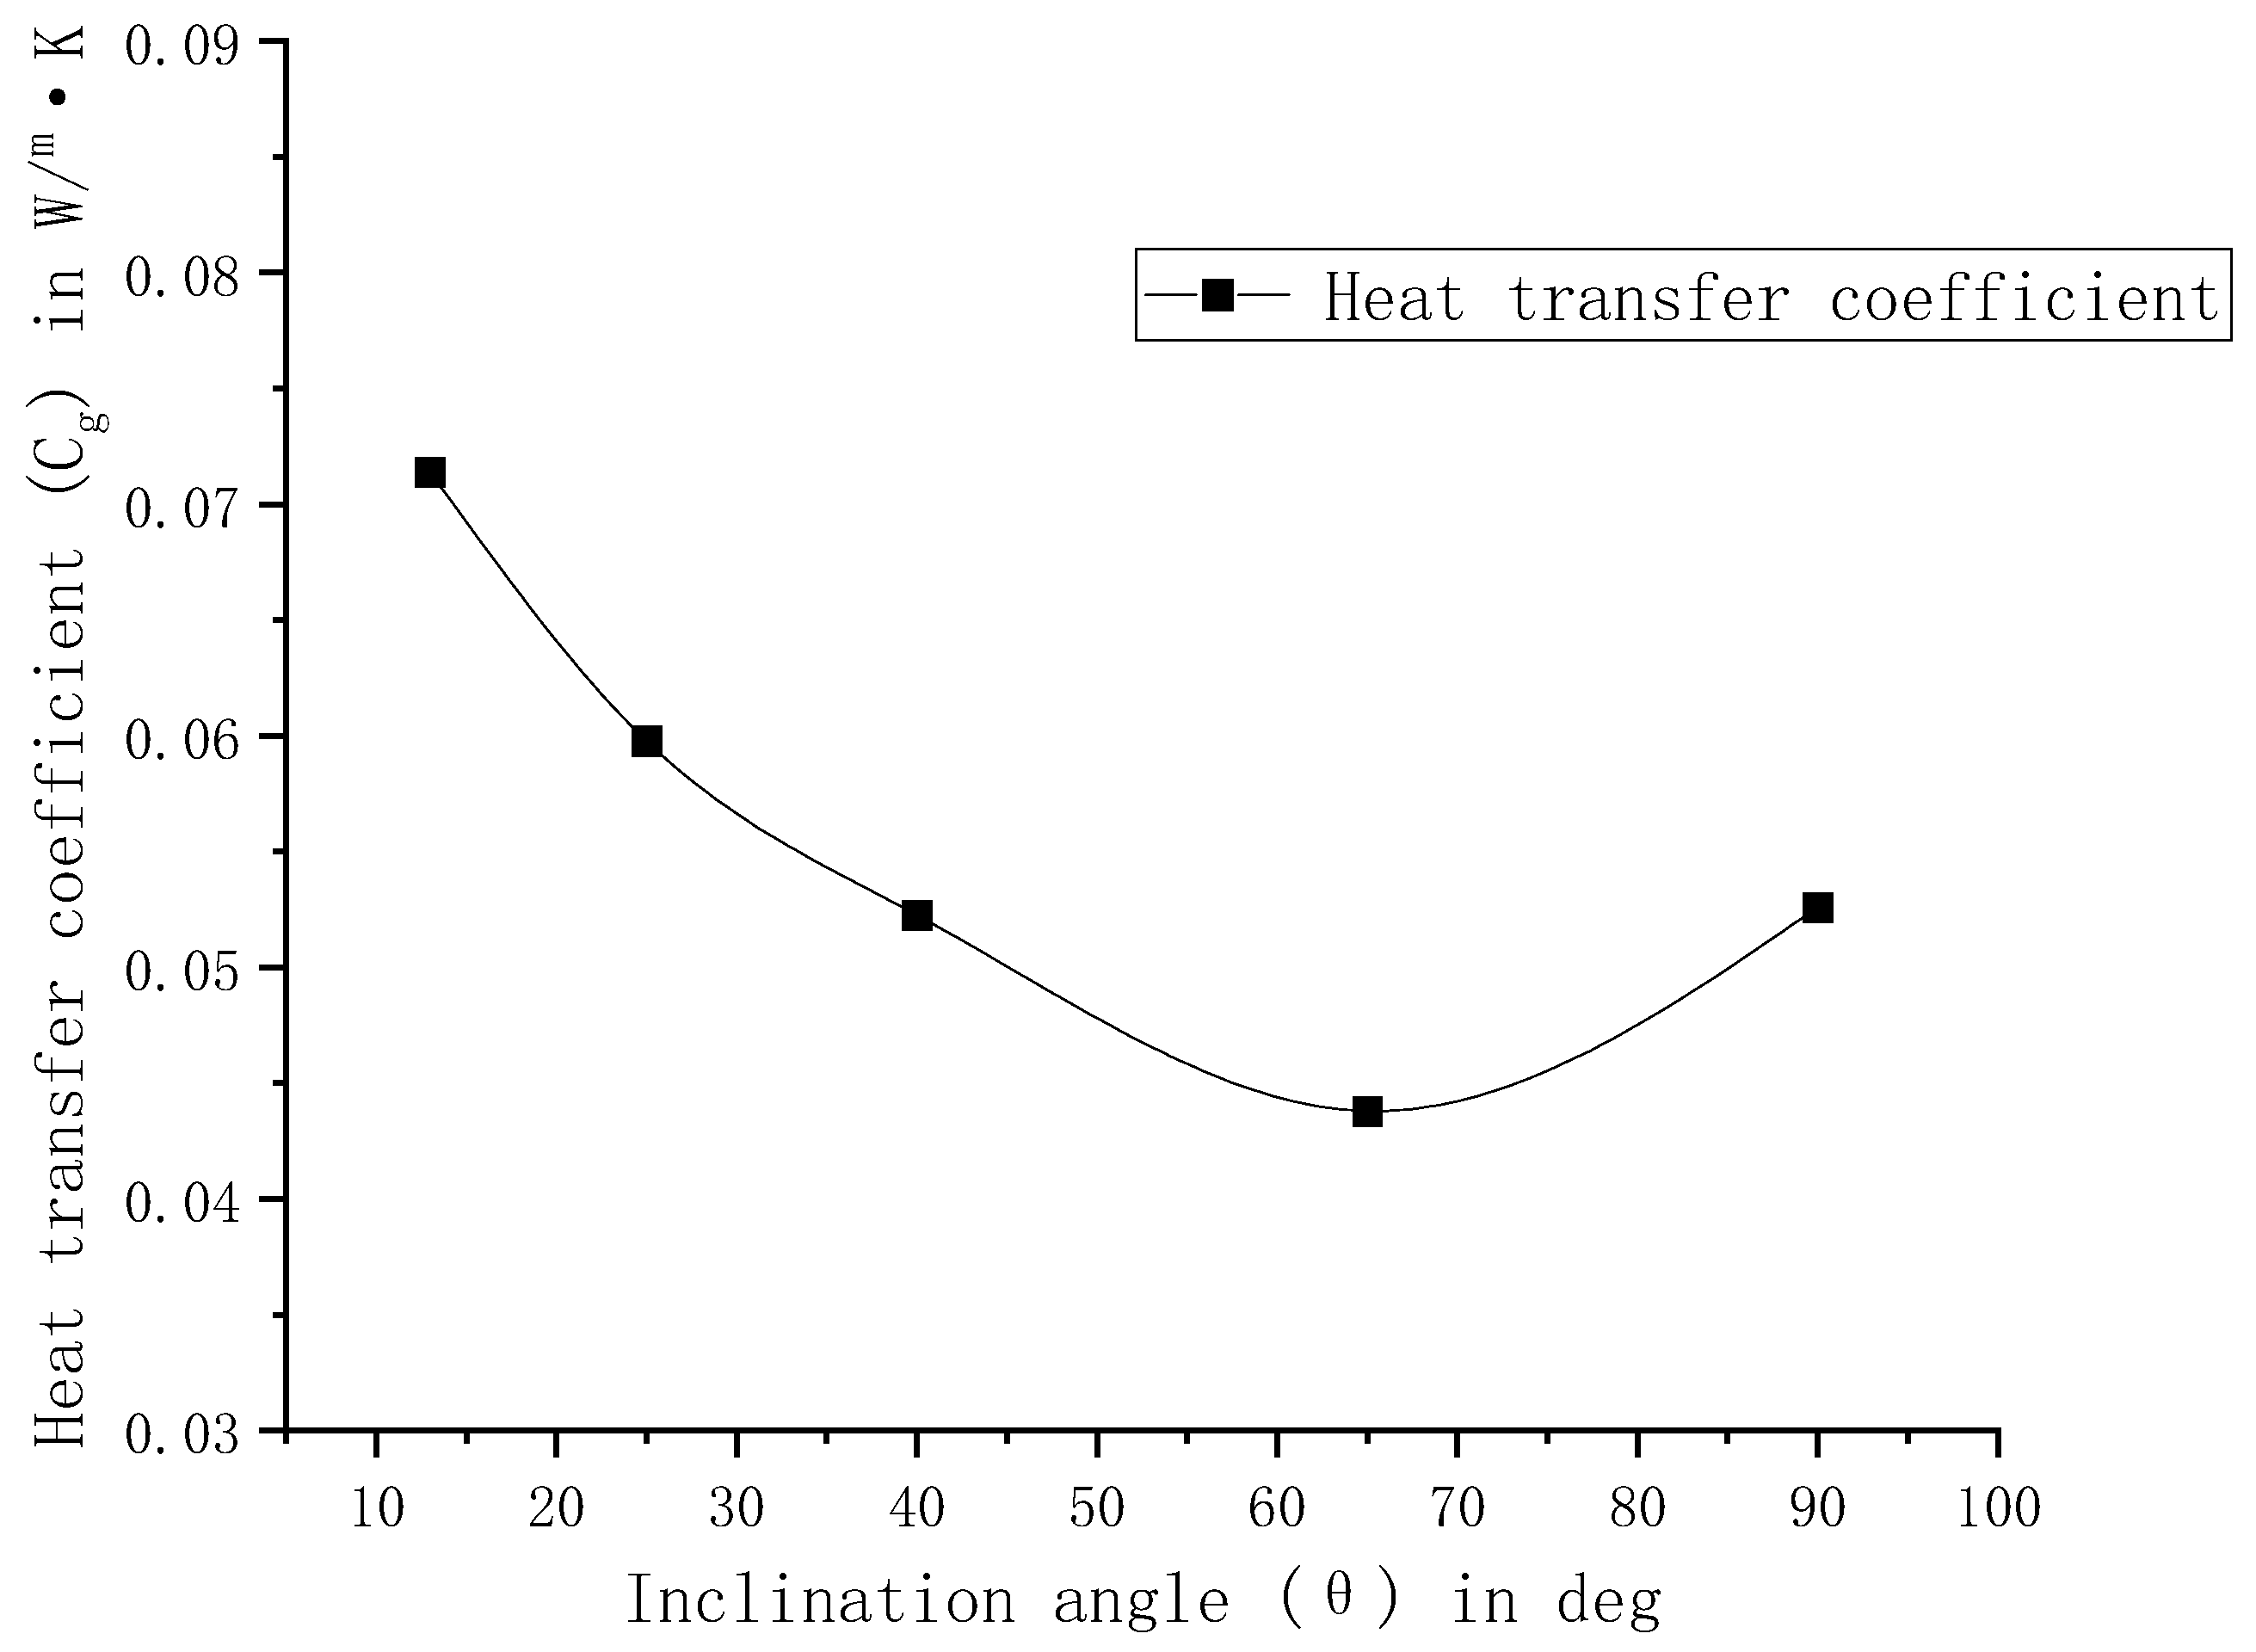
3.1. Inclination Angle of the GHP

The working fluid height was adjusted to H = 250 mm, the heating temperature was set to T e = 373.15 K, and the initial absolute pressure was P = 0.002 MPa. The inclination angle was investigated at θ = 13°, 25°, 40°, 65°, and 90°.
As depicted in Figure 4, it can be observed that as the inclination angle increases from 13° to 90°, C g initially decreases and then starts to increase. The lowest value of C g is observed at an angle of 65°, which is 0.044 W/(m2·K). The maximum value is obtained at an angle of 13°, reaching 0.071 W/(m2·K). The values of C g at angles 40° and 90° are essentially equal, both measuring 0.055 W/(m2·K). From the range of variation on the y-axis, it can be concluded that the influence range of changes in the inclination angle on C g is from 0.044 to 0.071 W/(m2·K). We observe a phenomenon where C g initially decreases and then increases with an increase in angle. However, these effects on C g are limited due to the vigorous movement of the working fluid.

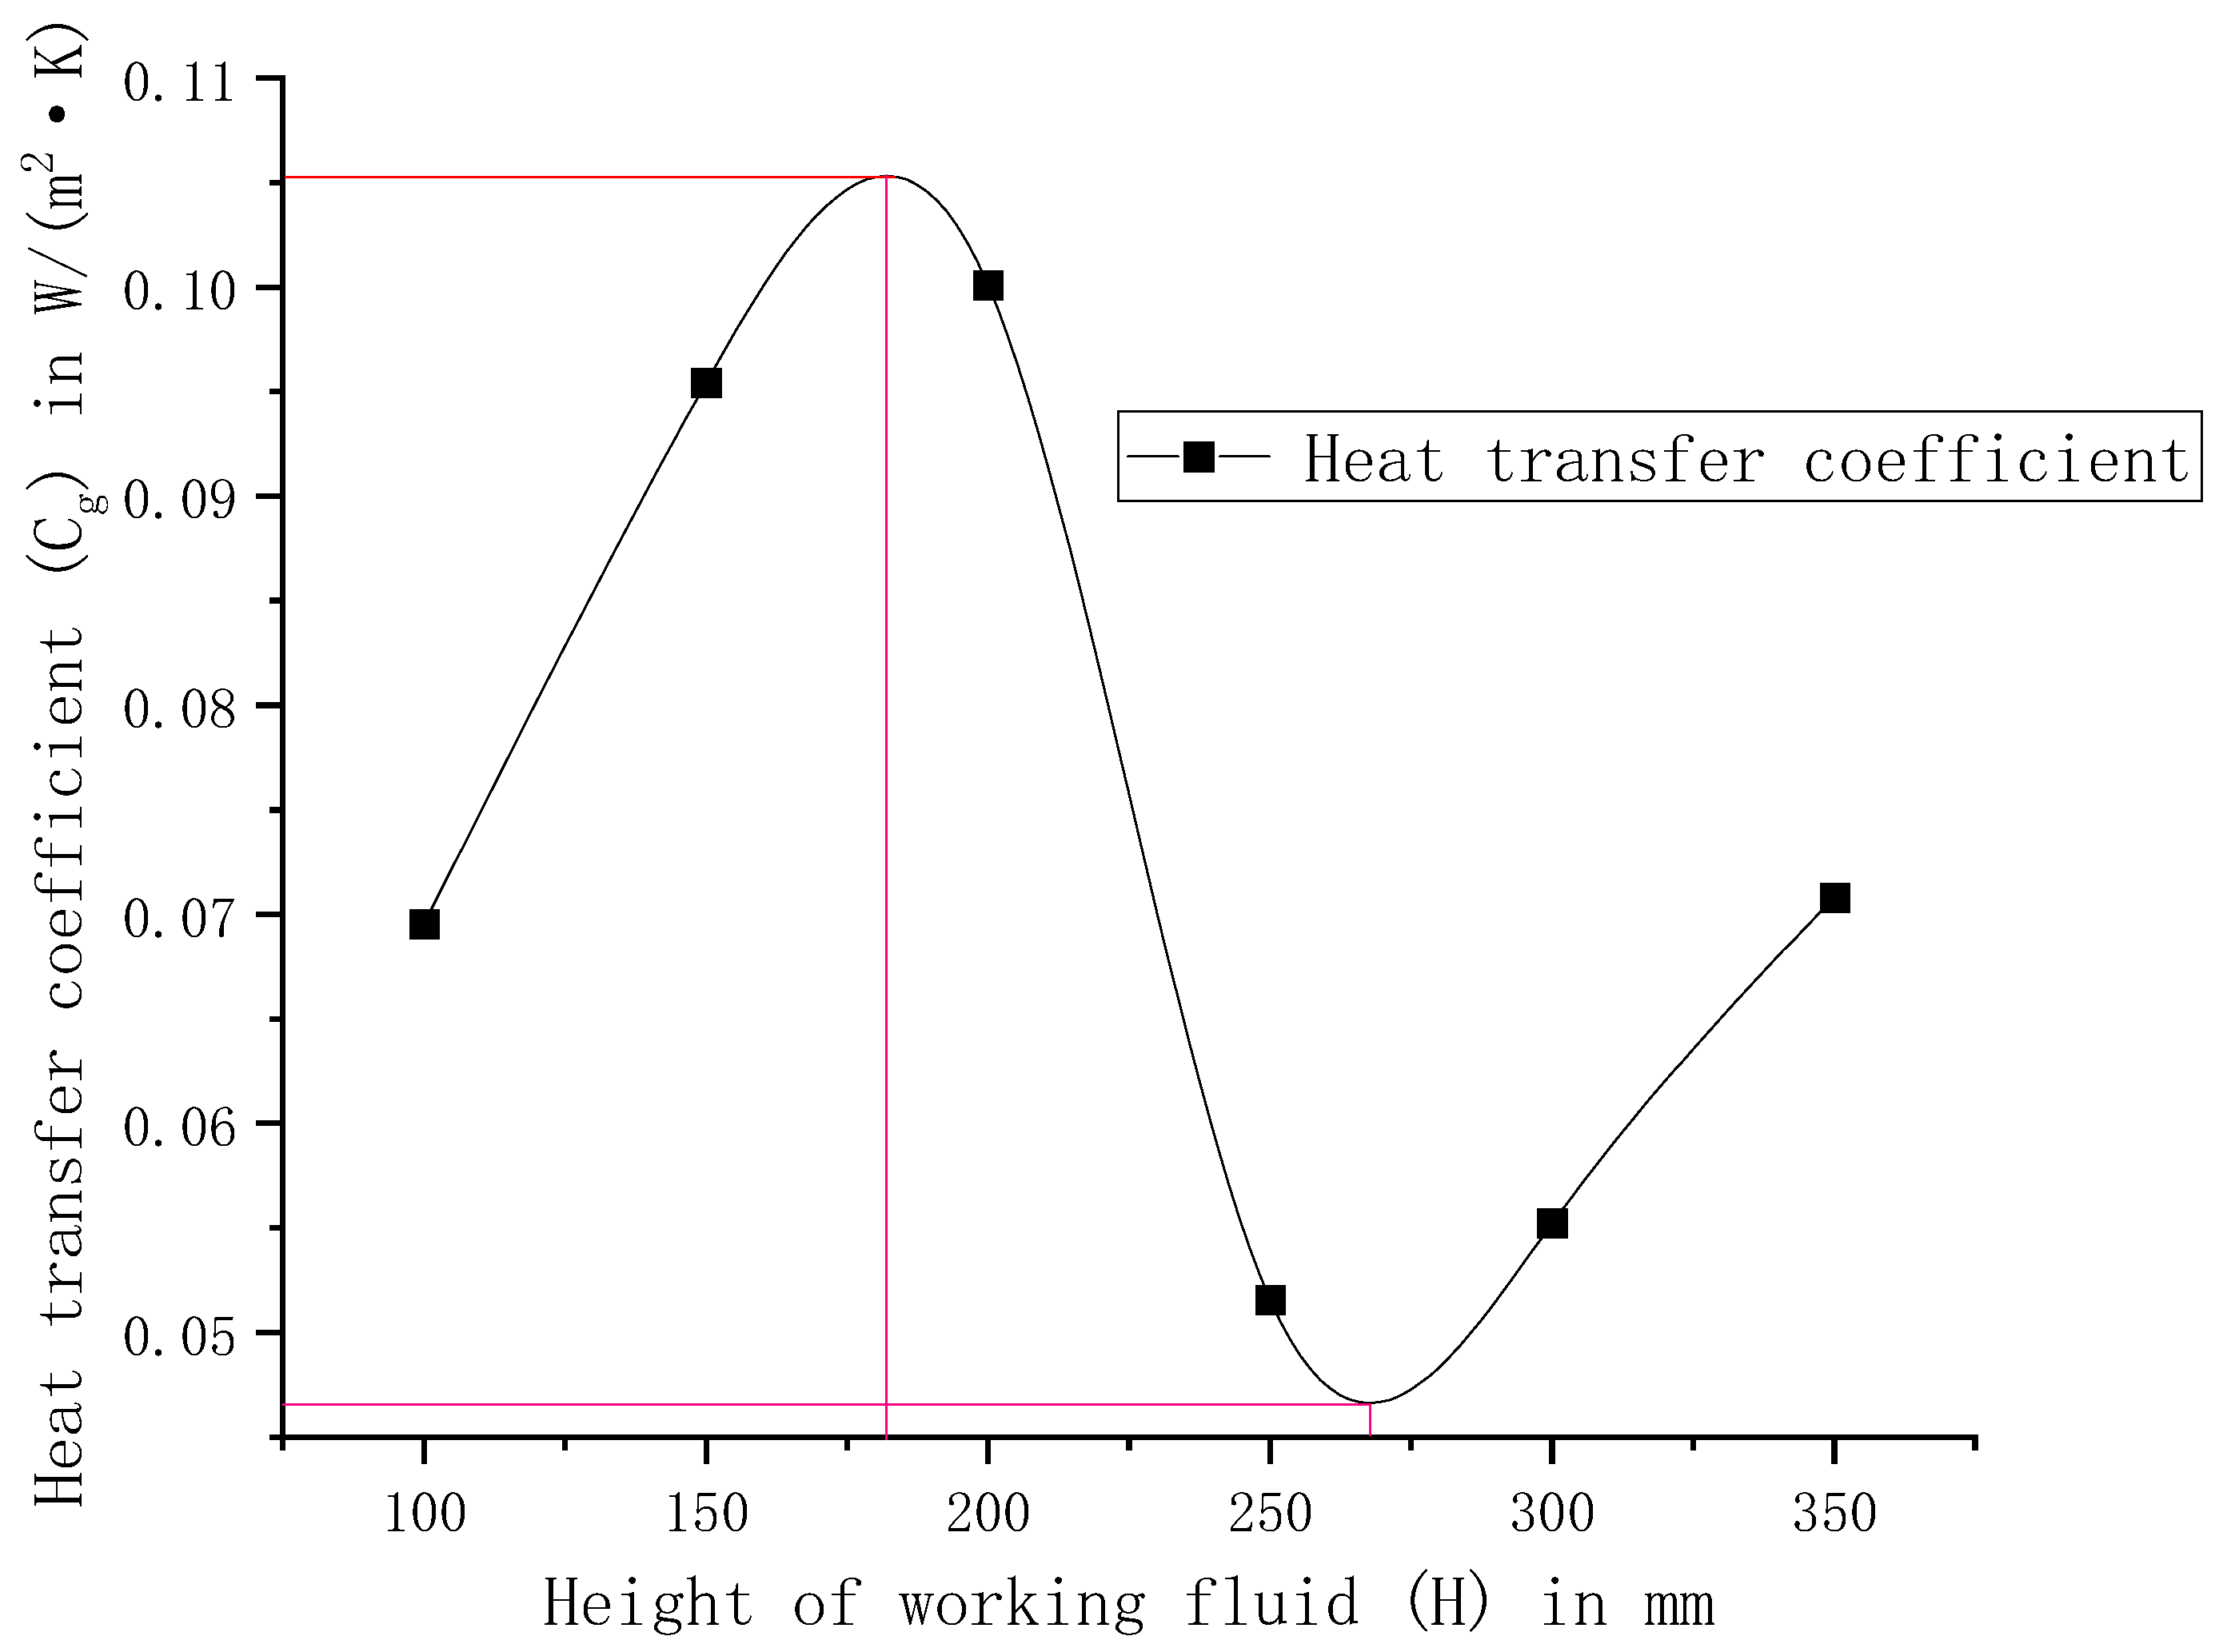
3.2. Working Fluid Height of the GHP

The inclination angle was adjusted to θ = 90°, and the heating temperature was set to T e = 373.15 K, with an initial absolute pressure of P = 0.002 MPa. The change in C g was observed while varying the working fluid height at H = 100, 150, 200, 250, 300, and 350 mm.
Based on Figure 5, it can be observed that C g initially increases with the increase in H from 100 mm to 180 mm, reaching a maximum value of 0.1051 W/(m2·K). However, beyond H = 180 mm, C g starts to decrease and reaches 0.047 W/(m2·K) at H = 270 mm. After that, as the height of the working fluid continues to increase, C g starts to increase again. The change range of the ordinate indicates that the influence range of the height of the working fluid on C g is from 0.047 to 0.1051 W/(m2·K). This phenomenon is related to the length of the heating section in the experiment. When H is low, the upper liquefied gas fails to return promptly after boiling and gasification, resulting in dry burning and a decrease in C g . Conversely, when H is high, the taller column of working fluid is heated and boiled together with the lower liquid, leading to an increase in C g as H increases.

3.3. Initial Absolute Pressure

The inclination angle was adjusted to θ = 90°, the heating temperature was set to T e = 373.15 K, the height of the working fluid was H = 150 mm, and the initial absolute pressure was P = 0.002 MPa. The change in C g was observed while varying the initial absolute pressure values at P = 0.002, 0.01, 0.015, 0.02, and 0.026 MPa.
Based on Figure 6, it can be observed that C g decreases as the P increases from 0.002 MPa to 0.026 MPa. The change range of the ordinate indicates that the influence range of the initial absolute pressure on C g is 0.002 to 0.098 W/(m2·K). This phenomenon is attributed to the fact that the initial absolute pressure influences the boiling point of the working fluid. When the initial absolute pressure approaches vacuum, the boiling point decreases. During the boiling and gasification of the working medium, the gas formed increases the absolute pressure inside the heat pipe, which suppresses further boiling and gasification.

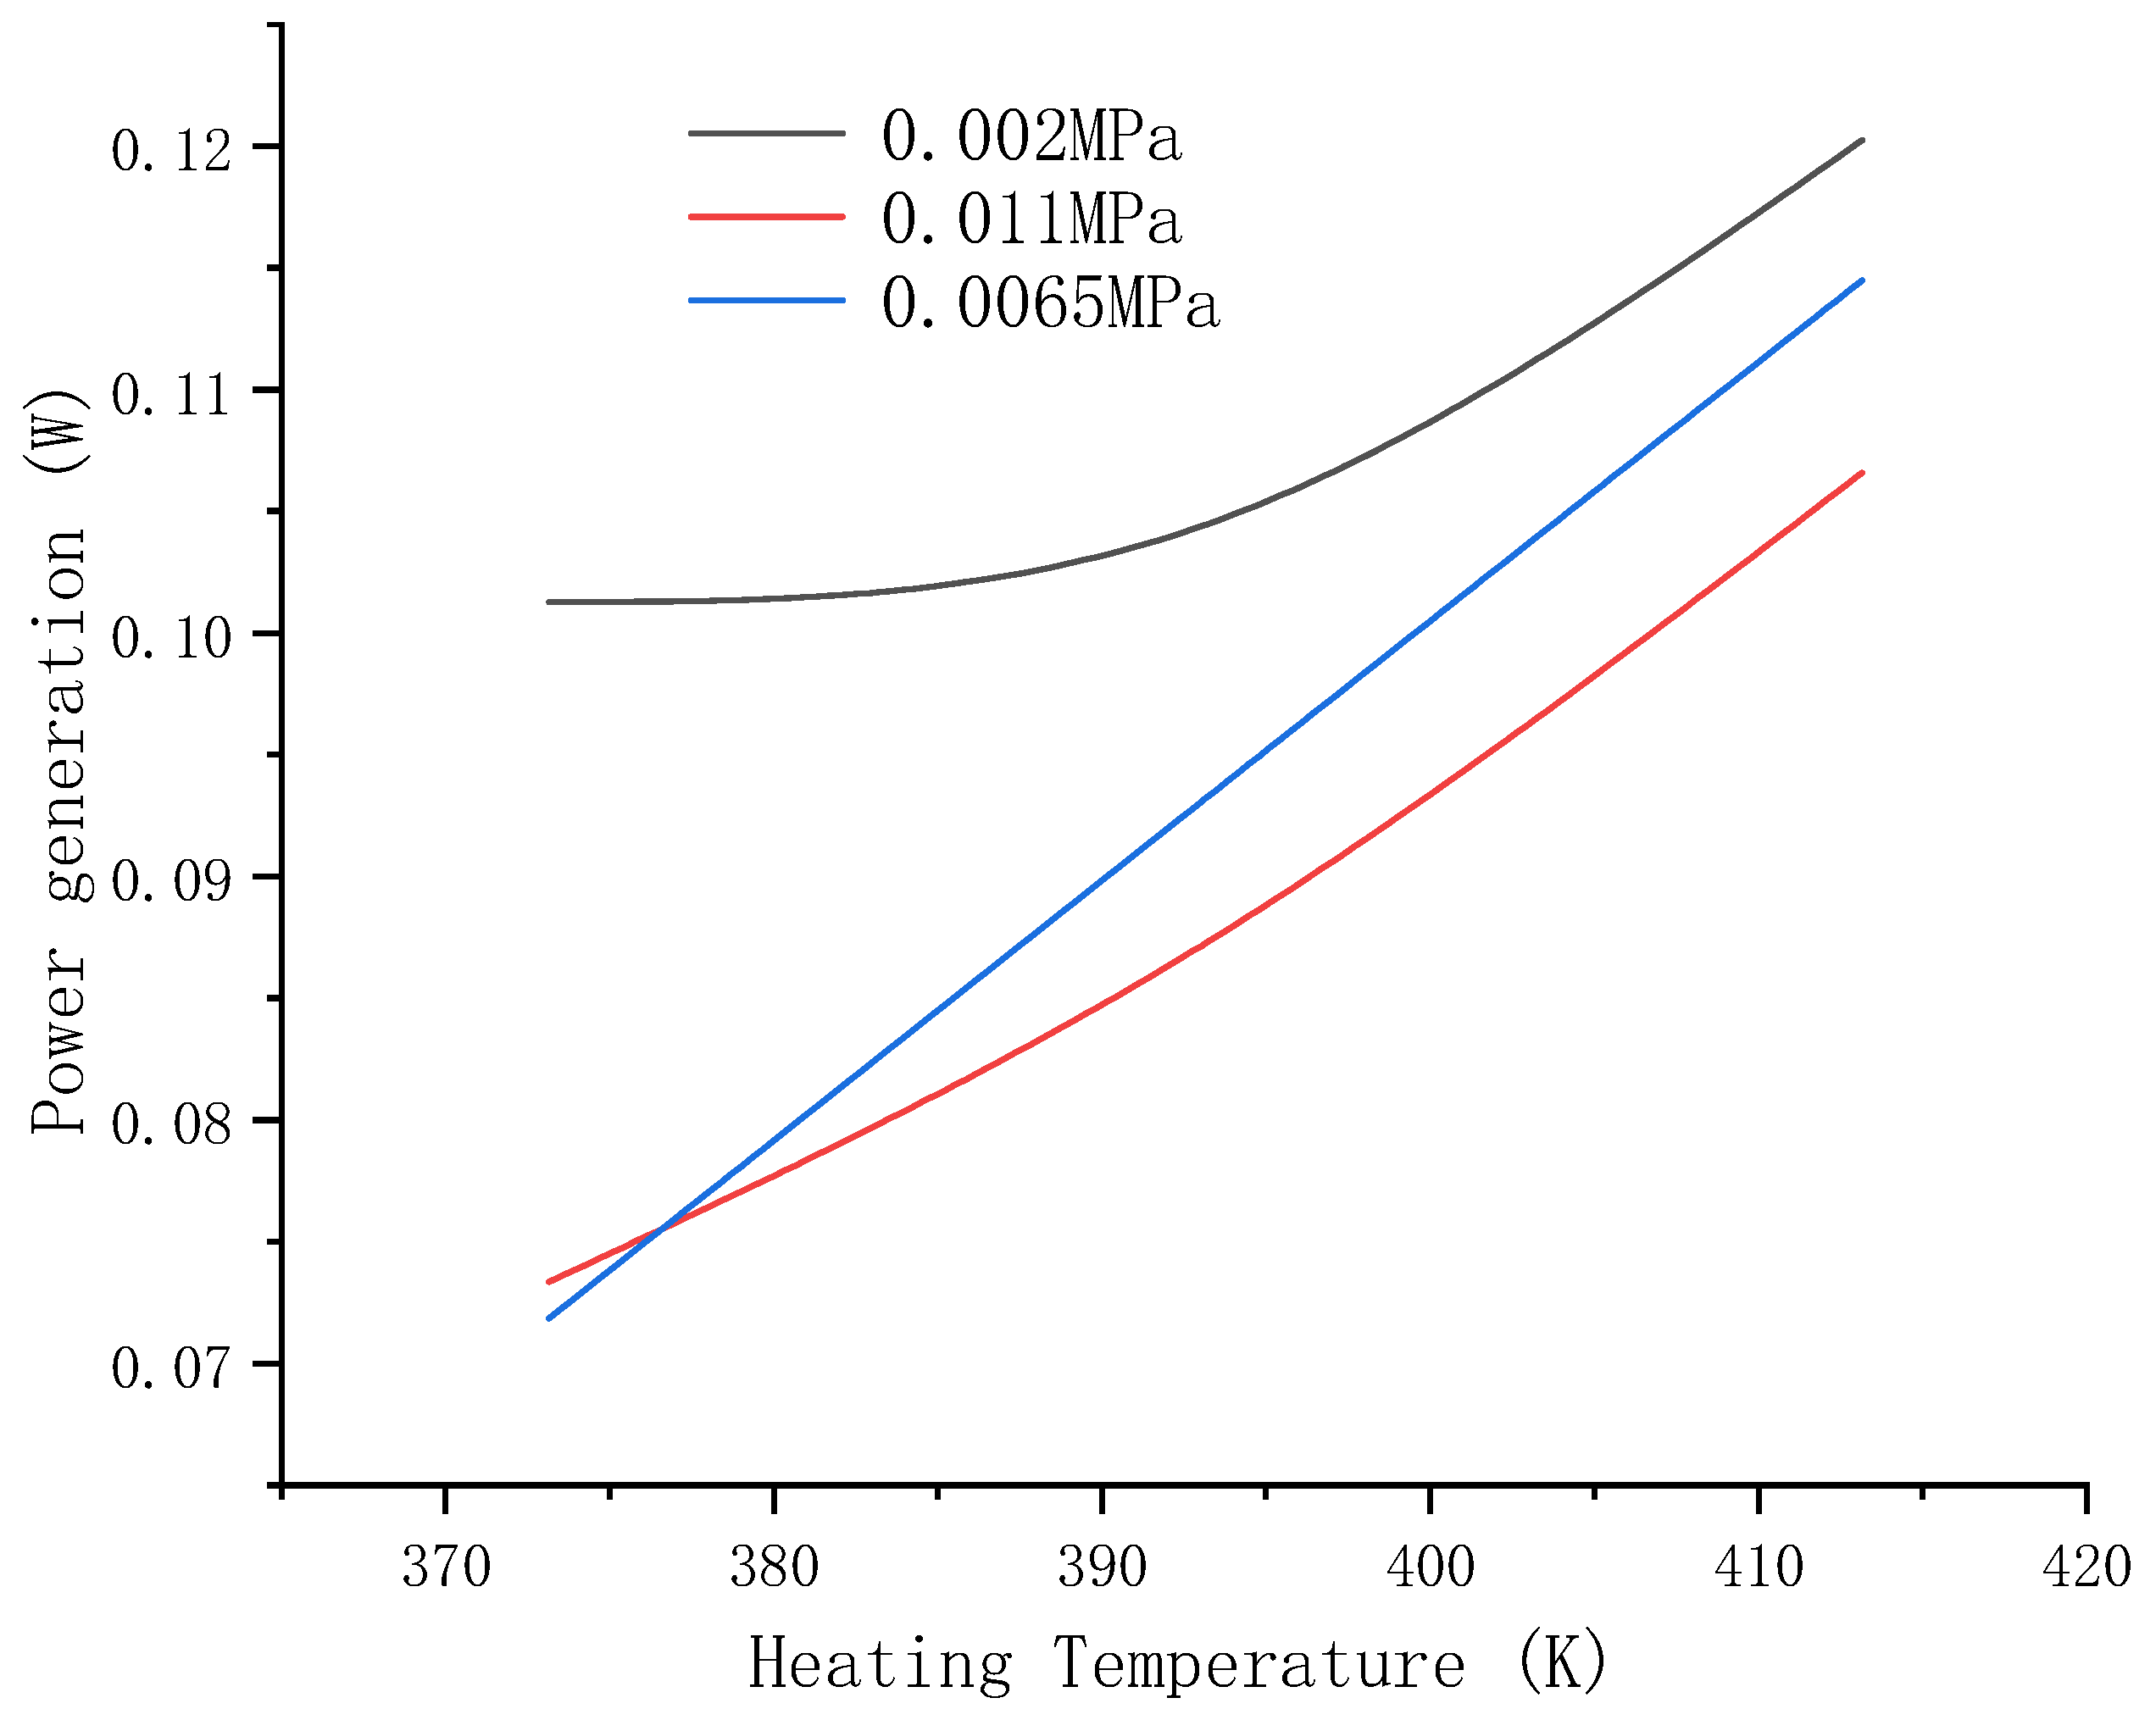
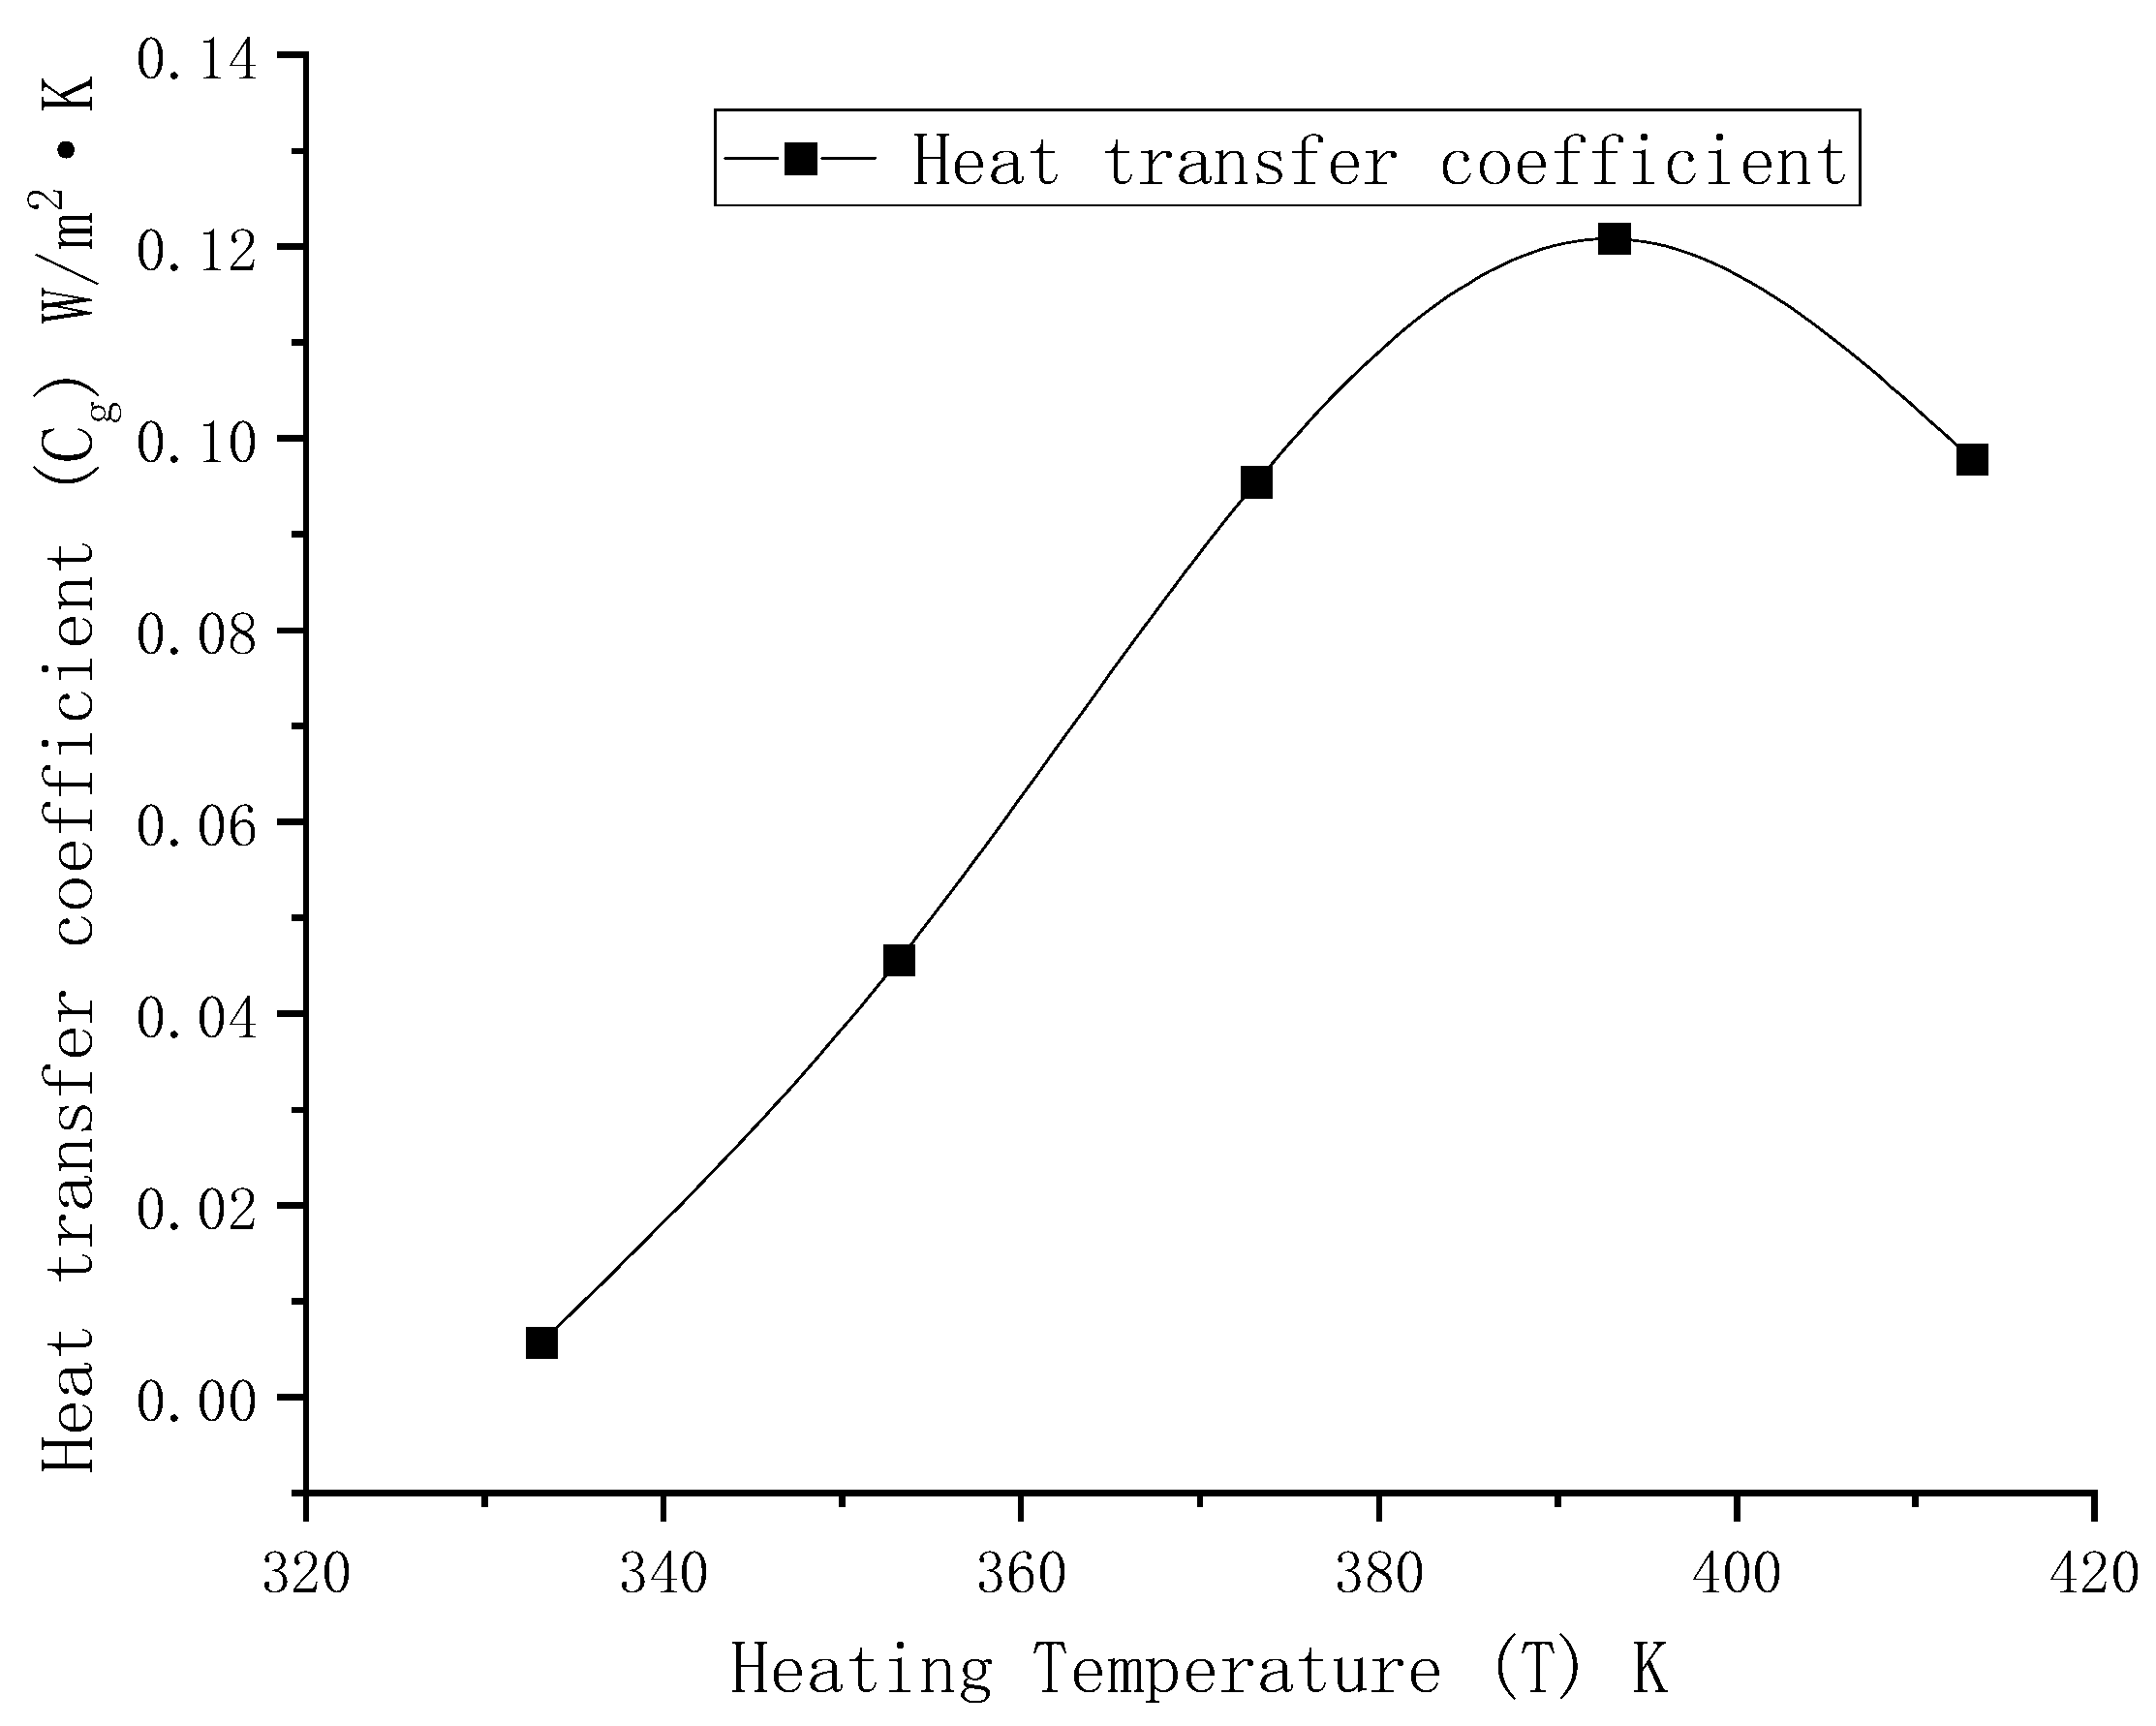
3.4. Heating Temperature

The inclination angle was adjusted to θ = 90°, the initial absolute pressure was P = 0.002 MPa, and the height of the working fluid was H = 150 mm. We observed the change in C g while varying the heating temperature at T e = 333.15 K, 353.15 K, 373.15 K, 393.15 K, and 413.15 K.
Based on Figure 7, it can be observed that C g increases with an increase in the heating temperature ( T e ) from 333.15 K to 393.15 K, reaching a maximum value of 0.1208 W/(m2·K). However, beyond T e = 393.15 K, C g starts to decrease as the heating temperature increases. The change range of the ordinate indicates that the influence range of the change in heating temperature on C g is from 0.006 to 0.1208 W/(m2·K). The increase in heating temperature results in an increase in the absolute pressure within the heat pipe, thereby impeding the boiling gasification process of the working fluid. At lower heating temperatures, the absolute pressure within the heat pipe experiences a slight increase, which leads to less inhibitory effect compared to the gasification effect.
Based on the analysis of the influence of GHP θ, H, P, and T on C g , the following influence ranges were observed: θ has an influence range from 0.044 to 0.071 W/(m2·K), H has an influence range from 0.047 to 0.1051 W/(m2·K), P has an influence range from 0.002 to 0.098 W/(m2·K), and T has an influence range from 0.006 to 0.1208 W/(m2·K). Among these parameters, θ has the least significant influence.
The Box–Benknken method, which a widely used experimental design method, can be employed to establish the relationship between multiple input variables and the corresponding output response. It is one of the experimental design methods tailored for multi-factor analysis with the aim of optimizing and selecting the combination of input factors to achieve the desired output response. Therefore, a response surface design test was employed based on the principle of central combination testing using the Box–Benknken methodology. Three factors that have a significant impact on C g , namely the H, P, and T, were selected. To obtain the numerical values of H, P, and T corresponding to the maximum C g , an experiment was conducted using a response surface analysis with three factors and three levels.

4. Response Surface Experiment

In order to ascertain the range of values for heating temperature, initial absolute pressure, and working fluid height in the response surface experiment, six sets of comparative tests were conducted.
From Figure 8a, on the one hand, it can be observed that at a heating temperature of 353.15 K, an initial absolute pressure of 0.011 MPa, and a height of working fluid of 100 mm, the voltage and current generated by the thermoelectric generator are small. On the other hand, when heating temperature, initial absolute pressure, and working fluid height all increase, i.e., heating temperature of 473.15 K, initial absolute pressure of 0.002 MPa, and height of working fluid of 250 mm, excessive internal pressure causes joint leakage in the tested GHP, resulting in test failure, as depicted in Figure 8b. Therefore, the factor values for the response surface design test should lie between the two values. Based on this, heating temperature, initial absolute pressure, and working fluid height were individually adjusted. The test results shown in Figure 8c–e indicate a significant improvement in thermoelectric power generation pressure, but with insufficient power generation current because the current limiting resistance of the current sensor is 20 Ω. These results are consistent with the basic law that current × 20 = voltage. The low temperature difference of the thermoelectric generator leads to a potential difference, but the charged ions accumulated at the positive and negative poles cannot meet the normal current demand. The test results obtained in Figure 8f are relatively satisfactory, leading to the determination that 353.15 K < T < 473.15 K, H > 100 mm, and P < 0.011 MPa, as shown in Table 3.
Following the principles of Box–Behnken central combination test design, the central group test was repeated for five groups. The test scheme and corresponding results are presented in Table 4.
A curve graph depicting variations in thermoelectric power generation with heating temperature under different initial absolute pressure conditions was prepared based on Table 4. This graph is presented as Figure 9. From the graph, it can be observed that a higher thermoelectric power generation is achieved at lower initial absolute pressures. This observation suggests that a smaller initial absolute pressure corresponds to better isothermal performance of the GHP, resulting in higher thermoelectric power generation.
The quadratic response surface regression analysis of Table 4 was conducted by using the Design-Expert software (version 12), and based on the relevant parameters of this experiment, a three-variable second-order regression model was established with C g as the dependent variable and H, P, and T as the independent variables. The model is as follows:
C g = b 0 + b 1 H + b 2 P + b 3 T + b 4 H P + b 5 H T + b 6 P T + b 7 H 2 + b 8 P 2 + b 9 T 2
Expressing the above equation in matrix function form, as shown in Equation (5):
C g = f ( X , B )
X = H , P , T , H P , H T , P T , [ H 2 , P 2 , T 2 ] .
B = b 1 , b 2 , b 3 , b 4 , b 5 , b 6 , [ b 7 , b 8 , b 9 ] .
Thus, the sum of squared errors of the regression equation is obtained as follows:
Q B = i = 1 n [ C g i f ( x i , B ) ]
Through iterative computation, the value of B that corresponds to the minimum value of Q B is denoted as B ^ . Therefore, the mathematical model of the three-variable quadratic regression is given by:
C g = 1.0463 + 0.003249 H 19.09121 P + 0.003415 T 0.013089 H P 6.9987 × 10 6 H T + 0.039641 P T 8.75273 × 10 7 H 2 + 361.04901 P 2 1.57527 × 10 6 T 2
Table 5 shows the analysis of variance test results for the power coefficient of thermoelectric power generation per unit area. An F-value of 27.94 implies the model is significant; there is only a 0.01% chance that an “F-value” this large could occur due to noise. A p-value less than 0.05 indicates that model terms are significant. In this case H, P, T, HP, HT, PT, H2, P2, and T2 are significant model terms. Values greater than 0.05 indicate that model terms are not significant. A “lack of fit F-value” of 5.16 implies that the lack of fit is not significant. The final empirical relationship was constructed using only these coefficients [31].
Table 6 shows that the R2-squared value of 0.9879 and the adjusted R2-squared value of 0.9723 are very close, and the difference between the predicted R2-squared and the adjusted R2-squared values is less than 0.2. This shows that the model fits well.
In this experiment, a normal probability map of standardized residuals was generated to evaluate the normality assumption, as illustrated in Figure 10. If the underlying error distribution follows a normal distribution, the graph exhibits a straight-line pattern. The analysis of variance is resilient to deviations from the normality assumption, thus confirming the reliability of the prediction model.
Based on the multivariate quadratic response surface regression model and response surface analysis, it is evident that the power coefficient of thermoelectric power generation per unit area is significantly correlated with heating temperature, initial absolute pressure, and working fluid height, as depicted in Figure 11. Holding the initial absolute pressure constant, and higher heating temperatures and working fluid heights lead to larger power coefficients of thermoelectric power generation per unit area. This relationship is evident from the two-dimensional contour distribution. Among the factors considered, heating temperature has a more pronounced impact on the power coefficient of thermoelectric power generation per unit area. This can be attributed to the fact that as the working fluid height increases, to a certain extent, the working medium inside the GHP experiences less dry burning and liquid film formation due to the temperature rise. Consequently, the gasification and liquefaction efficiency of the working medium improve with increasing temperature.
Within a certain range, while keeping the heating temperature constant, the overall power coefficient of the thermoelectric power generation per unit area and the initial absolute pressure decrease as the working fluid height increases. Based on the two-dimensional contour distribution analysis, it is observed that, when the initial absolute pressure ranges between 0.002 MPa and 0.0065 MPa, the power coefficient of thermoelectric power generation per unit area and the working fluid height both exhibit minimal influence. This can be attributed to the fact that, within this range, considering the isothermal performance of the GHP, the temperature of the heat pipe’s outer wall remains essentially consistent with the evaporation section’s temperature. The gasification process of the working medium is primarily dependent on the heating temperature rather than the working fluid height. Specifically, when the working fluid height ranges from 200 to 240 mm and the initial absolute pressure is between 0.0065 and 0.011 MPa, the power coefficient of thermoelectric power generation per unit area shows almost no correlation with these two parameters, but is solely associated with the heating temperature. This observation arises from the heat pipe having reached a relatively stable operational state in this range, ensuring stable transmission of heat from the heating section to the evaporation section.
When the working fluid height remains constant, the power coefficient of thermoelectric power generation per unit area increases as the heating temperature rises, and it decreases as the initial absolute pressure decreases. Analysis of the two-dimensional contour distribution reveals a relatively uniform contour pattern. Compared to the working fluid height factor, the combined influence of heating temperature and initial absolute pressure exerts a greater impact on the power coefficient of thermoelectric power generation per unit area in the GHP system. This can be attributed to the fact that the initial absolute pressure has the ability to alter the boiling point of the working medium, while the heating temperature directly affects the temperature of the evaporation section due to the isothermal performance characteristics of the heat pipe.
Table 7 presents the contribution rate of each factor to the power coefficient of thermoelectric power generation per unit area. Among the factors considered, heating temperature exhibits the highest contribution, accounting for 28.54% of the power coefficient, whereas working fluid height demonstrates the smallest contribution, making up only 2.71% of the power coefficient.
Table 8 reveals that the maximum power coefficient of thermoelectric power generation per unit area, as calculated by the Design-Expert software, is 0.122981 W/(m2·K). This occurs when H = 200.001 mm, P = 0.002 MPa, and T = 413.15 K.

5. Field Industrial Test

Based on the theoretical research results, three GHPs were fabricated with a total length of 6 m, a diameter of 108 mm, and an internal working fluid height of 1200 mm. Temperature difference power generation devices (40 × 40 mm) were also installed. Industrial experiments were conducted at the open waste rock heap in Maoergou Coal Mine, Shanxi Province, China, as shown in Figure 12.
Figure 13 illustrates the continuous observations of the GHP for a period of 30 days, including the temperature of the heat dissipation section and the power output of the temperature difference power generation. These observations were conducted using manual monitoring methods.
Based on the field experimental data, it can be observed that after inserting the GHPs into the coal gangue hill, the temperature of the heat dissipation section gradually increases and stabilizes after four days. During the operation of the GHPs, the temperature curve fluctuates, which is influenced by the environmental temperature and wind speed. The power output of the temperature difference power generation device exhibits a similar trend as the heat dissipation section temperature of the GHPs. Due to the influence of environmental wind speed, the power output shows irregular fluctuations but, overall, remains within the range of 0.1~0.12 W. This is consistent with the results obtained from the laboratory analysis; thus, this validates the feasibility of using GHPs for coal gangue hill remediation and the accuracy of temperature difference power generation.
The size of the thermoelectric generator installed on the condensation section of the GHP is 40 × 40 mm, and the selected power output is 0.1 W, as calculated in the previous text. The diameter of the condensation section of the GHP is 108 mm, with a height of 2 m. Now, considering the entire condensation section utilizing thermoelectric generator modules for electricity generation, the amount of electricity generated is:
0.1 × 10⁸ × π × 2000 40 × 40 = 42.39   W
According to the actual conditions at the Maoergou coal mine site, the spacing between the installations of GHPs is 1.5 m. Therefore, the power density generated by utilizing the thermoelectric power generation method is:
42.39 1.5 × 1.5 = 18.84   W / m 2
According to on-site investigations, the area of the Maoergou coal mine is about 5.6 km2. If the mine were to generate electricity entirely through temperature difference power generation, it could produce an annual energy output of 3.3 × 10⁹ J. Although this calculation method is relatively rough and ignores environmental conditions and the uneven distribution of temperature fields within the gangue hill, such a huge amount of energy could effectively solve the current difficulties of electricity supply in surrounding areas, while also reducing the emission of waste gas heat.

6. Conclusions

(1)
In a laboratory, we established a GHP test system to investigate the effects of various independent variables on the power coefficient of thermoelectric power generation per unit area, where the dependent variable is the power coefficient. The four independent variables tested are tilt angle, heating temperature, initial absolute pressure, and working fluid height. Single-factor tests were conducted, and the results indicated that the tilt angle variable had less impact on the power coefficient of thermoelectric power generation per unit area than the other three variables. Therefore, heating temperature, initial absolute pressure, and working fluid height are identified as the more significant independent variables requiring further investigation.
(2)
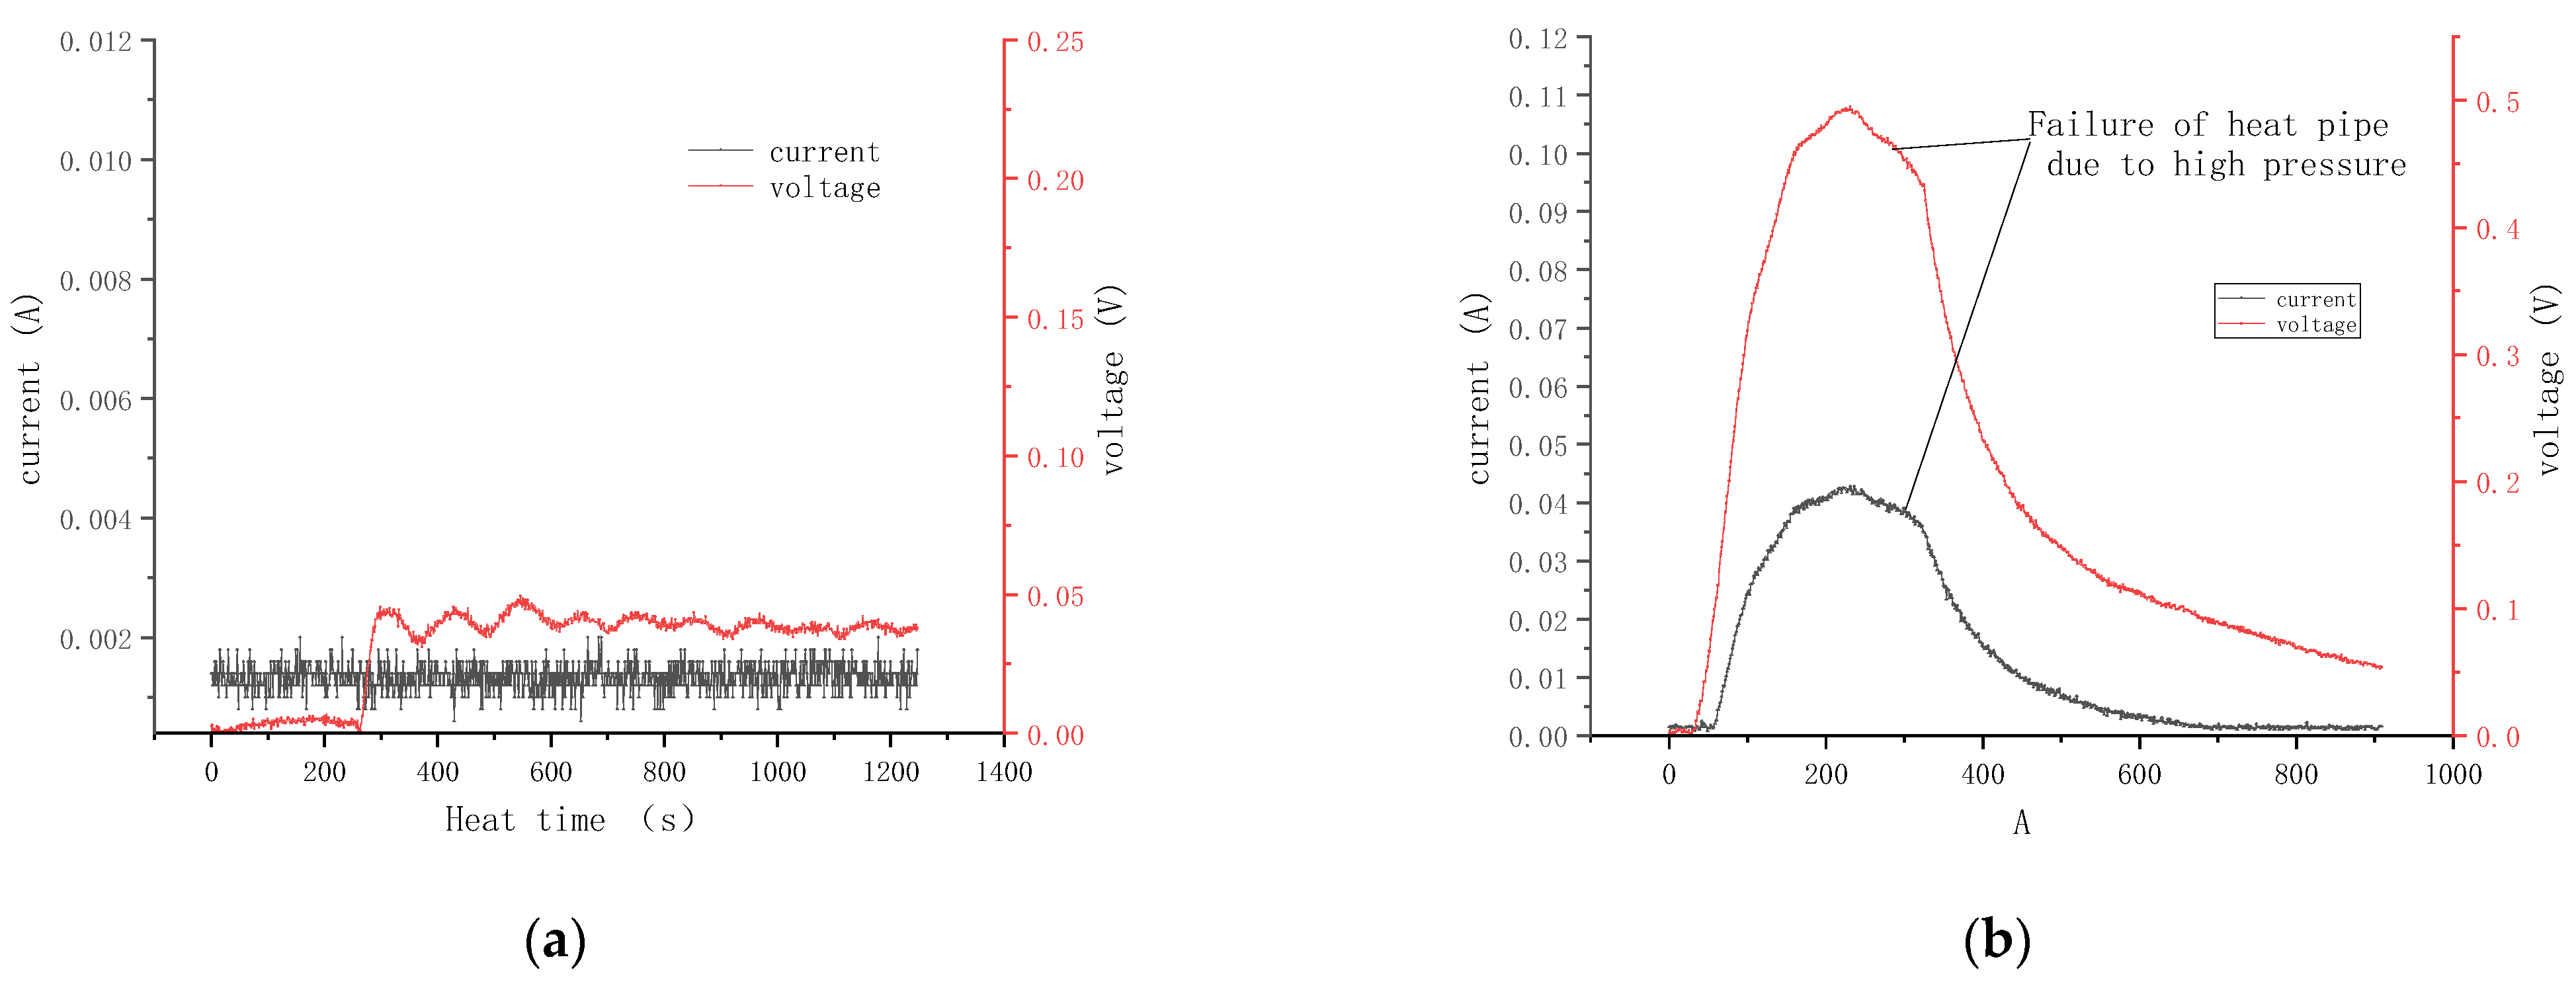
Through six sets of comparative tests, the value ranges for heating temperature, initial absolute pressure, and working fluid height, in this study, were analyzed and determined based on measurement indices that exhibited stable voltage and current output from the thermoelectric generation sensor. Based on these findings, the values are 353.15 K < T < 473.15 K, H > 100 mm, and P > 0.011 MPa.
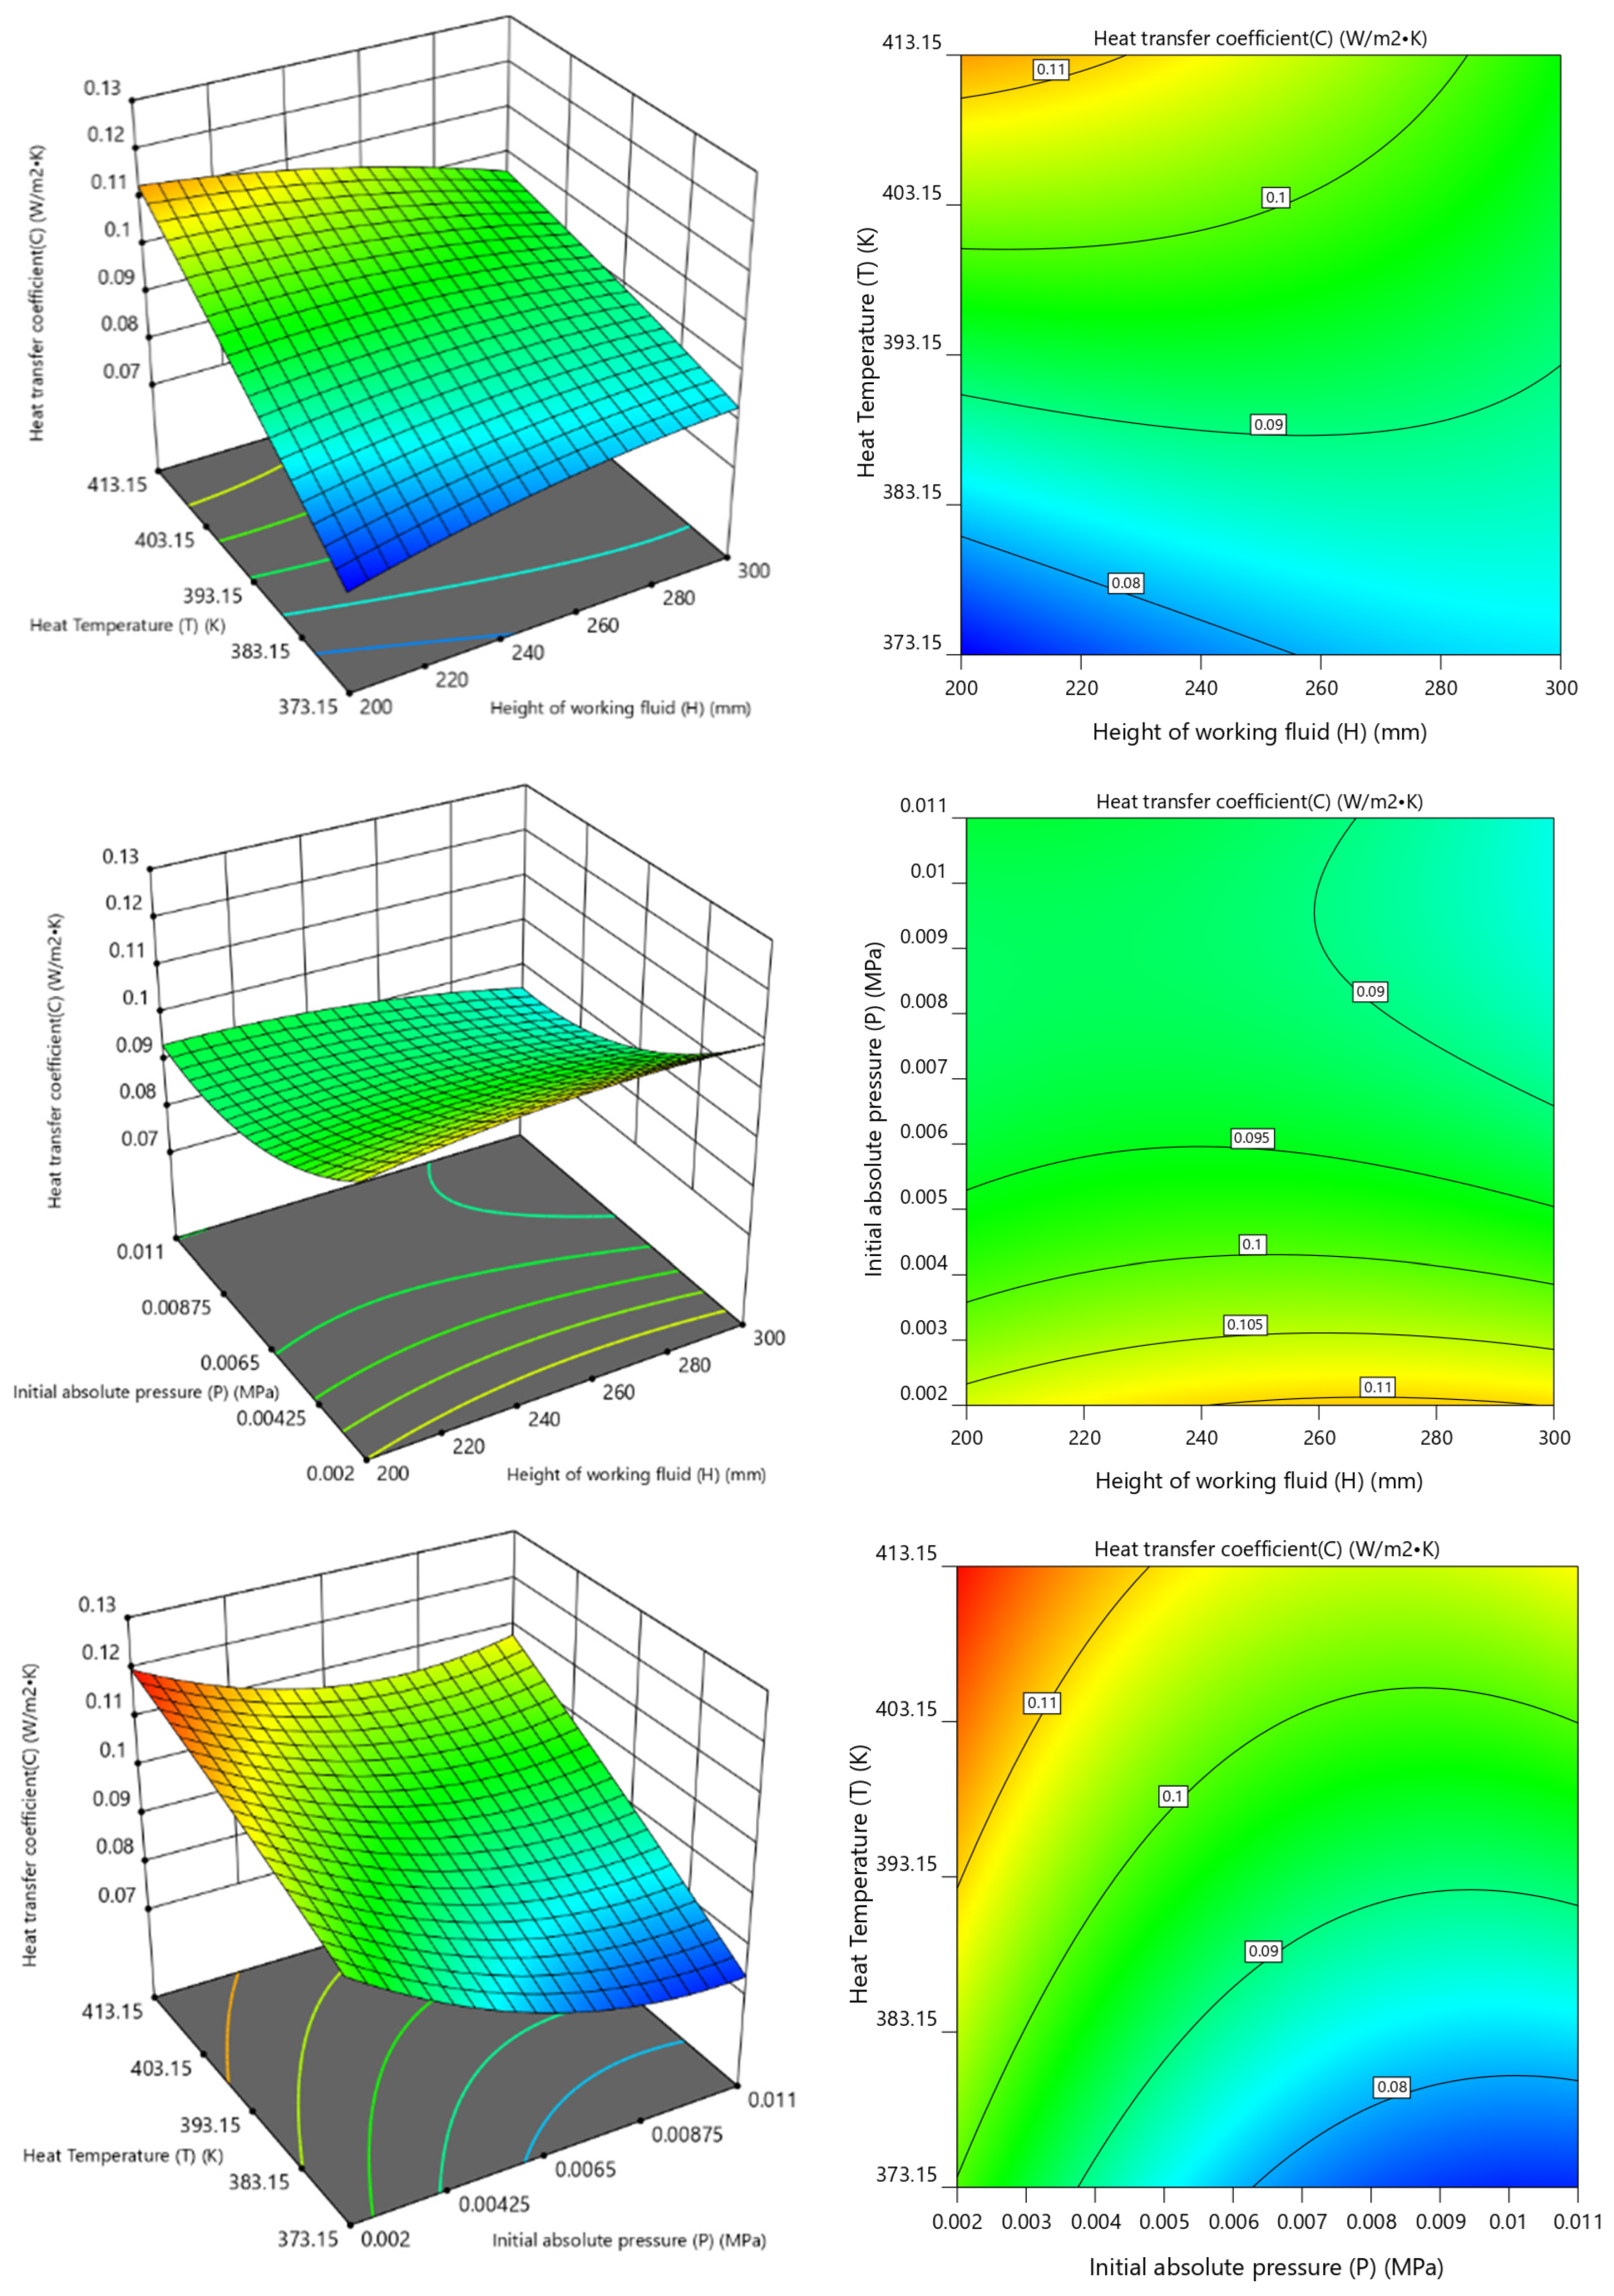
(3)
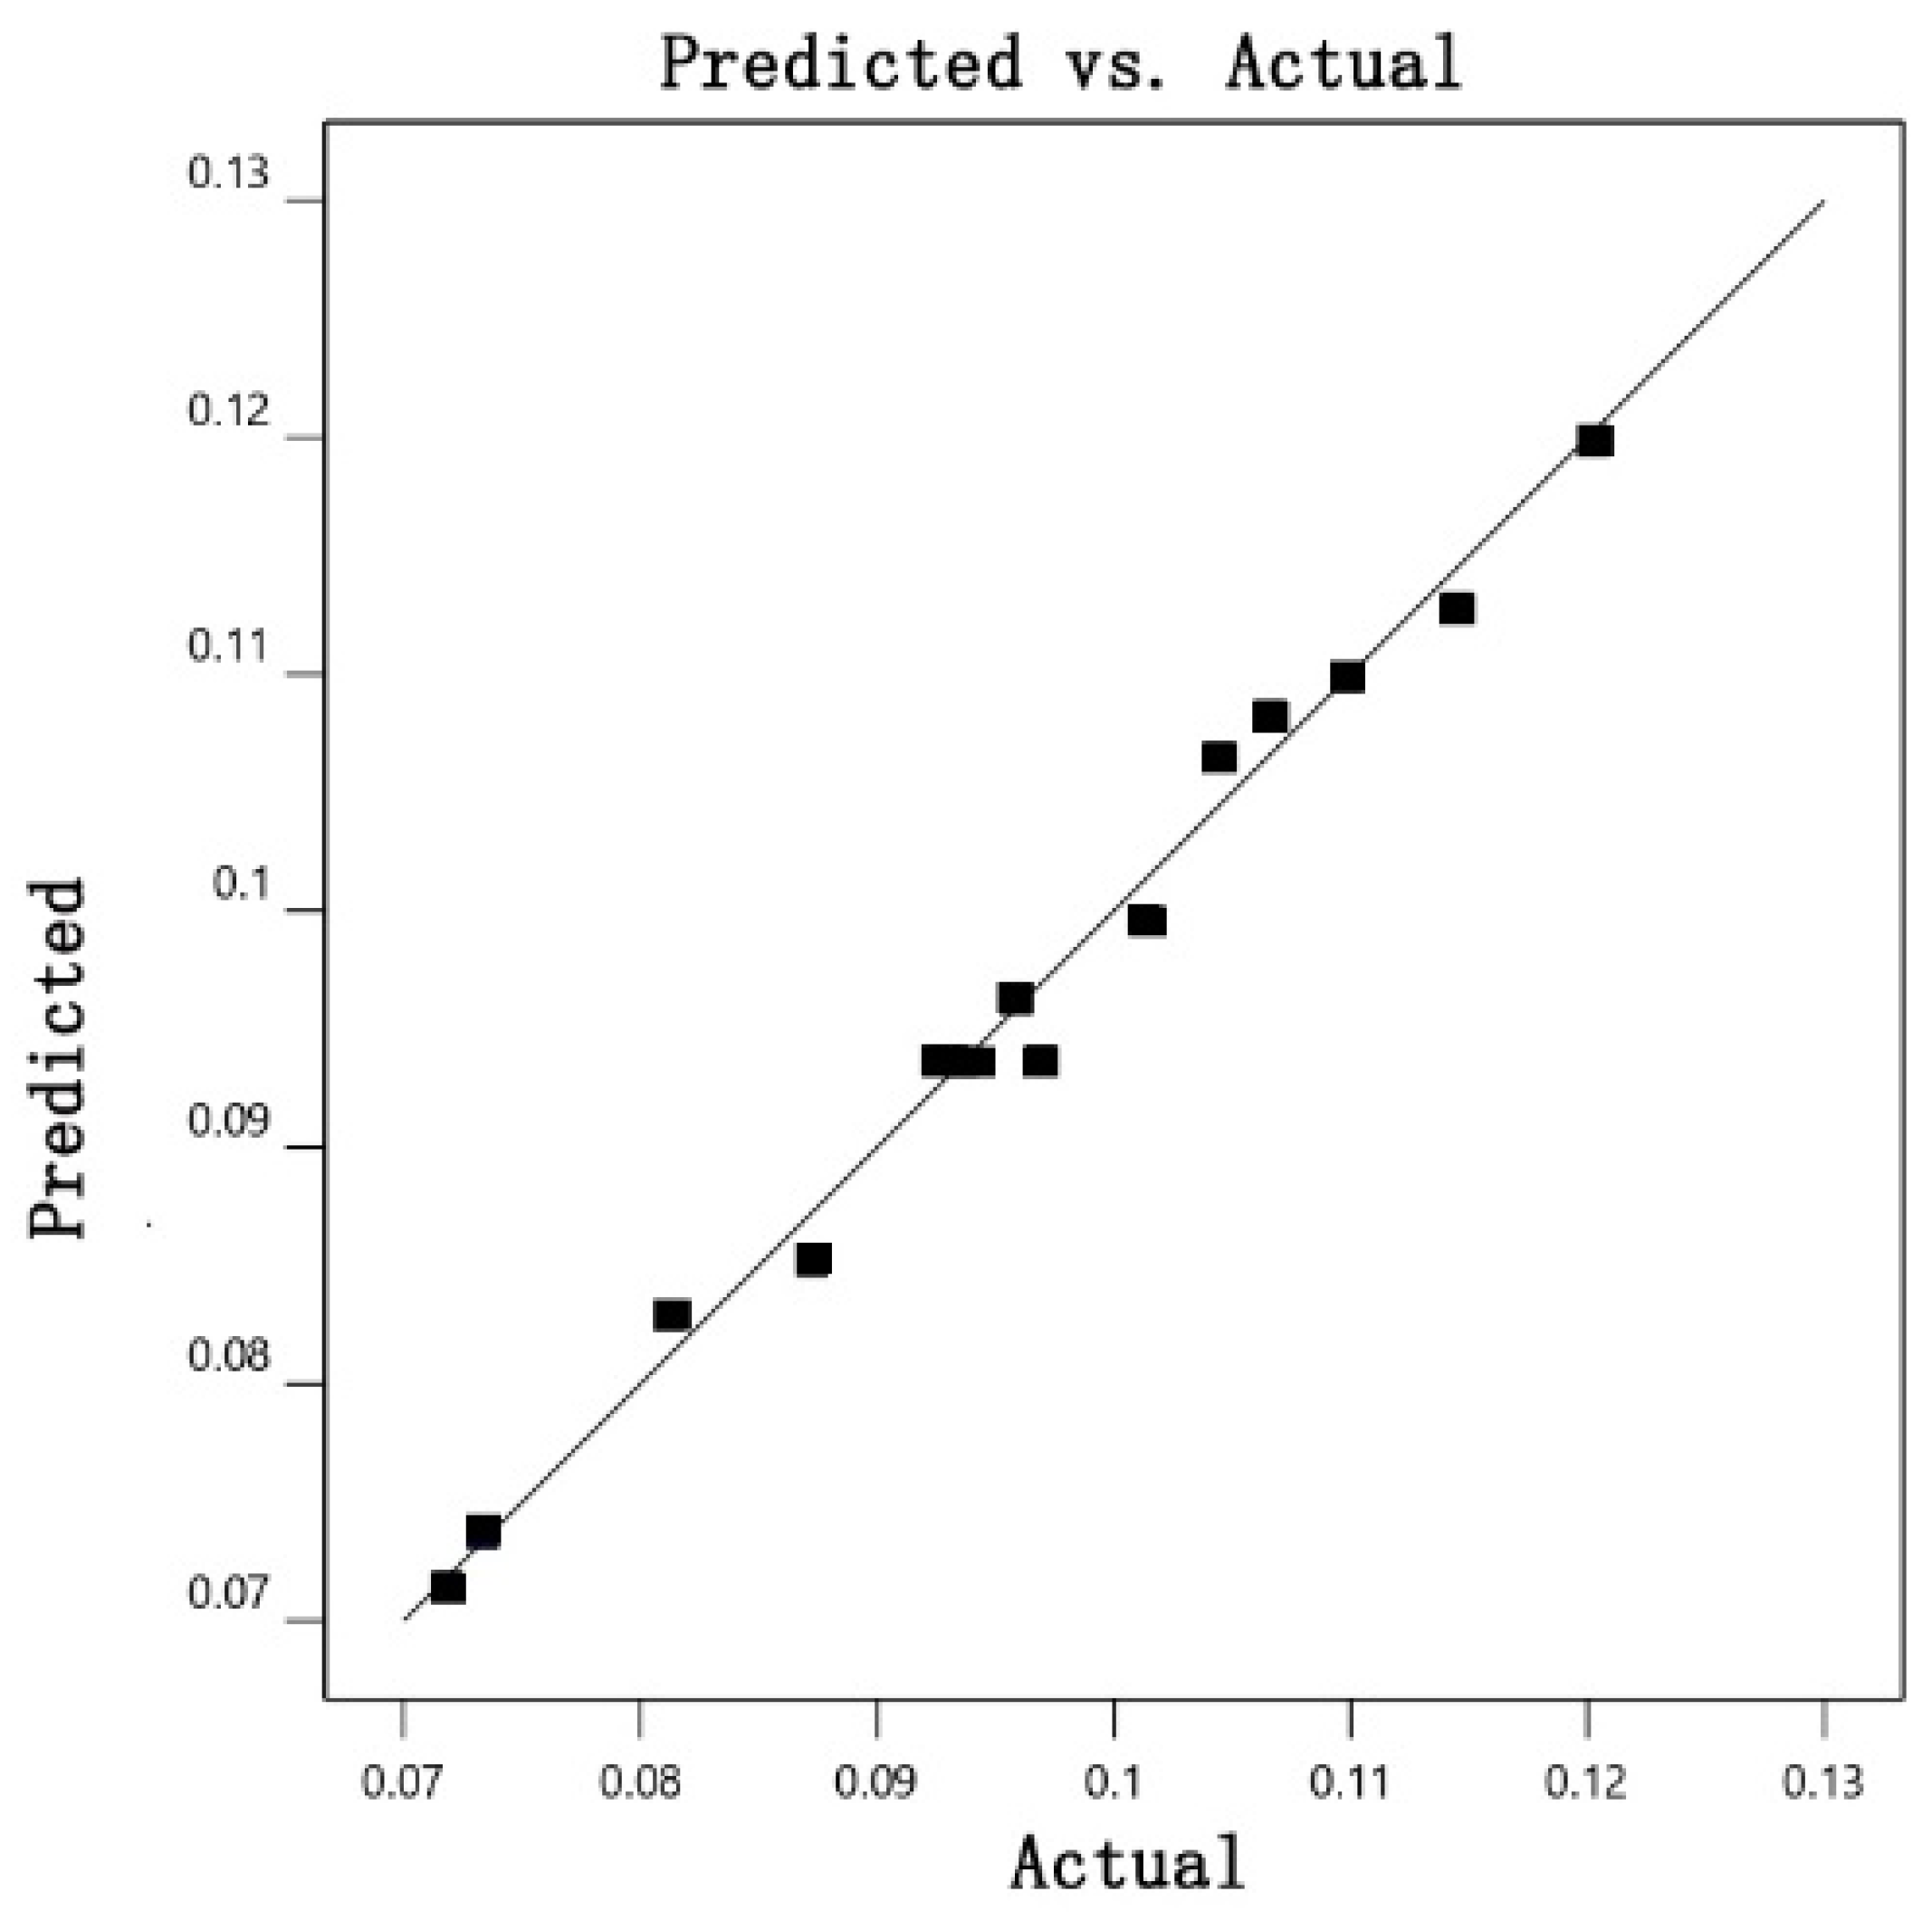
The three-factor three-level response surface method was employed to optimize the parameters influencing the power coefficient of thermoelectric power generation per unit area. A multiple quadratic response surface regression model was established, and the contribution of each factor to the power coefficient was analyzed. The test results indicate that the power coefficient of thermoelectric power generation per unit area is maximized at H = 200.001 mm, P = 0.002 MPa, and T = 413.15 K, with a value of 0.122981 W/(m2·K).
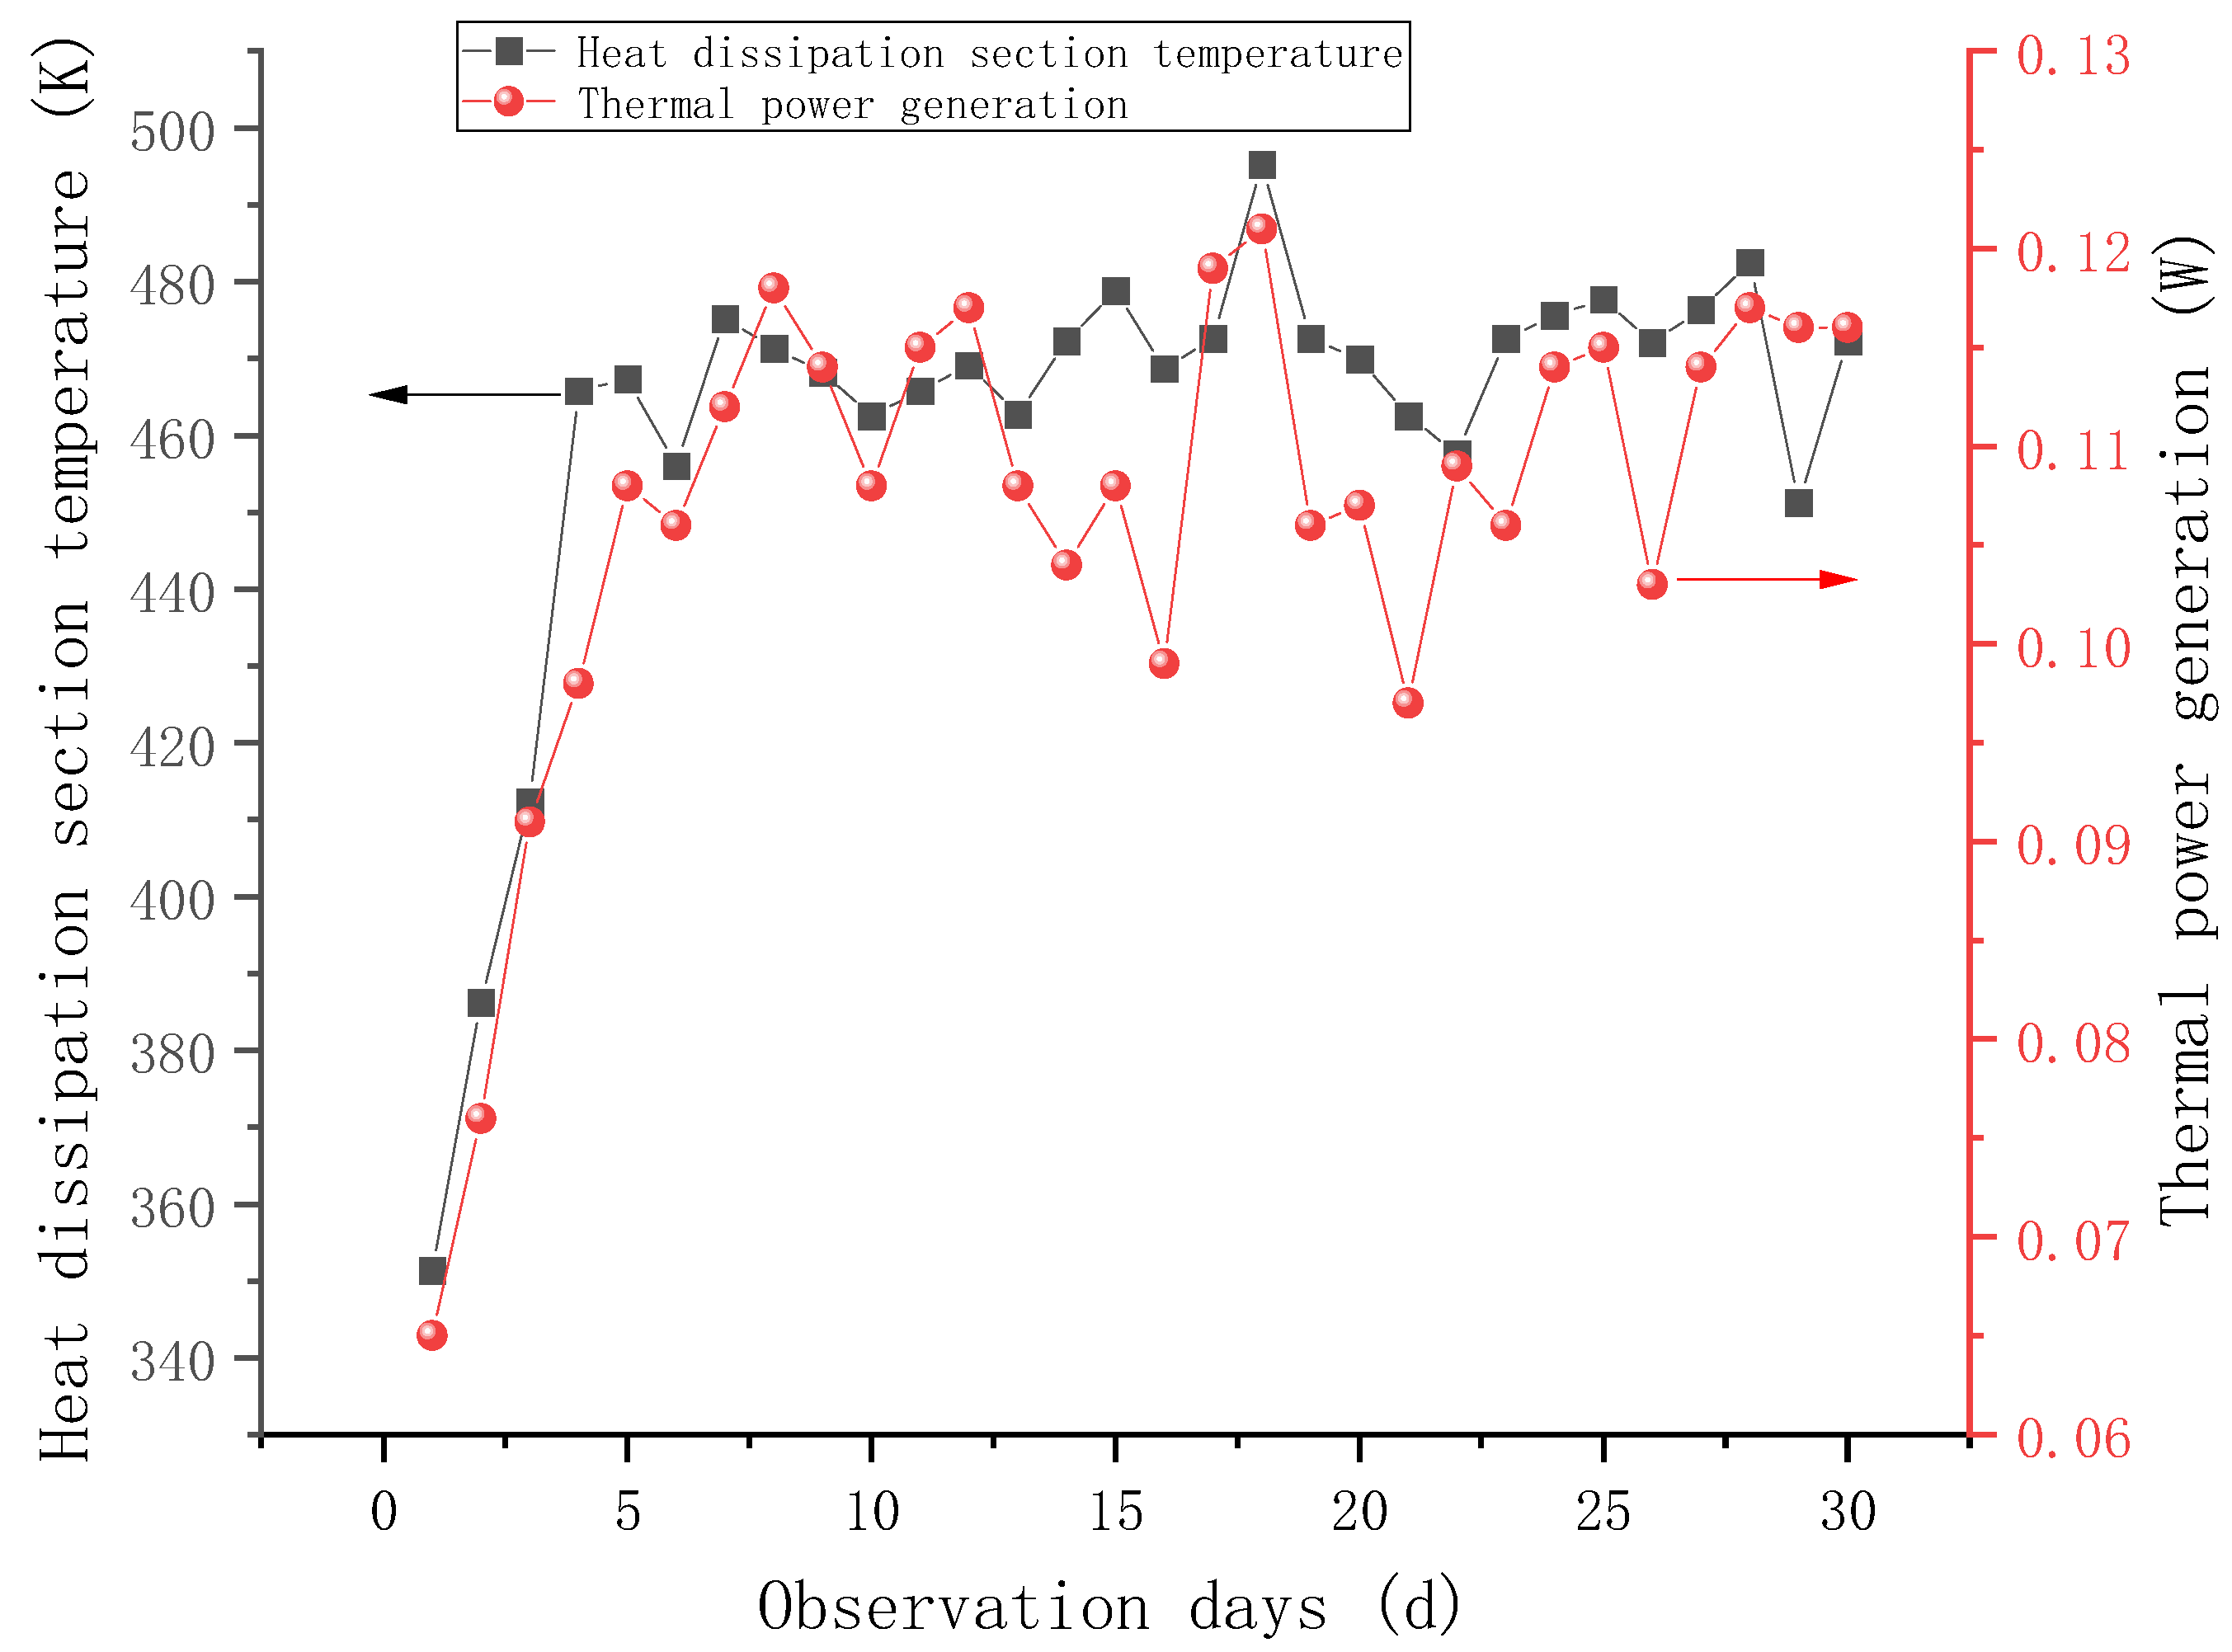
(4)
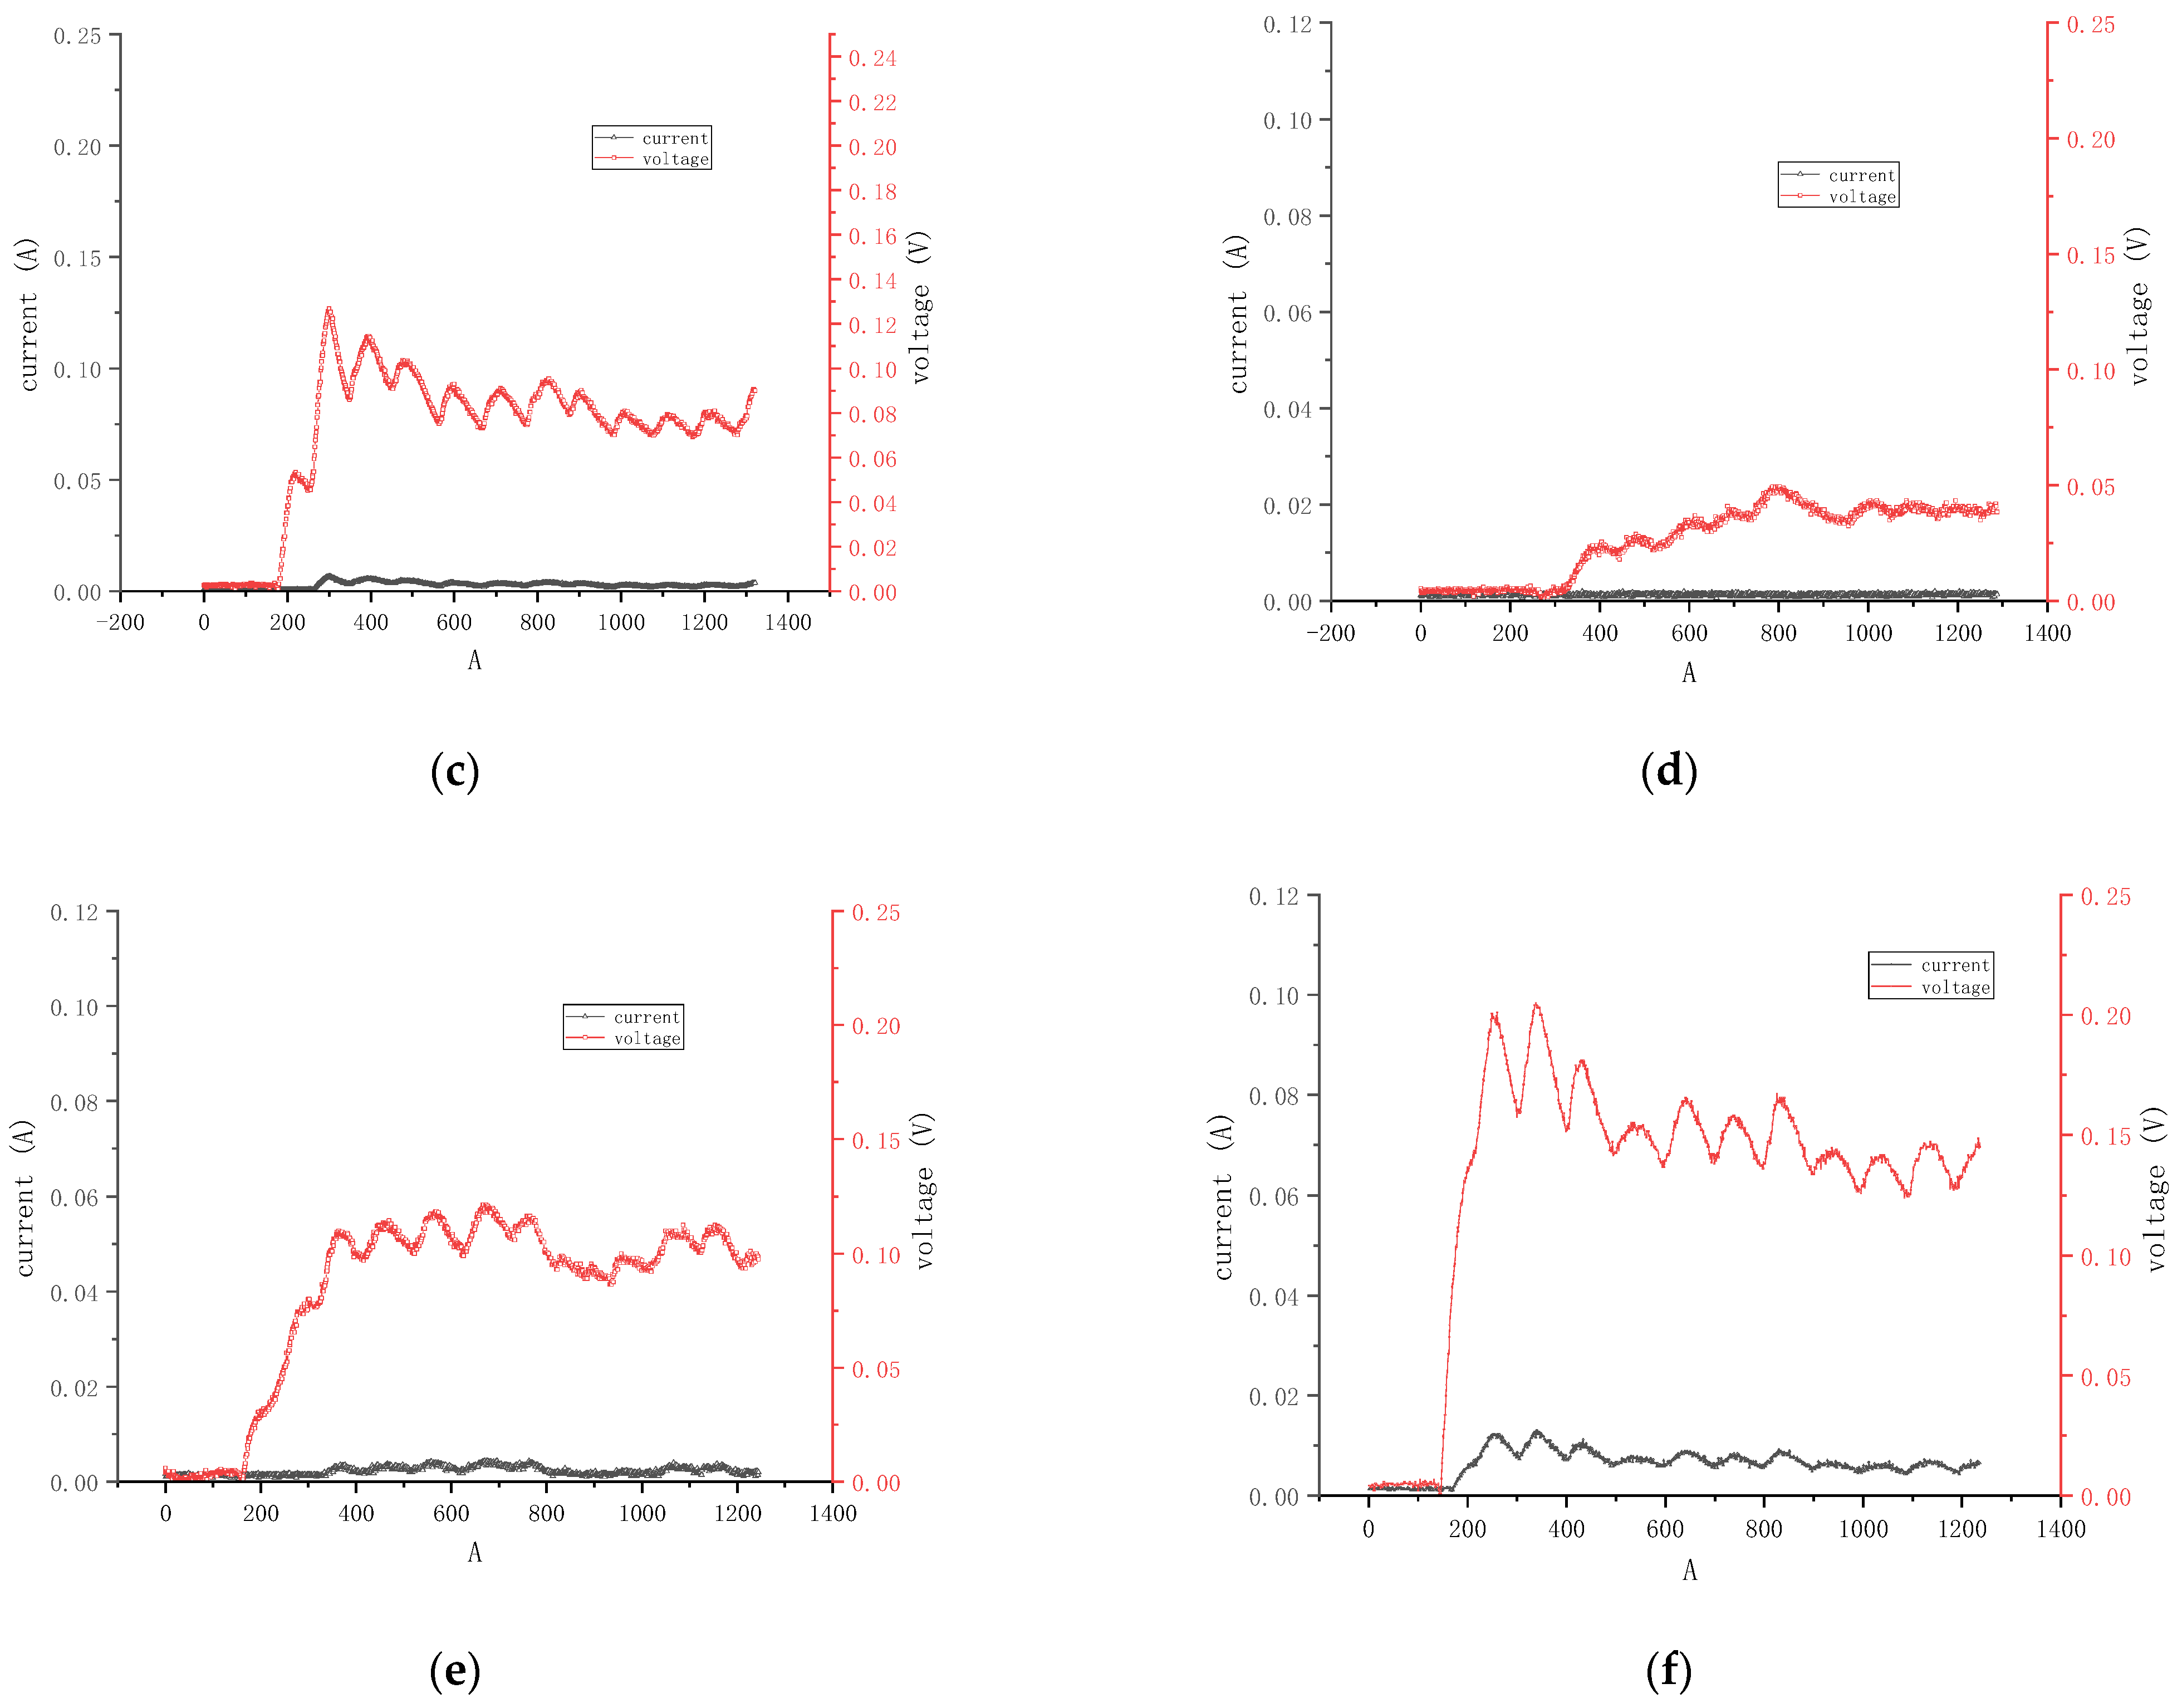
A test system for coal gangue hill GHP temperature difference power generation was established. The temperature difference between the heat dissipation end of the GHP and the surrounding ambient temperature was utilized for power generation. This served as a measure of the heat dissipation efficiency of the GHP. Additionally, a solution was provided for secondary utilization of abandoned electrical energy from coal gangue hills through temperature difference power generation. During the research process, it was observed that the voltage generated by temperature difference power generation fluctuated in a regular pattern due to the internal circulation of the working fluid in the GHP, as shown in Figure 7. This can reflect the operational efficiency of the GHP to some extent. However, in terms of power generation output, the amount of electricity generated in this experiment was relatively small. Therefore, in future experiments, it is necessary to increase the area of the temperature difference power generation unit to enhance the power output.
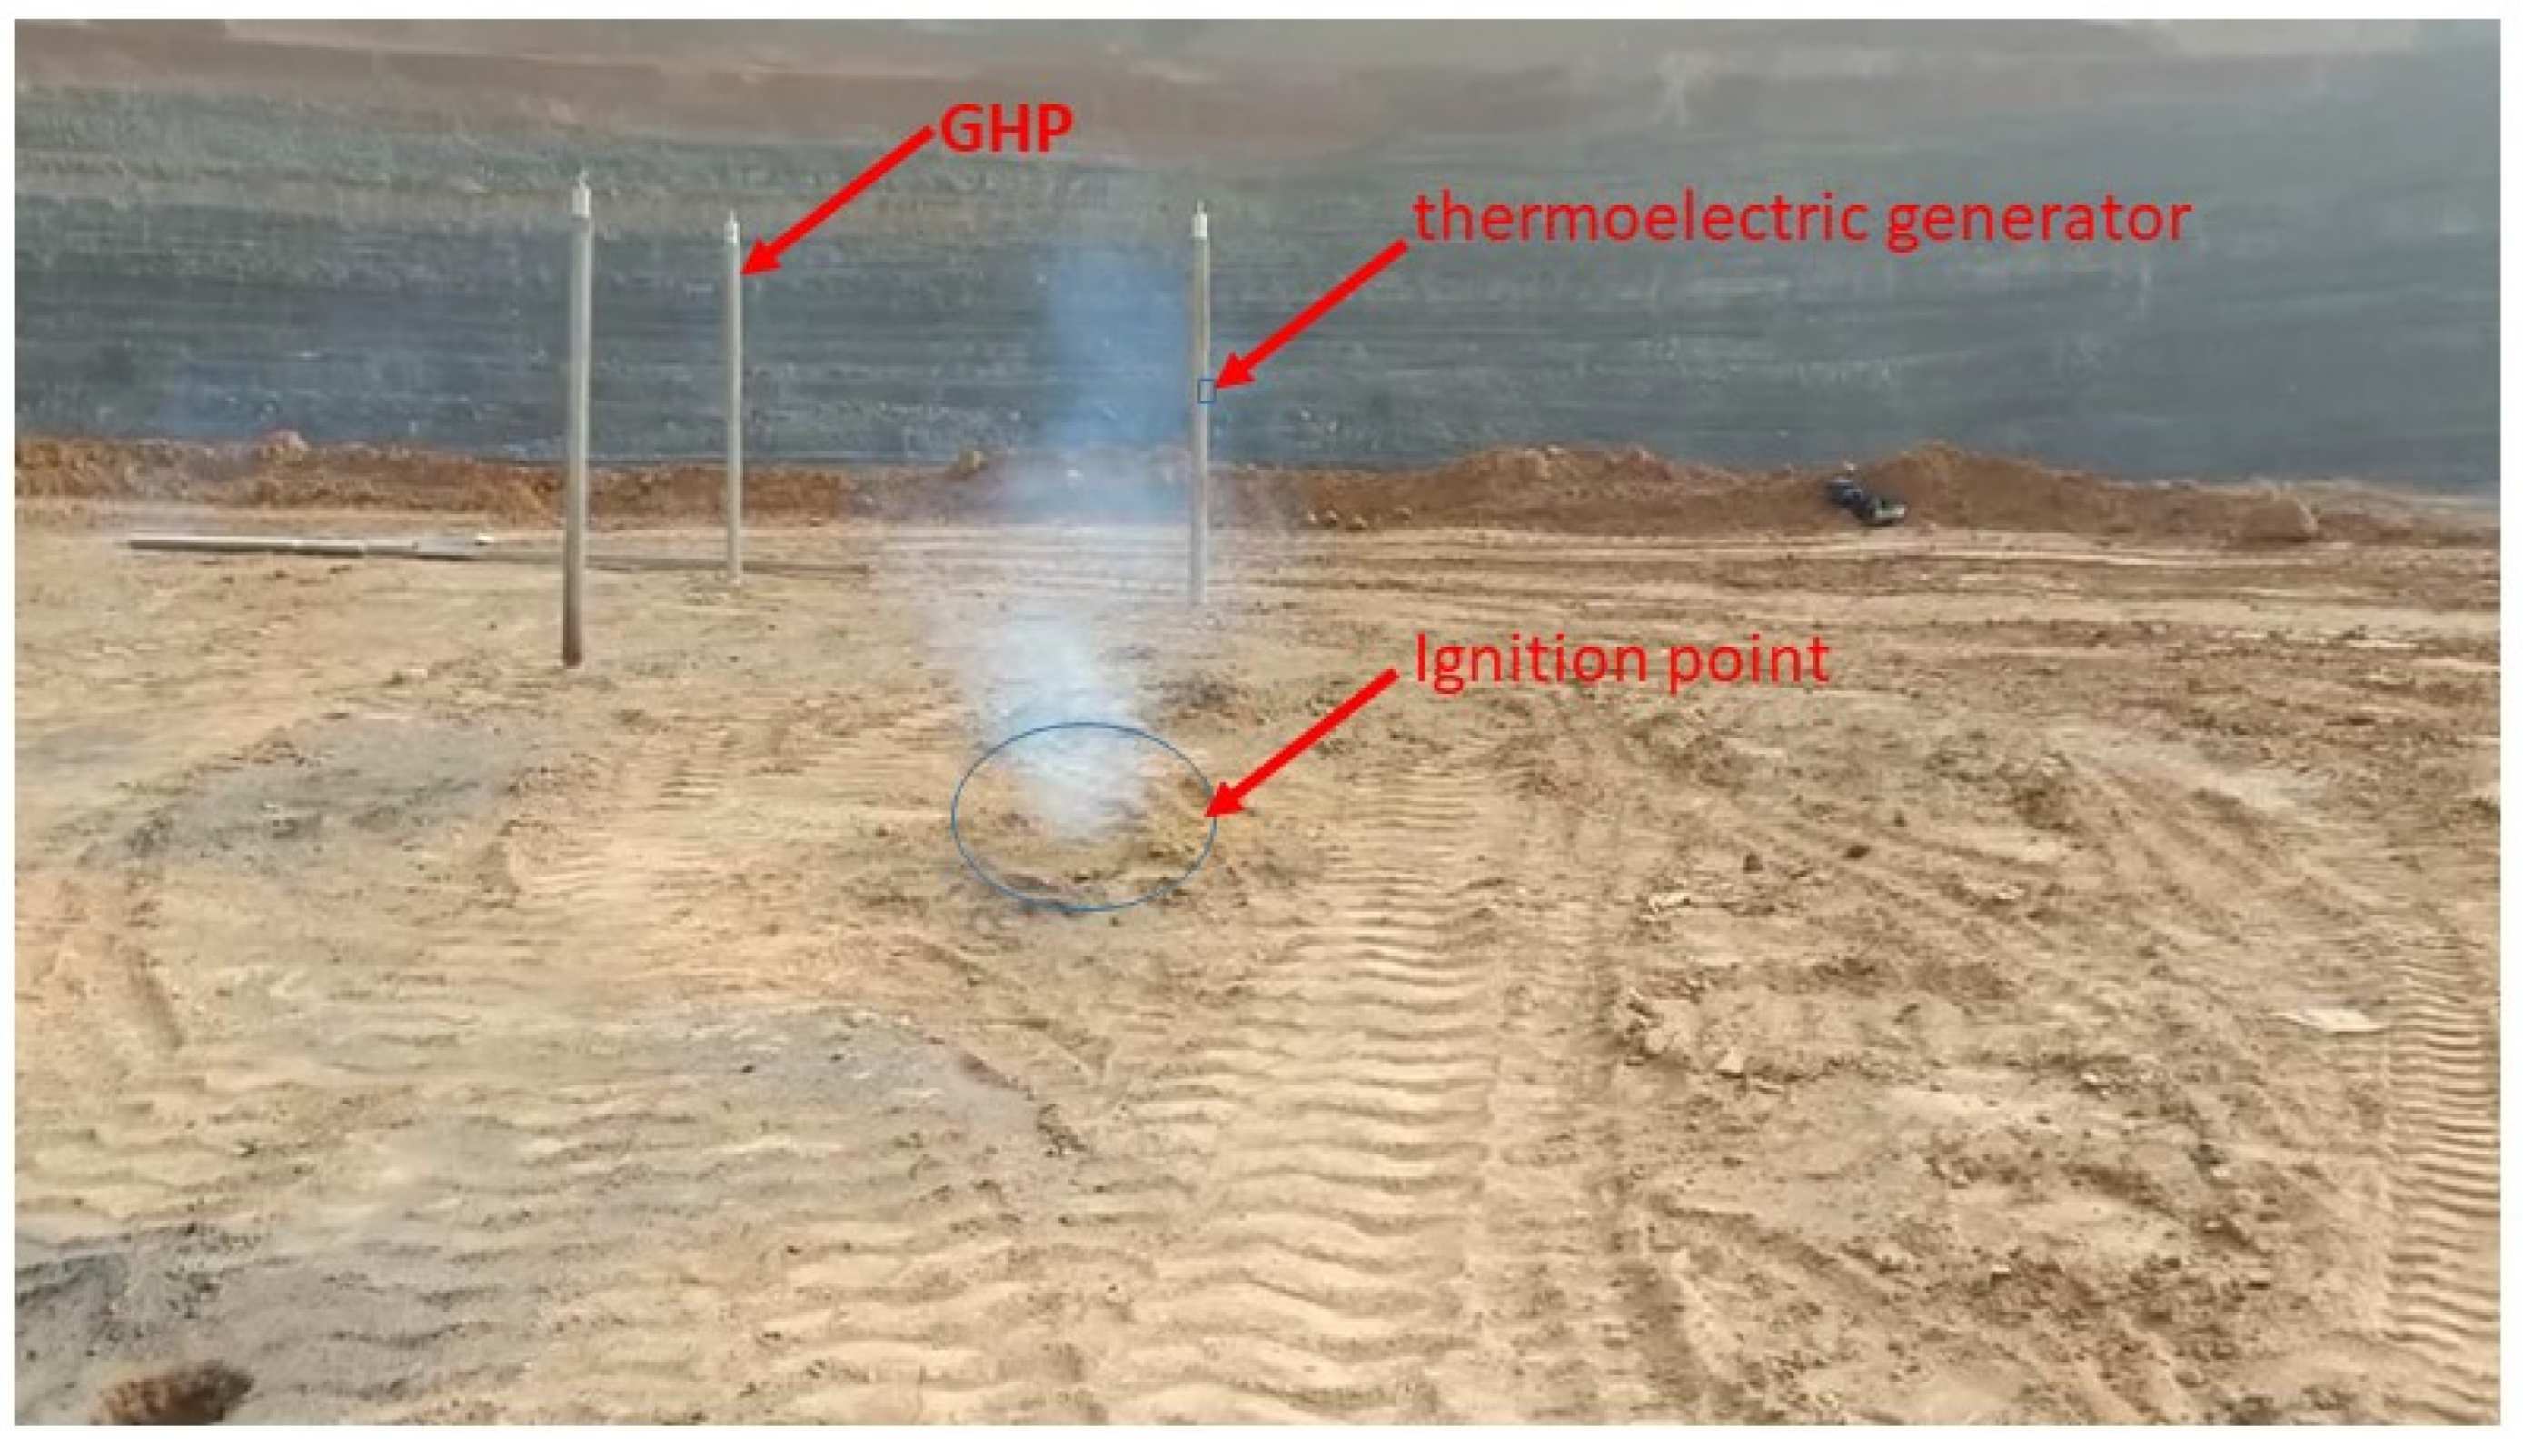
(5)
The feasibility of utilizing GHPs for the remediation of high-temperature zones in deep coal gangue hills and the feasibility of temperature difference power generation using the heat dissipation section of GHPs were demonstrated through on-site industrial experiments. Based on the on-site experiments, it was found that the power generation potential of gravity heat pipes is enormous. This discovery opens up possibilities for the management of coal mine gangue hills and the utilization of waste heat inside these hills for electricity generation. For future research, we recommend focusing on energy utilization and exploring methods to enhance the conversion efficiency of thermal energy within gangue hills into electrical energy.

Author Contributions

Conceptualization, X.Z. (Xiaogang Zhang) and X.Z. (Xinghua Zhang); methodology, B.Z.; validation, S.G.; formal analysis, B.Z.; investigation, X.Z. (Xiaogang Zhang); resources, X.Z. (Xiaogang Zhang); data curation, X.Z. (Xinghua Zhang); writing—original draft preparation, X.Z. (Xiaogang Zhang); writing—review and editing, X.Z. (Xiaogang Zhang) and X.Z. (Xinghua Zhang); visualization, S.G. and X.Z. (Xinghua Zhang); supervision, X.Z. (Xiaogang Zhang) and S.G.; project administration, S.G.; funding acquisition, B.Z. All authors have read and agreed to the published version of the manuscript.

Funding

This material is based upon work supported, in part, by the Basic Research Program of Shanxi Province Youth Research Science Institute (grant number 202203021212219).

Data Availability Statement

Not applicable.

Acknowledgments

This manuscript was improved by comments from X.Z. (Xinghua Zhang).

Conflicts of Interest

The authors declare no conflict of interest.

References

  1. Li, J.Y.; Wang, J.M. Comprehensive utilization and environmental risks of coal gangue: A review. J. Clean Prod. 2019, 239, 18. [Google Scholar] [CrossRef]
  2. Hu, Z.Q.; Zhu, Q.; Xu, J.J.; Zhang, X. Effect of Bactericides on Control of Acidification Pollution and Spontaneous Combustion of Coal Gangue Dumps in China and Its Mechanism. Sustainability 2020, 12, 6697. [Google Scholar] [CrossRef]
  3. Wang, G.; Liu, Q.Q.; Yan, G.Q.; Sun, L.L.; Qu, H.Y.; Han, Q.F. Control system of spontaneous combustion in coal gangue dumps—A case study at Yuquan coal mine in China. Teh. Vjesn. 2017, 24, 291–300. [Google Scholar]
  4. Li, X.P.; Zhang, J.; Ren, X.P.; Liu, Y.Q.; Zhou, C.H.; Li, T.Y. Study on condition analysis and temperature prediction of coal spontaneous combustion based on improved genetic algorithm. AIP Adv. 2022, 12, 10. [Google Scholar] [CrossRef]
  5. Han, S.M.; Wang, Y.X.; Li, Y.; Shi, K.Y. Investigation of bacterial diversity in Cajanus cajan-planted gangue soil via high-throughput sequencing. Bioengineered 2021, 12, 6981–6995. [Google Scholar] [CrossRef]
  6. Wang, H.Y.; Tan, B.; Zhang, X.D. Research on the technology of detection and risk assessment of fire areas in gangue hills. Environ. Sci. Pollut. Res. 2020, 27, 38776–38787. [Google Scholar] [CrossRef]
  7. Zhang, D.; Yang, X.S.; Deng, J.; Wen, H.; Xiao, Y.; Jia, H. Research on coal spontaneous combustion period based on pure oxygen adiabatic oxidation experiment. Fuel 2021, 288, 7. [Google Scholar] [CrossRef]
  8. Zhang, W.D.; Xiao, Y.; Wang, X.F.; Lv, Y. Soil nematode community characteristics around the Gangue hill of Fushun West Open-pit mine. Helminthologia 2011, 48, 116–123. [Google Scholar] [CrossRef]
  9. Liu, Y.G.; Yu, L.N.; Zhou, A.G. Analysis of Coal Gangue Pollution Control Technology. In Proceedings of the 2nd International Conference on Advanced Materials and Engineering Materials (ICAMEM 2012), Beijing, China, 29–30 December 2012; Trans Tech Publications Ltd.: Beijing, China, 2012; pp. 941–944. [Google Scholar]
  10. Song, S.J.; Peng, R.S.; Wang, Y.; Cheng, X.; Niu, R.L.; Ruan, H. Spatial distribution characteristics and risk assessment of soil heavy metal pollution around typical coal gangue hill located in Fengfeng Mining area. Environ. Geochem. Health 2023, 45, 7215–7236. [Google Scholar] [CrossRef]
  11. Ren, W.X.; Liu, X.; Sun, Z.G.; Guo, Q. Internal Heat Extraction by Gravity Heat Pipe for Spontaneous Combustion Remediation. Combust. Sci. Technol. 2021, 13. [Google Scholar] [CrossRef]
  12. Wu, S.T.; Zhou, B.; Wang, J.F.; Yang, Q.F.; Dong, W.Z.; Dong, Z.Y. Isotope radon measurement method to identify spontaneous combustion regions in coal gangue hills: Case study for a coal mine in China. Int. J. Coal Prep. Util. 2023, 13. [Google Scholar] [CrossRef]
  13. Jiang, X.Y.; Yang, S.Q.; Zhou, B.Z.; Song, W.X.; Cai, J.W.; Xu, Q.; Zhou, Q.C.; Yang, K. The variations of free radical and index gas CO in spontaneous combustion of coal gangue under different oxygen concentrations. Fire Mater. 2022, 46, 549–559. [Google Scholar] [CrossRef]
  14. Hua, C.Y.; Zhou, G.Z.; Yin, X.; Wang, C.Z.; Chi, B.R.; Cao, Y.Y.; Wang, Y.; Zheng, Y.; Cheng, Z.R.; Li, R.Y. Assessment of heavy metal in coal gangue: Distribution, leaching characteristic and potential ecological risk. Environ. Sci. Pollut. Res. 2018, 25, 32321–32331. [Google Scholar] [CrossRef] [PubMed]
  15. Mingao, Y.; Rongkun, P.; Shuijun, Y.; Hailin, J. Experiment study on rainwater influence explode of spontaneous combustion gangue dump. In Proceedings of the International Symposium on Mining Science and Safety Technology, Jiaozuo, China, 16–19 April 2007; Science Press Beijing: Jiaozuo, China, 2007; pp. 1801–1805. [Google Scholar]
  16. Zhao, N.; Zhang, Y.B.; Zhao, X.H.; Niu, J.R.; Shi, H.; Yang, N.; Gao, T.; Guo, L.N. Internal Temperature Variation on Spontaneous Combustion of Coal Gangue Dumps under the Action of a Heat Pipe: Case Study on Yinying Coal Mine in China. Sustainability 2022, 14, 9807. [Google Scholar] [CrossRef]
  17. Peng, H.; Jia, X.L. Experimental study on heat energy recovery and utilization of coal gangue hill based on gravity heat pipe. Energy Rep. 2022, 8, 220–229. [Google Scholar] [CrossRef]
  18. Wu, D.; Wang, Y.Y.; Wang, M.C.; Wei, C.; Hu, G.Q.; He, X.L.; Fu, W. Basic Characteristics of Coal Gangue in a Small-Scale Mining Site and Risk Assessment of Radioactive Elements for the Surrounding Soils. Minerals 2021, 11, 647. [Google Scholar] [CrossRef]
  19. Zhang, Y.P.; Quan, X.; Ning, N.; Wang, J.G. Experimental Study on Heat Extraction from Coal Pile by Heat Pipe. In Proceedings of the 5th International Conference on Advances in Energy Resources and Environment Engineering (ICAESEE), Chongqing, China, 6–8 December 2019; Iop Publishing Ltd.: Chongqing, China, 2019. [Google Scholar]
  20. Yang, L.; Min, Z.; Sarwesh, P.N.; Chyu, M.K. Numerical investigation on hybrid-linked jet impingement heat transfer based on the response surface methodology. Numer. Heat Tranf. A-Appl. 2016, 70, 1297–1312. [Google Scholar] [CrossRef]
  21. Vinod, R.; Basavarajappa, Y.H. Recent advances in loop heat pipe. In Proceedings of the 4th International Conference on Advanced Research in Mechanical, Materials and Manufacturing Engineering (ICAMMME), Bengaluru, India, 10–11 July 2020; Elsevier: Bengaluru, India, 2020; pp. 389–391. [Google Scholar]
  22. Akkus, Y.; Nguyen, C.T.; Celebi, A.T.; Beskok, A. A first look at the performance of nano-grooved heat pipes. Int. J. Heat Mass Transf. 2019, 132, 280–287. [Google Scholar] [CrossRef]
  23. Hashimoto, M.; Akizuki, Y.; Sato, K.; Ueno, A.; Nagano, H. Proposal, transient model, and experimental verification of loop heat pipe as heating device for electric-vehicle batteries. Appl. Therm. Eng. 2022, 211, 14. [Google Scholar] [CrossRef]
  24. Wang, G.L.; Zhao, G.Q.; Li, H.P.; Guan, Y.J. Research on optimization design of the heating/cooling channels for rapid heat cycle molding based on response surface methodology and constrained particle swarm optimization. Expert Syst. Appl. 2011, 38, 6705–6719. [Google Scholar] [CrossRef]
  25. Zhang, L.; Jiang, Y.; Chen, W.; Zhou, S.; Zhai, P. Experimental and numerical investigation for hot water boiler with inorganic heat pipes. Int. J. Heat Mass Transf. 2017, 114, 743–747. [Google Scholar] [CrossRef]
  26. Salehi, H.; Hormozi, F. Prediction of Al2O3-water nanofluids pool boiling heat transfer coefficient at low heat fluxes by using response surface methodology. J. Therm. Anal. Calorim. 2019, 137, 1069–1082. [Google Scholar] [CrossRef]
  27. Tian, Z.X.; Zhang, J.R.; Wang, C.L.; Guo, K.L.; Liu, Y.; Zhang, D.L.; Tian, W.X.; Qiu, S.Z.; Su, G.H. Experimental evaluation on heat transfer limits of sodium heat pipe with screen mesh for nuclear reactor system. Appl. Therm. Eng. 2022, 209, 12. [Google Scholar] [CrossRef]
  28. Wang, H.G.; Bao, Y.H.; Liu, M.; Zhu, S.; Du, X.P.; Hou, Y. Experimental study on dynamic characteristics of cylindrical horizontal axially rotating heat pipe. Appl. Therm. Eng. 2022, 209, 14. [Google Scholar] [CrossRef]
  29. Zhang, X.; Jiang, D.Y.; Wang, H.; Liu, X.D. Experimental analysis on the evaporator startup behaviors in a trapezoidally grooved heat pipe. Appl. Therm. Eng. 2021, 199, 8. [Google Scholar] [CrossRef]
  30. Wang, H.Y.; Fang, X.Y.; Du, F.; Tan, B.; Zhang, L.; Li, Y.C.; Xu, C.F. Three-dimensional distribution and oxidation degree analysis of coal gangue dump fire area: A case study. Sci. Total Environ. 2021, 772, 11. [Google Scholar] [CrossRef]
  31. Nookaraju, B.C.; Kurmarao, P.S.V.; Nagasarada, S.; Karthikeyan, R.; Vinay, A. Optimization of Process Parameters of Helical Grooved Heat pipe Using Response Surface Methodology. In Proceedings of the 7th International Conference of Materials Processing and Characterization (ICMPC), Gokaraju Rangaraju Inst Engn & Technol, Hyderabad, India, 17–19 March 2017; Elsevier: Hyderabad, India, 2017; pp. 5262–5271. [Google Scholar]
Figure 1. The experimental procedure diagram of this study.
Processes 11 03040 g001
Figure 2. Experimental setup.
Processes 11 03040 g002
Figure 3. Schematic diagram of thermal power generation in the condensation section of the heat pipe.
Processes 11 03040 g003
Figure 4. Influence curve of inclination angle on the heat transfer coefficient.
Processes 11 03040 g004
Figure 5. Influence curve of working fluid height on the heat transfer coefficient.
Processes 11 03040 g005
Figure 6. Influence curve of initial absolute pressure on the heat transfer coefficient.
Processes 11 03040 g006
Figure 7. Influence curve of heating temperature on the heat transfer coefficient.
Processes 11 03040 g007
Figure 8. Minimum experimental results of the factors affecting the startup of the thermoelectric generator. (a) Heating temperature, 353.15 K; initial absolute pressure, 0.011 MPa; height of working fluid, 100 mm. (b) Heating temperature, 473.15 K; initial absolute pressure, 0.002 MPa; height of working fluid, 250 mm. (c) Heating temperature, 373.15 K; initial absolute pressure, 0.011 MPa; height of working fluid, 100 mm. (d) Heating temperature, 353.15 K; initial absolute pressure, 0.011 MPa; height of working fluid, 200 mm. (e) Heating temperature, 373.15 K; initial absolute pressure, 0.002 MPa; height of working fluid, 200 mm. (f) Heating temperature, 373.15 K; initial absolute pressure, 0.011 MPa; height of working fluid, 200 mm.
Processes 11 03040 g008aProcesses 11 03040 g008b
Figure 9. The curve graph illustrating variations in thermoelectric power generation with heating temperature under different initial absolute pressure conditions.
Processes 11 03040 g009
Figure 10. Normal probability plot of the C g from the fixed effects model.
Processes 11 03040 g010
Figure 11. Response of different T, H and P values to C g .
Processes 11 03040 g011
Figure 12. On-site remediation of the Maoergou coal gangue hill and temperature difference power generation.
Processes 11 03040 g012
Figure 13. Temperature profile of the heat dissipation section and power output curve of the temperature difference power generation in the on-site heat pipe experiment.
Processes 11 03040 g013
Table 1. Specifications of the experimental heat pipe.
PropertiesSpecifications
Total length of heat pipe1000 mm
Evaporator length250 mm
External diameter of heat pipe25 mm
Internal diameter of heat pipe18 mm
Size of thermoelectric generator20 × 40 mm
Working fluidwater
Material of hear pipeglass
Temperature sensor location (from bottom)30, 50, 70, 96 mm
Thermoelectric generator location (from bottom)90 mm
Table 2. Type B uncertainties.
ApparatusPrecisionCoverage FactorType B of Uncertainty
T±0.5%20.0025
P±0.1%20.0005
Ac±0.02%20.0001
H±0.05%20.00025
θ±0.2%20.001
P j ±0.5%20.0025
Table 3. Heat pipe parameters and their levels.
No.FactorUnitsNotationLevels
−101
1Fluid heightmmH200250300
2Initial absolute pressureMPaP0.0020.00650.011
3Heating temperatureKT373.15393.15413.15
Table 4. Experimental results using the Box–Behnken surface response design.
Run No.Coded ValuesActual ValuesC
(W/(m2·K))
H
(mm)
P
(MPa)
T
(K)
H
(mm)
P
(MPa)
T
(K)
11−103000.002393.150.109901
20−112500.002413.150.12023
30112500.011413.150.106585
40−1−12500.002373.150.101262
501−12500.011373.150.0733461
6−10−12000.0065373.150.0718403
7−1−102000.002393.150.104442
8−1102000.011393.150.0935846
91013000.0065413.150.095875
100002500.0065393.150.0932071
1110−13000.0065373.150.0812311
120002500.0065393.150.0928076
130002500.0065393.150.0925233
14−1012000.0065413.150.114479
150002500.0065393.150.0969262
161103000.011393.150.0872632
170002500.0065393.150.092909
Table 5. ANOVA test results for the thermoelectric power generation per unit area.
SourceSum of SquaresdfMean SquareF Valuep Value
Model0.002190.000227.940.0001Significant
H0.000110.00017.980.0256
P0.000310.000340.60.0004
T0.001210.0012148.28<0.0001
HP3.72 × 10−713.72 × 10−70.04460.8388
HT0.000210.000223.480.0019
PT0.000110.000117.650.004
H20102.580.1519
P20.000110.000111.320.012
T28.49 × 10−918.49 × 10−90.0010.9754
Residual0.000178.34 × 10−6
Lack of fit0305.160.0733Not significant
Pure error043.00 × 10−6
Cor total0.002216
Table 6. The test for checking adequacy.
Std deviation0.0022
Mean0.0958
R2-squared0.9879
Adjusted R2-squared0.9723
Predicted R2-squared0.8765
ModelAdequate
Table 7. Distribution of each parameter coefficient and its contribution to C g .
ParameterRegression CoefficientContribution Percentage/%
Intercept0.0937
H−0.00132.71
P−0.009419.58
T0.013728.54
HP−0.00296.04
HT−0.00714.58
PT0.00367.50
H2−0.00224.58
P20.007315.21
T2−0.00061.25
Table 8. Optimized process parameters.
HPTC
200.0010.002413.150.122981
Disclaimer/Publisher’s Note: The statements, opinions and data contained in all publications are solely those of the individual author(s) and contributor(s) and not of MDPI and/or the editor(s). MDPI and/or the editor(s) disclaim responsibility for any injury to people or property resulting from any ideas, methods, instructions or products referred to in the content.

