Article

Molecular Simulation of Adsorption Separation of CO2 from Combustion Exhaust Mixture of Commercial Zeolites

1
Huaneng Clean Energy Research Institute, Beijing 102209, China
2
Xinjiang Petroleum Engineering Co., Ltd., Karamay 834000, China
3
School of Energy and Environmental Engineering, University of Science and Technology Beijing, Beijing 100083, China
4
Beijing Key Laboratory of CO2 Capture and Process, Beijing 100084, China
5
National Key Laboratory of High-Efficiency Flexible Coal Power Generation and Carbon Capture Utilization and Storage, Beijing 102209, China
6
College of Biochemical Engineering, Beijing United University, Beijing 100083, China
*
Authors to whom correspondence should be addressed.
Processes 2023, 11(10), 2987; https://doi.org/10.3390/pr11102987
Submission received: 29 August 2023 / Revised: 30 September 2023 / Accepted: 10 October 2023 / Published: 16 October 2023
(This article belongs to the Section Chemical Processes and Systems)

Abstract

:
The adsorption thermodynamics and kinetics of CO2 and six combustion products (H2O, SO2, N2, O2, NO and NO2) of two most commonly used commercial zeolites (13X and 5A) were studied based on validated molecular simulations. Adsorption isotherms at wide range of temperatures (253–333 K) were fitted by a Langmuir model, obtaining equilibrium parameters including the adsorption capacity, strength, heterogeneity and CO2 selectivity from the mixture. The diffusion coefficients, isosteric adsorption heats and distributions of potential energy were simulated for further explanation. The comprehensive evaluation results suggest that, in actual combustion product mixtures, the presence of H2O in combustion products has a significant impact on CO2 capture efficiency. Under the influence of water, the adsorption capacity of CO2 was reduced by over 80%.

1. Introduction

CO2 is the main component of fossil fuel combustion exhaust and a gas that is relevant to global warming [1]. Over the past decades, a number of technologies have been developed to prevent the release of CO2 during combustion processes. Among them, the adsorption of CO2 in nonporous materials is a proven suitable method that can reduce or eliminate CO2 emissions, with the advantages of a small footprint, a low operating cost, a short startup process, etc. [2,3]. There are many different components in actual combustion products such as H2O, SO2 and NOX. Aside from the toxicity itself, these gases also have strong interactions with sorbents, decreasing the CO2 capture capacity of the sorbent over subsequent cycles [4,5,6,7,8,9,10,11]. Rege et al. [12] found that the presence of water could reduce the adsorption capacity in the adsorption process because of its strong adsorption force. Hu et al. [13,14] improved the structure of porous carbons, further enhancing the effectiveness of carbon capture. Therefore, in industrial practice, it is very important to select an adsorbent material to deal with complex components.
Among nano porous sorbents, zeolites are promising candidates for this application. Ordered zeolite structures have many desirable properties, such as high surface areas or thermal stability, that make them ideal materials for the storage, separation and purification of gas mixtures. Among all types of zeolites, 13X (FAU-type) and 5A (LTA-type) are the most widely used for CO2 adsorption due to strong electrostatic fields generated in the skeleton, interacting strongly with CO2 through quadrupole moments [15,16,17].
Adsorption thermodynamic properties, such as adsorption equilibrium, capacity, strength and selectivity within given operation conditions, are the most critical criteria for choosing adsorbents of CO2 capture. For practical applications, the study of selectivity and adsorption thermodynamic properties in multicomponent systems is even more necessary. Previous experimental work has widely concentrated on the thermodynamics of CO2 and other combustion products on zeolites under pure conditions. However, work conducted on CO2-containing mixtures with large temperature and pressure variations is rare because of high difficulty and a high cost. Molecular simulations are an effective method that can supplement experimental research [18,19,20,21,22,23]. They can enable people to explain experimental phenomena more intuitively from a microscopic perspective. In this paper, the adsorption properties of CO2 and six combustion gas (O2, N2, NO, NO2, SO2 and H2O) for 13X and 5A zeolites at different temperatures (253–333 K) were obtained using grand canonical Monte Carlo (GCMC) and molecular dynamics (MD) simulations. Furthermore, adsorption selectivity was calculated to provide a theoretical discussion for CO2 capture from combustion flue gas. In this study, CO2 capture efficiency under complex gas composition conditions was comprehensively evaluated from both macro and micro perspectives, which will provide data support and a reference for the post combustion CO2 capture process.

2. Computational Methods and Details
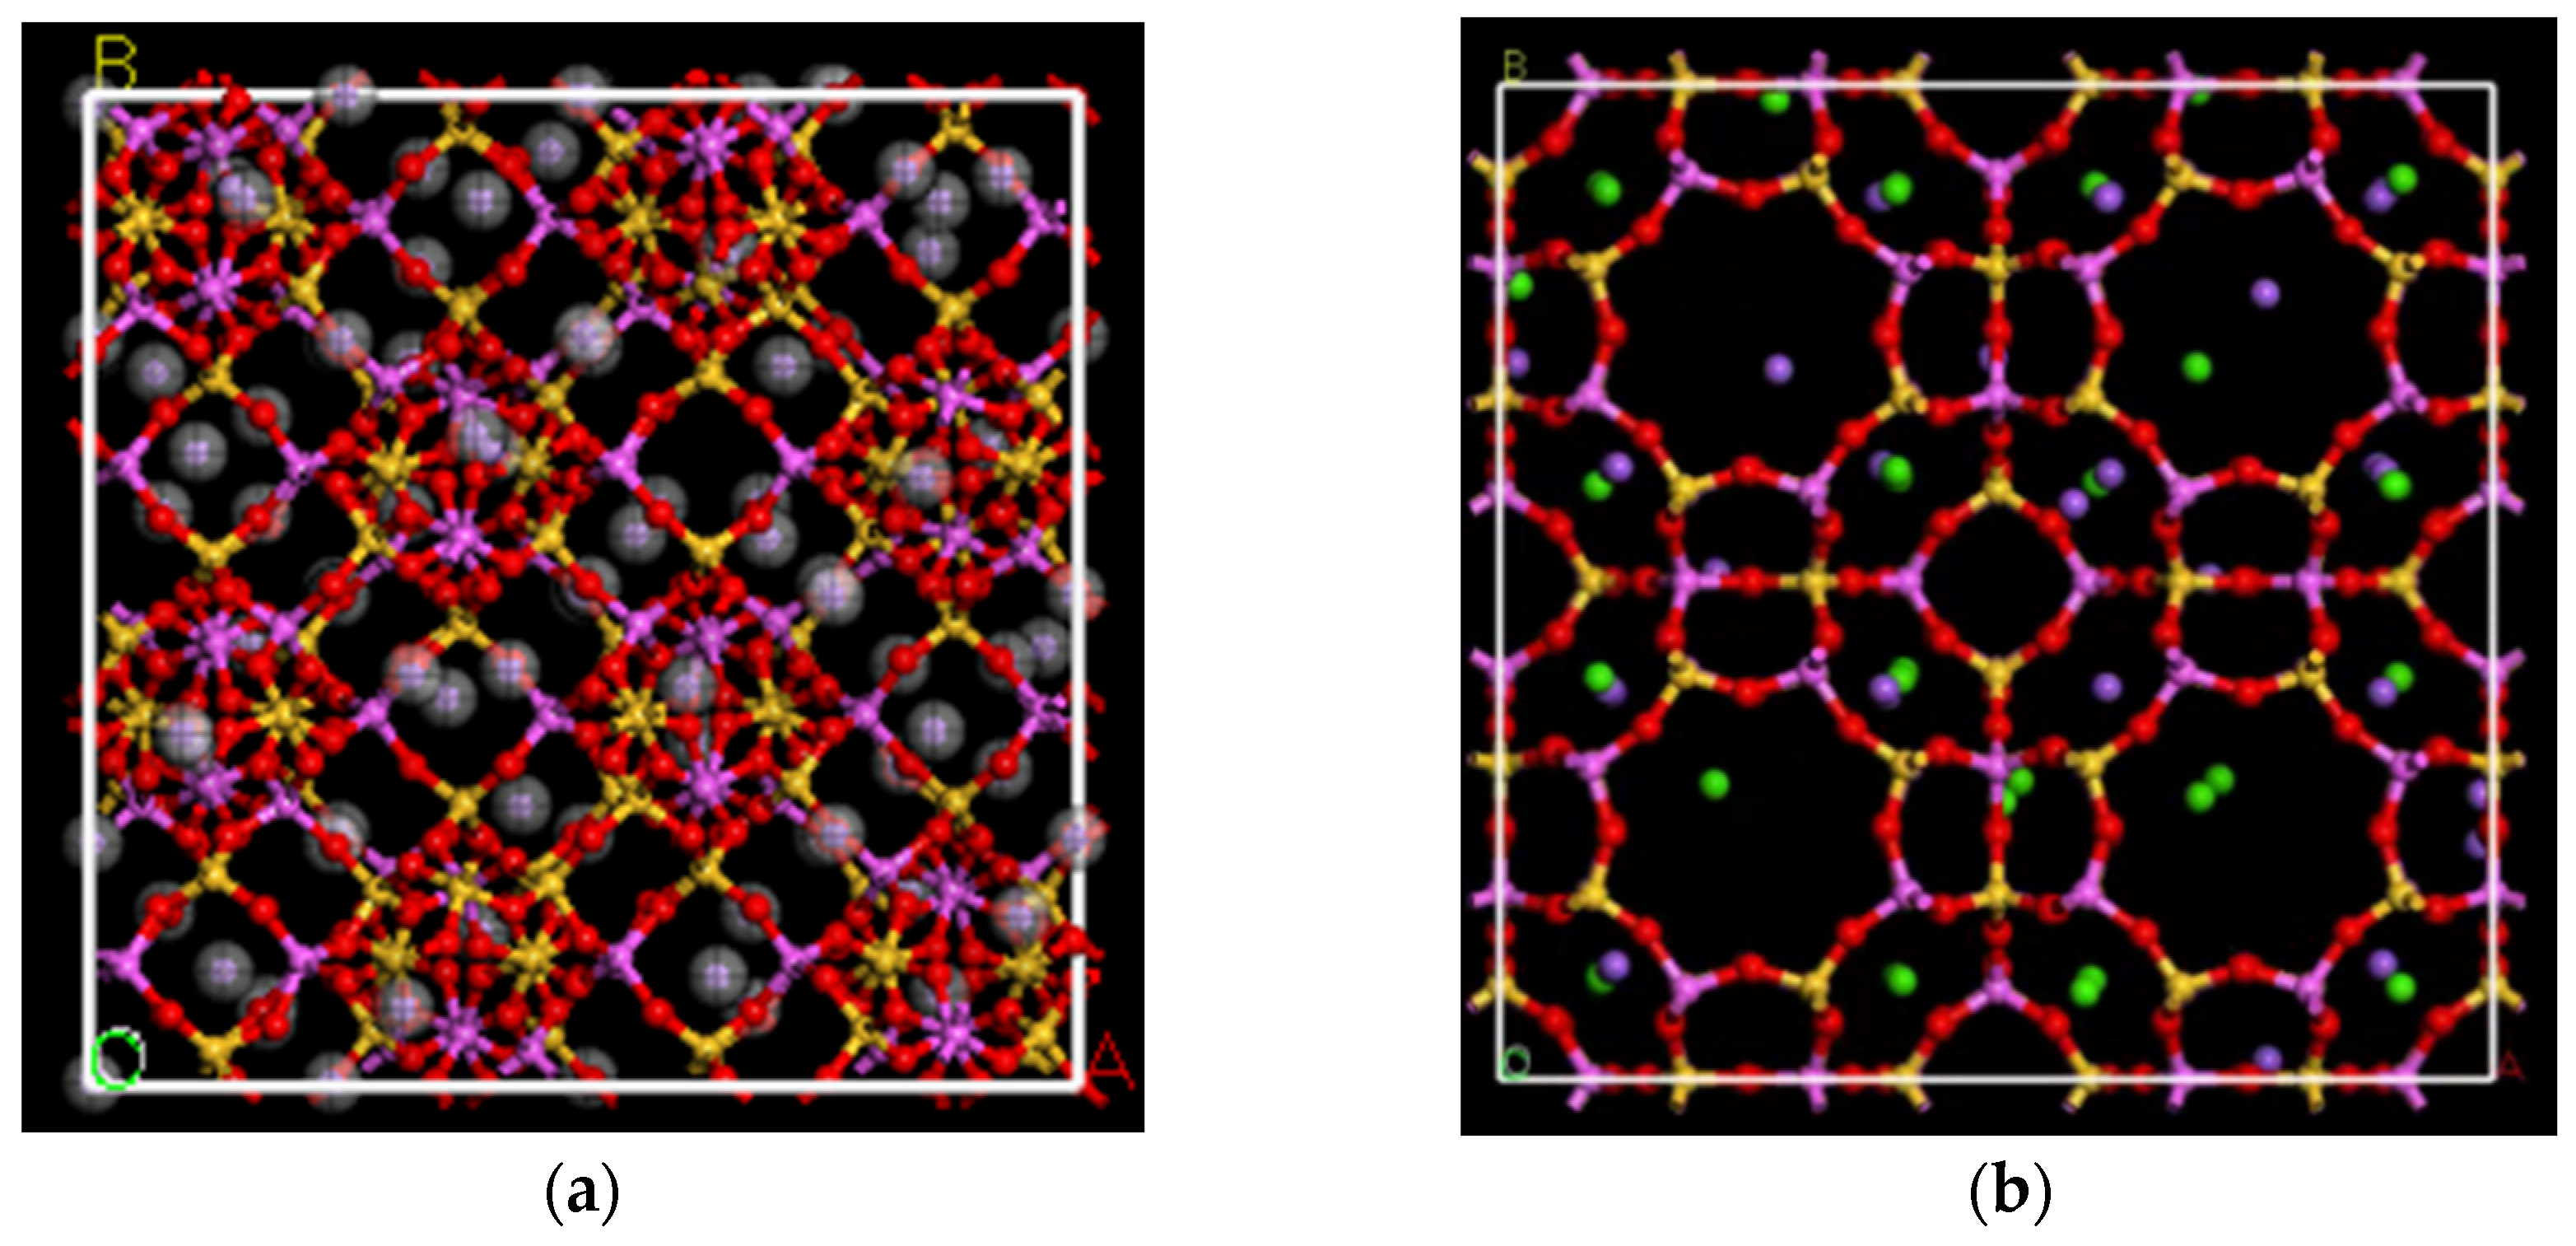
2.1. Models

The 13X and 5A skeleton models for molecular simulations were constructed by using Material Studio software (2019). Due to the unknown position of Al3+ in the zeolite skeleton, a random allocation method was adopted, satisfying the Löwenstein rule. To ensure that the size of the three directions is greater than twice the radius of the segment, we constructed a 2 × 2 × 2 supercell. 13X zeolite has an FAU structure with a three-dimensional elliptical cross pore composed of four- and six-member rings. As shown in Figure 1a, we replaced the Al part in the FAU model with Si, introduced a Na+ equilibrium charge and obtained a reasonable three-dimensional skeleton structure through geometric optimization. The symmetry of the structure is P1. The molecular formula of 13X is Na88Al88Si104O384, and the lattice length is 25.028 Å [20].
As shown in Figure 1b, 5A zeolite has an LTA-type structure. The ideal unit cell is equivalent to 8 α-cages and 24 cubic cages, and this structure belongs to the hexagonal system and the FM-3C space group. The molecular formula of 5A is Na32Ca32Al96Si96O384, and the lattice length is 24.55 Å [24].

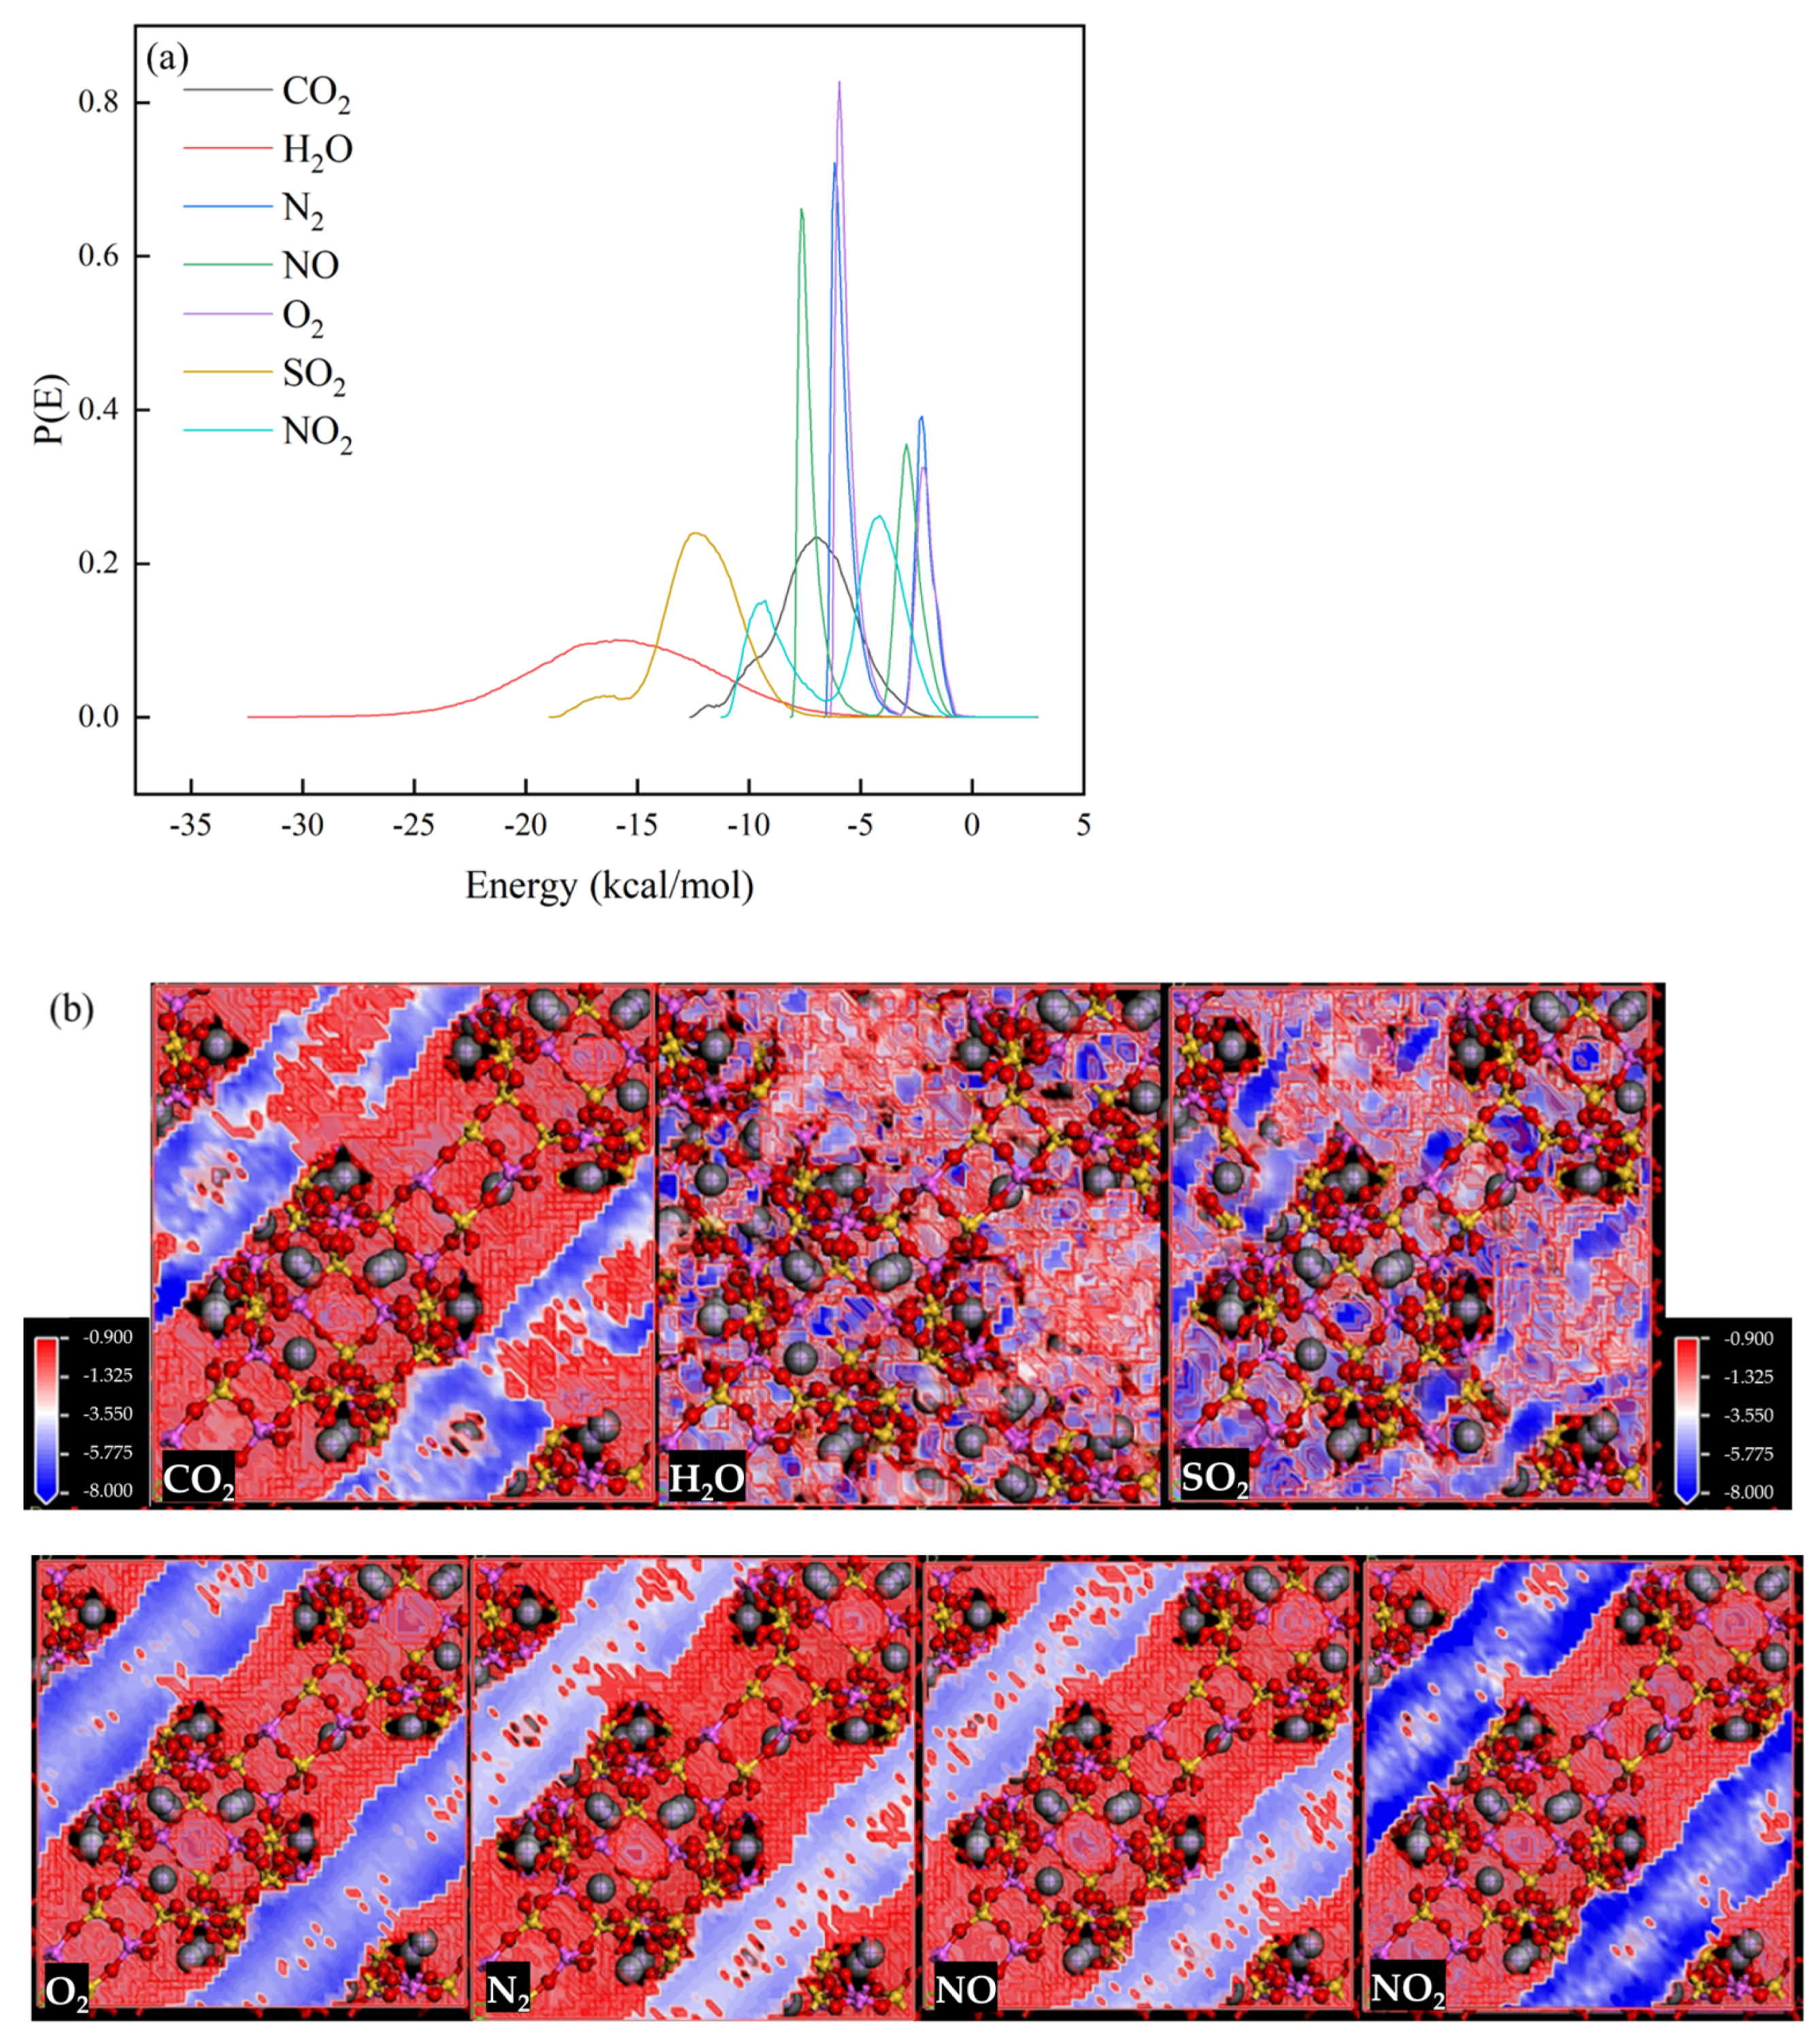
2.2. Adsorbate–Adsorbent Interaction Potential

The Dreiding force field with the Lennard-Jones (L-J) potential function was adopted in the calculations. The interactive parameters, ε and σ, can be obtained according to the mixed calculation rule of Lorentz–Botherlot, as follows:
σ i j = ( σ i + σ j ) / 2 ε i j = ε i ε j
where σi and σj are the collision diameters (Å); εi and εj are the potential energy well depths (kcal/mol); and subscripts i and j refer to the types of atoms or molecules. Detailed data can be found in the Table S1.

2.3. Molecular Simulation Methods

2.3.1. GCMC Simulations

For the established unit cells of the zeolite models, GCMC simulations were used to calculate the adsorption equilibriums and isosteric heat of adsorbates under periodic boundary conditions. In each run of the simulations, first, a zeolite framework was configured without adsorbents, and then the subsequent configuration was formed based on the Metropolis algorithm, which accepts or rejects the generation, disappearance, rotation and translation of adsorbents according to energy changes.
The distribution of all movements (exchange, conformation, rotation and translation) in each GCMC simulation was set to 20%, 20%, 40% and 20%, respectively. The Ewald summation method was used to handle electrostatic interactions, with an accuracy of 10−5 kcal/mol. The atomic summation method was used to calculate the van der Waals interactions. The cutoff value of the Lennard-Jones interaction energy was determined to be 12.5 Å. The simulation length was 1 × 10⁶ steps.
The simulated environment is in a low-pressure state. Therefore, it can be considered that fugacity is equal to pressure, and the gas meets the state equation of an ideal gas. For the zeolite adsorption of small gas molecules, the adsorption isotherm generally conforms to the Langmuir model:
q = q m K p 1 + K p
where qm is the theoretical single molecule saturated adsorption capacity, mmol/g, and K is the Langmuir constant, L/mmol. The equilibrium selectivity, S, can be calculated as follows:
S 1 / 2 = q 1 K 1 q 2 K 2
In a binary system, the selectivity can be calculated as follows:
S 1 / 2 = q 1 p 2 q 2 p 1
where q is the saturated adsorption capacity of the gas, and p is the saturated adsorption pressures of the gas.

2.3.2. EMD Simulations

The molecular dynamics (MD) method is used to simulate the diffusion process of gas in zeolite in order to obtain the diffusion coefficient of the gas in the zeolite. Before MD simulations, it is necessary to load a gas molecule into the zeolite and obtain a low-energy configuration and to then optimize its structure. In MD simulations, the NVT ensemble is used, with an initial velocity set to random. The Nose hot bath method is used, with a time step of 1 fs and a total simulation time set to 200 ps, with the first 50 ps used for the equilibrium structure and the last 150 ps used for the result calculations. The self-diffusion coefficient of a gas can be calculated from the Einstein equation:
D S = lim t 1 6 t | r ( t ) r ( 0 ) | 2
where | r ( t ) r ( 0 ) | 2 is the mean squared displacement (MSD) of gas molecules. When the slope of the log MSD–log t curves is 1, the simulation results converge. At this point, 1/6 of the slope of the MSD-t curve is the self-diffusion coefficient. When the gas concentration is quite low, the thermodynamic correction diffusion coefficient is approximately equal to the self-diffusion coefficient obtained from the simulation.

3. Results

3.1. Validation of Model and Simulation

The adsorption isotherms of pure components were computed and compared to experimental data to validate the parameters of the force field. The calculated adsorption isotherms of 13X and 5A for CO2 and H2O were compared with the literature values. As shown in Figure 2, the simulation results show good agreement with the experimental data, with a slight overestimation of the H2O adsorption capacity. The simulations were performed for rigid and clean zeolite structures, and experimental data were obtained from materials with structural defects or impurities that would lead to a lower adsorption capacity. The simulation method, zeolite models and force field parameters were well verified by the comparison results [10,25,26,27].

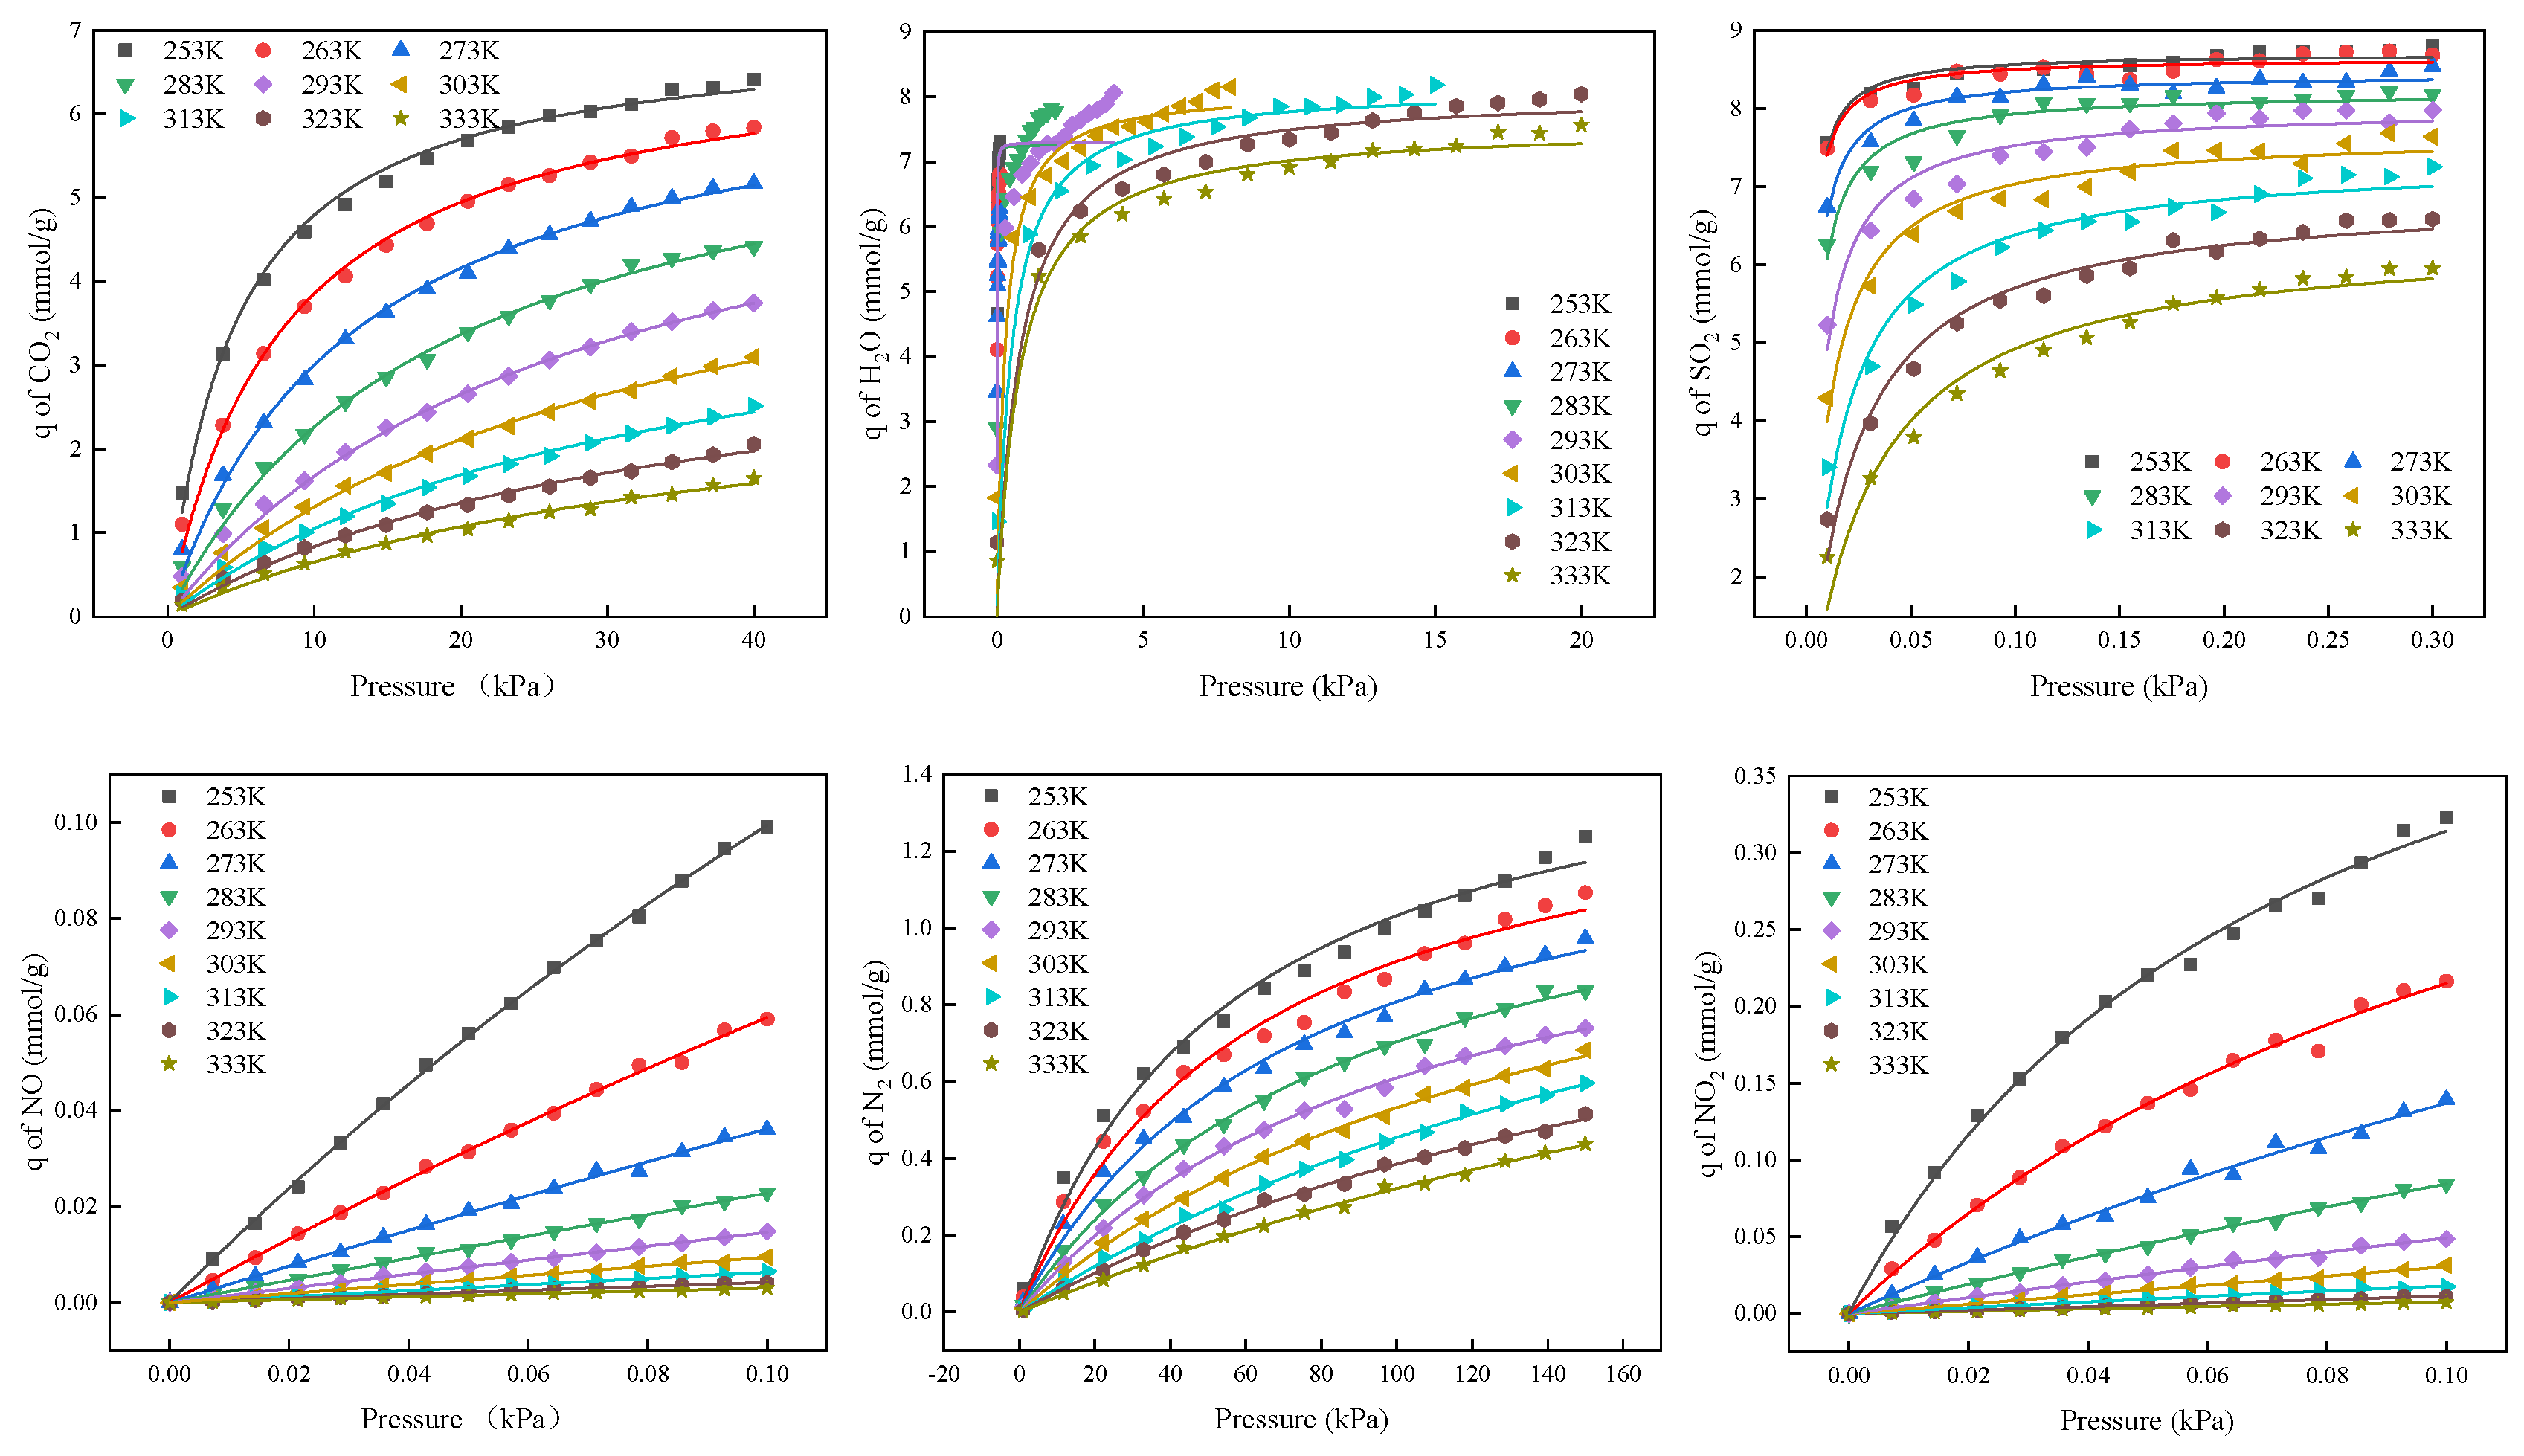
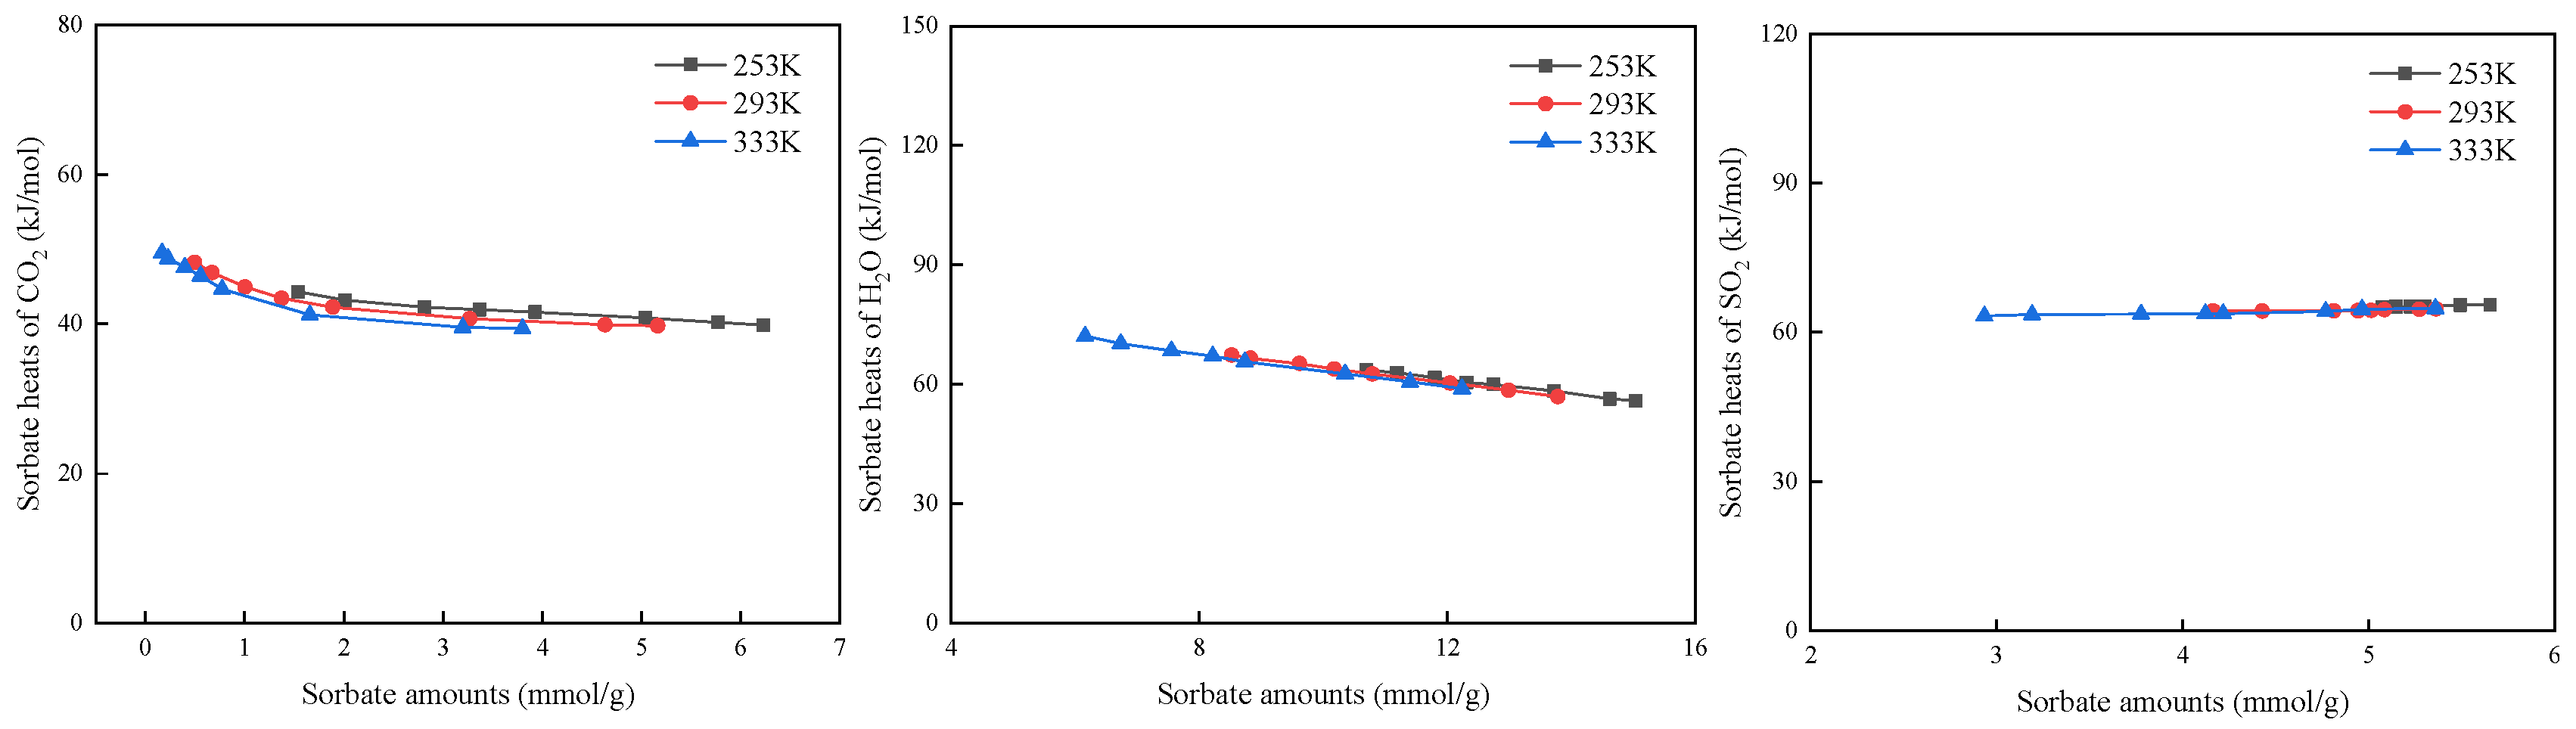
3.2. Adsorption Isotherms and Equilibrium Parameters of Pure Components

As shown in Figure 3, at 253–333 K, the pure component adsorption isotherms of CO2, H2O, SO2, NO, NO2 and N2 for 13X zeolite were calculated. In the combustion exhaust mixture, H2O mainly exists in a state of saturated vapor; therefore, the conditions of saturated vapor pressure at different temperatures were used for the H2O simulations in this study. The adsorption capacity, from high to low, is as follows: H2O > SO2 > CO2 > N2 > NO > NO2. The adsorption capacity decreases with increases in temperature and increases with increases in pressure. H2O, CO2 and SO2 are more likely to reach saturation, because they carry more charges and have a stronger attraction to cations in zeolites. This is similar to the experimental data [28]. Table 1 shows the adsorption parameter values of the adsorption isotherm fitted by the Langmuir model, in which H2O and SO2 more easily achieve saturated adsorption due to their good adsorption characteristics, whereas CO2, NO2, NO and N2 have small adsorption capacities and slow adsorption processes. Even if the partial pressure of CO2 is large, it is difficult to achieve saturated adsorption at high temperatures. This is because H2O and SO2 carry more charges and have a stronger attraction to cations in zeolites.
Figure 4 shows the pure component adsorption isotherms for 5A zeolite. The adsorption parameters are shown in Table 2. The adsorption capacities of CO2, H2O and SO2 gradually increase with increases in pressure under low-pressure conditions, and they gradually become stable and reach saturation with increases in pressure. However, O2, N2, NO and NO2 do not reach saturation under the same pressure conditions. Under the same temperature conditions, the adsorption capacities of the seven gases are related as follows: H2O > SO2 > CO2 > O2 > N2 > NO > NO2. The adsorption capacity of each component decreases with increases in temperature, but the adsorption capacities of H2O and SO2 are less affected by temperature.
As shown in Figure 5, the relationship between the adsorption heat of each gas and the adsorption capacity was calculated. In combination with the energy density distribution diagram shown in Figure 6a, the adsorption heat of each gas itself changes slightly with the adsorption capacity and decreases slightly with increases in the adsorption capacity (the absolute value increases). However, the size relationship for different gases is as follows: H2O < SO2 < CO2 < NO < NO2 < N2 < O2. The size of the adsorption heat reflects the adsorption strength of gas molecules for zeolite, which corresponds to the single-component adsorption mentioned above, and the adsorption strengths of H2O and SO2 are higher. Figure 6b shows the adsorption configurations of various gases for 13X zeolite, visually displaying the adsorption sites of gas molecules on 13X zeolite. The red region has a smaller adsorption energy, the blue region has a larger adsorption energy, and H2O has the strongest adsorption energy.
Figure 7 shows the relationship for the adsorption heat of each gas for 5A zeolite and the saturation adsorption amount, corresponding to the potential energy distribution curve and adsorption configuration, as shown in Figure 8. The adsorption heat of each gas slowly increases with increases in the saturated adsorption amount, but the overall change is not significant. The relationship for the adsorption heat of each gas is as follows: H2O < SO2 < CO2 < NO2 < NO < N2 < O2, corresponding to the adsorption strength of a pure component.

3.3. Adsorption Isotherms and Equilibrium Parameters in Mixture

The adsorption isotherms of each gas from the mixture are shown in Figure 9 and Figure 10. The proportions of all gases in the mixture are 13.1% CO2, 0.1% SO2, 5.82% O2, 0.0158% NO and 0.00158% NO2. Based on the saturated vapor pressure of H2O at different temperatures, within the temperature range of 253–333 K, H2O accounts for 0.6082–10%, and the rest is supplemented by N2. For the adsorption capacity of 13X zeolite, it meets the following requirements: H2O > SO2 > CO2 > N2 > O2 > NO > NO2, which is consistent with the single-component rule. However, except for H2O molecules, the adsorption capacity of all other gases significantly decreases. The CO2 adsorption capacity of 3.2 mmol/g in a single component decreases to 0.64 mmol/g, and the adsorption capacity decreases by 80%. The SO2 adsorption capacity also decreases from 7.2 mmol/g to 0.3 mmol/g, with a decrease of 96%, whereas O2, NO, NO2 and N2 all decrease by an order of magnitude. This indicates that there is competitive adsorption when multi-component gases coexist, and H2O exhibits the best adsorption strength in a single component. Therefore, adsorption competition is the strongest in multi-component adsorption. Compared to single-component adsorption, the adsorption capacity of H2O hardly decreases. However, for 5A zeolite, due to the competitive adsorption between mixed components, H2O is extremely competitive, and the CO2 adsorption capacity decreases. The SO2 adsorption capacity decreases by 98%. The adsorption capacities of N2 and NO are almost zero.

3.4. Self-Diffusion from Mixture

The diffusion coefficients calculated using the Einstein equation (Equation (4)) are shown in Table 3 and Table 4, Figures S7 and S8. Their sizes meet the following rules: N2 > NO > O2 > SO2 > CO2 > NO2, which is related to the gas molecular dynamics diameter and molecular polarity. N2, O2 and NO are diatomic small molecules, and their molecular dynamics diameter is smaller than the minimum pore size of 13X zeolites. Therefore, the diffusion coefficient is relatively large, and NO2, CO2 and SO2 are all triatomic molecule with larger dimensions than diatomic molecule. Due to the steric effects, their diffusion coefficients are relatively low. For the diffusion of H2O, the MSD of H2O is close to 0, and the diffusion coefficient is very small. This is due to the strong polarity of H2O and the strong binding force of the pore on it, which prevents it from diffusing out of the pore.
For the MSD values of each gas for 5A zeolite, the relationship is O2 > NO > N2 > CO2 > NO2, where SO2 and H2O fail to diffuse. The pore size of 5A zeolite is smaller than that of 13X, which has a stronger binding force on gas molecules, making it difficult for SO2 and H2O to diffuse.

3.5. Adsorption Selectivity

As shown in Table 5 and Table 6, the equilibrium selectivity of CO2 and other pure components for 13X is calculated using Formula (3). The equilibrium selectivity of CO2 during competitive adsorption with other components in the mixture is calculated using Formula (4). The simulation process is as follows: Under one atmospheric pressure, CO2 is 13.1%, and the proportions of the other gas components are as follows: 0.1% SO2, 5.82% O2, 0.0158% NO and 0.00158% NO2. H2O is based on its saturated vapor pressure at different temperatures, and the rest is supplemented by N2.

4. Conclusions

Adsorption isotherms and the self-diffusion of CO2 and six combustion gases for 13X and 5A zeolites were obtained using molecular simulations based on highly validated gas–zeolite interaction models. Furthermore, the adsorption selectivity of CO2 and other gases was discussed. The research results indicate that, for the pure component of the seven gases for the 13X and 5A zeolites, the Langmuir model shows good agreement with the isotherms and gives equilibrium parameters and thermodynamic constants for each adsorbate–adsorbent pair. Under the same temperature conditions, the relationship for the adsorption capacities of the seven gases is as follows: H2O > SO2 > CO2 > N2 > O2 > NO > NO2. For the mixture, H2O competes with CO2 for adsorption sites, resulting in a significant decrease in the adsorption capacities of 13X and 5A for CO2. Compared to the pure component, the adsorption capacity of H2O remains almost unchanged, with the CO2 adsorption reduced by 80% (13X) and 83% (5A), respectively. The diffusion coefficients of the seven gas molecules are as follows: N2 > NO > O2 > SO2 > CO2 > NO2 (for 13X) and O2 > NO > N2 > CO2 > NO2 (for 5A). This is related to the dynamic diameters of gas molecules and the polarity of molecules. The binding force of pores on H2O is strong, causing it to not diffuse out of the pores. The pore size of 5A is smaller than that of 13X, making it difficult for SO2 to diffuse into 5A.

Supplementary Materials

The following supporting information can be downloaded at https://www.mdpi.com/article/10.3390/pr11102987/s1: Table S1: L-J potential function parameters; Figure S1: Isotherms of pure components for 13X; Figure S2: Isotherms of pure components for 5A; Figure S3: Variations in adsorption heat of pure components for 13X zeolite with adsorption capacity; Figure S4: Variations in adsorption heat of pure components for 5A zeolite with adsorption capacity; Figure S5: Isotherms of mixture for 13X; Figure S6: Isotherms of mixture for 5A; Figure S7: Variations in diffusion coefficients with temperature for (a) CO2, (b) H2O, (c) SO2, (d) O2, (e) N2, (f) NO and (g) NO2 for 13X; Figure S8: Variations in diffusion coefficients with temperature for (a) CO2, (b) H2O, (c) SO2, (d) O2, (e) N2, (f) NO and (g) NO2 for 5A; Figure S9: Adsorption kinetics selectivity of (a) SO2, (b) O2, (c) N2, (d) NO and (e) NO2 from CO2 for 13X; Figure S10: Adsorption kinetics selectivity of (a) O2, (b) N2, (c) NO and (d) NO2 from CO2 for 5A.

Author Contributions

Conceptualization, Y.W., S.W. and Z.L.; methodology, X.J.; software, X.Q.; validation, L.L.; investigation, X.Y.; data curation, S.G.; writing—original draft preparation, C.Z. All authors have read and agreed to the published version of the manuscript.

Funding

This research was funded by the Fundamental Research Funds for the Central Universities (No. FRF-IDRYGD21–02); CHINA HUANENG GROUP (No. HNKJ22-H13); and Academic Research Projects of Beijing Union University (No. ZK10202203, ZK70202102, JZ10202002).

Data Availability Statement

Not applicable.

Acknowledgments

The authors would like to express gratitude to the Fundamental Research Funds for the Central Universities (No. FRF-IDRYGD21–02), CHINA HUANENG GROUP (No. HNKJ22-H13), Academic Research Projects of Beijing Union University (No. ZK10202203, ZK70202102, JZ10202002) and several researchers, Yutong Wang, Xu Jiang, Xiong Yang, Shiqing Wang, Xiaolong Qiu, Lianbo Liu, Shiwang Gao, for their great help. We would also like to thank Li Ziyi and Xiong Yang from the University of Science and Technology Beijing for their guidance on the article.

Conflicts of Interest

The authors declare no conflict of interest.

References

  1. Ritchie, H.; Roser, M.; Rosado, P. CO2 and Greenhouse Gas Emissions. Publishing Our World in Data. 2020. Available online: https://ourworldindata.org/co2-emissions?utm_source=tri-city%20news&utm_campaign=tricity%20news%3A%20outbound&utm_medium=referral (accessed on 1 August 2020).
  2. Satyapal, S.; Filburn, T.; Trela, J. Performance and properties of a solid amine sorbent for carbon dioxide removal in space life support applications. Energy Fuel 2001, 15, 250–255. [Google Scholar] [CrossRef]
  3. Kapdi, S.S.; Vijay, V.K.; Rajesh, S.K.; Prasad, R. Biogas scrubbing, compression and storage: Perspective and prospectus in Indian context. Renew. Energy 2001, 30, 1195–1202. [Google Scholar] [CrossRef]
  4. Chue, K.T.; Kim, J.N.; Yoo, Y.J.; Cho, S.H.; Yang, R.T. Comparison of activated carbon and zeolite 13X for CO2 recovery from flue gas by pressure swing adsorption. Ind. Eng. Chem. Res. 1995, 34, 591–598. [Google Scholar] [CrossRef]
  5. Mcewen, J.; Hayman, J.D.; Yazaydin, A.O. A comparative study of CO2, CH4 and N2 adsorption in ZIF-8, Zeolite-13X and BPL activated carbon. Chem. Phys. 2013, 412, 72–76. [Google Scholar] [CrossRef]
  6. Akhtar, F.; Liu, Q.L.; Hedin, N.; Bergström, L. Strong and binder free structured zeolite sorbents with very high CO2-over-N2. Energy Environ. Sci. 2012, 5, 7664–7673. [Google Scholar] [CrossRef]
  7. Raksajati, A.; Ho, M.T.; Wiley, D.E. Reducing the Cost of CO2 Capture From Flue Gases Using Phase-change Solvent Absorption. Energy Procedia 2014, 63, 2280–2288. [Google Scholar] [CrossRef]
  8. Liu, Z.; Li, X.; Shi, D.; Guo, F.Z.; Zhao, G.; Hei, Y.; Xiao, Y.; Zhang, X. Superior Selective CO2 Adsorption and Separation over N2 and CH4 of Porous Carbon Nitride Nanosheets: Insights from GCMC and DFT Simulations. Langmuir 2023, 39, 6613–6622. [Google Scholar] [CrossRef]
  9. Zhao, Y.L.; Feng, Y.H.; Zhang, X.X. Molecular simulation of CO2/CH4 self- and transport diffusion coefficients in coal. Fuel 2014, 165, 19–27. [Google Scholar] [CrossRef]
  10. Wang, Y.; Levan, M.D. Adsorption Equilibrium of Carbon Dioxide and Water Vapor on Zeolites 5A and 13X and Silica Gel: Pure Components. J. Chem. Eng. Data 2009, 54, 2839–2844. [Google Scholar] [CrossRef]
  11. Hutson, N.D.; Zajic, S.C.; Yang, R.T. Influence of Residual Water on the Adsorption of Atmospheric Gases in Li−X Zeolite: Experiment and Simulation. Ind. Eng. Chem. Res. 2000, 39, 1775–1780. [Google Scholar] [CrossRef]
  12. Rege, S.U.; Yang, R.T.; Qian, K.Y.; Buzanowski, M.A. Air pre-purification by Pressure Swing Adsorption Using Single/Layered Beds. Chem. Eng. Sci. 2001, 56, 2745–2760. [Google Scholar] [CrossRef]
  13. Bai, J.L.; Huang, J.M.; Yu, Q.Y.; Demir, M.; Kilic, M.; Altay, B.N.; Hu, X.; Wang, L.L. N-doped porous carbon derived from macadamia nut shell for CO2 adsorption. Fuel Process. Technol. 2023, 249, 107854. [Google Scholar] [CrossRef]
  14. Bai, J.L.; Huang, J.M.; Jiang, Q.; Jiang, W.H.; Demir, M.; Kilic, M.; Altay, B.N.; Wang, L.L.; Hu, X. Synthesis and characterization of polyphenylene sulfide resin-derived S-doped porous carbons for efficient CO2 capture. Colloids Surf. A Physicochem. Eng. Asp. 2023, 674, 131916. [Google Scholar] [CrossRef]
  15. Harlick, P.; Tezel, F.H. An experimental adsorbent screening study for CO2 removal from N2. Microporous Mesoporous Mater. 2004, 76, 71–79. [Google Scholar] [CrossRef]
  16. Li, Y.; Yi, H.; Tang, X.; Li, F.; Yuan, Q. Adsorption separation of CO2/CH4 gas mixture on the commercial zeolites at atmospheric pressure. Chem. Eng. J. 2013, 229, 50–56. [Google Scholar] [CrossRef]
  17. Fu, D.L.; Davis, M.E. Carbon dioxide capture with zeotype materials. Chem. Soc. Rev. 2022, 51, 9340. [Google Scholar] [CrossRef]
  18. Li, Z.Y.; Liu, Y.S.; Zhang, C.Z.; Yang, X.; Ren, J.L.; Jiang, L.J. Methane recovery from coal bed gas using modified activated carbons: A combined method for assessing the role of functional groups. Energy Fuels 2015, 29, 6858–6865. [Google Scholar] [CrossRef]
  19. Bergh, J.V.; Shuai, B.; Vlugt, T.J.; Kapteijn, F. Diffusion in zeolites: Extension of the relevant site model to light gases and mixtures thereof in zeolites DDR, CHA, MFI and FAU. Sep. Purif. Technol. 2010, 73, 151–163. [Google Scholar] [CrossRef]
  20. Zhang, J.F.; Burke, N.; Zhang, S.C.; Liu, K.Y.; Pervukhina, M. Thermodynamic analysis of molecular simulations of CO2 and CH4 adsorption in FAU zeolites. Chem. Eng. Sci. 2014, 113, 54–61. [Google Scholar] [CrossRef]
  21. Akten, E.D.; Siriwardane, R.; Sholl, D.S. Monte Carlo simulation of single-and binary component adsorption of CO2, N2, and H2 in zeolite Na-4A. Energy Fuels 2003, 17, 977–983. [Google Scholar] [CrossRef]
  22. Golchoobi, A.; Pahlavanzadeh, H. Molecular simulation, experiments and modelling of single adsorption capacity of 4A molecular sieve for CO2–CH4 separation. Sep. Sci. Technol. 2016, 51, 2318–2325. [Google Scholar] [CrossRef]
  23. Prats, H.; Bahamon, D.; Alonso, G.; Giménez, X.; Gamallo, P.; Sayós, R. Optimal Faujasite structures for post combustion CO2 capture and separation in different wing adsorption processes. J. CO2 Util. 2017, 19, 100–111. [Google Scholar] [CrossRef]
  24. Flanigen, E.M. Chapter 2 Zeolite and molecular sieves. An historical perspective. In Studies in Surface Science & Catalysis; Elsevier: Amsterdam, The Netherlands, 2001; Volume 137, pp. 11–35. [Google Scholar]
  25. Fu, Y.G.; Liu, Y.S.; Li, Z.Y.; Zhang, Q.L.; Yang, R.T. Insights into adsorption separation of N2/O2 mixture on FAU zeolites under plateau special conditions: A molecular simulation study. Sep. Purif. Technol. 2020, 251, 117405. [Google Scholar] [CrossRef]
  26. Deng, H.; Yi, H.H.; Tang, X.L.; Yu, Q.F.; Ning, P.; Yong, L.P. Adsorption equilibrium for sulfur dioxide, nitric oxide, carbon dioxide, nitrogen on 13X and 5A zeolites. Chem. Eng. J. 2012, 188, 77–85. [Google Scholar] [CrossRef]
  27. Al-Naddaf, Q.; Rownaghi, A.A.; Rezaei, F. Multicomponent adsorptive separation of CO2, CO, CH4, N2, and H2 over core-shell zeolite-5A-MOF-74 composite adsorbents. Chem. Eng. J. 2019, 384, 123251. [Google Scholar] [CrossRef]
  28. Yang, R.T. Adsorbents Fundamentals and Applications; John Wiley & Sons: Hoboken, NJ, USA, 2003. [Google Scholar]
Figure 1. Zeolite models of (a) 13X and (b) 5A.
Processes 11 02987 g001
Figure 2. Comparison of isotherms between those of the literature and this article. CO2 ((a), 0–100 kPa, 298 K) and H2O ((b), 0–3 kPa, 298 K) for 13X, and CO2 ((c), 0–1000 kPa, 298 K) and H2O ((d), 0–1.6 kPa, 298 K) for 5A.
Processes 11 02987 g002
Figure 3. Adsorption isotherms (253–333 K) of 6 pure components for 13X.
Processes 11 02987 g003
Figure 4. Adsorption isotherms (253–333 K) of 6 pure components for 5A.
Processes 11 02987 g004
Figure 5. Variations in adsorption heat of pure components for 13X zeolite with adsorption capacity.
Processes 11 02987 g005
Figure 6. Simulated distributions (a) and profiles (b) of potential energy for 7 gases for 13X at 298 K, 100 kPa.
Processes 11 02987 g006
Figure 7. Variations in adsorption heat of pure components for 5A zeolite with adsorption capacity.
Processes 11 02987 g007aProcesses 11 02987 g007b
Figure 8. Simulated distributions (a) and profiles (b) of potential energy for 7 gases for 5A at 298 K, 100 k Pa.
Processes 11 02987 g008
Figure 9. Adsorption isotherms (253–333 K) of mixture for 13X.
Processes 11 02987 g009
Figure 10. Adsorption isotherms (253–333 K) of mixture for 5A.
Processes 11 02987 g010
Table 1. Adsorption parameters of pure components for 13X zeolite fitted by Langmuir model.
MoleculeTemperature (K)
253263273283293303313323333
CO2q (mmol·g−1)7.026.916.766.566.365.494.383.633.07
K (kPa−1)0.2150.1260.0800.0530.0360.0310.0310.0300.027
R20.9940.9910.9920.9920.9910.9920.9920.9930.991
H2Oq (mmol·g−1)15.2814.1013.1213.3113.1113.3313.3512.9512.13
K (kPa−1)1310.61344.71260.51076.41043.8832.1764.5665.5657.9
R20.6360.6700.6550.7090.7000.7470.7310.7380.762
SO2q (mmol·g−1)8.708.648.448.218.007.687.366.916.40
K (kPa−1)607.70597.84365.094286.103159.413108.3865.08047.44033.317
R20.9110.8820.9440.9270.9360.9590.9590.9680.957
O2q (mmol·g−1)0.690.730.781.190.730.370.760.550.45
K (kPa−1)0.1280.0760.0440.0190.0240.0380.0120.0130.012
R20.9970.9980.9960.9920.9970.9910.9981.0000.999
NOq (mmol·g−1)0.570.540.520.480.510.430.400.740.110
K (kPa−1)77.45741.61520.93411.7775.7683.9632.4390.7590.163
R20.9870.9920.9950.9940.9940.9910.9890.9960.987
N2q (mmol·g−1)1.601.481.411.361.261.341.521.281.47
K (kPa−1)0.0180.0160.0140.0110.0090.0070.0040.0040.003
R20.9860.9860.9930.9980.9970.9980.9980.9980.998
NO2q (mmol·g−1)0.550.500.600.590.661.120.170.140.15
K (kPa−1)13.5117.4302.9611.6660.8100.2801.2060.2890.543
R20.9950.9950.9920.9970.9930.9970.9900.9920.995
Table 2. Adsorption parameters of pure components for 5A zeolite fitted by Langmuir model.
MoleculeTemperature (K)
253263273283293303313323333
CO2q (mmol·g−1)5.885.575.315.064.794.574.293.953.55
K (kPa−1)0.940.700.490.330.240.180.130.100.09
R20.890.930.960.970.980.970.970.980.98
H2Oq (mmol·g−1)14.3513.7513.2113.0413.1513.1213.1512.6912.29
K (kPa−1)2073.61798.11659.91353.91154.5906.91704.88651.66556.85
R20.870.870.860.890.910.970.960.860.91
SO2q (mmol·g−1)7.767.687.507.367.267.237.016.896.82
K (kPa−1)590.77570.10529.12523.12505.01487.54412.57411.66387.27
R20.980.990.990.980.940.980.970.970.98
O2q (mmol·g−1)1.731.541.471.361.251.201.151.071.05
K (kPa−1)0.0300.0190.0160.0090.0080.00430.0040.00380.0025
R20.990.990.990.990.990.990.990.990.99
NOq (mmol·g−1)1.651.551.490.5940.3710.1520.1120.0640.0360
K (kPa−1)0.350.240.230.180.180.150.120.100.09
R20.990.990.990.990.990.990.990.990.99
N2q (mmol·g−1)2.352.132.021.881.881.851.791.801.81
K (kPa−1)0.010.00940.00770.00660.00520.00420.00350.00280.0022
R20.990.990.990.990.990.990.990.990.99
NO2q (mmol·g−1)0.760.670.620.550.450.380.330.270.24
K (kPa−1)32.3819.8511.487.074.022.841.490.710.48
R20.990.990.990.990.990.990.990.990.99
Table 3. Diffusion coefficients of 7 gases for 13X zeolite at 253–333 K.
MoleculeTemperature (K)
253263273283293303313323333
CO2Ds (×10−10 m2/s)1.251.180.911.502.613.272.381.012.13
R20.980.950.990.990.990.960.990.990.99
H2ODs (×10−10 m2/s)---------
R2---------
SO2Ds (×10−10 m2/s)1.371.160.881.230.851.741.355.691.38
R20.990.990.980.980.990.970.990.980.99
O2Ds (×10−10 m2/s)2.415.342.174.002.324.802.484.242.46
R20.990.970.970.990.990.990.980.990.97
NODs (×10−10 m2/s)2.857.334.162.081.256.772.602.605.11
R20.980.990.970.910.930.980.990.990.98
N2Ds (×10−10 m2/s)6.255.233.044.372.494.257.073.5310.07
R20.990.990.940.990.890.980.990.970.99
NO2Ds (×10−10 m2/s)0.710.620.450.330.620.741.071.260.68
R20.990.970.990.990.980.990.980.980.98
Table 4. Diffusion coefficients of 7 gases for 5A zeolite at 253–333 K.
MoleculeTemperature (K)
253263273283293303313323333
CO2Ds (×10−10 m2/s)2.793.485.838.189.8813.1617.5723.5531.02
R20.960.980.990.990.990.960.990.990.99
H2ODs (×10−10 m2/s)---------
R2---------
SO2Ds (×10−10 m2/s)---------
R2---------
O2Ds (×10−10 m2/s)16.3025.1037.5346.4262.8370.3884.43113.82141.02
R20.980.980.990.980.990.990.990.990.97
NODs (×10−10 m2/s)13.5815.1015.6920.0823.6827.3228.8232.4236.15
R20.980.990.980.990.990.990.990.990.99
N2Ds (×10−10 m2/s)8.49 9.87 12.63 15.26 18.90 23.85 28.08 32.50 36.02
R20.980.990.980.980.990.990.990.990.99
NO2Ds (×10−10 m2/s)8.49 9.87 12.63 15.26 18.90 23.85 28.08 32.50 36.02
R20.980.990.980.980.990.990.990.990.99
Table 5. Adsorption selectivity for 13X zeolite at 253–333 K.
Temperature (K)
S253263273283293303313323333
PureCO2/SO23506.1 5931.2 5708.1 6799.2 5608.6 4845.2 3475.7 3021.8 2590.7
CO2/H2O13,28121,77230,636 41,47160,18164,566 74,05979,445 96,961
CO2/O217.2 15.7 15.7 15.6 13.1 12.3 15.2 15.2 15.0
CO2/N251.9 36.7 28.4 23.7 19.3 19.5 21.2 19.7 19.9
CO2/NO29.3 25.8 20.2 16.4 12.9 9.9 7.1 5.2 4.3
CO2/NO24.9 4.3 3.3 2.8 2.4 1.8 1.5 0.4 1.0
MixtureCO2/SO2112.1 106.8 80.7 65.0 76.4 70.8 116.9 140.0 144.9
CO2/H2O3403.9 3595.9 3282.0 2190.3 1828.9 865.9 964.0 622.0 608.7
CO2/O27.8 0.0 4.0 0.1 2.5 0.1 46.9 38.8 31.5
CO2/N2108.1 98.7 78.3 55.2 45.8 42.4 31.8 28.7 23.5
CO2/NO14.7 16.5 16.7 10.2 7.5 7.5 5.6 6.4 4.9
CO2/NO29.2 1.4 10.0 4.7 2.5 3.0 3.3 2.6 3.0
Table 6. Adsorption selectivity for 5A zeolite at 253–333 K.
Temperature (K)
S253263273283293303313323333
PureCO2/SO2360403.9506.2613.5739757.7777.4699.5586.9
CO2/H2O53656297845610,50113,18714,49115,81819,74521,400
CO2/O296.8128.1106131107.1157.5126.8102.7121.1
CO2/N2220.9195.2165134117.5105.993.883.278.1
CO2/NO9.410.57.315.317.234.640.25996.1
CO2/NO20.20.30.40.40.60.71.22.22.7
MixtureCO2/SO2593.1558.4534.2542.3480.5549.8494.5483.0376.3
CO2/H2O1396.91337.41418.8966.2619.6506.5399416.1480.1
CO2/O2266.6238.7234.3200.4180.5162.5140.2122.2108.4
CO2/N2375.3318.1256.1231.7189.4166.1140.2122.3105.5
CO2/NO25.631.727.332.232.333.528.826.121.5
CO2/NO24.74.53.33.13.43.94.23.53.8
Disclaimer/Publisher’s Note: The statements, opinions and data contained in all publications are solely those of the individual author(s) and contributor(s) and not of MDPI and/or the editor(s). MDPI and/or the editor(s) disclaim responsibility for any injury to people or property resulting from any ideas, methods, instructions or products referred to in the content.

