Article

Design and Optimization of a Novel Dust Collection Device for Underground Dry Drilling Based on Numerical Simulation and Field Testing

1
NHC Key Laboratory for Engineering Control of Dust Hazard, Beijing 100083, China
2
Research Institute of Macro-Safety Science, University of Science and Technology Beijing, Beijing 100083, China
3
State Key Laboratory of Safety and Health for Metal Mines, Maanshan 243000, China
4
School of Civil and Resource Engineering, University of Science and Technology Beijing, Beijing 100083, China
5
Sichuan Zhuchuang Security Technology Co., Ltd., Chengdu 610041, China
6
Taoyuan Coal Mine, Huaibei Mining Co., Ltd., Suzhou 234116, China
*
Authors to whom correspondence should be addressed.
Processes 2023, 11(10), 2942; https://doi.org/10.3390/pr11102942
Submission received: 2 September 2023 / Revised: 29 September 2023 / Accepted: 8 October 2023 / Published: 10 October 2023
(This article belongs to the Special Issue Detection, Control and Management of Industrial Dust)

Abstract

:
To address the challenge of dust control during dry drilling of underground coal seams, a novel dust-collecting device for micron-size dust was designed and tested. To determine the optimal structural parameters of the dust collector, numerical simulations were employed to investigate the influence of the positions of the dust extraction pipe, slag discharge pipe angle, and cavity diameter on the distributions of the airflow velocity field and the pressure field inside the device. The findings revealed that the best performance was achieved when the dust extraction pipe was positioned in the lower part of the cavity, the angle between the slag discharge pipe and the cavity was 45°, and the cavity diameter was 300 mm. Under these conditions, the average airflow velocity in the dust extraction pipe reached 8.32 m/s, the maximum negative pressure at the pipe’s mouth was recorded at 1012.38 Pa, and the velocity of the dusty airflow in the cavity remained below 4.38 m/s. Dust capture performance was evaluated through on-site testing in the Taoyuan Coal Mine. The results demonstrated that using the novel device, the dust suppression rates at the slag discharge port, the connection between the device and the drill pipe, and 6 m from the drill hole on the downwind side increased by 92.5%, 88.5%, and 89.1%, respectively.

1. Introduction

In-seam drilling is often adopted for gas pre-drainage in coal and gas outburst mines [1,2,3,4]. Because hydraulic slag removal is used in wet drilling, soft coal absorbs water and expands, causing drill holes to collapse [5,6,7,8] and reducing the penetration rate. Therefore, dry drilling and slag removal by wind are the main operational methods for gas pre-drainage of underground soft coal seams when drilling holes along the seam [9]. In the drilling process, a large amount of dust is ejected from the drill hole under the action of the wind jet of the drill head [10]. Then, the dust spreads to the tunnels and causes pollution, posing a severe threat to the health and safety of the workers [11,12] and possibly even triggering coal dust explosions that result in injuries and casualties [13,14,15]. To control the dust generated by underground dry drilling, drill hole dust collection devices are now commonly used for sealing in synergy with a secondary dust removal device [16,17]. Therefore, optimizing the structure of the orifice dust collection device and improving the sealing performance is vital for preventing the drill dust from escaping and is important for the development and applications of dust control methods.
Researchers have conducted numerous studies on orifice dust collection devices [18,19]. For example, to optimize the sealing performance, Wu et al. [20] developed an orifice dust collection device using compressed air for non-contact sealing to achieve better dust control. For the comprehensive management of dust and gas, Fan [21] proposed an orifice dust collection device consisting of two sets of four-way connectors. The experimental results revealed that the device showed improved performance characteristics in gas–slag separation and gas extraction. Meanwhile, Li et al. [9] proposed an anti-blowout composite orifice dust collection device and realized the separation of gas and coal slag during drilling. To optimize the dust extraction power parameters, Lu et al. [22] designed an orifice dust collection device that successfully separated coal slag and dust through waterjet negative pressure suction. They also optimized the operational parameters of waterjet dust removal to achieve a higher suction capacity. Cheng et al. [23] proposed a three-way orifice dust collection device and enhanced its dust removal performance by optimizing the parameters related to the suction volume of the gas–solid ejector. To optimize the dust removal methods, Fu et al. [24] proposed an orifice dust collection device with built-in spray and set up bags in the slag discharge pipe to collect the dust wetted by the spray. In summary, previous studies have mainly focused on the design and testing of devices. However, the research gap is that the optimization of these devices has not been conducted, and thus the dust capture performance of these devices cannot be effectively improved.
To this end, this study proposed a novel dust collection device for dry drilling in underground coal mines. Numerical simulations for structure optimization were performed to obtain the best structural parameters of the device. The performance of the device for dust control from dry drilling was determined through field testing. The research results provide technical support for solving the problem of dust pollution during dry drilling and safeguarding the occupational health and safety of the workers. The findings have important implications for further research.

2. Material and Methods

2.1. Determining the Performance of the Original Orifice Dust Collection Device

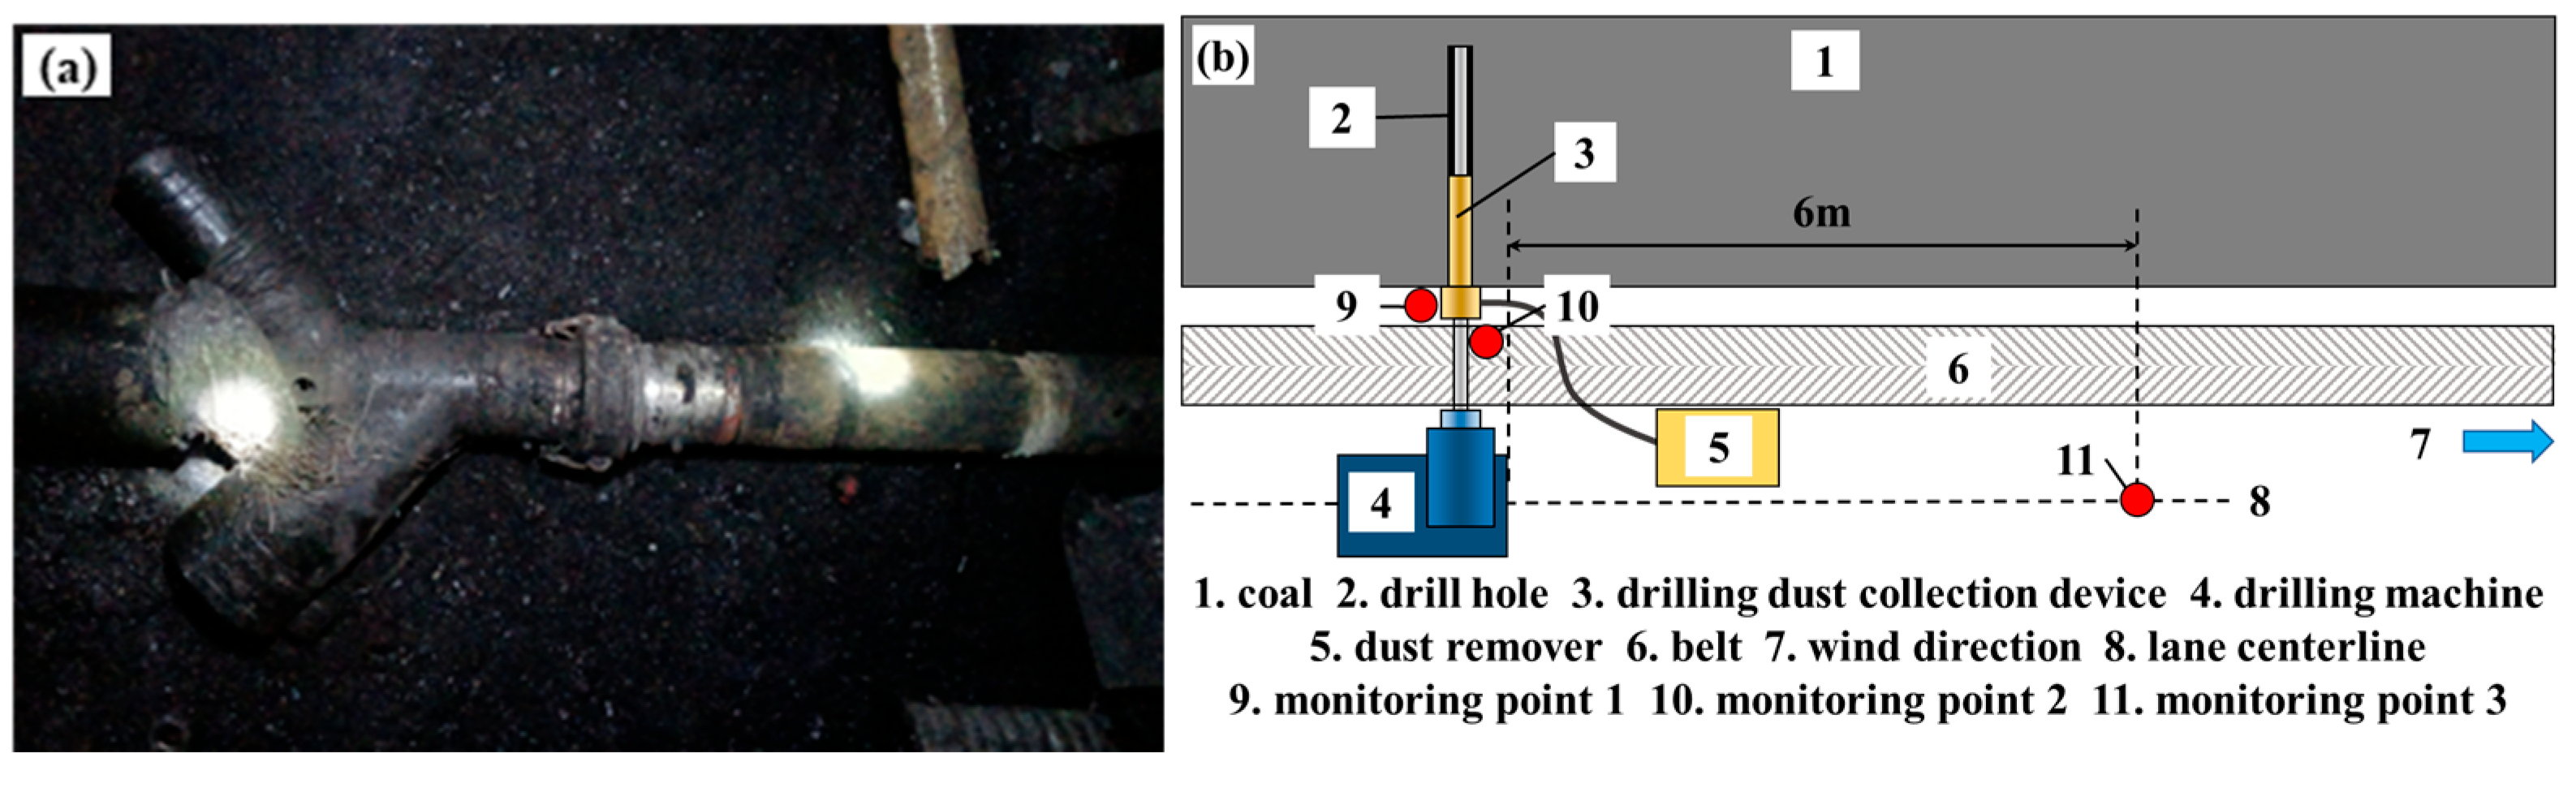
2.1.1. Overview of the Underground Drilling Site

The working face for the comprehensive excavation of the II8225 mechanized tunnel was located in the fourth stage of the II2 mining area. The average thickness of the coal seam was 1.7 m, with an average inclination of 20°. The immediate roof and floor of the coal seam were sandstone and mudstone, respectively. Forced ventilation was applied, with a ventilation air volume of 242.4 m3·min−1. The working face was located in the outburst-prone zone, and longwall in-seam drilling was applied for gas pre-drainage of the coal seam. A ZDY6500LQK drilling rig with a drill pipe with a diameter of 73 mm was used for slag removal by ventilation. The ventilation air pressure to the drill pipe was not less than 0.4 MPa during the drilling process.

2.1.2. Results and Analysis of the Performance of the Original Orifice Dust Collection Device

The structure of the original orifice dust collection device is illustrated in Figure 1a. To evaluate the sealing performance of the device, an IFC-2 explosion-proof dust sampler was utilized to determine the concentration of the dust from the drill hole when the original orifice dust collection device was applied. According to the main dust leakage areas found during the use of the original orifice dust collection device, three monitoring points were set up, as shown in Figure 1b. Monitoring point 1 was located at the slag discharge port of the device; monitoring point 2 was located at the connection between the device and the drill pipe; and monitoring point 3 was located at a distance of 6 m from the drill hole on the downwind side. The dust concentration was determined by weighing the filter film before and after operation. The results are shown in Table 1.
As observed from the data presented in Table 1, the dust concentrations at all three monitoring points greatly exceed the standard value (GBZ2.1-2019 [25], the maximum total coal dust concentration of ≤4 mg/m3). The main reasons identified through on-site observation were as follows.
➀ The cavity diameter of the device was small, and the sealing between the device and the drill pipe was not tight enough. Therefore, a large amount of dust was ejected along the axial direction of the drill pipe from the gap between the device and the drill pipe without buffering [26].
➁ The slag discharge pipe was perpendicular to the device, so it was difficult for the fast-moving dust to quickly change the direction of motion simply with the help of gravity and to be discharged from the slag discharge port [27].
➂ Due to the hydrophobic nature of coal dust [28,29,30,31], it was difficult to reduce the concentration of coal dust that entered the gallery after it was not captured at the borehole.
According to the above analysis, it was concluded that the dust extraction pipe position, the slag discharge pipe angle, and the cavity diameter were the key structural parameters affecting the dust collection performance of the device.

2.2. Design of the Novel Orifice Dust Collection Device

According to the actual conditions of the site, the original orifice dust collection device was improved. The design of the new orifice dust collection device is presented in Figure 2. The device consists of an orifice fixing tube, an elastic dust cover, a cavity, a thickened sealing ring, a slag discharge pipe, a gravity baffle, and a dust extraction component. The orifice fixing tube is inserted into the drill hole to seal the dust inside the drill hole and fix the device onto the coal wall at the same time. In the cavity, the dust-laden airflow is expanded and slowed. Thus, the cavity diameter has an important effect on the buffering of the dust-laden air. Meanwhile, the dust extraction pipe is connected to the negative pressure extraction device to provide dust extraction power to the device, so the dust extraction pipe position strongly affects the dust extraction performance. Lastly, the slag discharge pipe is used to discharge the large coal slag. During dry in-seam drilling, when the dip angle of the coal seam changes, the drilling angle must be adjusted accordingly. To avoid dust spillage at the drill hole opening during diagonal drilling, an elastic dust cover was set outside the orifice fixing tube to improve the sealing between the orifice fixing tube and the drill hole. Hence, the device is suitable for drilling operations at different angles. Similarly, to prevent dust spillage at the connection between the dust collection device and the drill pipe, a thickened sealing ring was installed at the end of the dust collection device to seal the coal dust ejected along the drill pipe. An open slag discharge port allows the outside air to be drawn into the dust collection device, affecting the efficiency of negative pressure extraction of dust. Therefore, a gravity baffle was added at the port of the slag discharge pipe so that the spring-loaded baffle could automatically open for slag discharge when the deposited coal dust and slag reached 1.5 kg.

2.3. Simulation Methodology

2.3.1. Modeling and Meshing

To optimize the structural parameters of the orifice dust collection device, the device was simplified to establish physical models with different structure variations using SolidWorks software (2022 version). Figure 3 shows a model in which the dust extraction pipe is located in the lower part of the device. Because the object of this study was a fluid region, the thickness of the device and the specific structures of the solid regions, such as the internal drill pipe, were neglected, and the drill pipe region was set as a cavity with a diameter of 73 mm.
The model was first imported into ICEM CFD. To enhance the computational efficiency and the stability of the solution, unstructured mesh generation was adopted. The grids of the orifice fixing pipe, slag discharge pipe, and dust extraction pipe were refined to improve the computational accuracy, as shown in Figure 4. The total number of grids was equal to 957,459 and the average mesh size was 7.48 mm. The average mesh quality was 0.81, with a minimum mesh quality of 0.3 and a maximum mesh quality of 1.0. These values met the computational accuracy requirements.

2.3.2. Simulation Parameter Setting and Model Solving

The model was solved by FLUENT, which is based on the finite element method, and a pressure-based solver was used. The SIMPLEC algorithm was selected for coupling the velocity and pressure in the governing equations. The second-order upwind finite difference scheme was adopted for the energy and momentum equations. The specific parameter settings are listed in Table 2. The field-measured wind speed at the orifice was approximately 10 m·s−1, and therefore, the inlet velocity was set to 10 m·s−1. In the mine site, a negative pressure dust remover was used, and the negative pressure at the dust extraction port was approximately 1 kPa. Hence, the boundary type of the dust extraction pipe port was set as a pressure outlet with a pressure of −1 kPa. A suspended square plate was used to collect the diffused dust. The dust samples were analyzed in the laboratory using a laser particle-size analyzer. The minimum and maximum particle sizes were 0.3 μm and 39.0 μm, respectively, with an average particle size of 5.9 μm and a distribution index of 1.93. As shown in Figure 5, the SEM of the coal dust (Figure 5) validated the results well.
Therefore, a discrete-phase model was adopted. The ring-shaped cross-section between the orifice fixing pipe and the drill pipe was set as the surface jet source, and the parameters were set according to the field-measured data. Finally, the solution limit was set. After model initialization, the solution was solved.

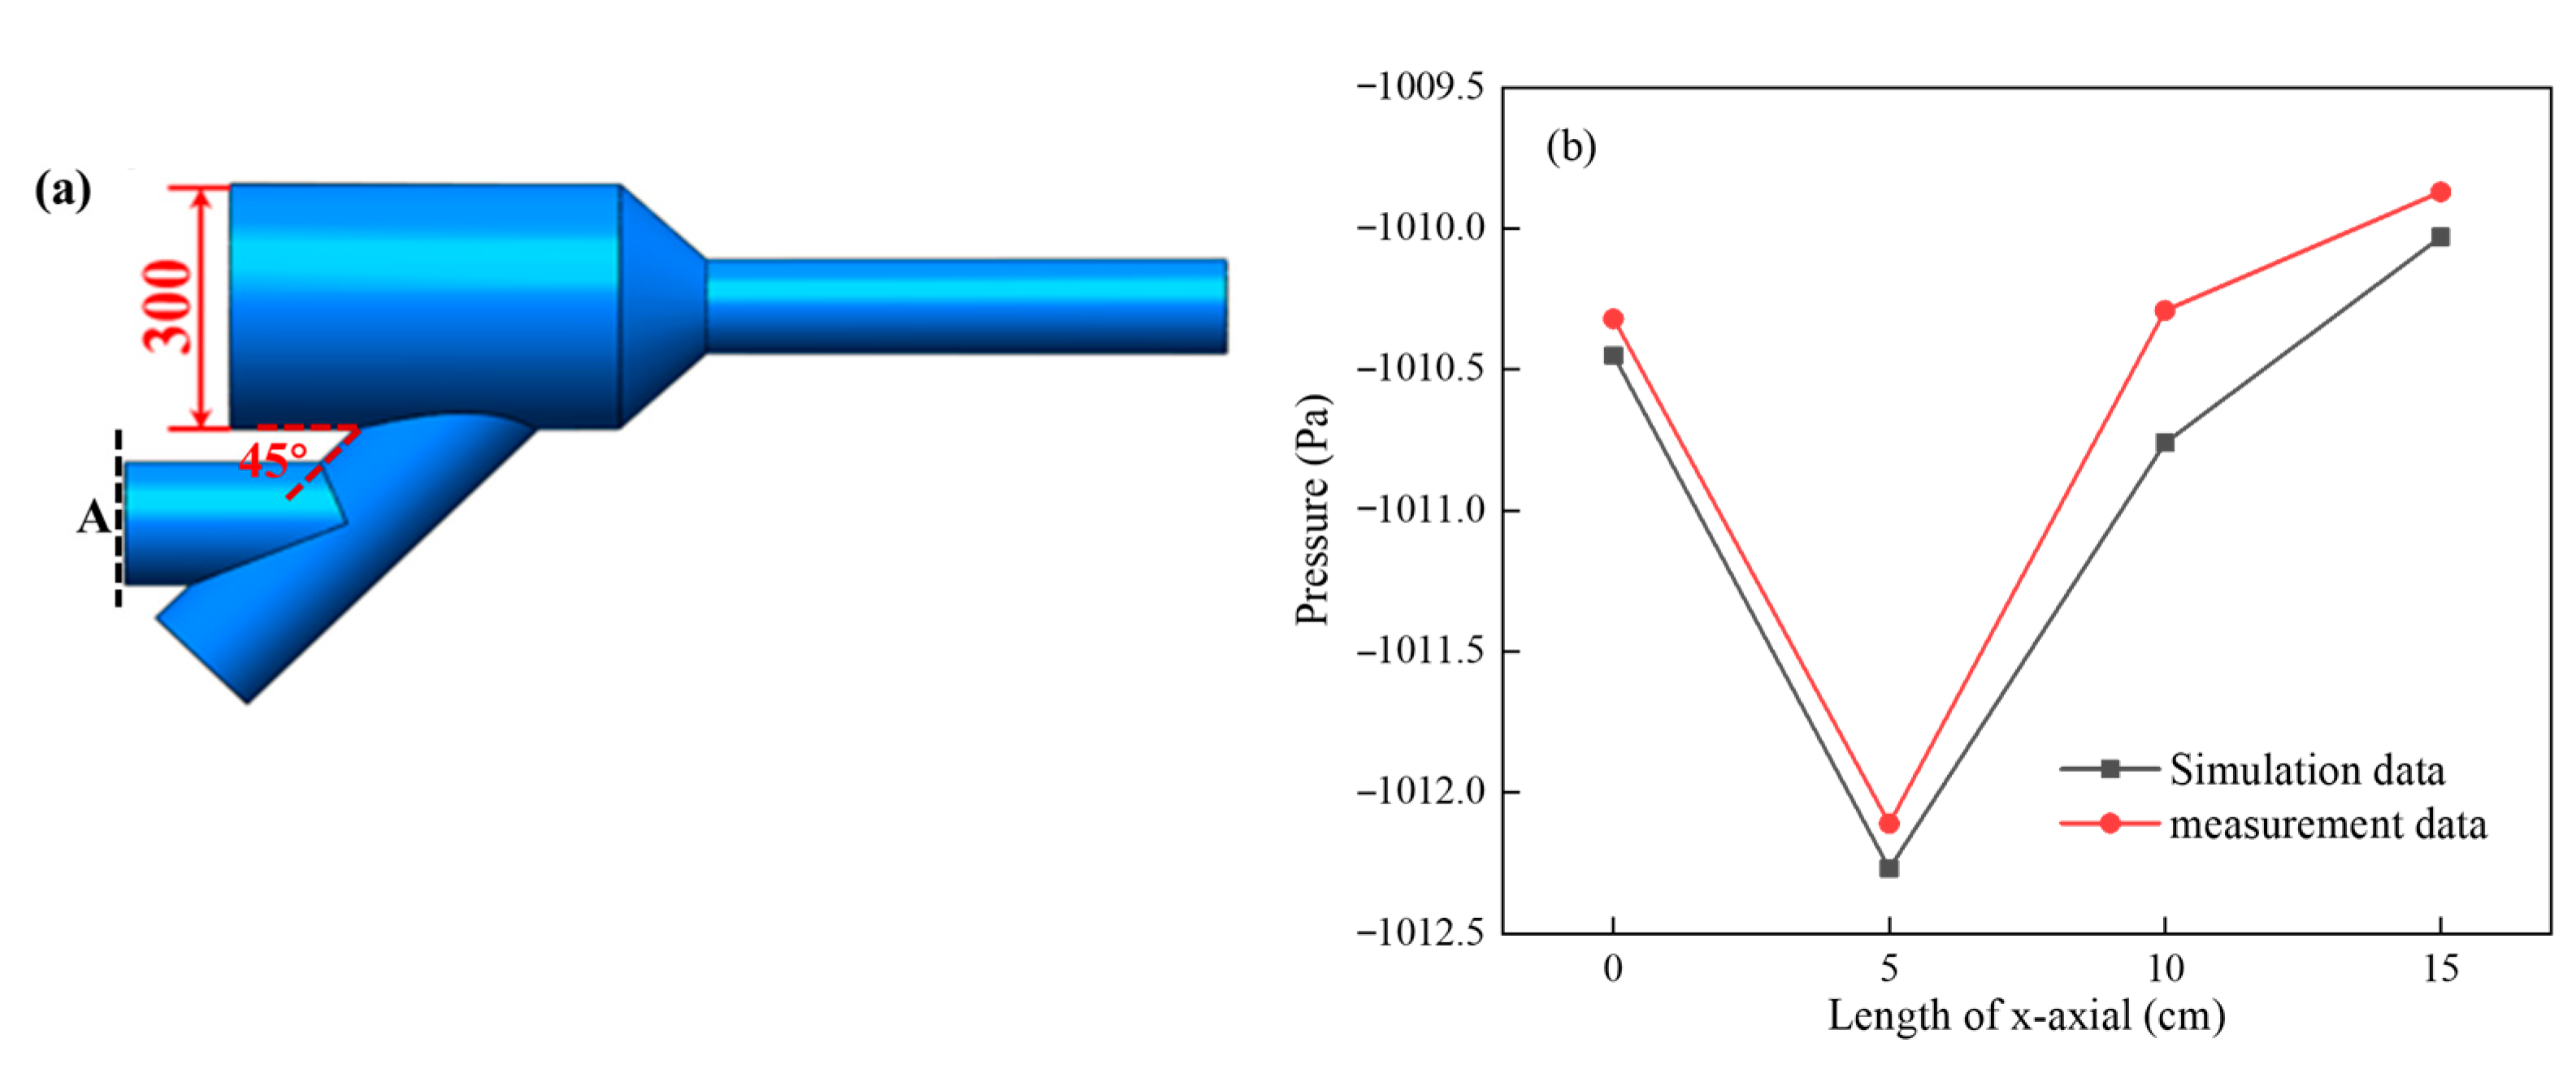
2.3.3. Validation of Simulation

In order to verify the correctness of the simulated results, the pressure at location A of the model shown in Figure 6a was simulated and compared with the experimental measurements. The simulation and testing parameters were set according to the entries in Table 2. The obtained results are depicted in Figure 6b. It can be seen in Figure 6b that there was a very high degree of conformity between the simulated results and the experimental results, which indicates that the simulation used in this research possesses a high level of accuracy.

3. Results and Discussion

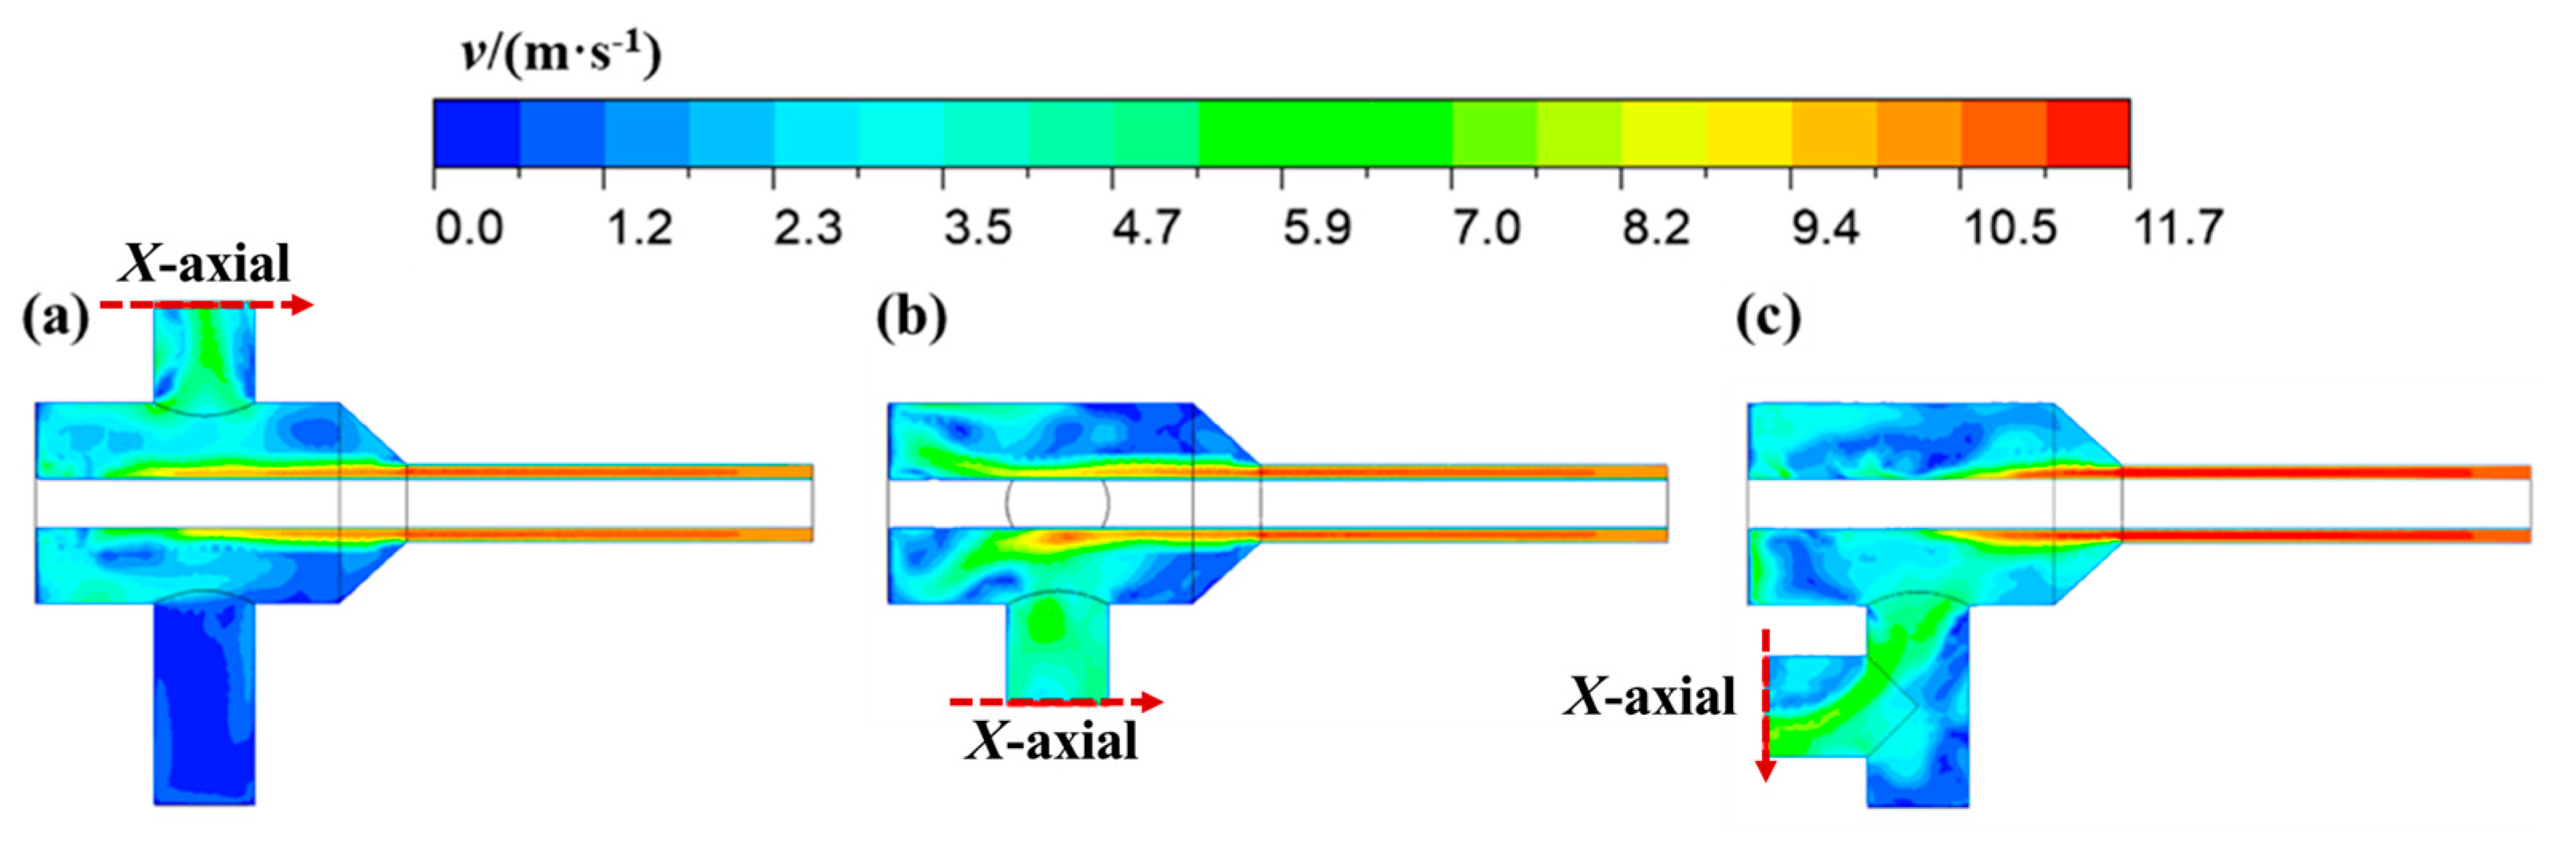
3.1. Influence of the Dust Extraction Pipe Position on the Dust Collection Performance

To investigate the influence of the dust extraction pipe position on the dust collection performance of the orifice dust collection device, three physical models were created by placing the dust extraction pipe in three different locations (in the upper part, on the side, and in the lower part of the device), as shown in Figure 7.
The meshing and model solving of the three dust collection devices with different dust extraction pipe locations were performed according to the procedures described above. Figure 8 shows the velocity field distribution results of the cross-sections of the dust extraction pipes. According to Figure 8, the cross-sectional area of the cavity was larger than that of the orifice fixing pipe. The flow rate of the dust-laden air was gradually reduced as it entered the cavity. Next, due to the influence of the negative pressure suction of the dust extraction pipe, the dust-laden air changed its direction of motion and accelerated into the dust extraction pipe. The velocity of the dust-laden air at the dust extraction pipe port when the dust extraction pipe was located in the lower part of the cavity was greater than that when the pipe was located in the upper part or on the side of the cavity.
To quantitatively analyze the airflow velocities when the dust extraction pipe was placed at different positions, the velocity distribution curves along the cross-sectional diameter of the pipe port (denoted by the red line in Figure 8) were plotted, as shown in Figure 9.
It is observed in Figure 9 that when the dust extraction pipe was located in the upper part of the cavity, the airflow velocity inside the pipe gradually increased toward the center, and it reached 5.28 m·s−1 at the center. By contrast, when the dust extraction pipe was on the side of the cavity, the maximum airflow velocity inside the pipe was equal to 5.17 m·s−1. Lastly, when the dust extraction pipe was located in the lower part of the cavity, the airflow velocity increased near the bottom, and the maximum airflow velocity at the bottom reached 8.32 m·s−1. This indicates that the dust-laden airflow was influenced by gravity, and a downward velocity component was generated. Hence, the upward negative pressure suction was partially offset when the dust extraction pipe was installed in the upper part of the device. This reduces the final airflow velocity for dust extraction. By contrast, when the dust extraction pipe was on the side of the device, the negative pressure suction force and the dust-laden airflow velocity were at an angle of 90°, so the suction was used to change the direction of motion of the dust-laden airflow. In turn, this weakened the subsequent acceleration effect on the airflow. Lastly, when the dust extraction pipe was located in the lower part of the device, the angle between the negative pressure suction and the velocity direction of the airflow was less than 90°. The direction of motion of the dust-laden needed to change less, so the acceleration effect on the airflow was more pronounced. Therefore, when the dust extraction pipe was installed in the lower part of the cavity, the utilization rate of the negative pressure suction force was higher, and the higher velocity of the dust-laden airflow was conducive to improving the dust extraction performance of the device. This is particularly true for large dust particles that are more strongly influenced by gravity, making it more advantageous to place the dust extraction pipe in the lower part of the cavity.

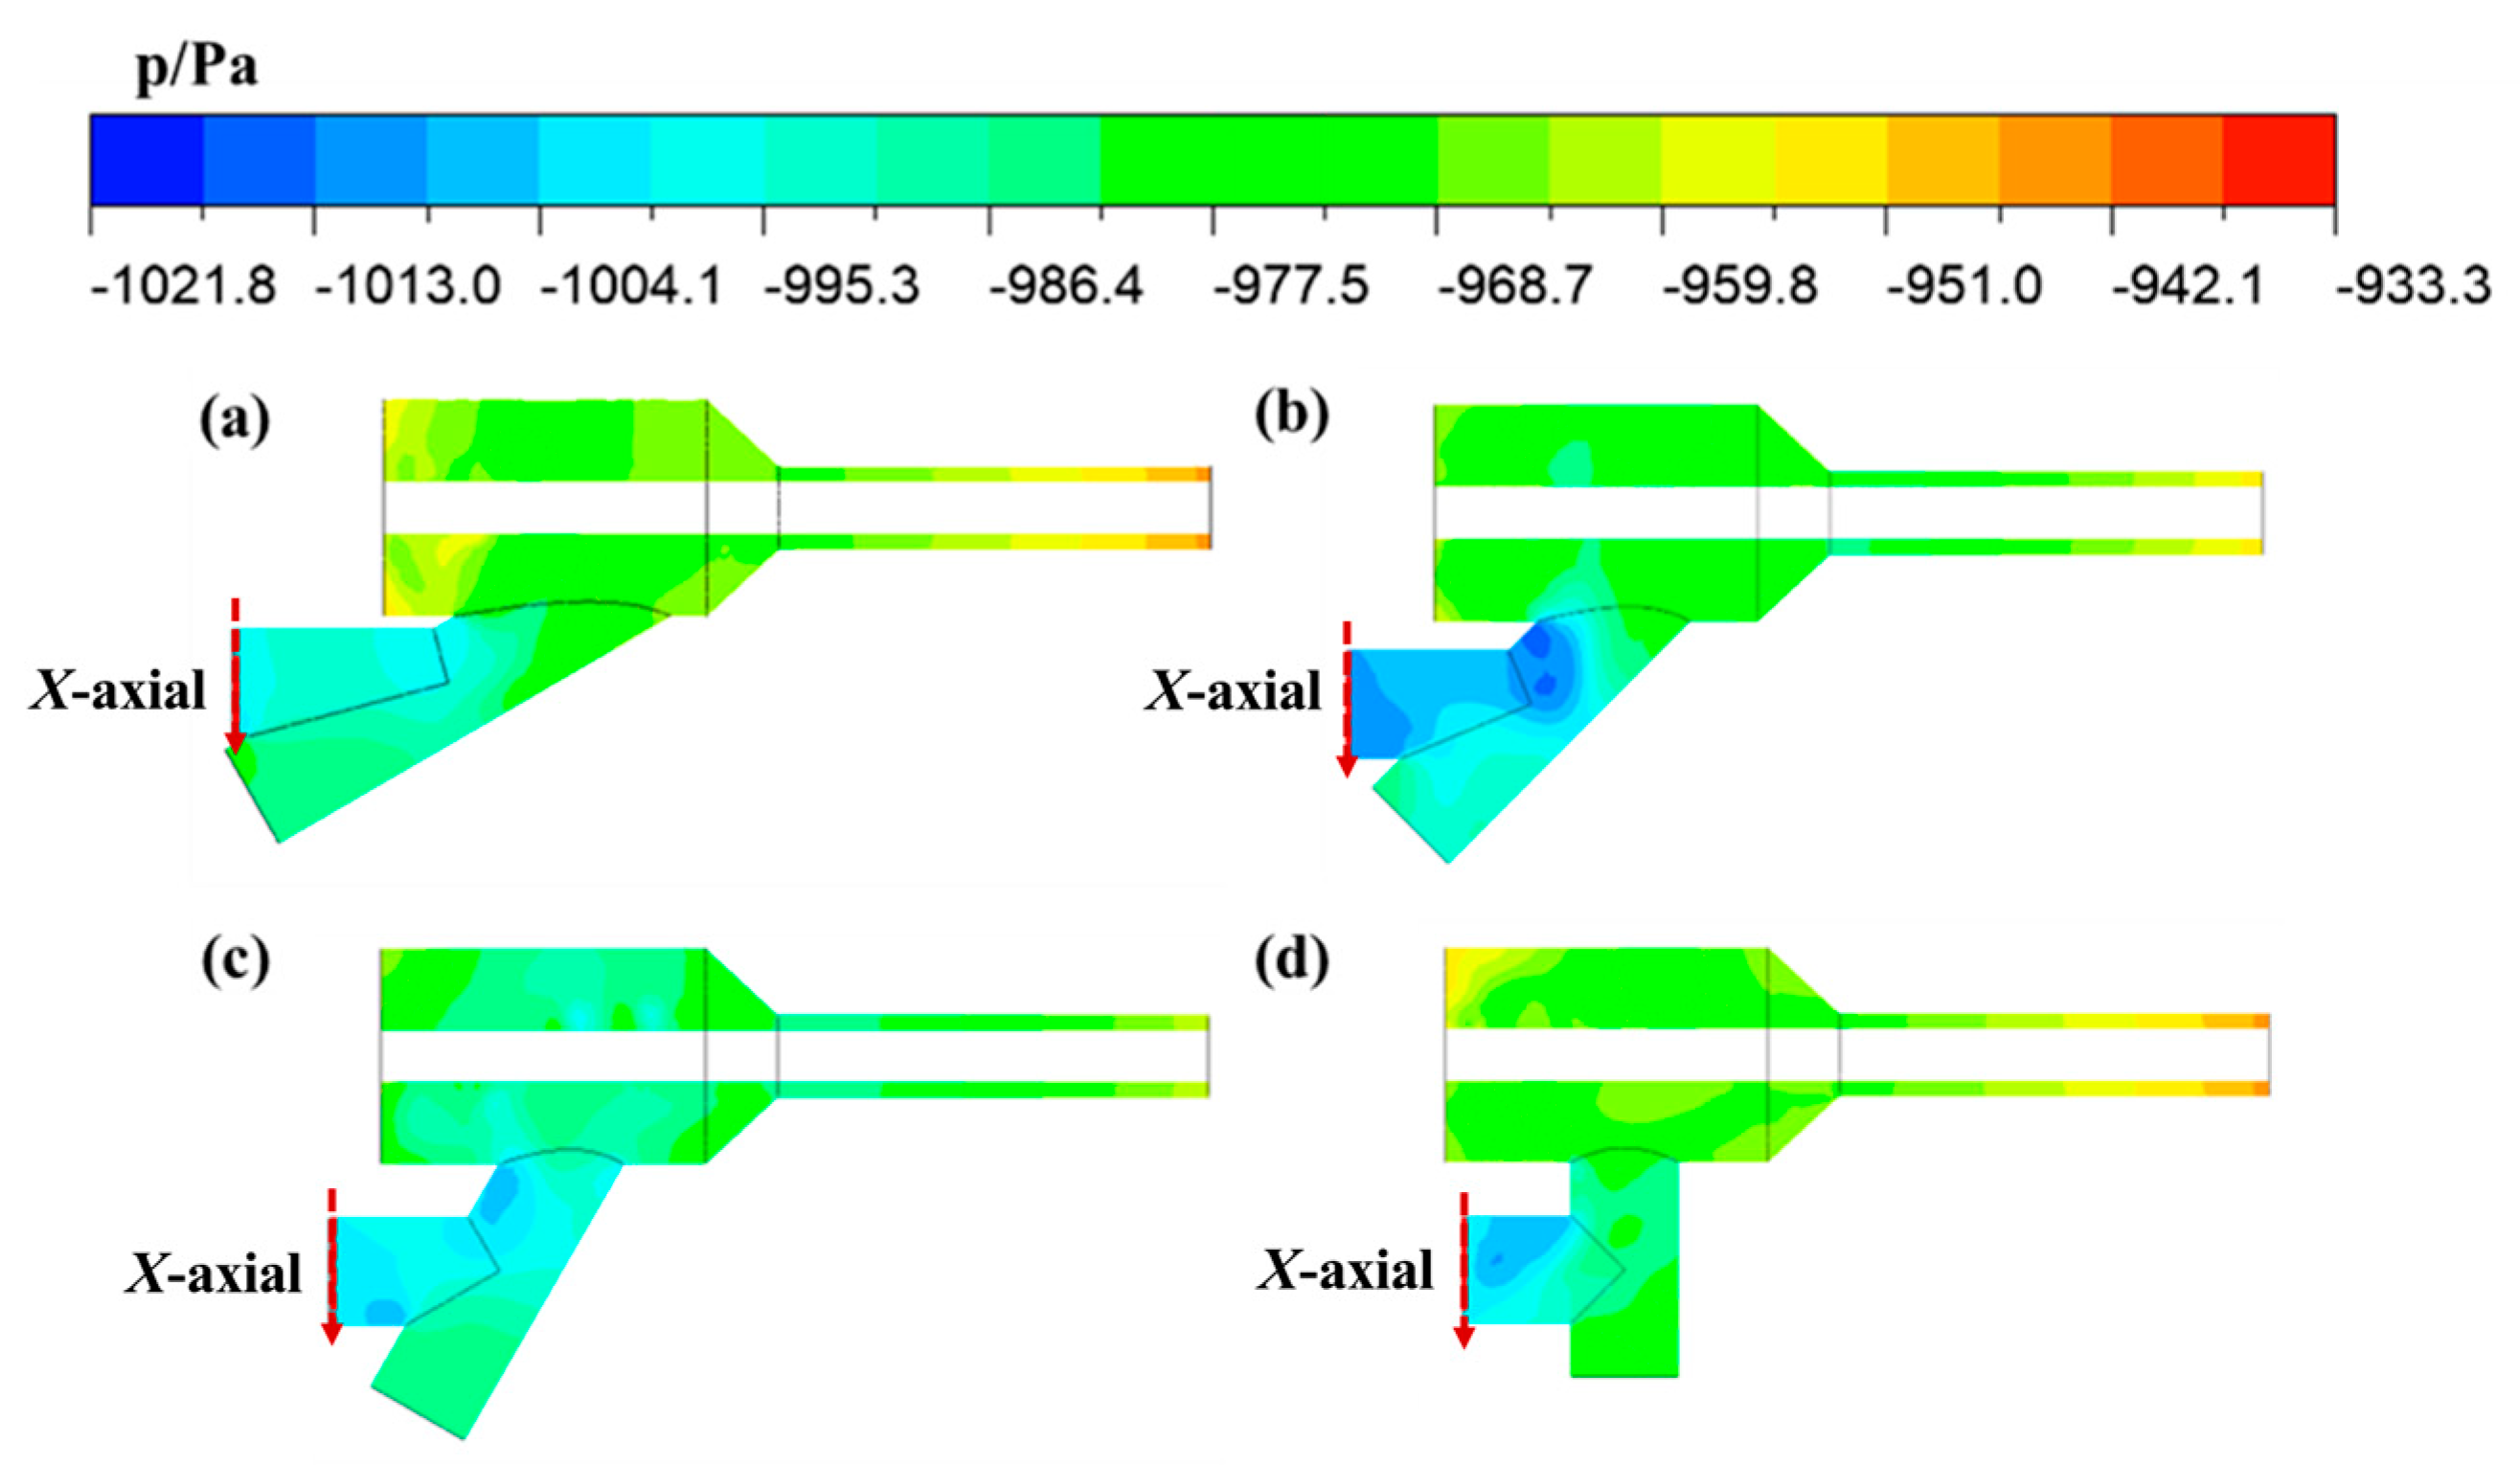
3.2. Influence of the Angle between the Cavity and the Slag Discharge Port on Dust Collection Performance

Given that the dust extraction pipe was located in the lower part of the cavity, to analyze the effects of the angle of the slag discharge pipe, four physical models with different angles of the slag discharge pipe placement (30°, 45°, 60°, and 90°) were established, as shown in Figure 10.
The meshing and model solving of the four dust collection devices with different slag discharge pipe arrangement angles were performed according to the procedures described above. Figure 11 shows the pressure field distribution results of the cross-sections of the devices. It is observed in Figure 11 that the entire device was affected by negative pressure under the influence of the suction force at the dust extraction pipe. The negative pressure of the fixing pipe was the smallest at the location where the dust-laden airflow entered the device. Approaching the dust extraction pipe, the absolute value of the negative pressure inside the device gradually increased, and the pressure reached the maximum magnitude at the dust extraction pipe. As the angle of the slag discharge pipe changed, the negative pressure in the dust extraction pipe first increased and then decreased with an increasing angle between the slag discharge pipe and the cavity.
To quantitatively analyze the variations of the negative pressure in the dust extraction pipe at different arrangement angles of the slag discharge pipe, the pressure distribution curves along the cross-sectional diameter of the pipe port (represented by the red line in Figure 11) were plotted, as shown in Figure 12. Figure 12 illustrates that with an increasing angle of the slag discharge pipe, the negative pressure of the dust extraction port first increased and then decreased. At an angle of 45°, the maximum negative pressure of the pipe port of −1012.38 Pa was reached. When the angle between the cavity and the slag discharge port was small, the connection area of the dust extraction pipe and the slag discharge pipe differed greatly from the cross-sectional area of the dust extraction pipe, and the diameter change increased the local resistance. As the angle between the cavity and the slag discharge port gradually increased, the connection area of the pipes became more similar to the cross-sectional area of the dust extraction pipe, and the local resistance caused by the diameter change slowly decreased. Nevertheless, a larger bending angle of the pipe resulted in an increase in local resistance, leading to a negative pressure loss. Therefore, by taking the effects of local resistance due to diameter difference and bending into consideration, the kinetic energy loss of the dust-laden airflow could be minimized by setting the angle between the cavity and the slag discharge port to 45°, and the utilization rate of the negative pressure of the dust extraction pipe could be improved.

3.3. Influence of the Angle between the Cavity and the Slag Discharge Port on Dust Collection Performance

To examine the effects of the cavity diameter, three physical models with three different cavity diameters (200, 300, and 400 mm) and a slag discharge pipe angle of 45° were used, as shown in Figure 13.
The meshing and model solving of the orifice dust collection devices with different cavity diameters were performed according to the procedures described above. Figure 12 presents the velocity field distribution results of the cross-sections of the devices. As shown in Figure 14, the dust-laden airflow entered the cavity from the orifice fixing tube and diffused rapidly across the entire cavity. For stable dust-laden airflow, as the cavity diameter increased, the flow rate of the dust-laden airflow in the cavity was gradually reduced, which had an enhanced buffering effect on the dust-laden airflow. To quantitatively study the buffering effects of the orifice dust collection devices with different cavity diameters on the dust-laden airflow, the velocity distribution curves of the dust-laden airflow along the radial direction of the cavity (denoted by the red line in Figure 14) were plotted, as shown in Figure 15. It was observed that due to the gradual diffusion of the dust-laden airflow in the cavity, the airflow velocity first increased and then decreased. The maximum velocities of the dust-laden airflow were 6.46, 4.38, and 2.34 m/s for cavity diameters of 200, 300, and 400 mm, respectively. Hence, the strongest buffering effect of the dust-laden airflow was obtained when the cavity diameter was set to 400 mm. However, as the cavity diameter increased, the negative pressure distribution inside the device was also strongly affected. Therefore, to more comprehensively analyze the influence of the cavity diameter on the internal pressure of the device, the internal pressure field distributions of the devices were obtained, as illustrated in Figure 16.
According to Figure 16, as the cavity diameter increased, the negative pressure inside the dust extraction pipe gradually decreased, which is not favorable for dust extraction. The increase in the cavity diameter led to an increase in local resistance at the connection between the orifice fixing pipe and the cavity, which in turn led to an increase in the negative pressure loss. To quantitatively evaluate the negative pressure distribution at the dust extraction pipe port, the pressure distribution curves along the cross-sectional diameter of the pipe port (represented by the red line in Figure 16) were plotted, as shown in Figure 17. According to the figure, the maximum negative pressure values at the dust extraction pipe port were equal to −1014.09, −1012.38, and −996.25 Pa for cavity diameters of 200, 300, and 400 mm, respectively. When the cavity diameter was 400 mm, the negative pressure was the lowest, which is not favorable for dust extraction. Therefore, considering the influence of the negative pressure loss on dust extraction and the influence of the overall volume and weight of the device on the convenience of use, the cavity diameter was set to 300 mm. With this diameter, the dust-laden airflow velocity in the cavity was lower than 4.38 m·s−1, and the maximum negative pressure of the dust extraction pipe was −1012.38 kPa.

3.4. Field Testing of the Performance of the Proposed Orifice Dust Collection Device

3.4.1. Field Testing Method

To test the sealing performance of the new orifice dust collection device against drill dust, an orifice dust collection device was developed according to the optimal structural parameters determined in the above analysis. Field tests were carried out at the drilling site of the working face of the II8225 mechanized tunnel of Taoyuan Coal Mine. The new orifice dust collection device was used instead of the original device. The slag discharge pipe was connected to the air duct so that the large slag particles were discharged to the transportation belt for subsequent treatment. The air duct of the negative-pressure dust removal device was connected to the dust extraction pipe of the device to provide the power for dust extraction. The field test setup is shown in Figure 18.
In the process of dry drilling, an IFC-2 explosion-proof dust sampler was used to measure the dust concentration at the three monitoring points after the new orifice dust collection device was introduced. The sealing improvement rate of the new orifice dust collection device compared with the original device was calculated using Equation (1):
η = ((Q1Q2)/Q1) × 100%,
where η is the sealing improvement rate of the new orifice dust collection device compared with the original device (%); Q1 is the dust concentration at the monitoring point when the original device is applied (mg·m−3); and Q2 is the dust concentration at the monitoring point after the application of the new device (mg·m−3).

3.4.2. Test Result Analysis

Figure 19 presents the dust concentrations at the monitoring points and the sealing enhancement rates after the new orifice dust collection device was used. It was evident that the dust concentrations of all monitoring points were greatly reduced after the application of the new device. At monitoring point 1, the dust sealing performance improved by 92.5%, suggesting that the dust extraction pipe of the new orifice dust collection device was more effective after optimization. The dust extraction performance was greatly improved, and the problem of dust spillage at the slag discharge was solved effectively. At monitoring point 2, the device showed improved sealing performance by 88.5%, revealing that the cavity enabled effective expansion and buffering of the airflow and that the thickened sealing rings provided significant sealing. The angle of the slag discharge port was more favorable for slag discharge. The problem of dust leakage at the connection between the dust collection device and the drill pipe was addressed. At monitoring point 3, the device increased the sealing performance by 89.1%, indicating that the tunnel environment was improved after the sealing at the slag discharge port and the connection between the device and the drill pipe was strengthened. Overall, the new orifice dust collection device demonstrated remarkable sealing performance on dust from drill holes and provides a new solution for dust management in dry drilling.

4. Conclusions

According to the characteristics of dry drilling of coal seam and the actual field requirements, this study designed a highly efficient orifice dust collection device for dry drilling. The optimal structural parameters of the device were determined by numerical simulations, and field tests were carried out at the drilling site of the working face of the II8225 mechanized tunnel in the Taoyuan Coal Mine. The main conclusions are as follows:
(1)
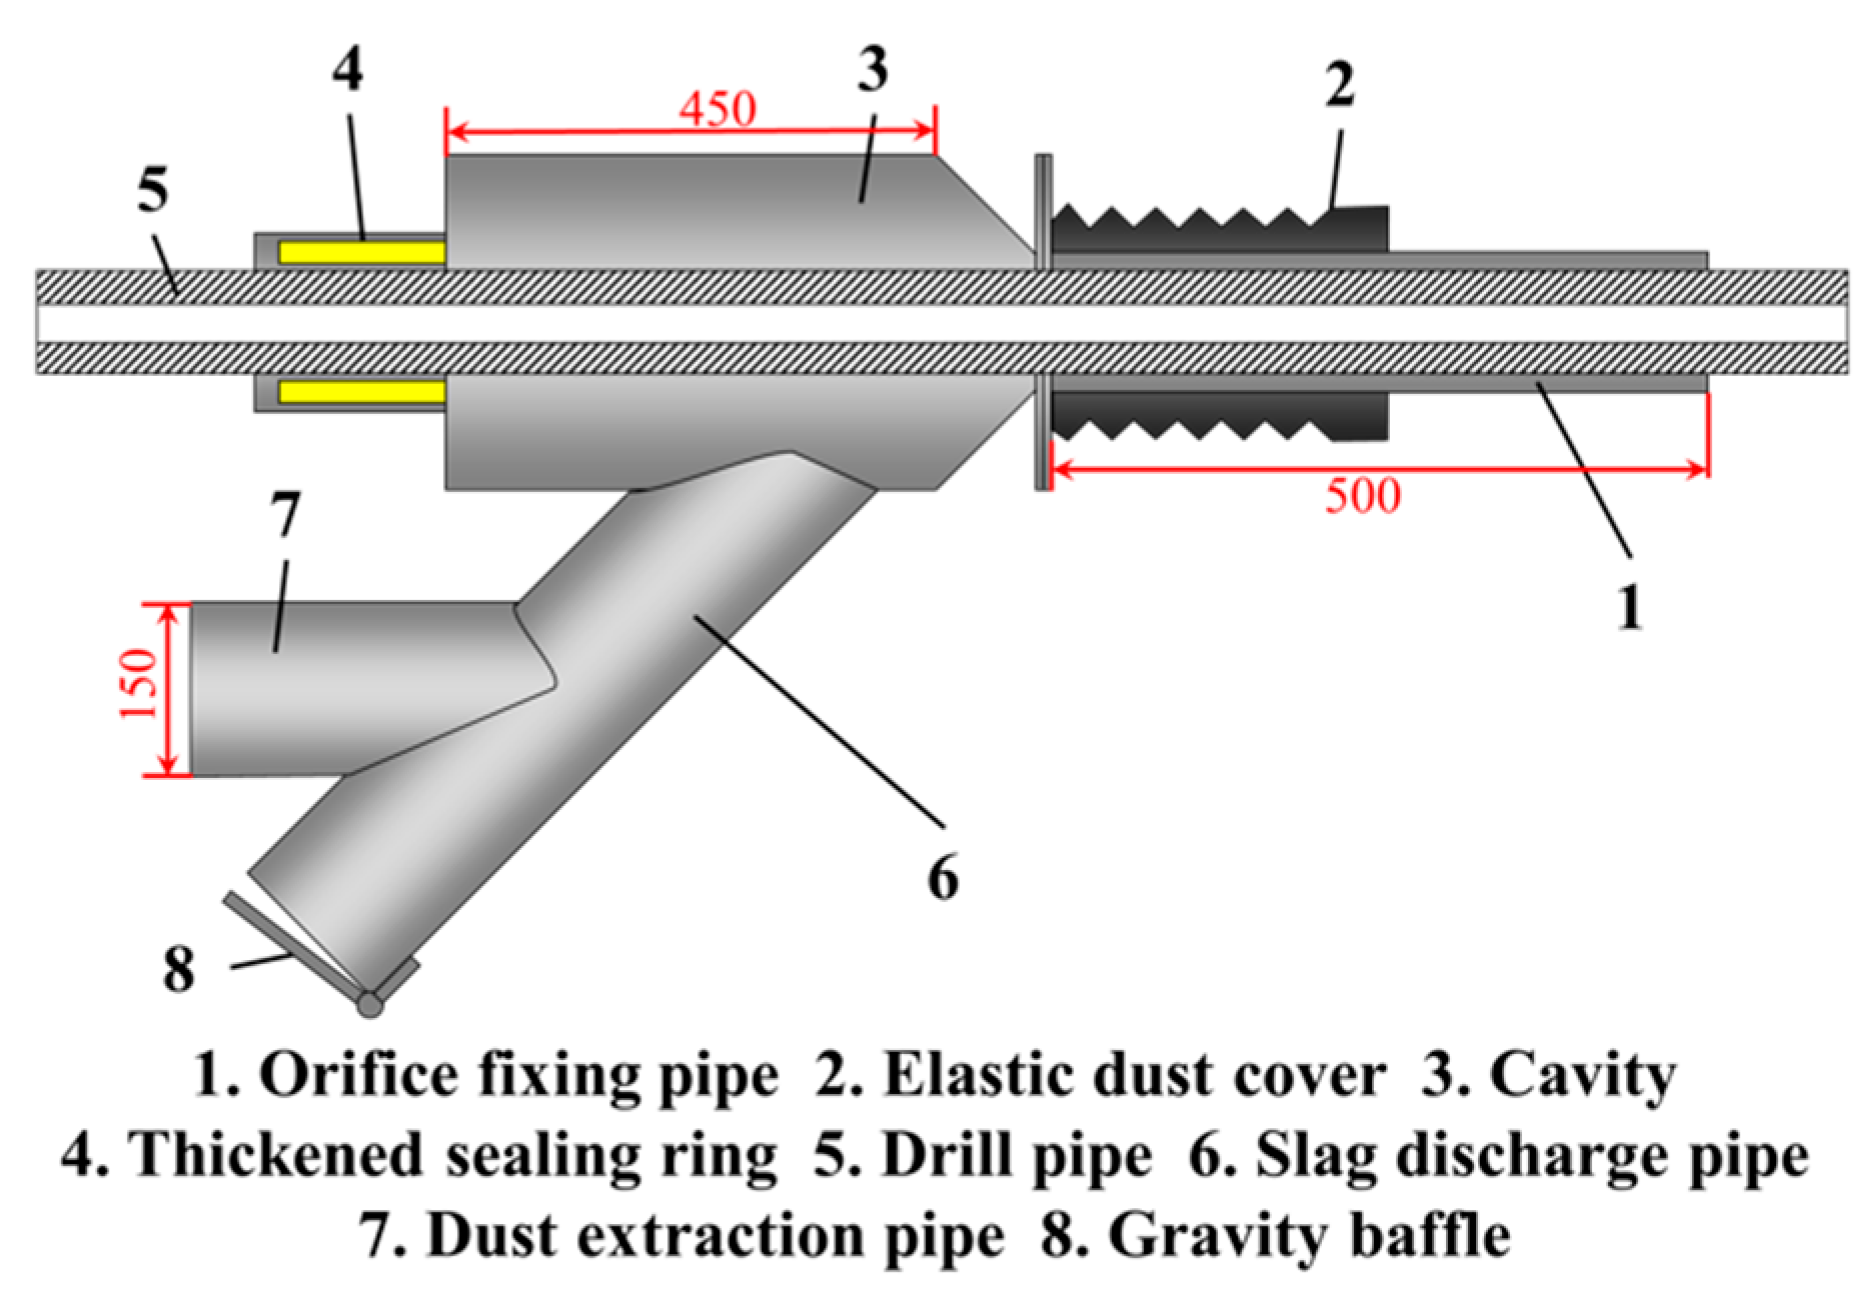
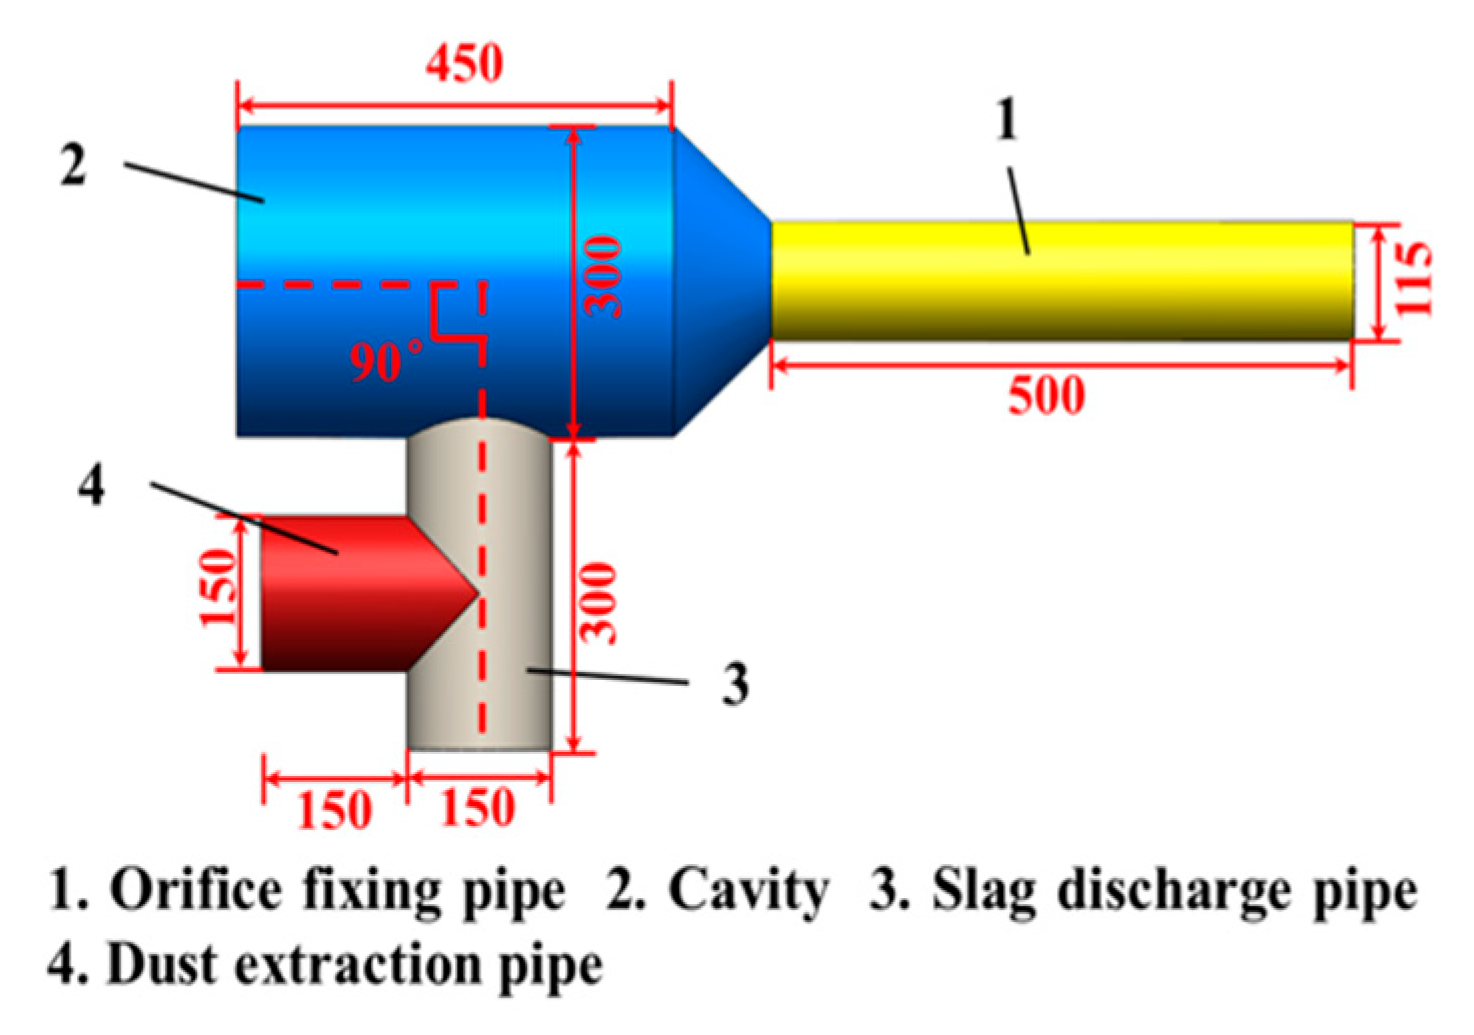
A new orifice dust collection device is presented. It is composed of four parts: an orifice fixing tube, a cavity, a slag discharge pipe, and a dust extraction pipe.
(2)
When the dust extraction pipe was located in the lower part of the device, the average wind speed in the dust extraction pipe reached 8.32 m·s−1. At the same time, the dust-laden airflow velocity was the largest under the same negative pressure condition of the dust extraction.
(3)
The maximum negative pressure at the dust extraction pipe port first increased but then decreased with an increasing angle between the slag discharge pipe and the cavity. When the angle was equal to 45°, the maximum negative pressure at the dust extraction pipe port of −1012.38 Pa was reached. Additionally, the local resistance and negative pressure loss were minimal, whereas the utilization rate of the negative pressure for dust extraction was the highest.
(4)
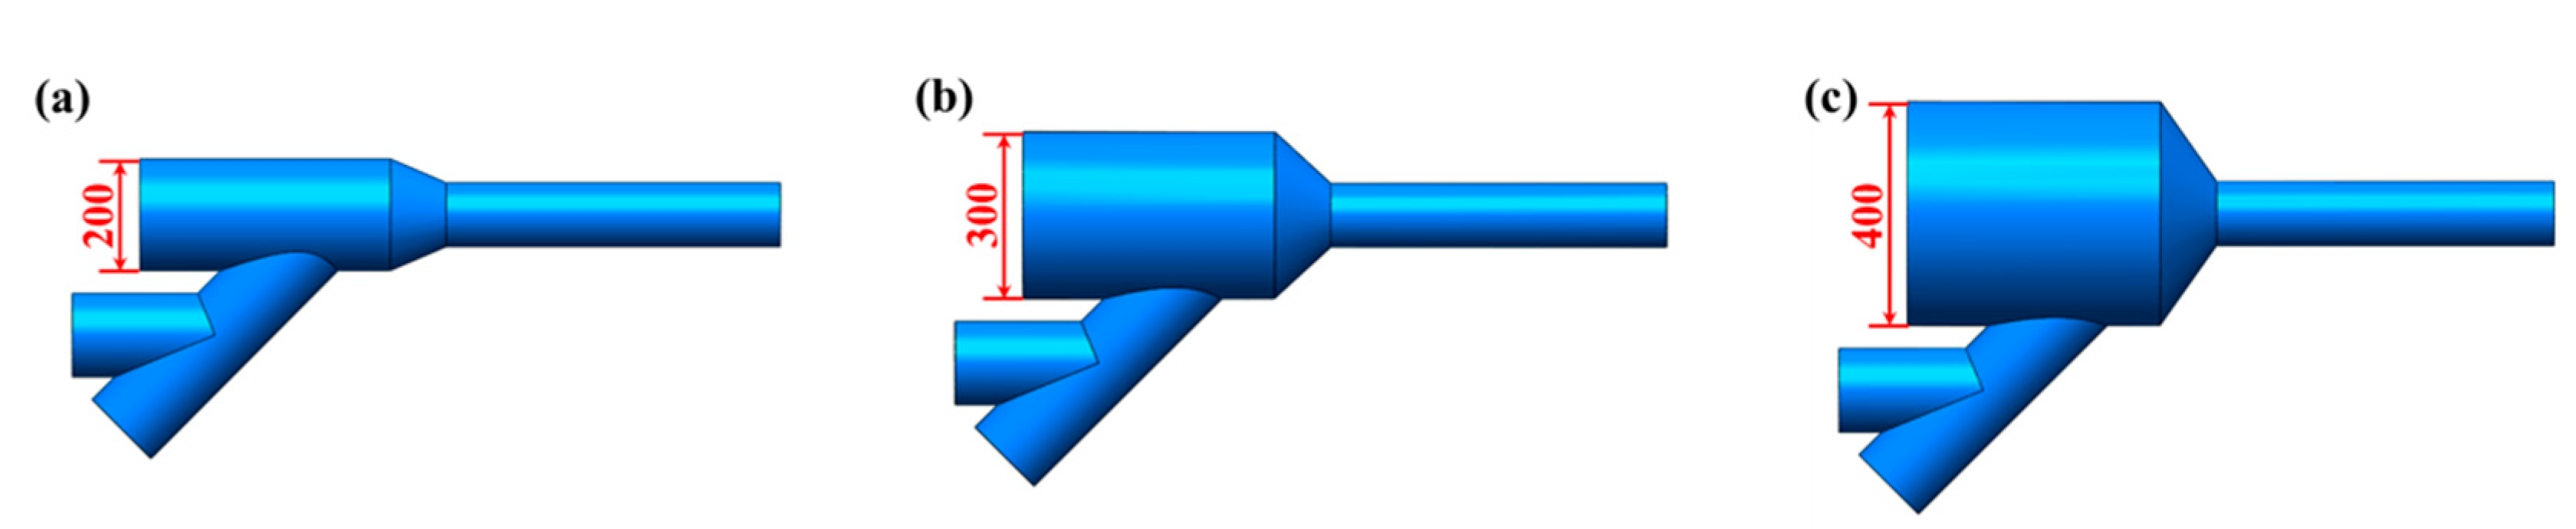
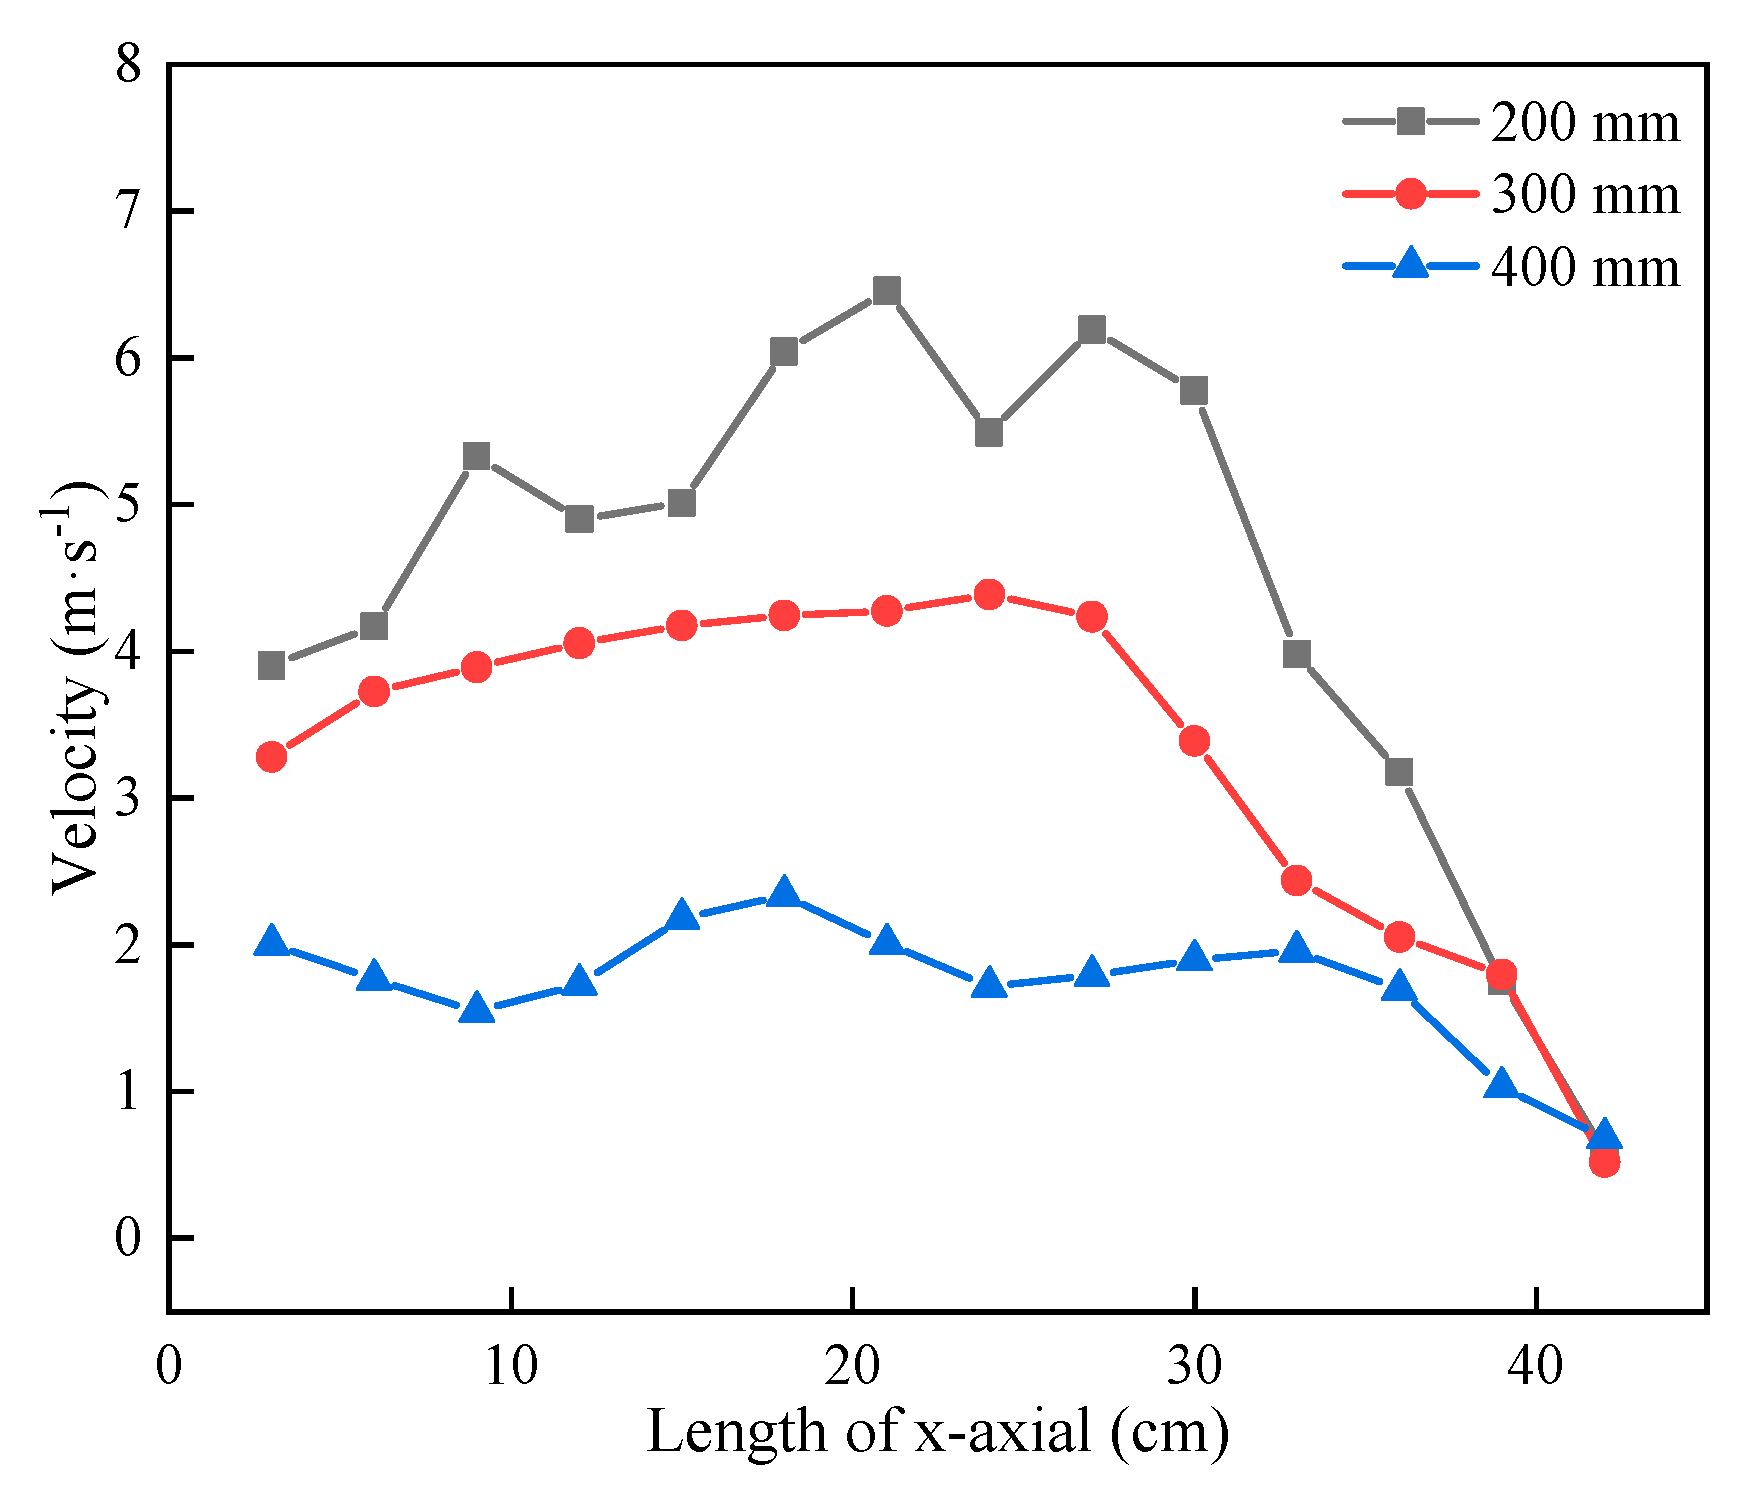
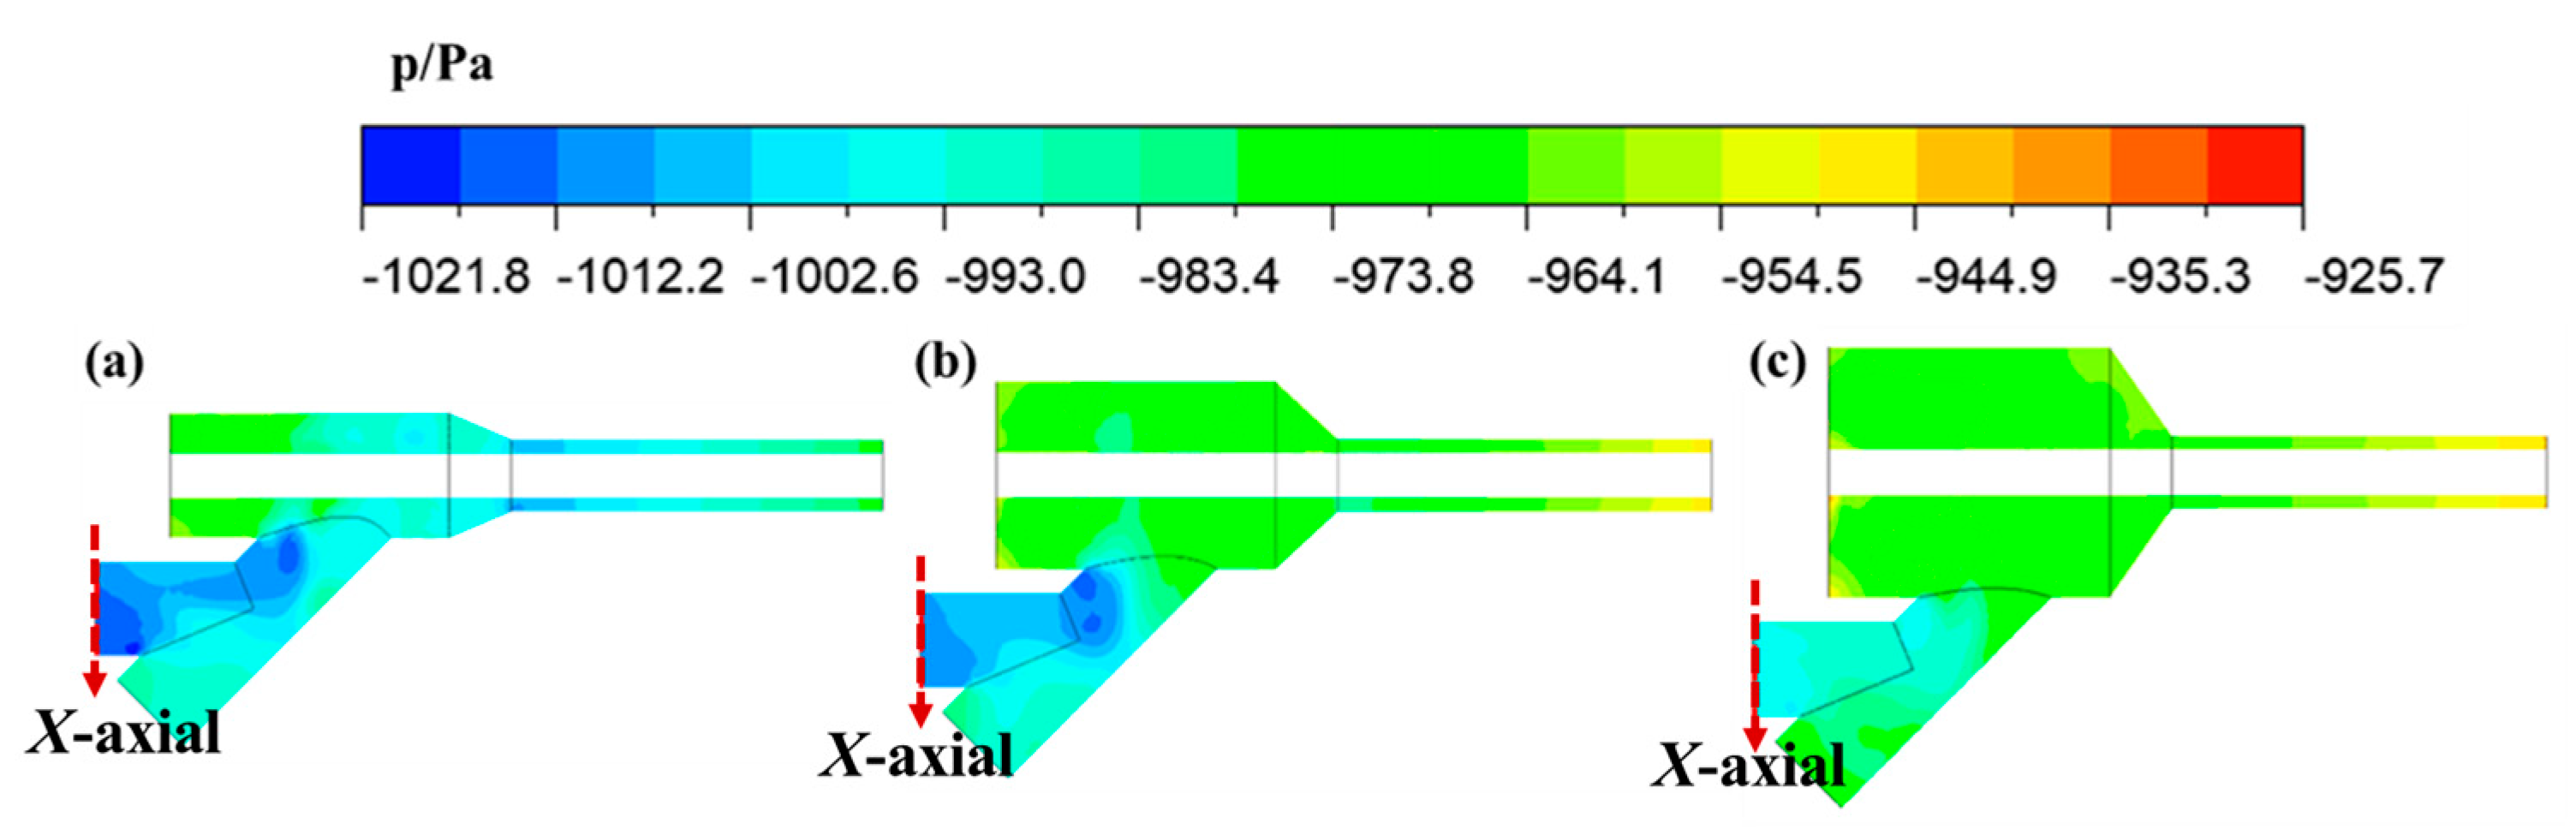
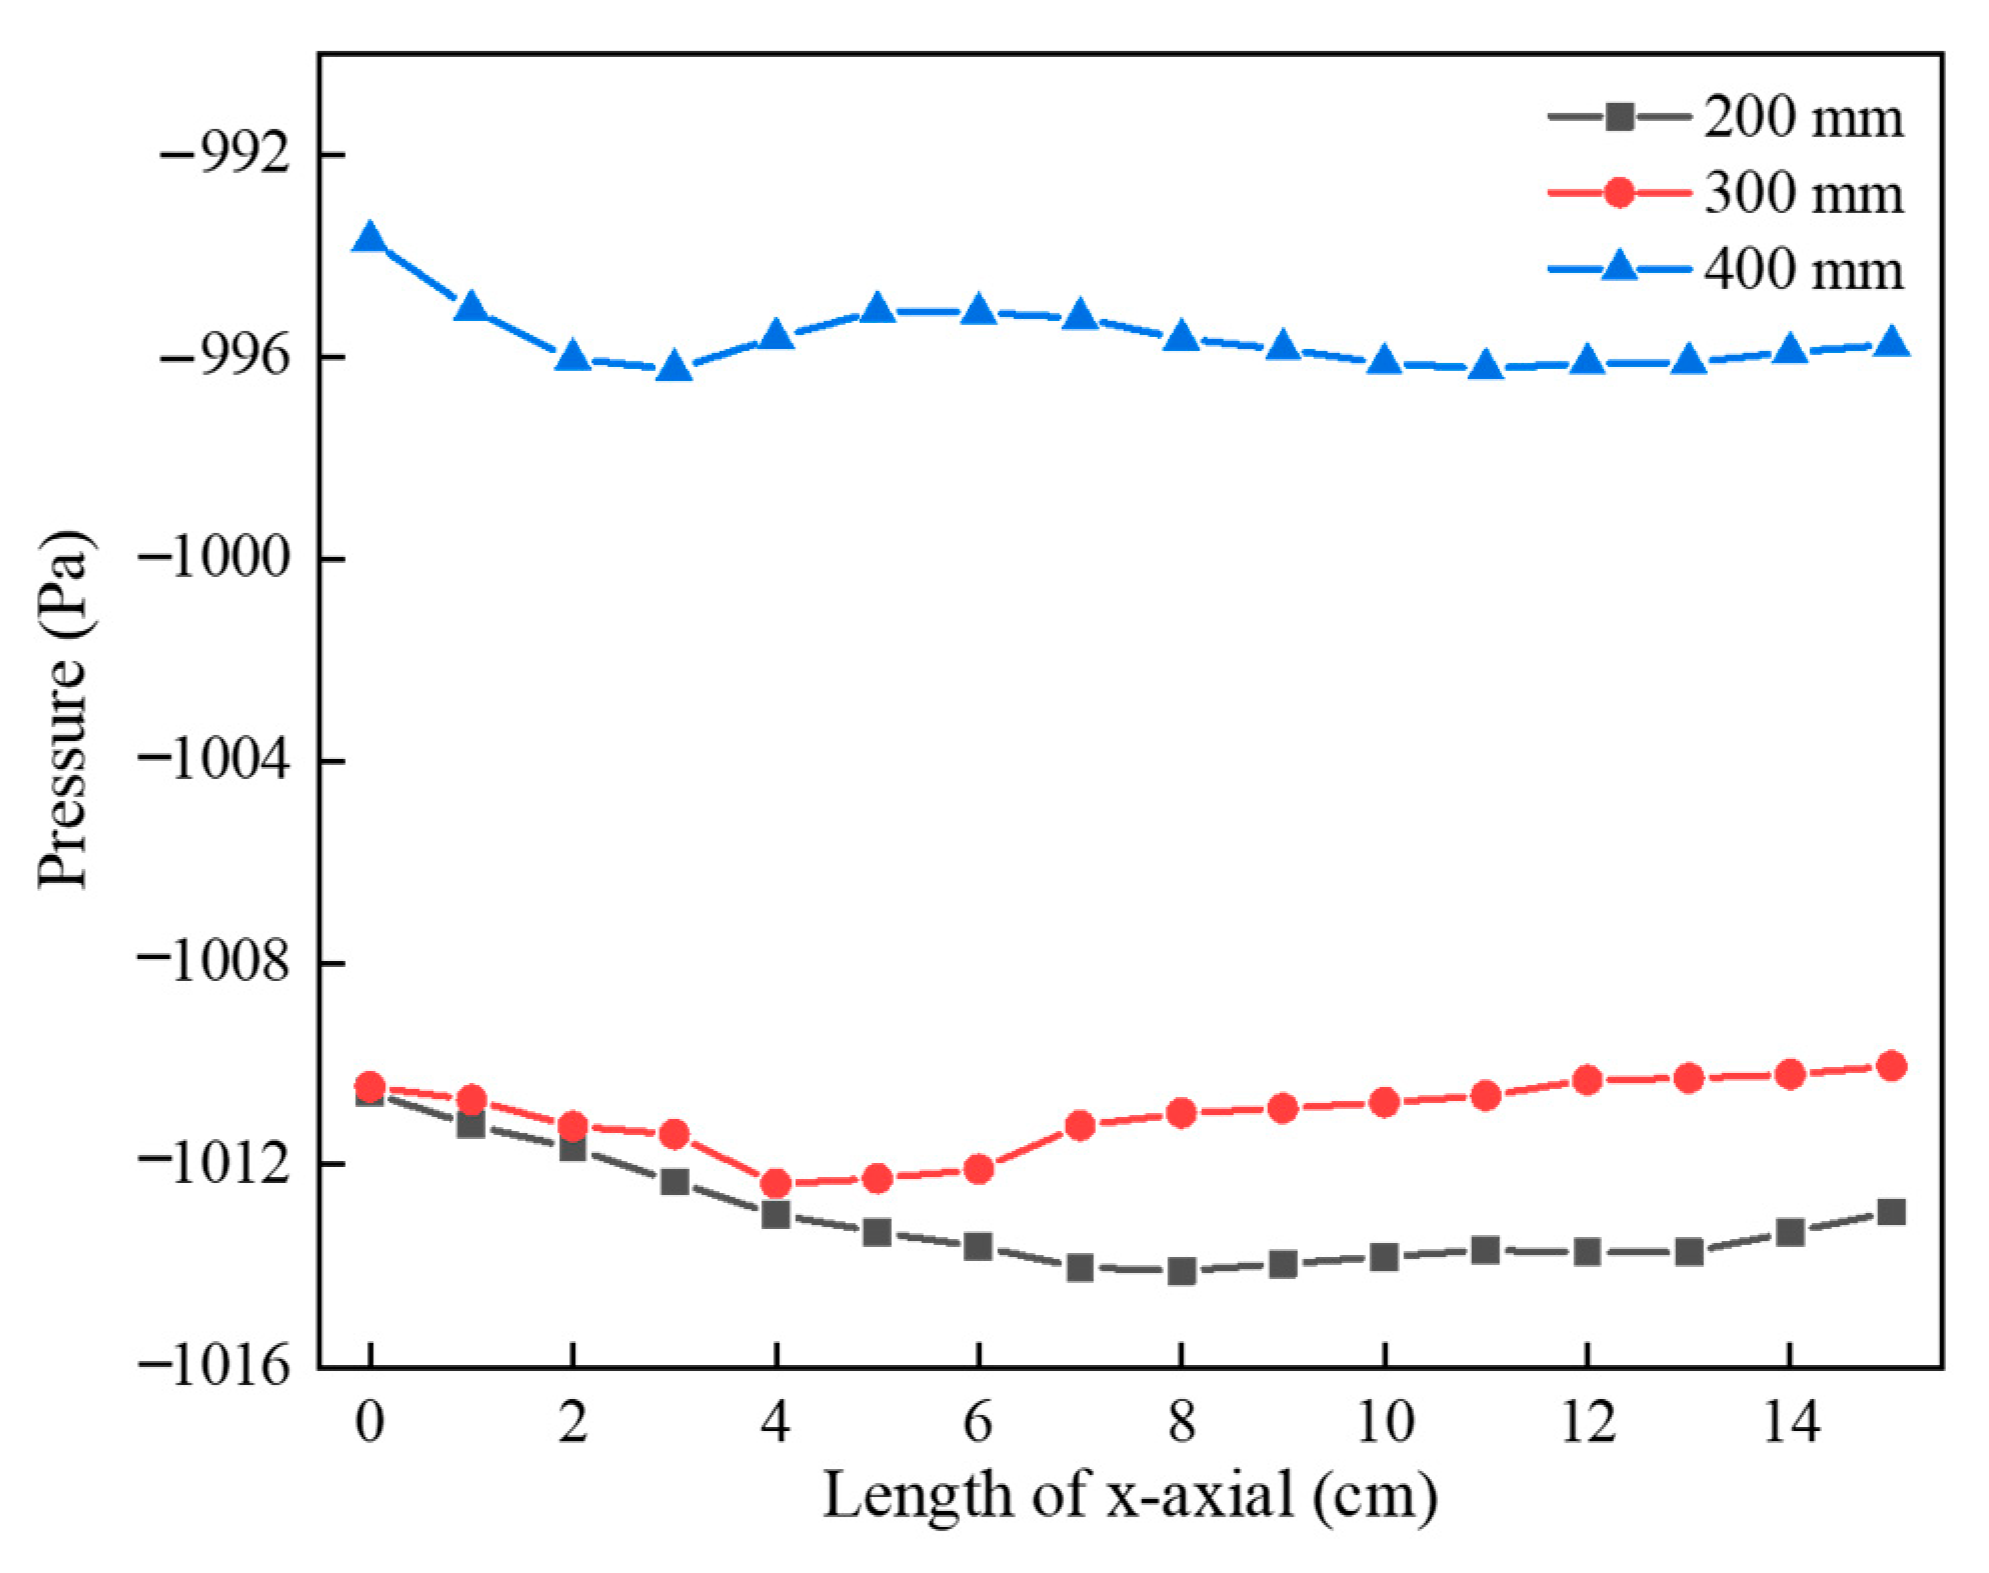
The velocity of the dust-laden airflow in the cavity decreased with an increasing cavity diameter. By contrast, the maximum negative pressure at the dust extraction pipe port increased with the cavity diameter. When the cavity diameter was 300 mm, the velocity of the dust-laden airflow in the cavity was lower than 4.38 m·s−1, and the maximum negative pressure at the dust extraction pipe port reached −1012.38 kPa.
(5)
Field tests showed that after applying the new orifice dust collection device, the dust suppression efficiency reached 92.5%, 88.5%, and 89.1% at the slag discharge port, the connection between the device and the drill pipe, and 6 m from the drill hole on the downwind side, respectively. These results indicate that the device has a significant suppression effect on drill dust.

Author Contributions

Conceptualization, J.L., H.Z., Y.Z. and L.J.; Data curation, H.Z.; Formal analysis, J.L., Y.Z. and T.W.; Funding acquisition, J.L.; Investigation, H.Z., Y.Z., G.L., Y.T., L.W., B.W. and X.W.; Methodology, H.Z., Y.Z., T.W., Y.T. and J.Y.; Project administration, J.L.; Resources, G.L., J.Y., L.W., B.W. and X.W.; Software, H.Z., T.W. and Y.T.; Supervision, J.L. and L.J.; Validation, H.Z.; Writing—original draft, J.L., H.Z., Y.Z., T.W. and J.Y.; Writing—review and editing, J.L. and L.J. All authors have read and agreed to the published version of the manuscript.

Funding

This research was funded by the National Key Research and Development Program of China (No. 2022YFC2903901), the National Nature Science Foundation of China (No. 52204198), the NHC Key Laboratory for Engineering Control of Dust Hazard (No. KLECDH20220201), the State Key Laboratory of Safety and Health for Metal Mines (2022-JSKSSYS-02), the Fundamental Research Funds for the Central Universities (No. FRF-TP-22-115A1), and the Fellowship of the China Postdoctoral Science Foundation (2022M710355).

Data Availability Statement

Not applicable.

Conflicts of Interest

The authors declare no conflict of interest.

References

  1. Liu, H.B.; Liu, H.; Cheng, Y.P. The elimination of coal and gas outburst disasters by ultrathin protective seam drilling combined with stress-relief gas drainage in Xinggong coalfield. J. Nat. Gas Sci. Eng. 2014, 21, 837. [Google Scholar] [CrossRef]
  2. Kang, Y.; Geng, Z.; Liu, B.; Chen, J. Study on gas extraction efficiency using in-seam borehole method considering influence of plastic zone induced by borehole drilling. Geomech. Energy Environ. 2023, 33, 100426. [Google Scholar] [CrossRef]
  3. Huang, S.; Lu, Y.; Ge, Z.; Zhou, Z.; Guan, Y.; Chen, X. Fracture Mechanism of Coal Seams Induced by a Multibranched Borehole Drilling (MBBD) Technique to Enhance Coalbed Methane (CBM) Extraction. Energy Fuels 2023, 37, 13034–13047. [Google Scholar] [CrossRef]
  4. Zhao, H.; Li, J.; Liu, Y.; Wang, Y.; Wang, T.; Cheng, H. Experimental and measured research on three-dimensional deformation law of gas drainage borehole in coal seam. Int. J. Min. Sci. Technol. 2020, 30, 397–403. [Google Scholar] [CrossRef]
  5. He, S.; Ou, S.; Lu, Y.; Jin, L.; Chen, T.; Ma, Y. Failure mechanism of methane drainage borehole in soft coal seams: Insights from simulation, theoretical analysis and in-borehole imaging. Proc. Saf. Environ. Prot. 2022, 168, 410. [Google Scholar] [CrossRef]
  6. Ding, Q. A new technology for the drilling of long boreholes for gas drainage in a soft coal seam. J. Pet. Sci. Eng. 2016, 137, 107. [Google Scholar]
  7. Gong, X. Research on dry-type dust removing device of borehole based on pressure air dust control and ring slot ejecting technology. Saf. Coal Mines 2021, 52, 95. [Google Scholar]
  8. Steven, A.K.; Kramer, D.L.; Michael, K. A numerical study on optimization of multilateral horizontal wellbore patterns for coalbed methane production in Southern Shanxi Province, China. Int. J. Coal Geol. 2011, 86, 306. [Google Scholar]
  9. Li, H.; Wang, W.; Liu, Y.; Ma, J.; Gao, H. An integrated drilling, protection and sealing technology for improving the gas drainage effect in soft coal seams. Energy Rep. 2020, 6, 2030–2043. [Google Scholar] [CrossRef]
  10. Wu, D.; Gao, J.; Lu, K. Dust control technology in dry directional drilling in soft and broken coal seams. Energies 2022, 15, 3804. [Google Scholar] [CrossRef]
  11. Wang, Y.; Chen, H.; Long, R.; Yang, M. Health economic loss measurement and risk assessment of new cases of coal worker’s pneumoconiosis in China. Saf. Sci. 2020, 122, 104529. [Google Scholar] [CrossRef]
  12. Liu, J.; Wang, S.; Jin, L.; Wei, Y.; Ou, S.; Wang, T.; Tao, G. Surface pore characteristics of original coal dust produced in underground mining sites and their impact on the moisture content. Proc. Saf. Environ. Prot. 2022, 167, 284–298. [Google Scholar] [CrossRef]
  13. Wu, Y.; Meng, X.; Zhang, Y.; Shi, L.; Wu, Q.; Liu, L.; Wang, T. Experimental study on the suppression of coal dust explosion by silica aerogel. Energy 2023, 267, 126372. [Google Scholar] [CrossRef]
  14. Hou, Z.; Wang, D.; Zhu, Y.; Luo, S.; Zhong, Q.; Liu, Z.; Zhang, Y. Experimental study on pressure wave-induced explosion of different types of deposited coal dust. Proc. Saf. Environ. Prot. 2023, 172, 825. [Google Scholar] [CrossRef]
  15. Liu, J.; Zhou, Z.; Jin, L.; Wang, T.; Ou, S.; Wang, S.; Jueraiti, M. Effect of coal dust content on the low-temperature oxidation of silo coal. ACS Omega 2022, 7, 37442–37451. [Google Scholar] [CrossRef] [PubMed]
  16. Ji, M.; Sun, Z.; Guo, H. The application of the foam technology to the dust control for reducing the dust injury of coal mines. Appl. Sci. 2022, 12, 10878. [Google Scholar] [CrossRef]
  17. Wang, S.L. Universal equipment of preventing gas and dust overrun in drilling. Saf. Coal Mines 2017, 48, 91. [Google Scholar]
  18. Wang, T.; Shi, J.; Zhou, Y.; Jin, L.; Liu, J.; Li, G.; Sun, Z.; Li, J.; Chen, C.; Ding, Y. Research and Development of a New Drilling Dust Removal Device Based on Water Jet Injection and Dry Mist Dust Reduction Technology. Met. Mine 2023, 7, 120. [Google Scholar]
  19. Organiscak, J.A.; Page, S.J. Development of a dust collector inlet hood for enhanced surface mine drill dust capture. Int. J. Surf. Min. Reclam. Environ. 2005, 19, 12–28. [Google Scholar] [CrossRef]
  20. Wu, D.; Gong, X.; Lu, K. Research on dust control technology of dry directional drilling in soft—Fragmentized coal seam. Min. Saf. Environ. Prot. 2021, 48, 61. [Google Scholar]
  21. Fan, X. Research and application of blowout preventer for gas drainage drilling. Coal Technol. 2023, 42, 158. [Google Scholar]
  22. Lu, Y.; Wang, J.; Jiang, L.Y. Design and experimental study of drilling hole dust collector apparatus used in coal drilling. J. China Coal Soc. 2011, 36, 1725. [Google Scholar]
  23. Cheng, L.; Lu, Y.; Ge, Z. Design and experimental study of gas-solid ejecting dust removal apparatus used in coal drilling. J. Basic Sci. Eng. 2015, 23, 1109. [Google Scholar]
  24. Fu, B.; Ma, S. Coal mine drilling hole filter design and research. Min. Proc. Equip. 2016, 37, 157. [Google Scholar]
  25. GBZ2.1-2019; Occupational Exposure Limits for Hazardous Agents in the Workplace—Part 1: Chemical Hazardous Agents. The National Health Commission: Beijing, China, 2019.
  26. Yin, H.; Zhao, P.; Chen, T. Development and application of convenient blowout preventer. Coal Technol. 2020, 39, 163. [Google Scholar]
  27. Sun, Y.; Chen, J.; Zhang, B. Design and research on new deduster gravity automatic drain slag funnel. Coal Mine Mach. 2010, 31, 37. [Google Scholar]
  28. Wang, T.; Liu, J.; Wang, S.; Jin, L.; Lin, M.; Ou, S. Enhancement of the wettability of a coal seam during water injection: Effect and mechanism of surfactant concentrations above the CMC. Environ. Sci. Pollut. Res. 2023, 30, 39857–39870. [Google Scholar] [CrossRef]
  29. Liu, J.; Wang, S.; Jin, L.; Wang, T.; Zhou, Z.; Xu, J. Water-retaining properties of NCZ composite dust suppressant and its wetting ability to hydrophobic coal dust. Int. J. Coal Sci. Technol. 2021, 8, 240–247. [Google Scholar] [CrossRef]
  30. Zhang, W.; Hu, Q.; Jiang, S.; Wang, L.; Chai, J.; Mei, J. Experimental study on coal dust wettability strengthened by surface active ionic liquids. Environ. Sci. Pollut. Res. 2022, 29, 46325–46340. [Google Scholar] [CrossRef]
  31. Wang, P.; Tan, X.; Zhang, L.; Li, Y.; Liu, R. Influence of particle diameter on the wettability of coal dust and the dust suppression efficiency via spraying. Proc. Saf. Environ. Prot. 2019, 132, 189–199. [Google Scholar] [CrossRef]
Figure 1. Configuration of the test setup and monitoring points. (a) Original orifice dust collection device; (b) layout of monitoring points.
Processes 11 02942 g001
Figure 2. Schematic diagram of the new orifice dust collection device.
Processes 11 02942 g002
Figure 3. A physical model of the orifice dust collection device.
Processes 11 02942 g003
Figure 4. Meshing of the orifice dust collection device model. (a) Local mesh refinement; (b) mesh quality.
Processes 11 02942 g004
Figure 5. The SEM of coal dust.
Processes 11 02942 g005
Figure 6. The validation model (a) and results (b).
Processes 11 02942 g006
Figure 7. Physical models of orifice dust collection devices with different dust extraction pipe positions. (a) Dust extraction pipe on the top; (b) dust extraction pipe on the side; (c) dust extraction pipe at the bottom.
Processes 11 02942 g007
Figure 8. Velocity field distributions in devices with dust extraction pipes installed at different positions. (a) Dust extraction pipe on the top; (b) dust extraction pipe on the side; (c) dust extraction pipe at the bottom.
Processes 11 02942 g008
Figure 9. Velocity distribution curves of the cross-sections of the ports when the dust extraction pipes were in different locations.
Processes 11 02942 g009
Figure 10. Physical models of the orifice dust collection devices with different angles of slag discharge pipe arrangement: (a) 30°, (b) 45°, (c) 60°, and (d) 90°.
Processes 11 02942 g010
Figure 11. Pressure field distributions of the devices with different slag discharge pipe angles: (a) 30°, (b) 45°, (c) 60°, and (d) 90°.
Processes 11 02942 g011
Figure 12. Pressure distribution curves of the cross-section of the port with different slag discharge pipe angles.
Processes 11 02942 g012
Figure 13. Physical models of the orifice dust collection devices with different cavity diameters. (a) 200 mm, (b) 300 mm, and (c) 400 mm.
Processes 11 02942 g013
Figure 14. Velocity field distributions of devices with different cavity diameters: (a) 200 mm, (b) 300 mm, and (c) 400 mm.
Processes 11 02942 g014
Figure 15. Velocity field distributions of the device with different cavity diameters along the radial direction of the cavity.
Processes 11 02942 g015
Figure 16. Pressure field distributions of the devices with different cavity diameters: (a) 200 mm, (b) 300 mm, and (c) 400 mm.
Processes 11 02942 g016
Figure 17. Pressure distribution curves of the cross-section of the port with different cavity diameters.
Processes 11 02942 g017
Figure 18. Field test setup. (a) Site layout; (b) new orifice dust collection device.
Processes 11 02942 g018
Figure 19. Field test results of the new orifice dust collection device: coal dust concentration (a) and increase rate of dust capture (b).
Processes 11 02942 g019
Table 1. Dust concentration at each monitoring point when the original orifice dust collection device was applied.
Monitoring Point123
Dust Concentration/mg·m−3173253238
Table 2. Boundary condition and parameters settings.
Assumed ConditionsOptions and Parameter Values
Viscous modelRNG k-ε
Gravity9.81 m·s−2
TimeSteady
Inlet velocity of dusty airflow10 m·s−1
Negative pressure value of dust extraction port1000 Pa
Diameter distributionRosin-Rammler
Diameter size range0.3~39 μm
MaterialCoal-lv
Discrete phaseOn
Total flow rate0.0018 kg·s−1
Turbulent dispersionDiscrete random walk model
Boundary cond. typeReflect, trap
Residual monitors10−4
Disclaimer/Publisher’s Note: The statements, opinions and data contained in all publications are solely those of the individual author(s) and contributor(s) and not of MDPI and/or the editor(s). MDPI and/or the editor(s) disclaim responsibility for any injury to people or property resulting from any ideas, methods, instructions or products referred to in the content.

