Article

Explosion Risk of Metal Powder Used in Additive Manufacturing

1
School of Civil and Resource Engineering, University of Science and Technology Beijing, Beijing 100083, China
2
School of Safety Engineering, Beijing Institute of Petrochemical Technology, Beijing 102617, China
3
Guangzhou Academy of Special Equipment Inspection & Testing, Guangzhou 510802, China
4
Zhejiang Auto Control Electronic Information Technology Co., Ltd., Jiaxing 314499, China
5
Zhejiang Top Environmental Technology Co., Ltd., Jiaxing 314006, China
6
Research Institute of Macro-Safety Science, University of Science and Technology Beijing, Beijing 100083, China
*
Author to whom correspondence should be addressed.
Processes 2023, 11(10), 2943; https://doi.org/10.3390/pr11102943
Submission received: 11 September 2023 / Revised: 2 October 2023 / Accepted: 5 October 2023 / Published: 10 October 2023

Abstract

:
The explosive characteristic parameters of additive manufacturing (AM) dust were systematically studied. A systematic experimental study was performed on the characteristic parameters of dust explosions fueled by metal powder for AM, to obtain the distribution pattern of those parameters for four types of AM dust samples. Based on experimental data, the dust-explosive severity was classified via two-dimensional matrix analysis in terms of Pmax and Kst, and the dust-explosive sensitivity was classified via three-dimensional matrix analyses of the MIE, MIT, and MEC. Finally, a dust-explosive risk assessment model of AM metal powder was established based on comprehensive considerations of the dust-explosive severity and sensitivity, and four types of AM dust sample were applied empirically. The risk assessment method can provide a scientifically credible and effective basis for assessing and improving the AM process based on powder spreading.

1. Introduction

Additive manufacturing (AM), commonly known as 3D printing, is a highly efficient layer-by-layer fabrication technique used to construct a 3D object from 3D models of components established using a computer program. AM can refer to various processes in which dispersed materials are processed and formed through fusion and stacking, layer by layer, using specific printing techniques [1]. Powder or wire is the primary metal feedstock for AM. Specifically, powder feedstock, which affords advantages such as low cost, low scrap rate, and short production cycle, has been used extensively in fields such as education, healthcare, clothing, construction, and equipment manufacturing [2,3,4]. Because metal powder materials are characterized by their high purity, high sphericity degree, fine particle sizes, and narrow particle size distributions [5,6], dust clouds may be generated during actual operations. Once the explosive limit is reached and an ignition source of a specific concentration is brought into contact, a dust explosion will occur [7], causing grave loss of life and significant damage to property. Incidents occurring during the AM of laser metal powder-bed fusion have increased in recent years. For example, an explosion occurred in an AM equipment laboratory in Massachusetts, USA, on 5 November 2013, which caused an experimenter to experience severe burns. This explosion occurred because dust clouds formed during the acquisition and recovery of high-temperature titanium alloys and aluminum alloy powders were ignited by the ignition source. In October 2018, a fire occurred in an iron and steel plant in Seattle, USA, where the burned area spread over as much as 1/3 of the plant area; additionally, some precision instruments were burned, which resulted in economic losses amounting to 50 million dollars. The fire was due to the spontaneous combustion of titanium powder during use and was exacerbated by the failure of the plant operators to extinguish the fire effectively.

2. Literature Review

Currently, scholars worldwide are attempting to improve the preparation methods and mechanical properties of metal powder for AM [8,9,10,11,12,13,14]. However, relevant studies pertaining to dust-explosive characteristics of metal powder for AM have not been performed. Nonetheless, factors affecting the explosive characteristics of typical metal powders have been extensively investigated. Millogo et al. [15] defined the dust-explosive sensitivity and severity parameters of titanium alloys. Li et al. [16] investigated the explosive parameters of aluminum alloy powder and obtained parameters such as the minimum ignition temperature of the dust cloud/dust layer (MITC/MITL) of aluminum alloy powder. Wang et al. [17] evaluated the explosive risks of aluminum–silicon alloys by adjusting the particle size and dust concentration; consequently, they obtained the variation pattern of the MITC of aluminum–silicon alloys. Chen et al. [18] and Dong [19] determined the minimum ignition energy (MIE), MITC, and MITL of titanium powder. Nifuku et al. [20] determined the MITC of aluminum powder. Based on experiments, Wang [21] discovered that the explosive sensitivity of aluminum powder was significantly greater than that of lycopodium powder. Zhong et al. [22] investigated the MITC of magnesium powder via experiments and concluded that the MITC of magnesium powder decreased as the dust concentration increased; whereas, it did not decrease after the optimal concentration was attained. Ye et al. [23] investigated the dust cloud explosive sensitivity and intensity of magnesium powder and proposed protective measures to prevent magnesium powder explosions. Wang [24] investigated the MIE of aluminum alloy powder and established a prediction model. K. Sakata et al. [25] analyzed the explosive characteristics of metal powders (e.g., aluminum-based and titanium-based metal powders) used in the cold spraying process and discovered the hazards of metal micro-powders. Wu et al. [26] discovered that metal powders (i.e., titanium and iron powders) of different particle sizes were ignited by collision, friction, or wear, and exhibited clear differences in terms of explosive hazard. Alexis et al. [27] investigated the heat transfer properties of aluminum, magnesium, titanium, iron, and zinc within flames from the micrometer to nanometer scale and discovered that reduced particle sizes resulted in a higher explosive severity.
Relevant studies pertaining to the risk assessment of dust explosions in the industrial and trading sectors have been conducted. Wang et al. [28] established a dust-explosive risk assessment model for an aluminum–magnesium alloy polishing site involving human, machine, environmental, and management factors, based on combination weighting and the catastrophe progression method. Zhang [29] also carried out similar research on management factors, human factors, machine factors, and environmental factors. Wang et al. [30] also carried out a large number of experiments on the explosive hazards of colored powders and the effects of suppressant powder materials. Le et al. [31] comparatively analyzed and studied the dust-explosive risk assessment between China and the United States from the aspects of assessment content and steps. Yao [32] established a semi-quantitative, multi-dimensional graphic explosive risk assessment method for industrial dust by using the radar chart method. Bagaria [33] used 1 m3 apparatus to research the effect of the resulting particle-size distribution shift on the explosive risk assessment by measuring the change in the minimum ignition energy (MIE). Jiang [34] established a three-dimensional matrix to evaluate the possibility of dust explosion. Jin et al. [35] took possibility, severity, and safety management as the dust-explosive risk assessment index. By calculating the possibility and consequence severity of various indicators, Zheng et al. [36] established a two-dimensional risk matrix to evaluate the risk of coalmine dust explosions. However, there are few comprehensive risk studies systematically combining the explosive sensitivity and severity, especially in the research on dust explosions in additive manufacturing.
Therefore, the metal powder feedstocks typically used for AM (e.g., titanium alloy powder, aluminum alloy powder, nickel alloy powder, and stainless steel powder) were selected as the objects of this study. An experimental study was performed, in accordance with relevant standards for dust explosibility tests, to obtain the distribution range of characteristic parameters associated with the typical AM dust explosion. Subsequently, the dust-explosive sensitivity and explosive severity of AM were classified via a two-dimensional risk matrix (Pmax and Kst) and a three-dimensional risk matrix (MIE, MITC/MITL, and MEC), respectively. Finally, the established 2D risk assessment model for AM dust explosions, based on dust-explosive sensitivity and explosive severity, provided classified and scientifically credible references for implementing AM measures for risk control.

3. Experimental Materials and Methods
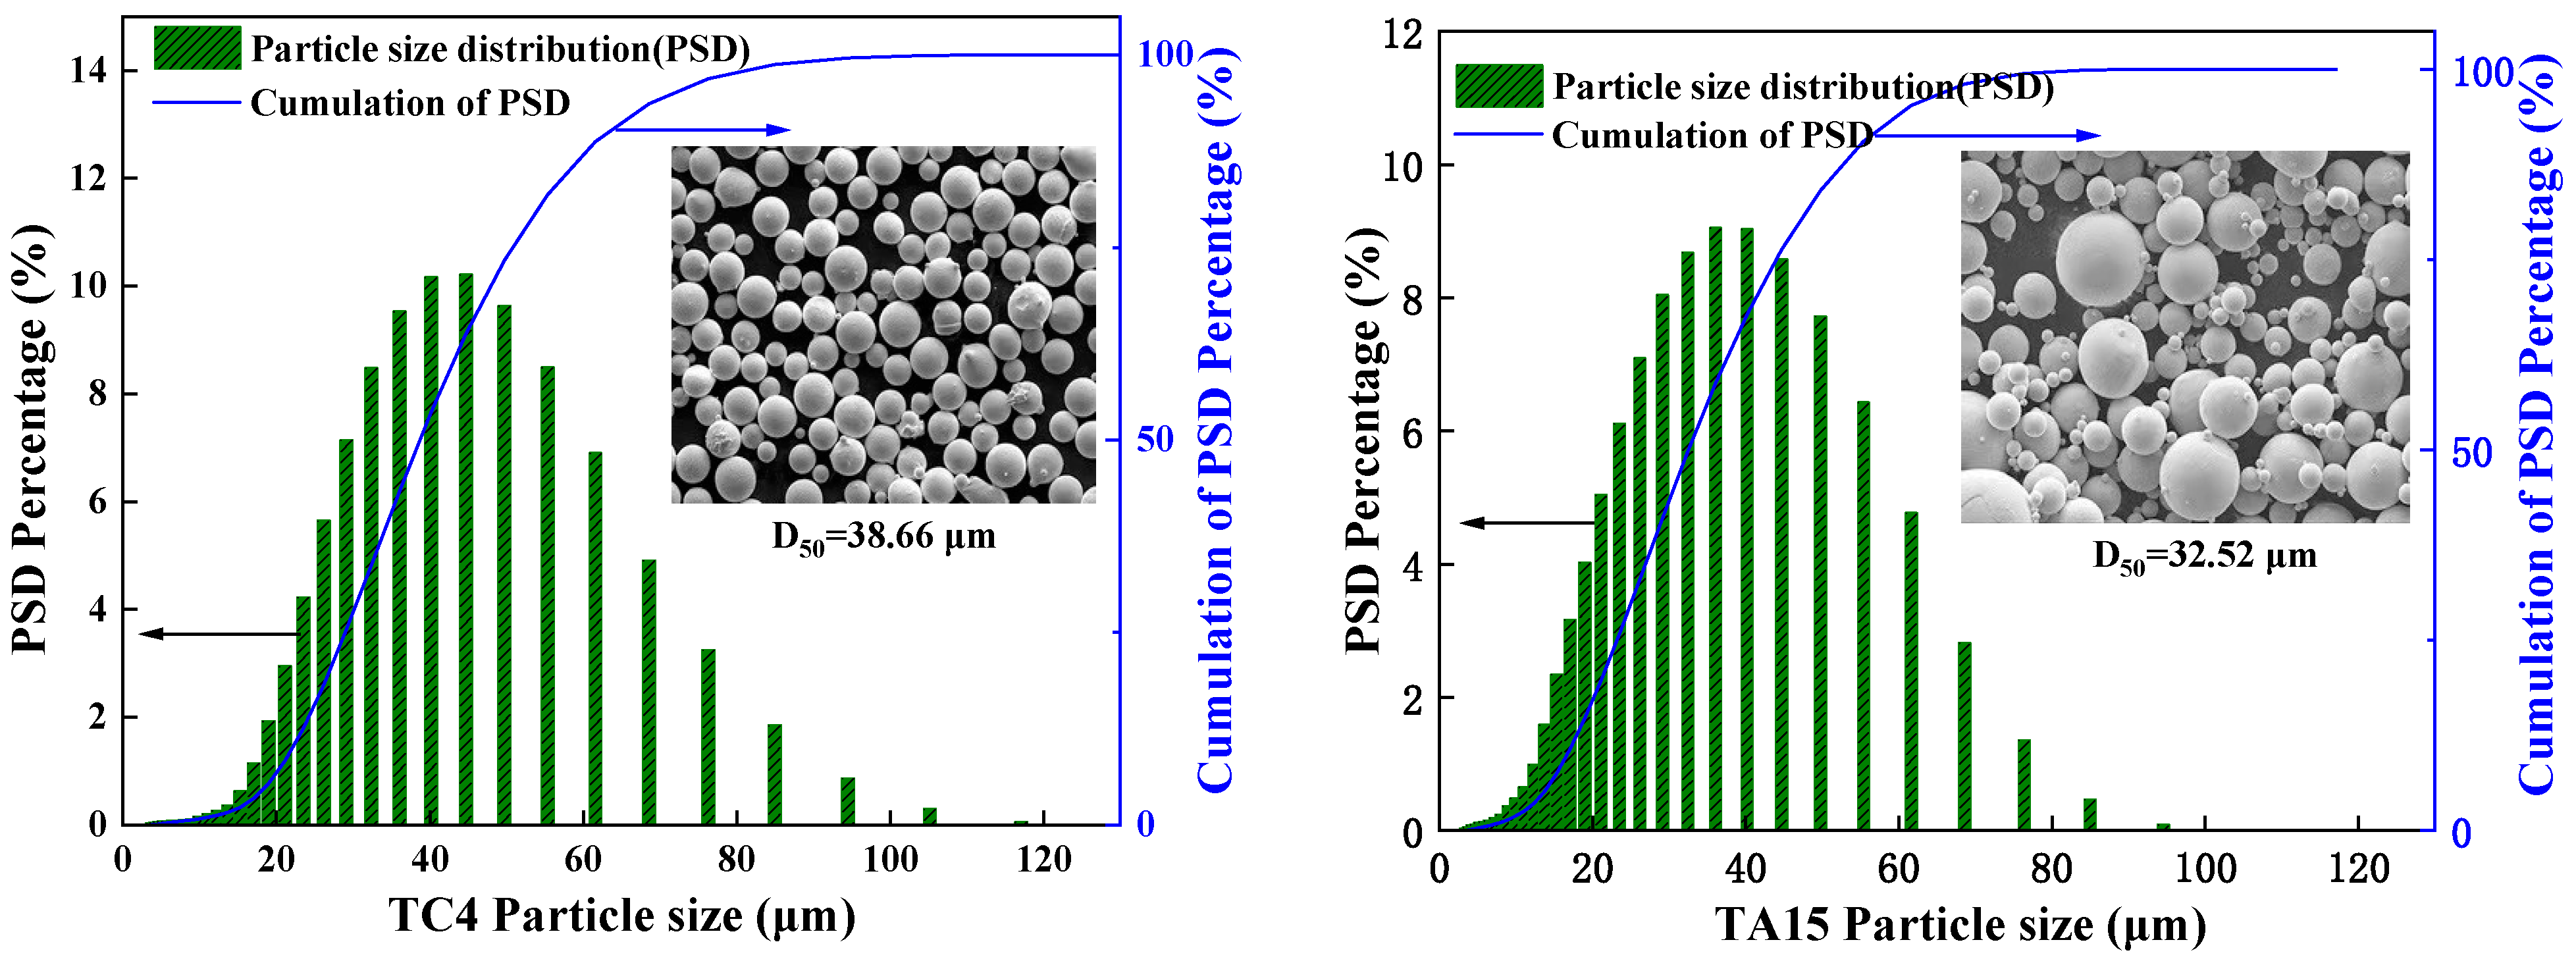
3.1. Materials

Four categories of metal dust (titanium alloy, aluminum alloy, nickel alloy, and stainless steel dust) and eight typical metal dust samples from additive manufacturing (AM) were selected in the experiment. The median diameter, particle size distribution, and electron microscope scanning data are shown in Table 1 and Figure 1.

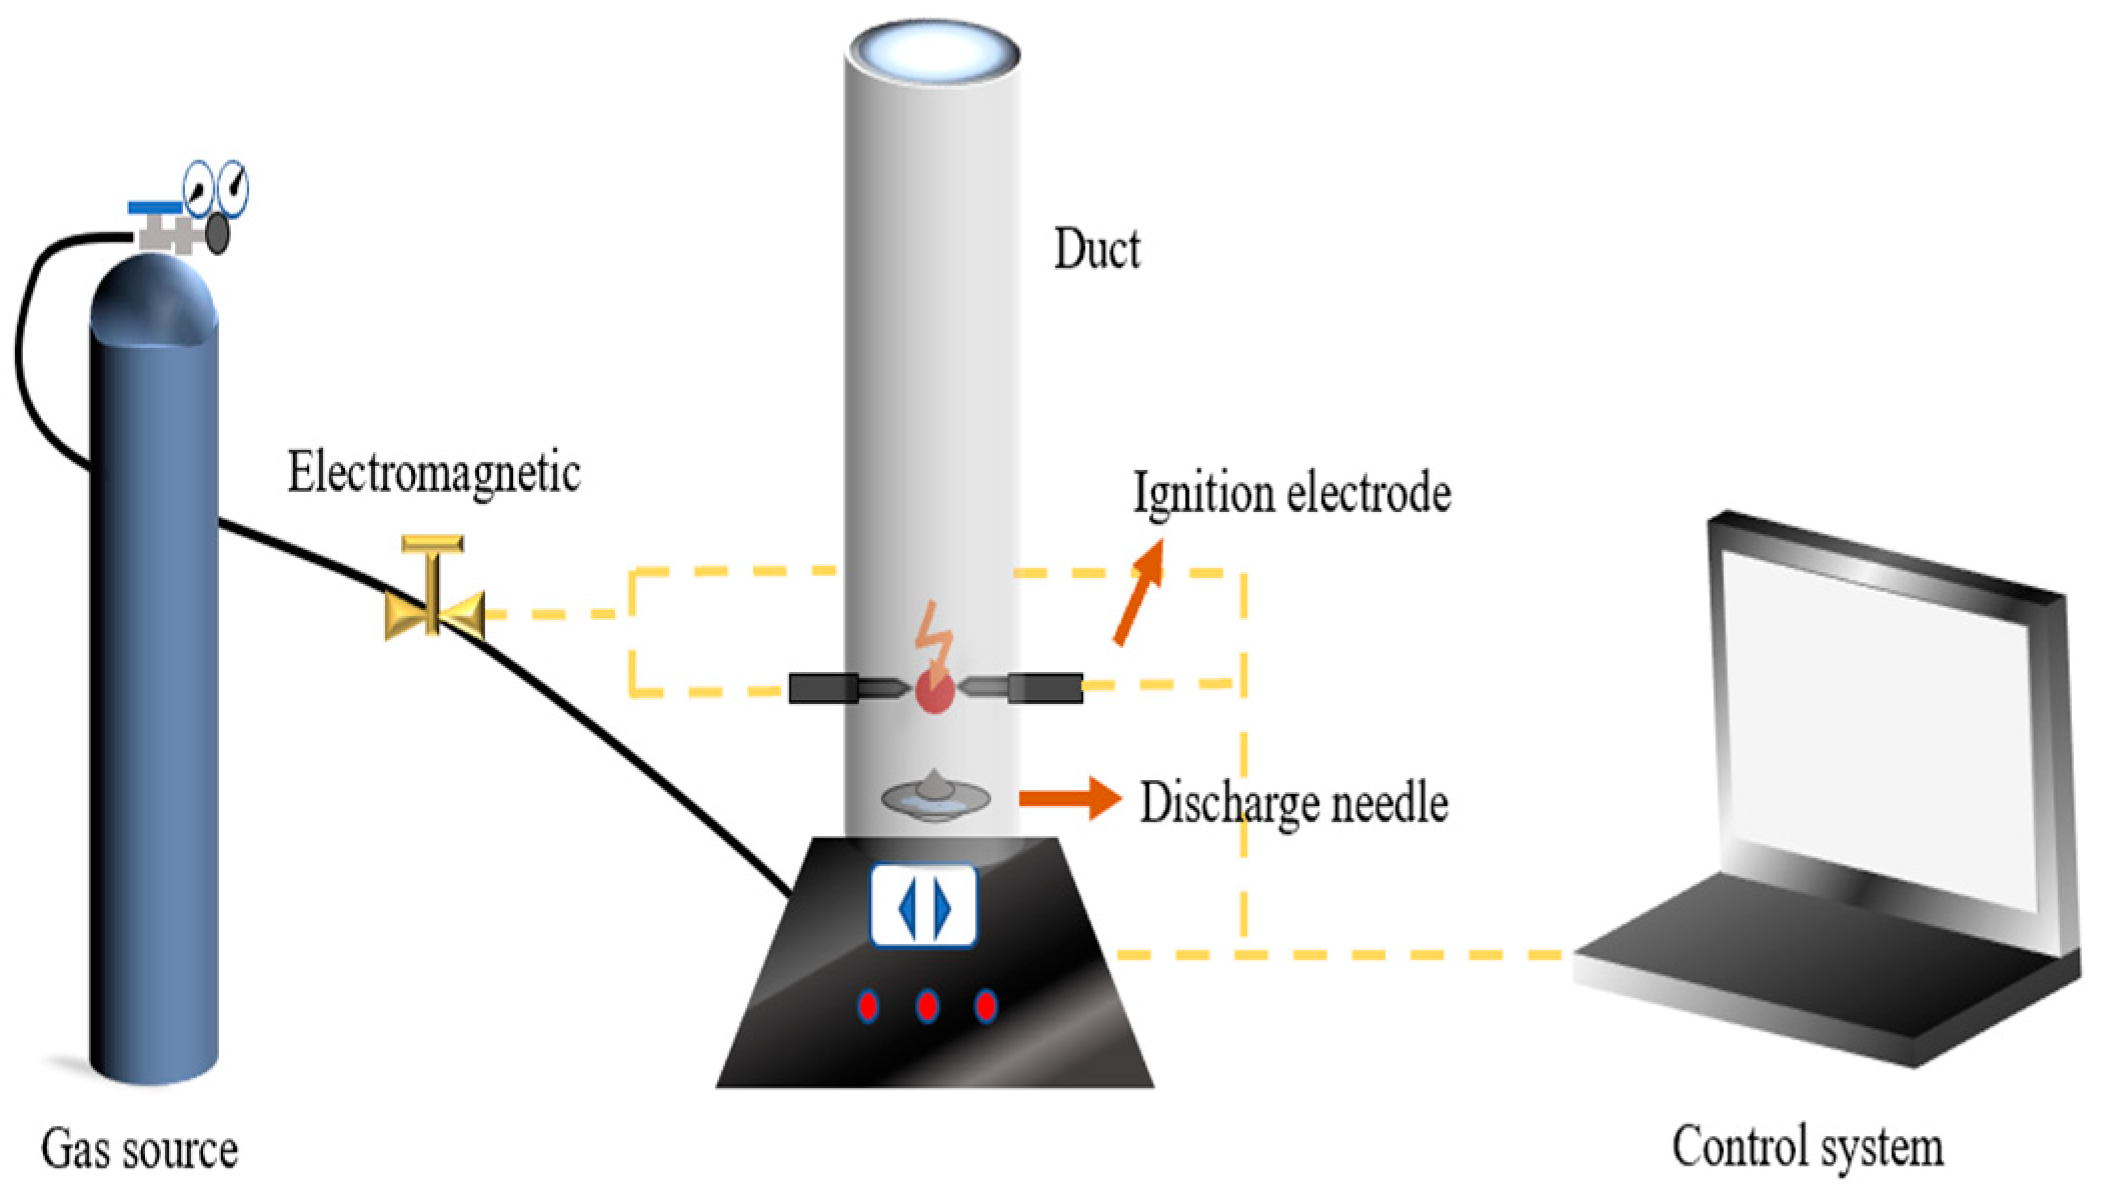
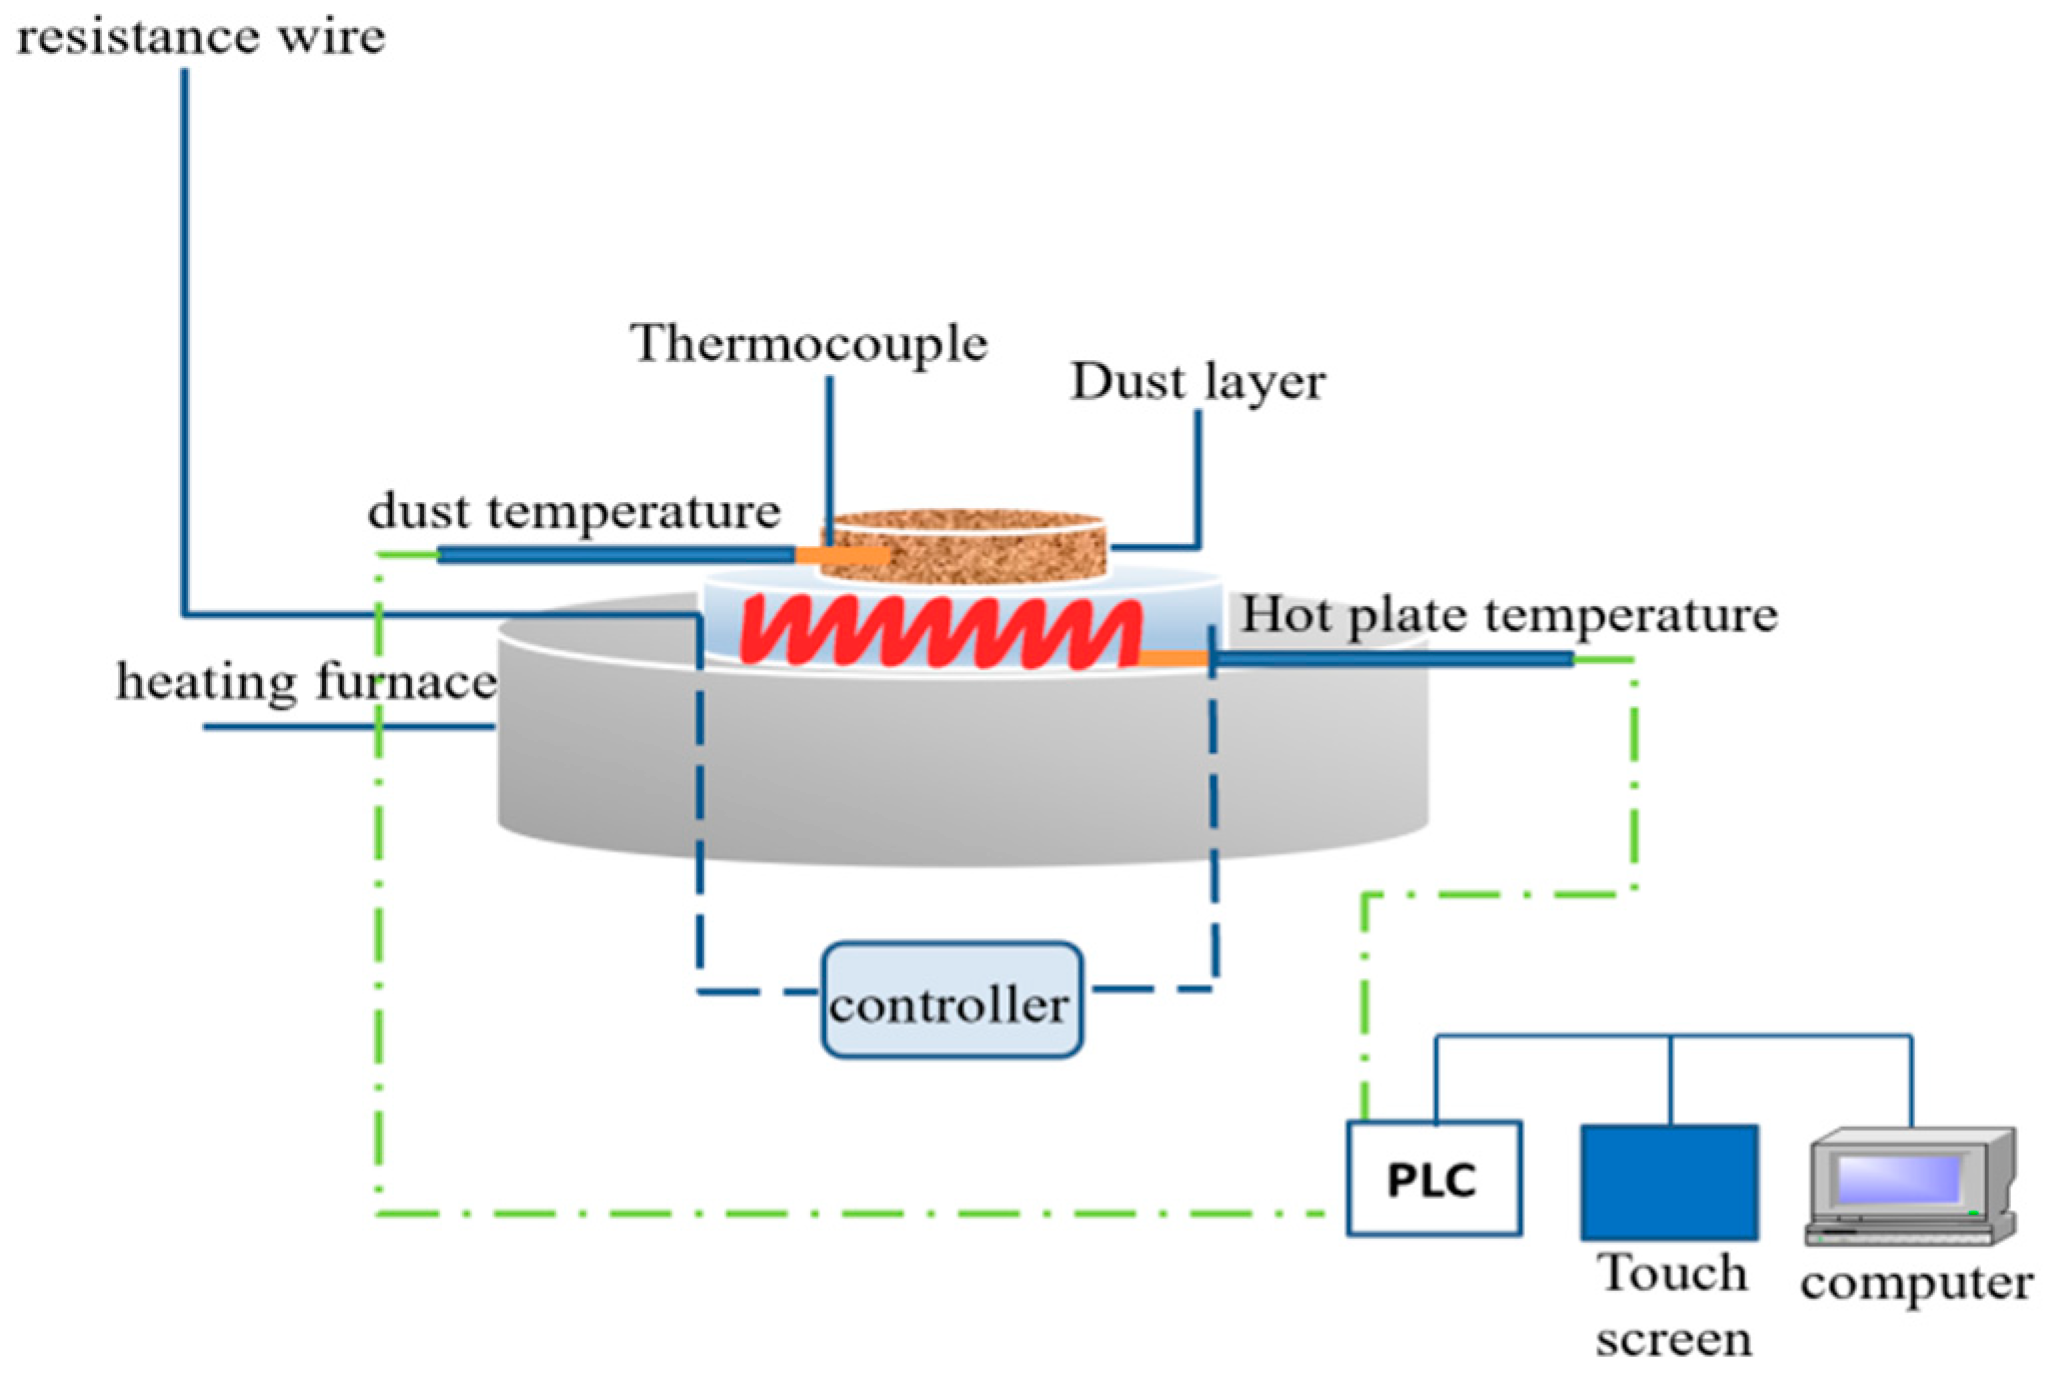
3.2. Experimental Setup

The 20 L device explosion test system, as illustrated in Figure 2, was used to test the Pmax, Kst, and MEC. The conventional Hartmann tube model, Godbert–Greenwald constant temperature furnace standard experimental device, and dust layer minimum ignition temperature tester standard experimental device, as shown in Figure 3, Figure 4 and Figure 5, were used to test the MIE, MITC, and MITL, respectively.

3.3. Experimental Program

The testing of the characteristic parameters of AM dust explosions were carried out in strict accordance with the steps of the relevant standards [37,38,39,40,41], and the relevant experiments of explosive severity and explosive sensitivity were carried out step by step. The specific experimental steps will not be repeated here.

4. Results and Analysis

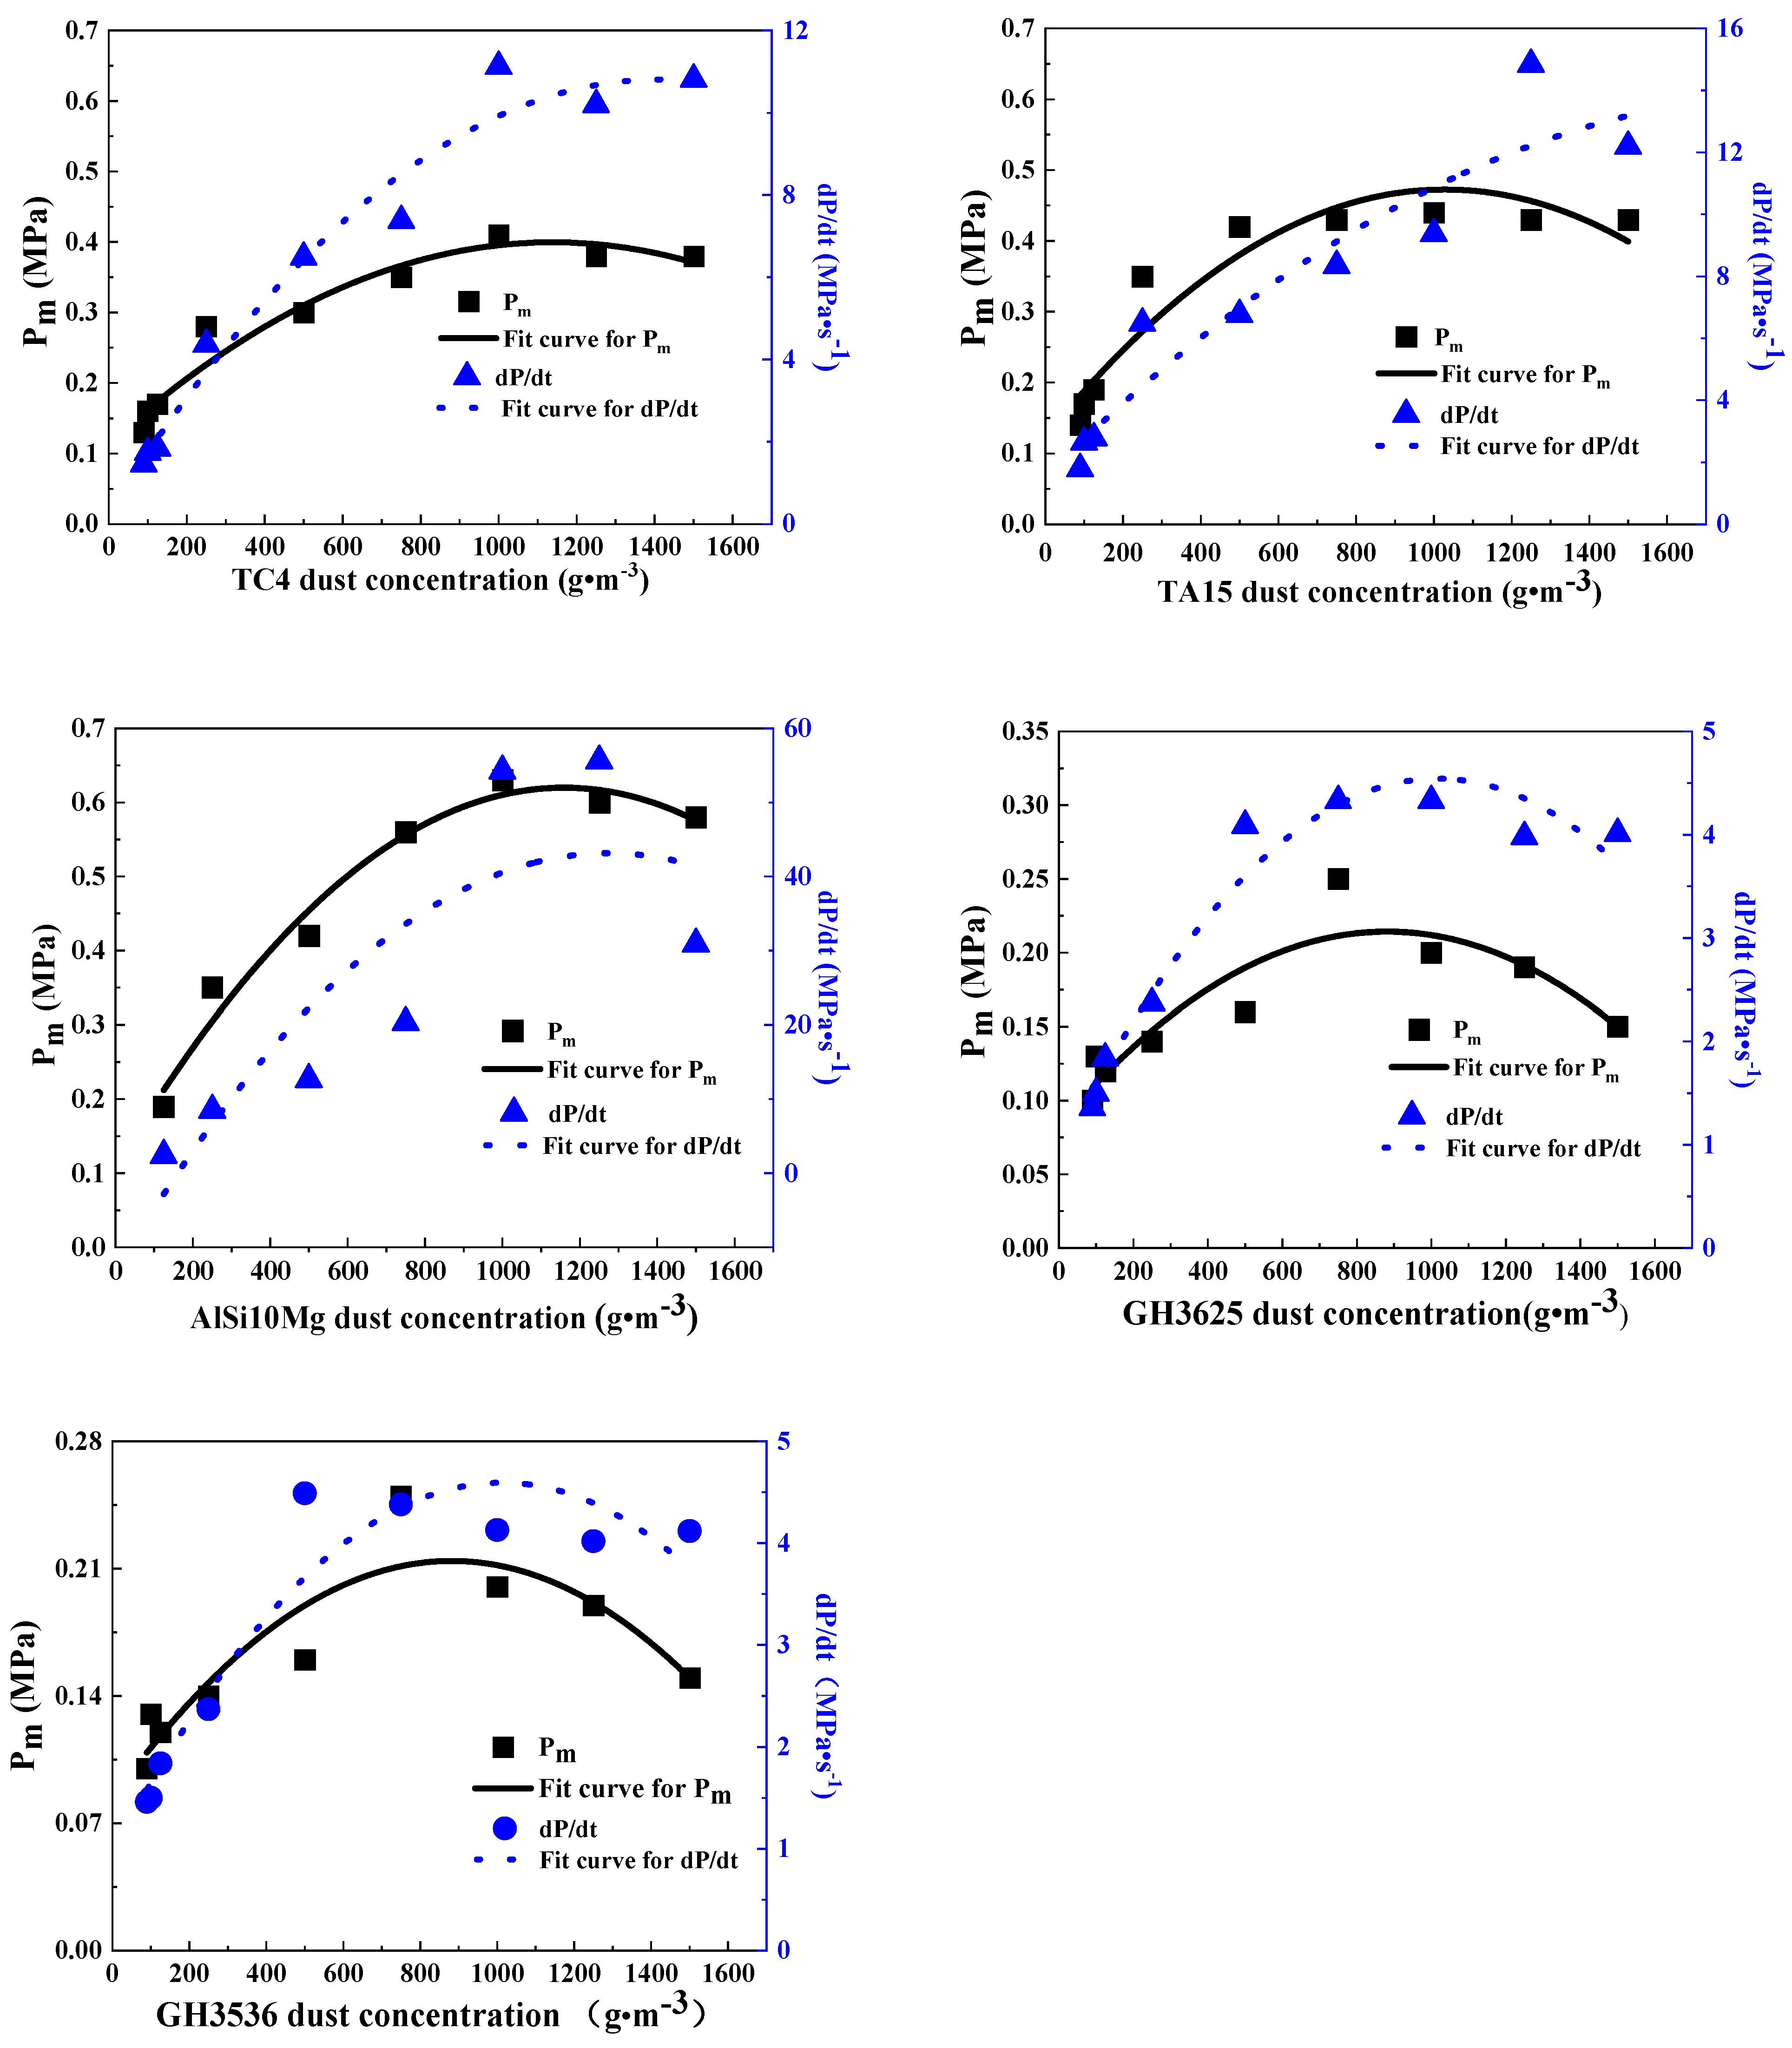
4.1. AM Dust Explosion Severity

The effect of dust cloud concentration on AM dust-explosive severity was systematically investigated using a test system comprising a 20 L spherical explosion chamber, where the dust-explosive severity parameters included the maximum explosive pressure (Pmax) and the explosion index (Kst). In this experiment, the test concentration was within 100–1500 g∙m−3, and stainless steel (304L and 316L) and nickel alloy (GH4169) powders were evaluated. The test findings showed that the Pmax values of the powders were less than 0.04 MPa, regardless of the values of the experimental parameters. The powders were classified as “non-explosive” and “non-combustible and non-explosive” powders, in accordance with the relevant national standards [38,42]. Table 2 shows the experimental results for Pmax, the maximum rate of explosive pressure increase (dp/dtmax), and the Kst of other metal powders for AM.
The comparative results revealed that the Pmax and Kst of the AM dusts first increased and then decreased as the dust concentration increased, as shown in Figure 6. This occurred because the number of metal powder particles that participated in the reaction in the 20 L sphere increased with the rising dust mass concentration, and a sufficient and rapid explosive reaction of metal powders occurred when sufficient oxygen was present in the vessel, resulting in an increase in Pmax and dp/dtmax. When the dust mass concentration increased to a specific value, the dust clouds of the metal powder formed in the vessel reacted sufficiently with oxygen, and the maximum explosive pressure was recorded. When the dust mass concentration continued to increase, the oxygen content in the 20 L sphere was not sufficient to allow all powder particles to participate in the reaction, and energy was consumed during the flame heat transfer among powder particles; thereby, reducing the explosive pressure. The optimal reaction concentration, which was similar to the stoichiometric coefficient in the reaction, was observed in every AM dust sample during the explosion. At this time, the optimal mixing ratio of combustible dust and oxygen was almost attained, no oxygen-deficient and fuel-lean flammable atmosphere was present, and the explosive reaction resulted in the complete release of fuel energy (calorific value) [43]. Therefore, the subsequent experiments were carried out under the upper limit of explosion.

4.2. AM Dust Explosion Sensitivity

4.2.1. MIE of AM Dust Cloud

The MIE values of different AM dust samples were determined using a traditional Hartmann tube (model: HY16428C) at different concentration gradients of dust clouds. The test results demonstrated that the three types of nickel alloy powder and two types of stainless steel powder could not be ignited in the Hartmann tube. Additionally, flame propagation occurred in the Hartmann tube when the titanium alloy (TC4 and TA15) and aluminum alloy (AlSi10Mg) powders were evaluated. Figure 7 and Figure 8 show the variation pattern of the MIE based on the dust cloud concentration and dust spray pressure. The final MIE is shown in Table 3.
As the dust concentration increased, the MIE values of the three types of combustible alloy powder decreased gradually; subsequently, those values increased gradually after the dust concentration increased to a specific value. At the declining stage, the number of dust particles ignited by the electric spark per unit volume increased with the dust concentration, resulting in an increase in the released heat and reaction rate. Consequently, the MIE of the dust cloud decreased as the dust concentration increased. Because the oxygen concentration was constant in the confined space, an increase in the dust concentration would result in an insufficient oxygen concentration, and the electric spark energy could not ignite all the peripheral dusts, resulting in an incomplete combustion and an ascending curve. Figure 7 shows the MIE ranges of the three types of alloy powder. Specifically, the MIE curve of powder TC4 first decreased and then increased, and the MIE values were within 80–360 mJ. The variation trends of the MIE values of powders TA15 and TC4 remained consistent, and the MIE values were within 20–100 mJ. The MIE of the AlSi10Mg powder first decreased and then remained unchanged, and the MIE values were within 80–350 mJ.
Figure 8 shows the overall variation trends for the MIE values of the TC4, TA15, and AlSi10Mg powders under different dust spray pressures when the dust concentration was constant. Specifically, as the dust spray pressure increased, the air turbulence in the tube increased, and dusts in the tube exhibited a higher degree of dispersion, resulting in an increased area of dust particles in contact with oxygen, and a complete combustion. Consequently, the MIE decreased. When dust in the tube exhibited the optimal degree of dispersion, the dust particles diffused evenly as the dust spray pressure increased. At this time, the dust surface was fully combined with oxygen and remained stable. Because the Hartmann tube was not confined, some powders were exhausted from the tube when the dust spray pressure was extremely high; thereby, resulting in a reduced dust concentration in the tube and an increased MIE.

4.2.2. MITC of AM Dust

The MITC values of different AM dust samples were determined using a Gobert–Greenwald constant temperature furnace device (model: HY16429) at different concentration gradients of dust clouds. The analysis suggested that no flame propagation occurred after multiple adjustments of dust concentration and dust spray pressure for nickel alloy (GH3625) and stainless steel (304L) powders in four types of AM powder. Meanwhile, nickel alloy (GH4169 and GH3536) and stainless steel (316L) powders were successfully ignited at a specific mass concentration (Table 4). Figure 9 and Figure 10 show the variation patterns of the MITC values of titanium alloy (TC4 and TA15) and aluminum alloy (AlSi10Mg) powders based on the dust cloud concentration and dust spray pressure. The final MITC is shown in Table 5.
Figure 9 shows the general variation trend of the MITC of the TC4, TA15, and AlSi10Mg powders based on the mass concentration when the dust spray pressure was constant (i.e., 0.04 MPa). Specifically, the MITC values of the TC4, TA15, and AlSi10Mg powders decreased as the dust cloud concentration increased, before their respective optimal mass concentrations were attained. This occurred because the increase in the dust mass concentration reduced the particle spacing and the reaction path for heat transfer; thereby, resulting in an expedited release and transfer of combustion heat. Because the oxygen concentration remained constant in the space, the increased dust concentration resulted in an incomplete combustion of dust particles and the incomplete combination of the specific surface area containing dust with oxygen when the optimal mass concentration was attained. Additionally, excessive dusts were agglomerated, resulting in a reduced specific surface area of dust and a higher ignition temperature of the dust cloud.
Figure 10 shows the variation trend of the MITC values of the TC4, TA15, and AlSi10Mg powders at different dust spray pressures when the dust concentration was constant. Specifically, the MITC values of the three types of metal powder decreased gradually as the dust spray pressure increased, and the minimum ignition temperature of the dust no longer decreased but gradually increased when the dust spray pressure reached a specific value. At the initial stage, sufficient oxygen was available in the tube for combustion. Consequently, an increase in the dust spray pressure resulted in a greater degree of dust diffusion and sufficient contact between the dust surface and oxygen; thereby, resulting in a decline in the MITC. When the dust surface established sufficient contact with oxygen and remained stable, the area of dust particles in contact with oxygen did not increase. However, an increase in the dust spray pressure expedited the settlement of dust and decreased the actual dust concentration in the space. Additionally, the high-pressure gas removed heat from the tube during the dust spray process. Therefore, the MITC values of the three types of metal powder first decreased and then increased as the dust spray pressure increased.

4.2.3. MITL of AM Dust

The MITL values of different AM dusts were determined using the test setup for the MITL (model: HY16430). Table 6 shows the MITL values of the eight types of powder obtained experimentally. Significant ignition incidents occurred in the titanium alloy (TC4 and TA15) and aluminum alloy (AlSi10Mg) powders among the eight types of powder sample. Specifically, the MITL values of the AlSi10Mg, TA15, and TC4 powders were 420 °C, 380 °C, and 380 °C, respectively. Therefore, the TA15 and TC4 powder samples indicated the lowest MITL value, signifying the highest risk of danger. No ignition occurred after the hot surface temperature of the other five types of powder sample reached 450 °C, indicating that a hot surface temperature of less than 450 °C could not ignite their dust layers when the dusts were deposited in layers.

4.2.4. MEC of AM Dust Cloud

The MEC of the AM dust cloud was determined using a test system comprising a 20 L spherical explosion chamber, until the Pmax values measured in the same experiment were less than 0.04 MPa for three consecutive times. The pressure ratio values of stainless steel (304L and 316L) and nickel alloy (GH4169) powders, calculated based on dust concentrations of 1000 and 2000 g/m3, were less than 2. Based on the dust explosibility testing standard E1226−12a, the three types of powder were non-explosive. Therefore, a lower explosive limit for the dust cloud was not indicated. Table 7 shows the experimental results for the lower explosive limits of the other AM powders. The MEC values of the titanium alloy (TC4 and TA15) and aluminum alloy (AlSi10Mg) powders were relatively low (i.e., <100 g·m−3).

5. Risk Assessment

Based on the experimental data pertaining to the explosive characteristic parameters of different AM dust samples, shown in Table 8, an AM dust-explosive risk assessment model was established and applied to verify this.

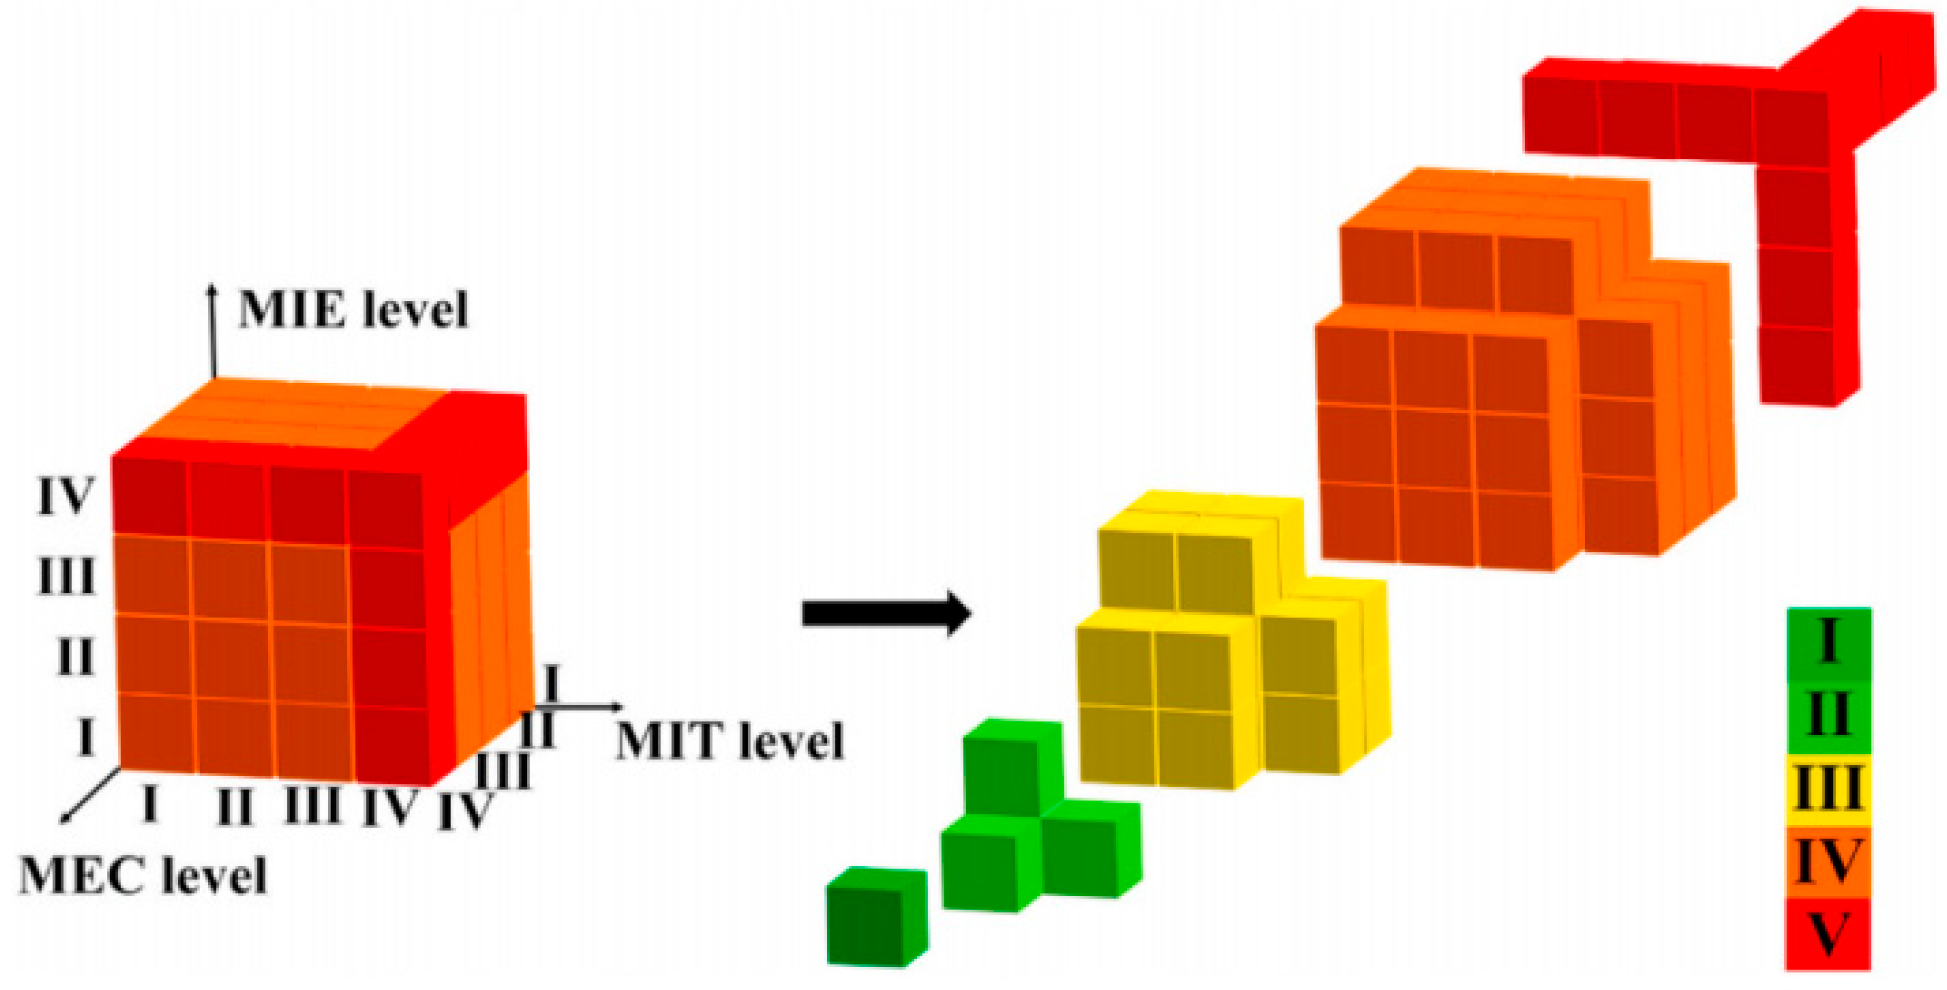
5.1. Establishment of Risk Assessment Method

The explosive severity and sensitivity parameters were appropriately classified according to the AM dust-explosive experimental data, as presented in Table 9 and Table 10.
The dust-explosive severity of AM was classified via a two-dimensional risk matrix, as presented in Table 9.
By referring to the relevant literature and a large number of data analyses, the dust-explosive sensitivity parameters MIE, MIT, and MEC were divided into four levels, as presented in Table 10.
The dust-explosive sensitivity of AM was classified via a three-dimensional risk matrix, as depicted in Figure 11. The detailed element division is provided in Table 11. Therefore, the AM dust-explosive sensitivity was divided into five levels.
To combine the explosive severity and sensitivity, the AM dust-explosive risk matrix assessment model was established, as indicated in Table 12. The risk of AM dust-explosive was categorized into four levels: I—Low risk (blue colour), Ⅱ—Medium risk (yellow colour), Ⅲ—High risk (orange colour), and Ⅳ—Extremely high risk (red colour).

5.2. Empirical Application Research

The explosive grades of the four types of AM dust samples were classified. Meanwhile, the MIE, MITC, MITL, MEC, and characteristic parameters of explosive sensitivity of the dust cloud were comprehensively analyzed experimentally. The results showed that the explosive sensitivity order of the four types of typical AM metal powder was as follows: TA15 > TC4 > AlSi10Mg > 316L > GH4169 > GH3536 > GH3625/304L.
The experiment-based comprehensive analysis of the Pmax and dp/dtmax of the dust showed that the explosive severity order of the four types of typical AM metal powder was as follows: ALSi10Mg > TA15 > TC4 > GH3625 > GH3536 > 304L/316L/GH4169.
Based on the established AM dust explosive risk assessment model, we concluded that the explosive risk levels of the four categories and eight types of AM dust samples were Grades II, III, III, I, I, I, I, and I. See Figure 12 for details regarding the determination of explosive risk levels of the AM dust samples.

6. Conclusions

In this study, an AM dust-explosive risk assessment model was established based on systematically and experimentally investigated explosive severity and sensitivity characteristic parameters. The conclusions obtained were as follows:
(1)
The dust explosive sensitivity and explosive severity of AM were classified into five grades via a two-dimensional risk matrix (Pmax and Kst), and a three-dimensional risk matrix (MIE, MITC/MITL, and MEC), respectively. Subsequently, a 2D dust-explosive risk assessment model was established and classified into four grades.
(2)
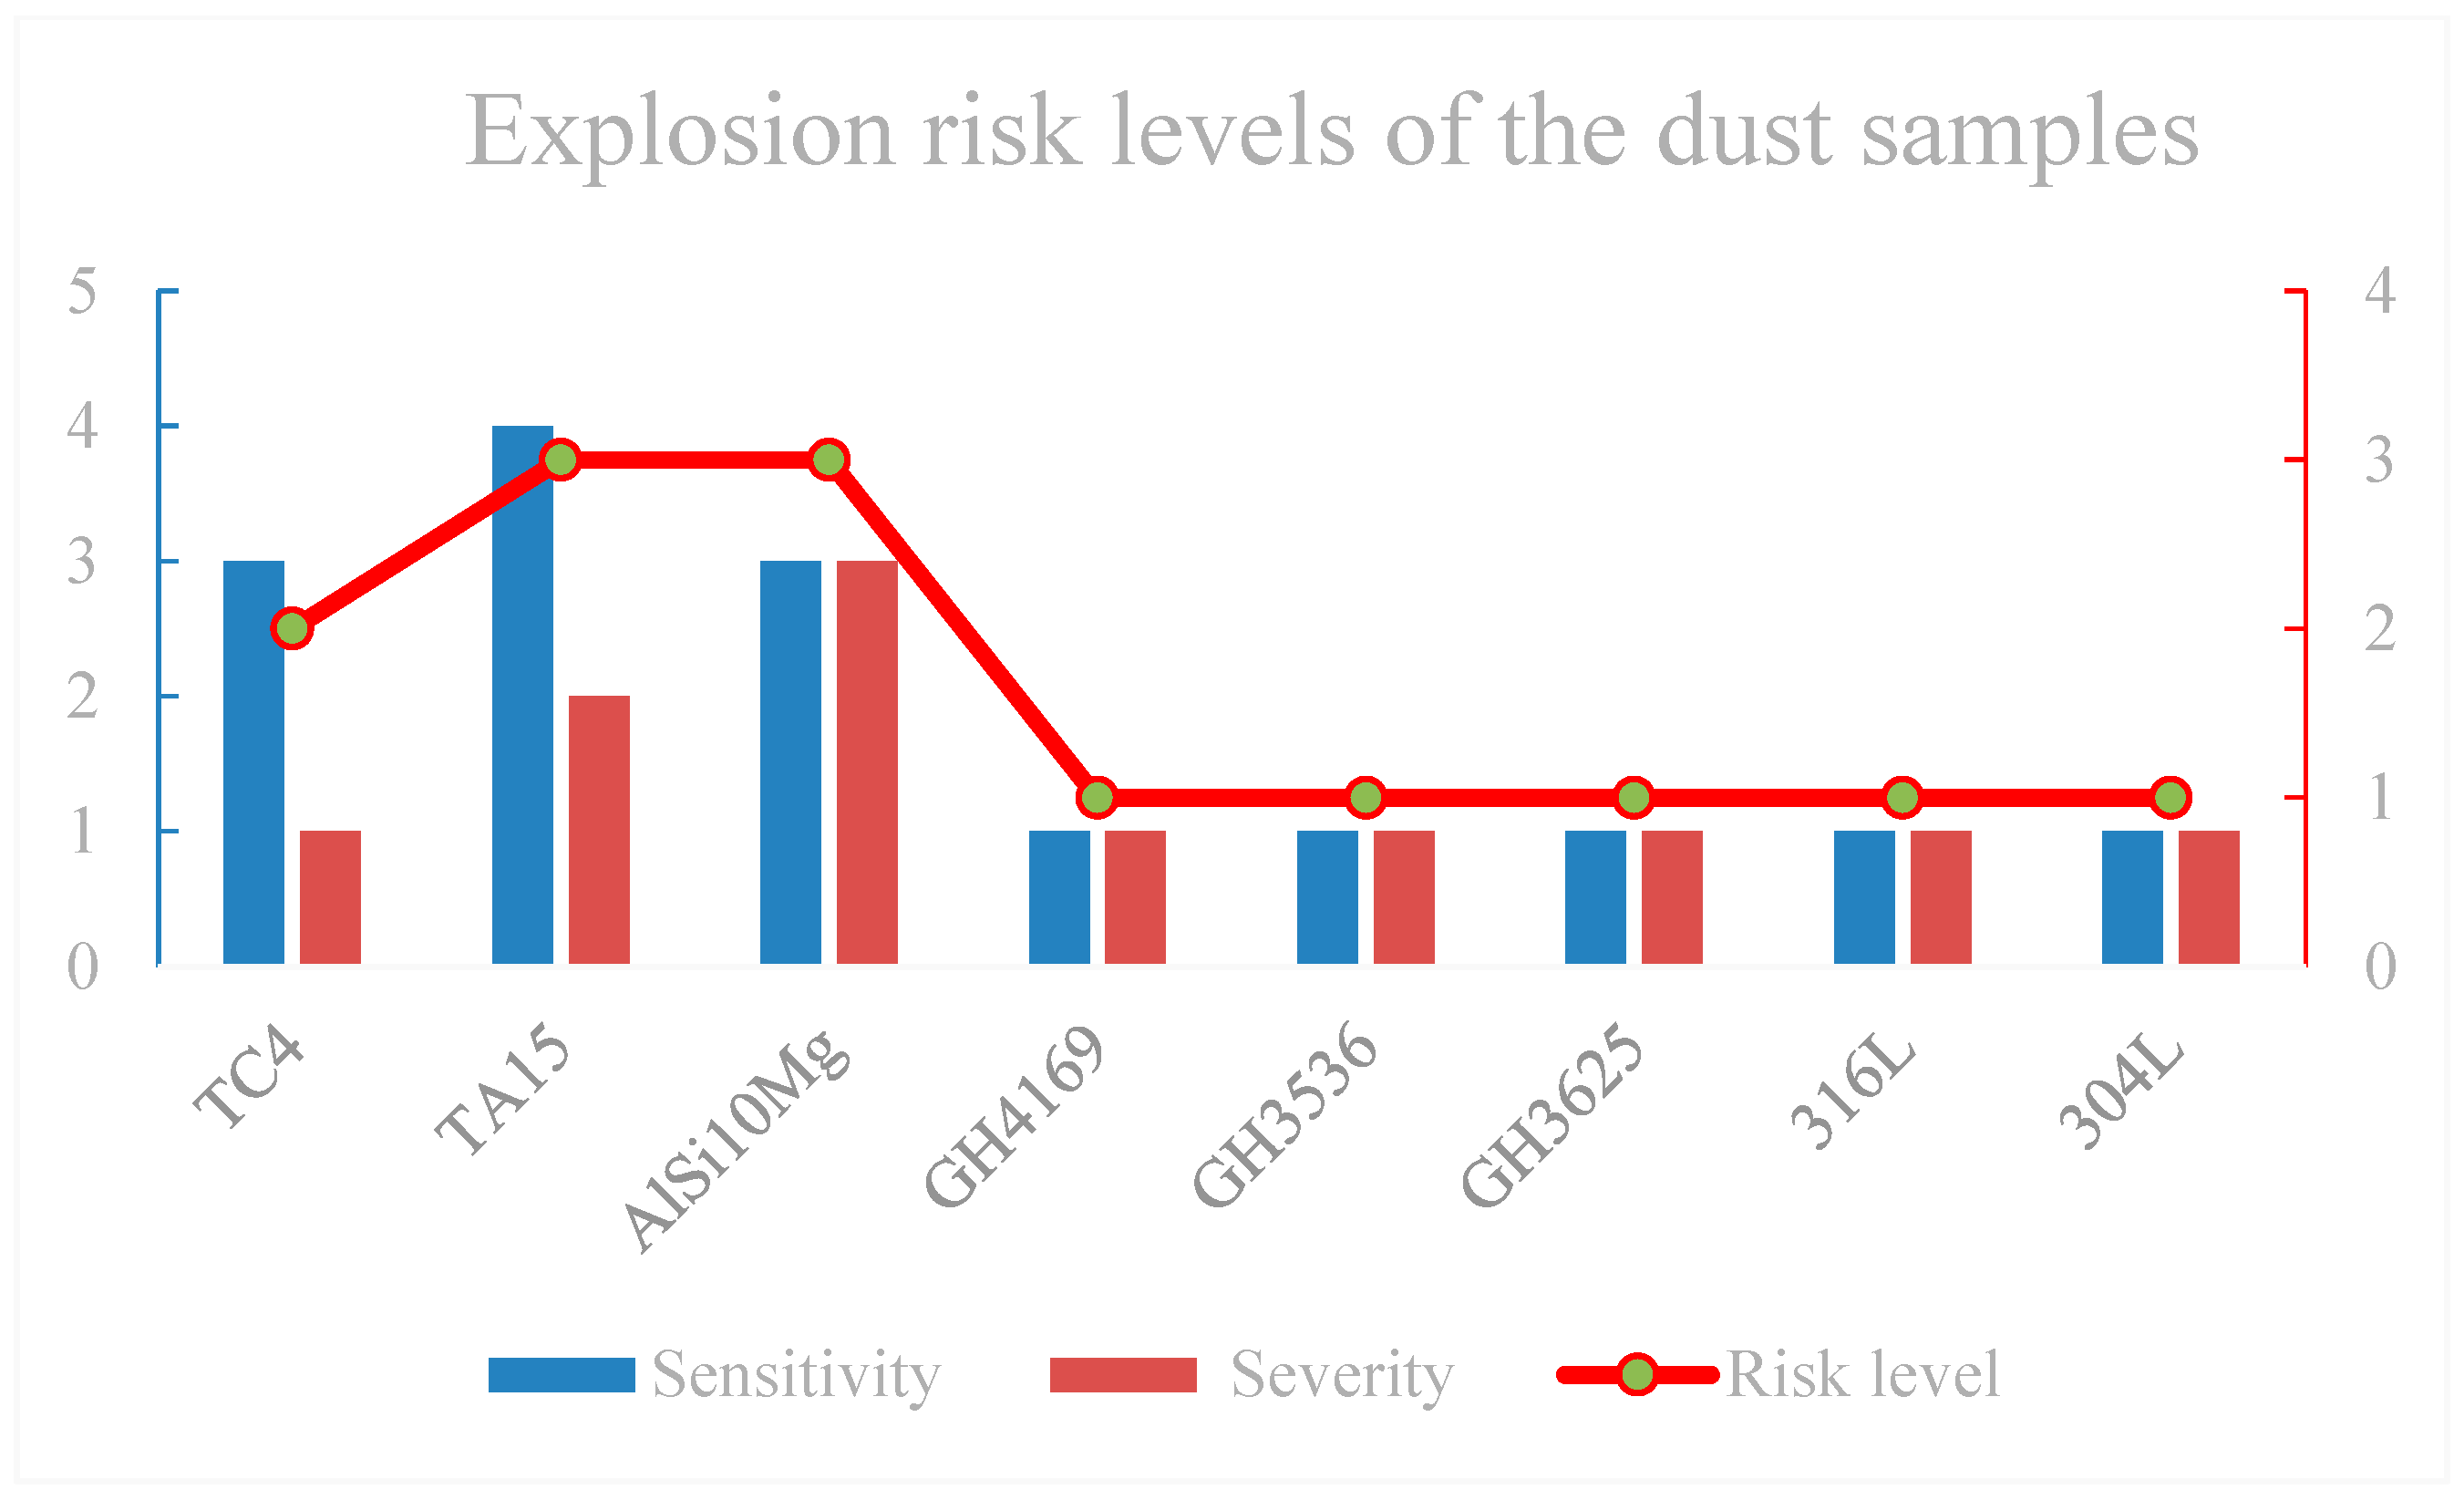
During the design of explosion-proof and explosion-control measures for AM and production equipment, the explosive risk levels of products prepared using raw materials must be prioritized. Based on the self-established AM dust-explosive risk assessment method, the four types of AM dust sample were classified, and the dust explosive risks of the samples were classified as Grades II, III, III, I, I, I, I, and I.
(3)
The risk assessment method may provide a scientifically credible and effective basis for assessing and improving the AM process based on powder spreading. In the next step, it is necessary to carry out an experimental analysis of explosive characteristic parameters of other non-metal AM dust, further refine the division range of indicators at all levels, and expand the application range of risk assessment models. Ventilation, waterproofing, and moisture-proof measures should be implemented for the collection, stacking, and storage of metal dust to weaken the explosion risk.

Author Contributions

Methodology, S.S. and L.P.; Software, Y.C.; Formal analysis, C.X. and Y.C.; Data curation, C.X. and L.P.; Writing—original draft, L.P.; Writing—review & editing, S.S., J.D., K.L. and L.P.; Supervision, S.S.; Funding acquisition, S.S. All authors have read and agreed to the published version of the manuscript.

Funding

This research was funded by the General Items of Science and Technology Plan of Beijing Municipal Commission of Education, grant number No. KM202210017003.

Data Availability Statement

The data are available from the corresponding author on reasonable request.

Conflicts of Interest

The authors declare no conflict of interest.

References

  1. Xu, D.; Gao, H.B.; Dong, T.; Cui, C.Y.; Yang, Z.L.; Li, H.X.; Jiang, C.F.; Wang, J.D. Research progress of metal powder for additive manufacturing. Chin. J. Nonferrous Met. 2021, 31, 245–257. [Google Scholar]
  2. Li, C. Application of 3D Printing Technology in Automobile Manufacturing and Maintenance. Automob. Appl. Technol. 2021, 10, 198–200. [Google Scholar]
  3. Anderson, I.E.; White, E.M.H.; Dehoff, R. Feedstock powder processing research needs for additive manufacturing development. Curr. Opin. Solid State Mater. Sci. 2018, 22, 8–15. [Google Scholar] [CrossRef]
  4. Ren, H.J.; Zhou, G.N.; Cong, B.Q.; Ma, H.J.; Dong, W.Q. Development and application of additive manufacturing technology in Aerospace metal components. Aviat. Manuf. Technol. 2020, 63, 72–77. [Google Scholar]
  5. Gao, C.F.; Yu, W.Y.; Zhu, Q.L.; Xiao, Z.Y. Performance characteristics and research progress of metal powders for 3D printing. Powder Metall. Ind. 2017, 27, 53–58. [Google Scholar]
  6. Jin, Y.Y.; He, W.W.; Chen, B.K.; Tang, H.P.; Xiang, C.S.; Zhu, J.L.; Qiu, S.; Wang, Y. Preparation technology of spherical refractory metal powder. Aviat. Manuf. Technol. 2019, 62, 64–72. [Google Scholar]
  7. Sun, S.H.; Sun, Y.; Jia, C.F.; Wang, H.J.; Fang, Y.F.; Pang, L. Study on the explosion sensitivity of metal powders used in additive manufacturing. Powder Metall. Technol. 2020, 38, 249–256. [Google Scholar]
  8. Huijie, W.; Zhaowen, C.; Feng, S.; Hongbin, L.; Zhongmin, T. Superalloy GH4169 complicated components prepared by Selective Laser Melting forming technique. Powder Metall. Technol. 2016, 34, 368–372. [Google Scholar]
  9. Zhao, J.; Lv, L.; Wang, K.; Liu, G. Effects of strain state and slip mode on the texture evolution of a near-α TA15 titanium alloy during hot deformation based on crystal plasticity method. J. Mater. Sci. Technol. 2020, 38, 125–134. [Google Scholar] [CrossRef]
  10. Wang, X.Q.; Chou, K. The effects of stress relieving heat treatment on the microstructure and residual stress of Inconel 718 fabricated by laser metal powder bed fusion additive manufacturing process. J. Manuf. Process. 2019, 48, 154–163. [Google Scholar] [CrossRef]
  11. Wang, D.J.; Li, H.; Zheng, W. Oxidation behaviors of TA15 titanium alloy and TiBw reinforced TA15 matrix composites prepared by spark plasma sintering. J. Mater. Sci. Technol. 2020, 37, 46–54. [Google Scholar] [CrossRef]
  12. Wang, X.X.; Zhan, M.; Gao, P.F.; Zhang, H.R. Micromechanical behaviour of TA15 alloy cylindrical parts processed by multi-pass flow forming. Mater. Sci. Eng. A 2019, 737, 328–335. [Google Scholar] [CrossRef]
  13. Tong, D.; Yu, Y.; Song, Z.W. Study on Effects of 3D Printing Process Parameters on Corrosion Resistance of TC4 Dental Implant Materials. Hot Work. Technol. 2020, 49, 32–35. [Google Scholar]
  14. Liu, H.J.; Zhang, Z.M.; Xu, J.; Wu, Y.J.; Li, X.B.; Xue, Y. Study on hot deformation behavior and constitutive model of SPSed TC4 titanium alloy. J. Plast. Eng. 2019, 26, 263–270. [Google Scholar]
  15. Millogo, M.; Bernard, S.; Gillard, P.; Frascati, F. Combustion properties of titanium alloy powder in ALM processes: Ti6Al4V. J. Loss Prev. Process Ind. 2018, 56, 254–261. [Google Scholar] [CrossRef]
  16. Li, G.; Yang, H.X.; Yuan, C.M.; Eckhoff, R.K. A catastrophic aluminium-alloy dust explosion in China. J. Loss Prev. Process Ind. 2016, 39, 121–130. [Google Scholar] [CrossRef]
  17. Wang, Q.; Sun, Y.; Zhang, Z.; Shu, C.M. Ignition and explosion characteristics of micron-scale aluminum–silicon alloy powder. J. Loss Prev. Process Ind. 2019, 62, 902. [Google Scholar] [CrossRef]
  18. Chen, J.J.; Hu, L.S.; Hu, S.Q. Study on the minimum iginition energy and inhibition technology of titanium dust cloud. Fire Sci. Technol. 2015, 34, 566–569. [Google Scholar]
  19. Dong, H.P. The Explosion Parameters and Explosion Risk Evaluation of Titanium Powder; Guangxi University: Nanning, China, 2018. [Google Scholar]
  20. Nifuku, M.; Koyanaka, S.; Ohya, H.; Barre, C.; Hatori, M.; Fujiwara, S.; Horiguchi, S.; Sochet, I. Ignitability characteristics of aluminum and magnesium dusts that are generated during the shredding of post-consumer wastes. J. Loss Prev. Process Ind. 2007, 20, 322–329. [Google Scholar] [CrossRef]
  21. Wang, Y.G. Discussion on the explosion characteristics of aluminum dust and explosion prevention countermeasure of aluminum powder site. Fire Sci. Technol. 2017, 36, 850–852. [Google Scholar]
  22. Zhong, Y.P.; Xu, D.; Li, G.; Yuan, C.M.; Chen, B.Z. Measurement of minimum ignition temperature for magnesium dust cloud. Explos. Shock Waves 2009, 29, 429–433. [Google Scholar]
  23. Ye, Y.M.; Liang, J.; Jiang, H.Y.J.; Li, J.Q.; Zhang, J.J.; Feng, C.S. Research progress on Mg dust combustion explosion. Fire Sci. Technol. 2019, 38, 921–925. [Google Scholar]
  24. Wang, X.F. Research of Nonlinear Forecast on Minimun Ignition Energy and Minimum Ignition Temperature of Mg-Al Alloy Dust; North University of China: Taiyuan, China, 2016. [Google Scholar]
  25. Sakata, K.; Tagomori, K.; Sugiyama, N.; Sasaki, S.; Shinya, Y.; Nanbu, T.; Kawashita, Y.; Narita, I.; Kuwatori, K.; Ikeda, T.; et al. Dust explosion properties of Aluminum, Titanium, Zinc and Iron based alloy powders used for cold spray. Therm. Spray Technol. 2014, 6, 53–58. [Google Scholar]
  26. Wu, H.; Chang, R.; Hsiao, H. Research of minimum ignition energy for nano Titanium powder and nano Iron powder. J. Loss Prev. Process Ind. 2009, 22, 21–24. [Google Scholar] [CrossRef]
  27. Vignes, A.; Krietsch, A.; Dufaud, O.; Santandréa, A.; Perrin, L.; Bouillard, J. Course of explosion behaviour of metallic powders-From micron to nanosize. J. Hazard. Mater. 2019, 379, 120767. [Google Scholar] [CrossRef] [PubMed]
  28. Wang, Q.; Wang, X.; Jun, D. Explosion risk analysis of aluminum-magnesium alloy polishing site based on combination weighting and catastrophe progression method. J. Saf. Environ. 2021, 125, 2107–2113. [Google Scholar] [CrossRef]
  29. Zhang, X.L. Risk factor analysis of dust explosion. J. Technol. 2011, 11, 340–345. [Google Scholar]
  30. Wang, Q.; Fang, X.; Wen, H.; Shu, C.-M.; Luo, Z.; Xu, Q.; Wang, Q.; Sheng, Y. Explosion hazards of colored powders and the effects of suppressant powder materials. Powder Technol. 2021, 390, 11–19. [Google Scholar] [CrossRef]
  31. Le, Y.B.; Zhang, F.T.; Hu, W.X.; Wu, X.Y.; Zhang, Q.Q. Comparative Study and Analysis of Dust Explosion Risk Assessment Between China and the United States. Ind. Saf. Environ. Prot. 2020, 46, 60–62+96. [Google Scholar]
  32. Yao, L.C. Study on Comprehensive Evaluation Method of Industrial Dust Related to Explosion Risk; Harbin University of Science and Technology: Harbin, China, 2022. [Google Scholar]
  33. Bagaria, P.; Hall, B.; Dastidar, A.; Mashuga, C. Effect of particle size reduction due to dust dispersion on minimum ignition energy (MIE). Powder Technol. 2019, 356, 304–309. [Google Scholar] [CrossRef]
  34. Jiang, H.Y.J. Explosion Characteristics of Wood Dust and Its Application in Risk Assessment of Typical Production Environment; South China University of Technology: Yueyang, China, 2016. [Google Scholar]
  35. Jin, J.H.; Li, X.L.; Wang, Q. Dust explosion risk assessment method and its application. China Saf. Sci. J. 2019, 29, 164–169. [Google Scholar]
  36. Zheng, W.B.; Wu, Y.Q.; Liang, A.C.; Wang, H.L.; Gan, L. Application Research on risk management system of coal mine dust accident. China Energy Environ. Prot. 2017, 39, 11–16. [Google Scholar]
  37. GB/T 16426-1996; Determination of Maximum Explosion Pressure and Maximum Pressure Rise Rate of Dust Cloud. Standards Press of China: Beijing, China, 1996.
  38. GB/T 16425-2018; Determination of Lower Explosion Limit Concentration of Dust Cloud. Standards Press of China: Beijing, China, 2018.
  39. GB/T 16428-1996; Determination of Minimum Ignition Energy of Dust Cloud. Standards Press of China: Beijing, China, 1996.
  40. GB/T 16429-1996; Determination of Minimum Ignition Temperature of Dust Cloud. Standards Press of China: Beijing, China, 1996.
  41. GB/T 16430-2018; Determination of Minimum Ignition Temperature of Dust Layer. Standards Press of China: Beijing, China, 2018.
  42. MT/T 837-1999; Determination of Limit Oxygen Content in Coal Dust Explosion. China Coal Industry Publishing House: Beijing, China, 1999.
  43. Zhao, Y.; Zhang, W.; Feng, D.; Wang, P.; Sun, S.; Wu, J.; Li, P. Experimental study of the flame propagation characteristics of pulverized coal in an O2/CO2 atmosphere. Fuel 2020, 262, 116678. [Google Scholar] [CrossRef]
Figure 1. Particle size distribution and scanning electron microscope structure.
Processes 11 02943 g001aProcesses 11 02943 g001b
Figure 2. Schematic diagram of 20 L spherical explosion test system.
Processes 11 02943 g002
Figure 3. Schematic diagram of Hartmann tube device.
Processes 11 02943 g003
Figure 4. Schematic diagram of Gobert–Greenwald constant temperature furnace device.
Processes 11 02943 g004
Figure 5. Installation schematic diagram of the minimum ignition temperature of the dust layer.
Processes 11 02943 g005
Figure 6. Effect of dust mass concentration on Pmax and (dp/dt)max of AM dust.
Processes 11 02943 g006
Figure 7. Effect of dust mass concentration on MIE of TC4, TA15, and AlSi10Mg dust.
Processes 11 02943 g007
Figure 8. Effect of spraying pressure on MIE of TC4, TA15, and AlSi10Mg dust.
Processes 11 02943 g008
Figure 9. Effect of dust mass concentration on MITC of TC4, TA15, and AlSi10Mg dust.
Processes 11 02943 g009
Figure 10. Effect of spraying pressure on MITC of TC4, TA15, and AlSi10Mg dust.
Processes 11 02943 g010
Figure 11. Three-dimensional matrix classification of AM dust-explosive sensitivity.
Processes 11 02943 g011
Figure 12. Explosive risk levels of four types of AM dust sample.
Processes 11 02943 g012
Table 1. Median diameter of four categories of metal dust and eight typical metal dust samples from AM.
Sample CategoryAM SampleMedian Diameter (D50)/μm
Titanium alloy dustTC438.66
TA1532.52
Aluminum alloy dustAlSi10Mg33.41
Nickel alloy dustGH416930.80
GH353630.80
GH362527.42
Stainless steel dust316L38.91
304L36.76
Table 2. Explosion severity parameters of AM dust.
AM SamplePmax/MPa(dp/dt) max/MPa∙s−1Kst/MPa·m·s−1
TC40.4111.133.02
TA150.4414.844.03
AlSi10Mg0.6155.6215.10
GH35360.254.491.22
GH36250.254.331.17
Table 3. Minimum ignition energy of AM dust clouds with different particle sizes.
AM SampleMIE/mJ
TC480
TA1520
AlSi10Mg80
Table 4. MITC experimental data of GH4169, GH3536, and 316L dust.
AM SampleDust Mass Concentration
(kg/m3)
Spraying Pressure
(MPa)
MITC (°C)
GH41694.4440.04900
GH35364.4440.04950
316L3.3330.04950
Table 5. Minimum ignition temperatures of AM dust clouds.
AM SampleMIT/°C
TC4460
TA15430
AlSi10Mg680
Table 6. MITL result.
AM SampleThickness
(mm)
Hot Surface Temperature
(°C)
MITL
(°C)
Result
TC45380476
TA155380458
AlSi10Mg5420462
GH41695450408X
GH35365450386X
GH36255450403X
316L5450383X
304L5450391X
Table 7. Minimum explosive concentration of AM dust.
AM SampleMEC/g·m−3
TC460
TA1560
AlSi10Mg75
GH3536750
GH3625500
Table 8. AM dust-explosive characteristic parameters.
AM TypeAM SampleD50/µmPmax/MPaKst/MPa−1MIE/mJMITC/MITL/°CMEC/g·m−3
Titanium alloyTC438.660.143.0280460/38060
TA1532.520.444.0320430/38060
Aluminum alloyAlSi10Mg33.410.6115.1080680/42075
Nickel alloyGH416931.80<0.04\>1000900/>450\
GH353630.800.251.22>1000950/>450750
GH362527.420.251.17>1000>1000/>450500
Stainless steel316L38.91<0.04\>1000950/>450\
304L36.76<0.04\>1000>1000/>450\
Table 9. AM dust-explosive severity classification.
ClassificationPmax (MPa)
Pmax < 0.30.3 ≤ Pmax < 0.60.6 ≤ Pmax < 1.01.0 ≤ Pmax
Kst
(MPa·m·s−1)
Kst < 20
20 ≤ Kst < 30
30 ≤ Kst
Table 10. AM dust-explosive sensitivity classification.
Classification
MIE (mJ)MIE > 10030 < MIE ≤ 10010 < MIE ≤ 30MIE ≤ 10
MIT (°C)MIT > 600450 < MIT ≤ 600300 < MIT ≤ 450MIT ≤ 300
MEC (g·m−3)MEC > 10050 < MEC ≤ 10025 < MEC ≤ 50MEC ≤ 25
Note: take the lower value of MITC and MITL to determine the MIT level.
Table 11. AM dust-explosion sensitivity classification and corresponding elements combination.
ClassificationIndex Element Combination
Aa1
Aa2 Ba1 Ab1
Aa3 Ab2 Ab3 Ac1 Ac2 Ba2 Ba3 Bb1 Bb2 Bb3 Bc1 Bc2 Ca1 Ca2 Cb1 Cb2
Aa4 Ab4 Ac3 Ac4 Ad1 Ad2 Ad3 Ba4 Bb4 Bc3 Bc4 Bd1 Bd2 Bd3 Ca3 Ca4 Cb3 Cb4 Cc1 Cc2 Cc3 Cc4 Cd1 Cd2 Cd3 Da1 Da2 Da3 Db1 Db2 Db3 Dc1 Dc2 Dc3
Ad4 Bd4 Cd4 Da4 Db4 Dc4 Dd1 Dd2 Dd3 Dd4
Table 12. AM dust-explosive risk classification by severity and sensitivity.
AM Dust Explosion Risk
Classification
Severity Classification
Sensitivity
classification
Disclaimer/Publisher’s Note: The statements, opinions and data contained in all publications are solely those of the individual author(s) and contributor(s) and not of MDPI and/or the editor(s). MDPI and/or the editor(s) disclaim responsibility for any injury to people or property resulting from any ideas, methods, instructions or products referred to in the content.

