Preparation of Activated Carbon from Korean Anthracite: Simultaneous Control of Ash Reduction and Pore Development

Abstract
:1. Introduction
2. Materials and Methods
2.1. Preparation of Activated Carbon from Anthracite
2.2. Analytical Methods
3. Results and Discussion
3.1. Elemental and Chemical Compositions
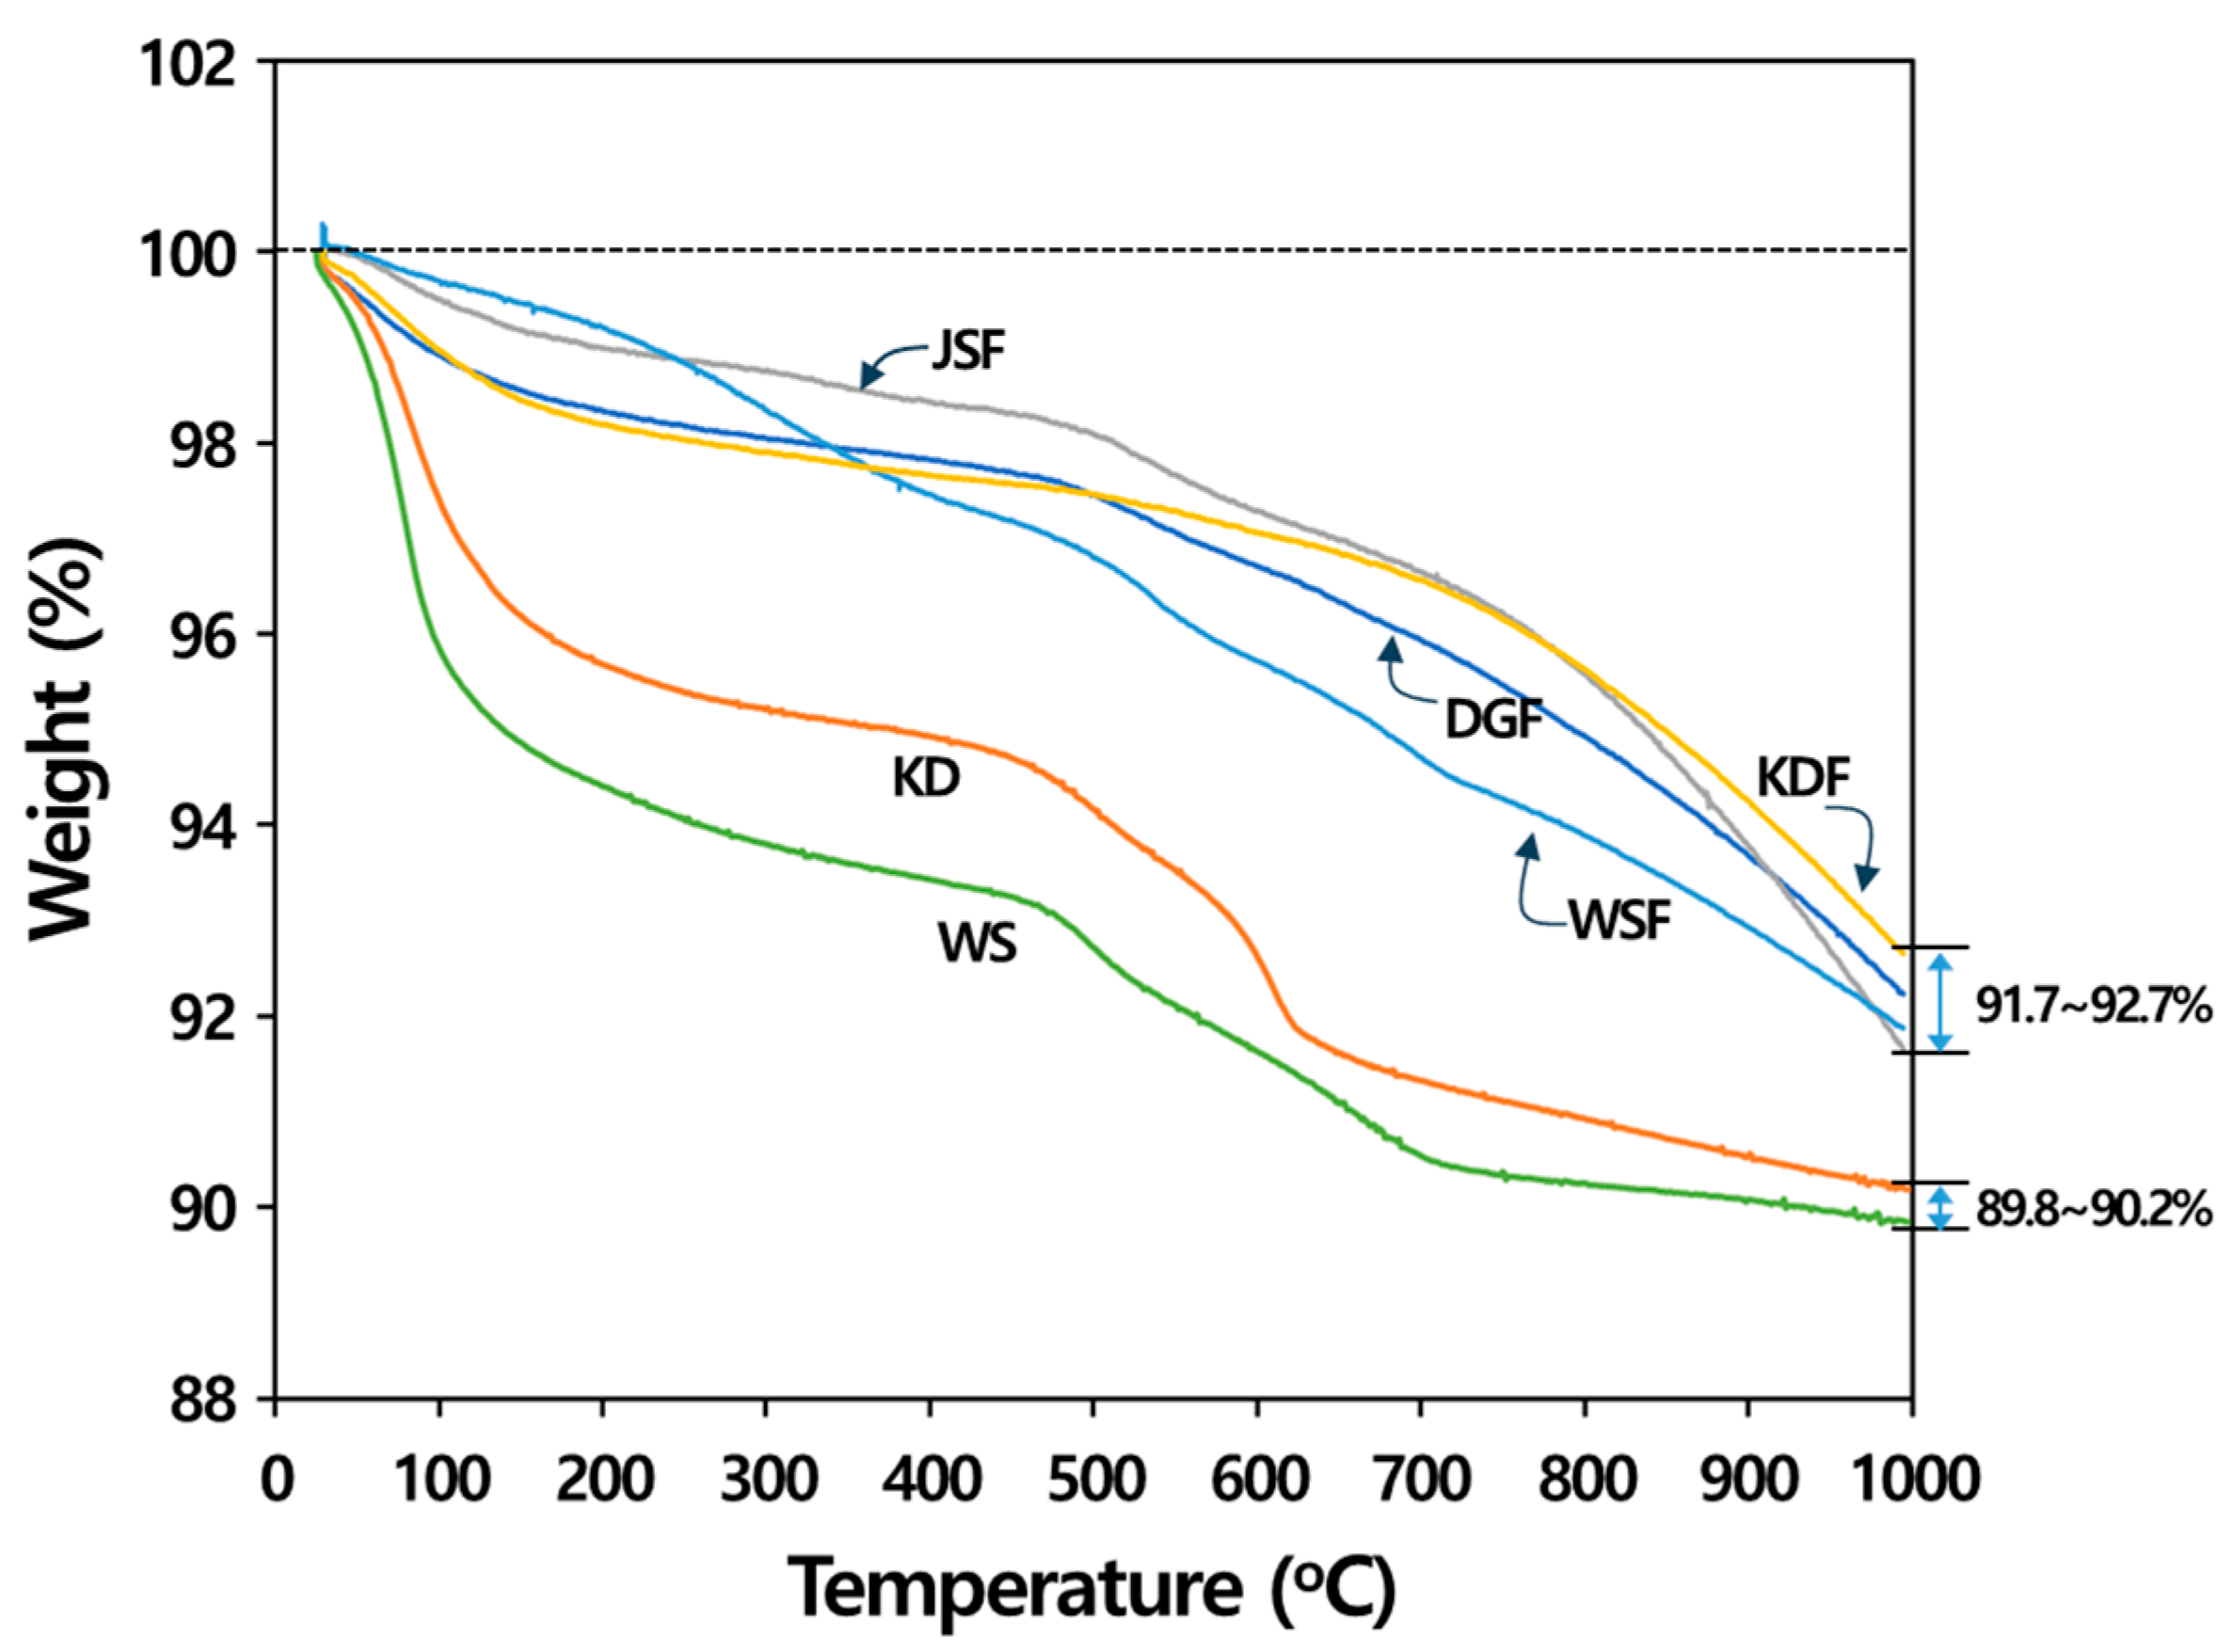
3.2. Thermal Properties
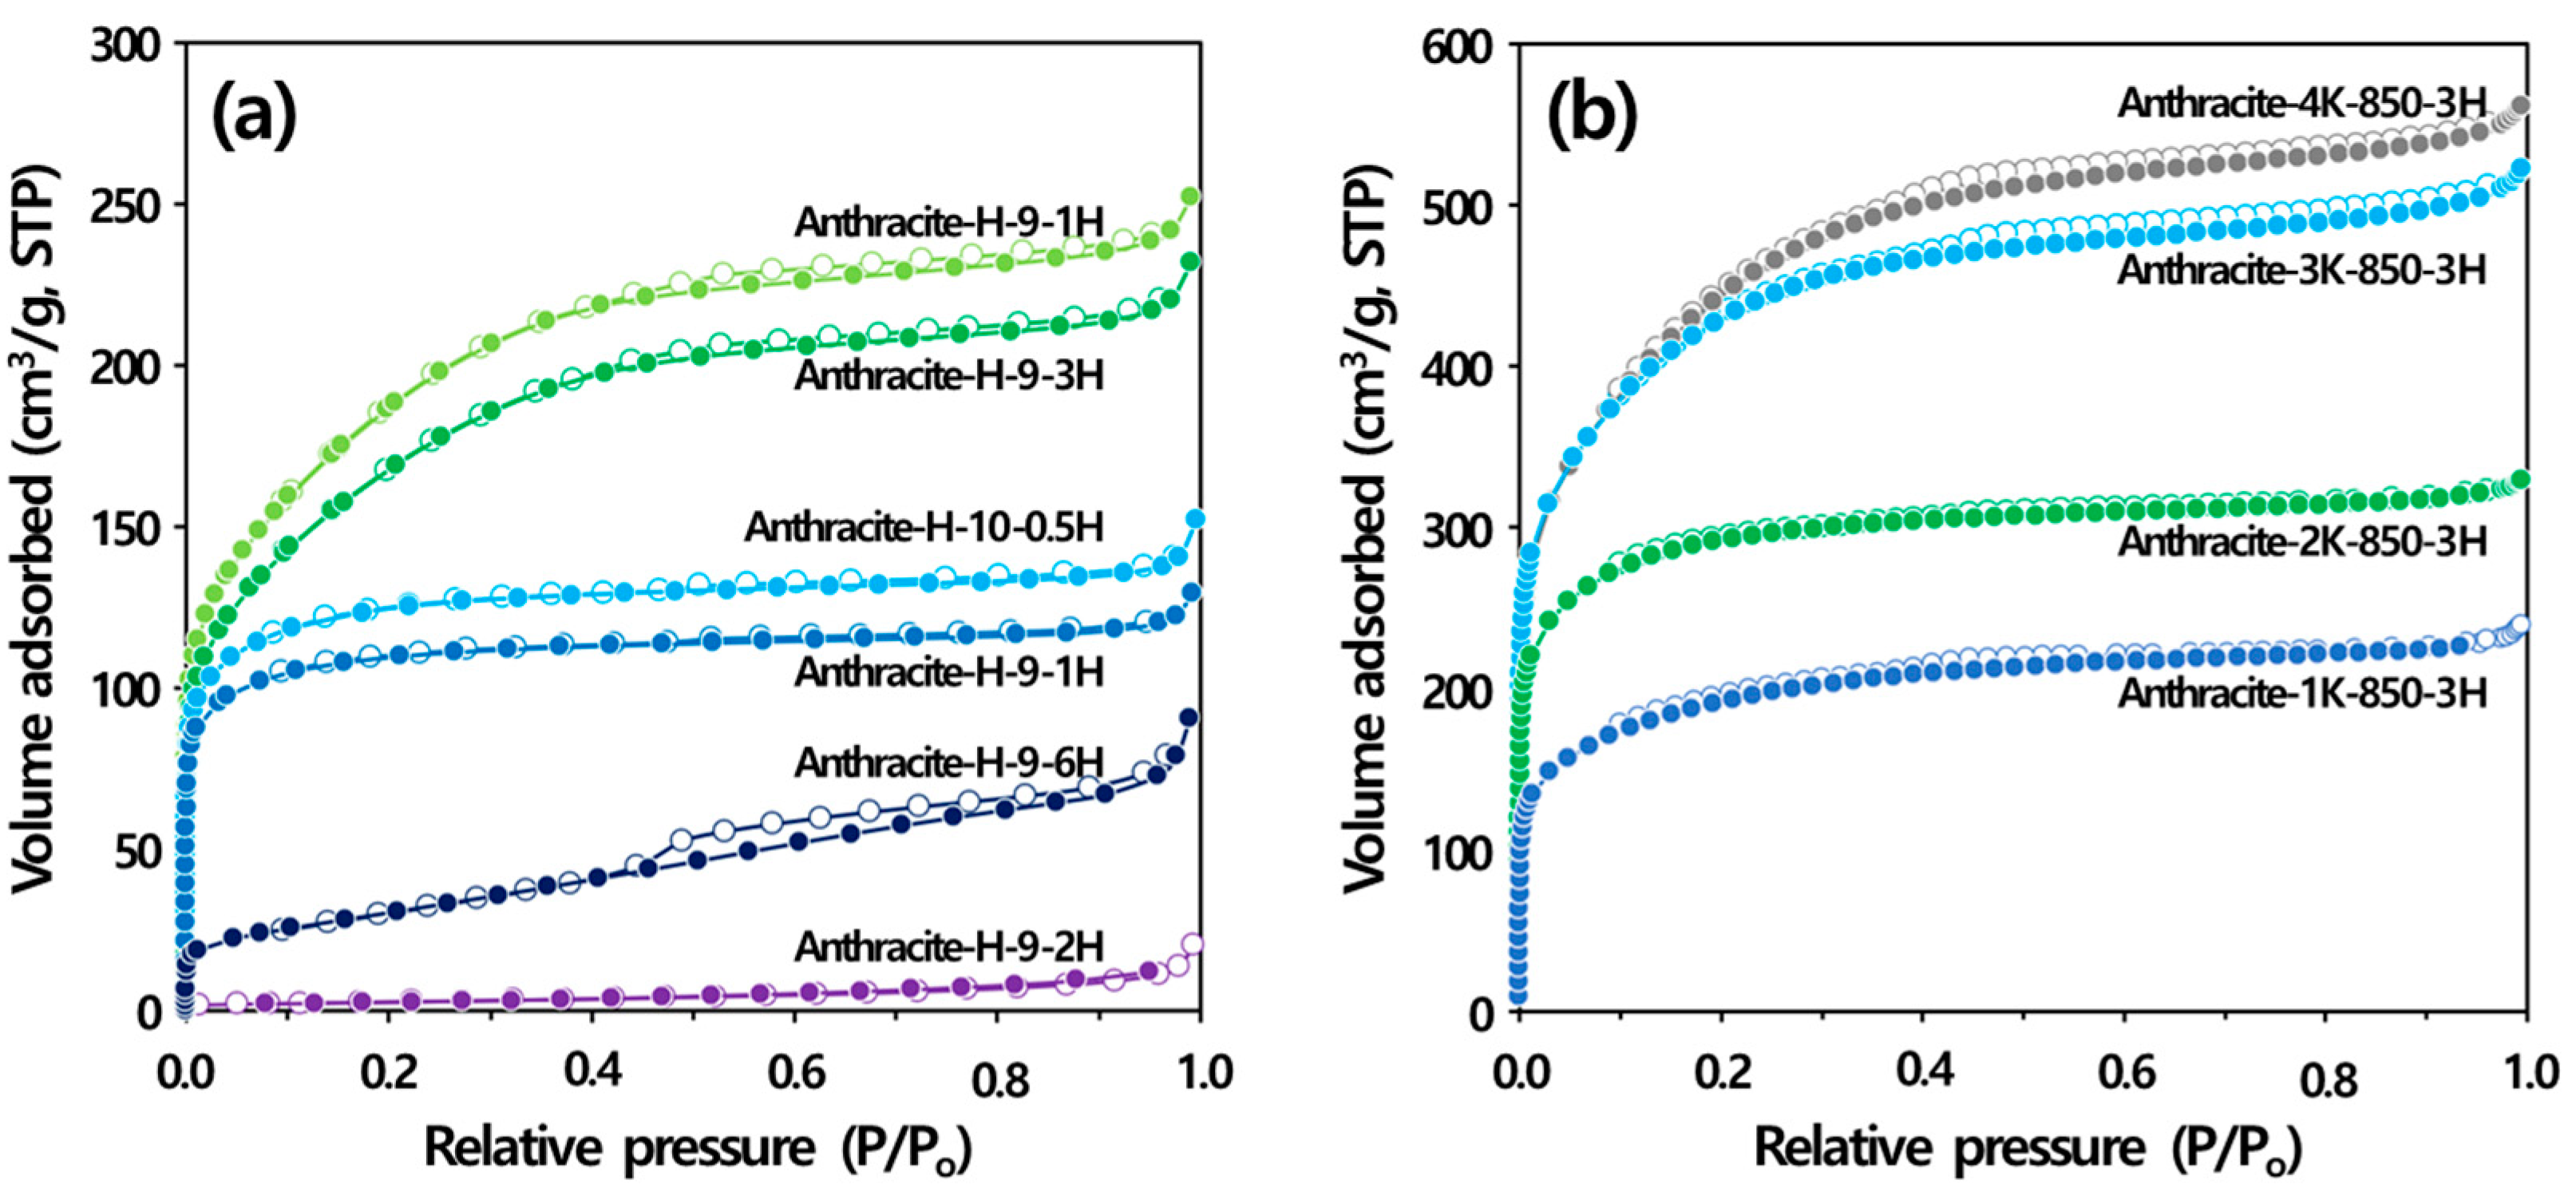
3.3. Production of Activated Carbon by Activation Methods
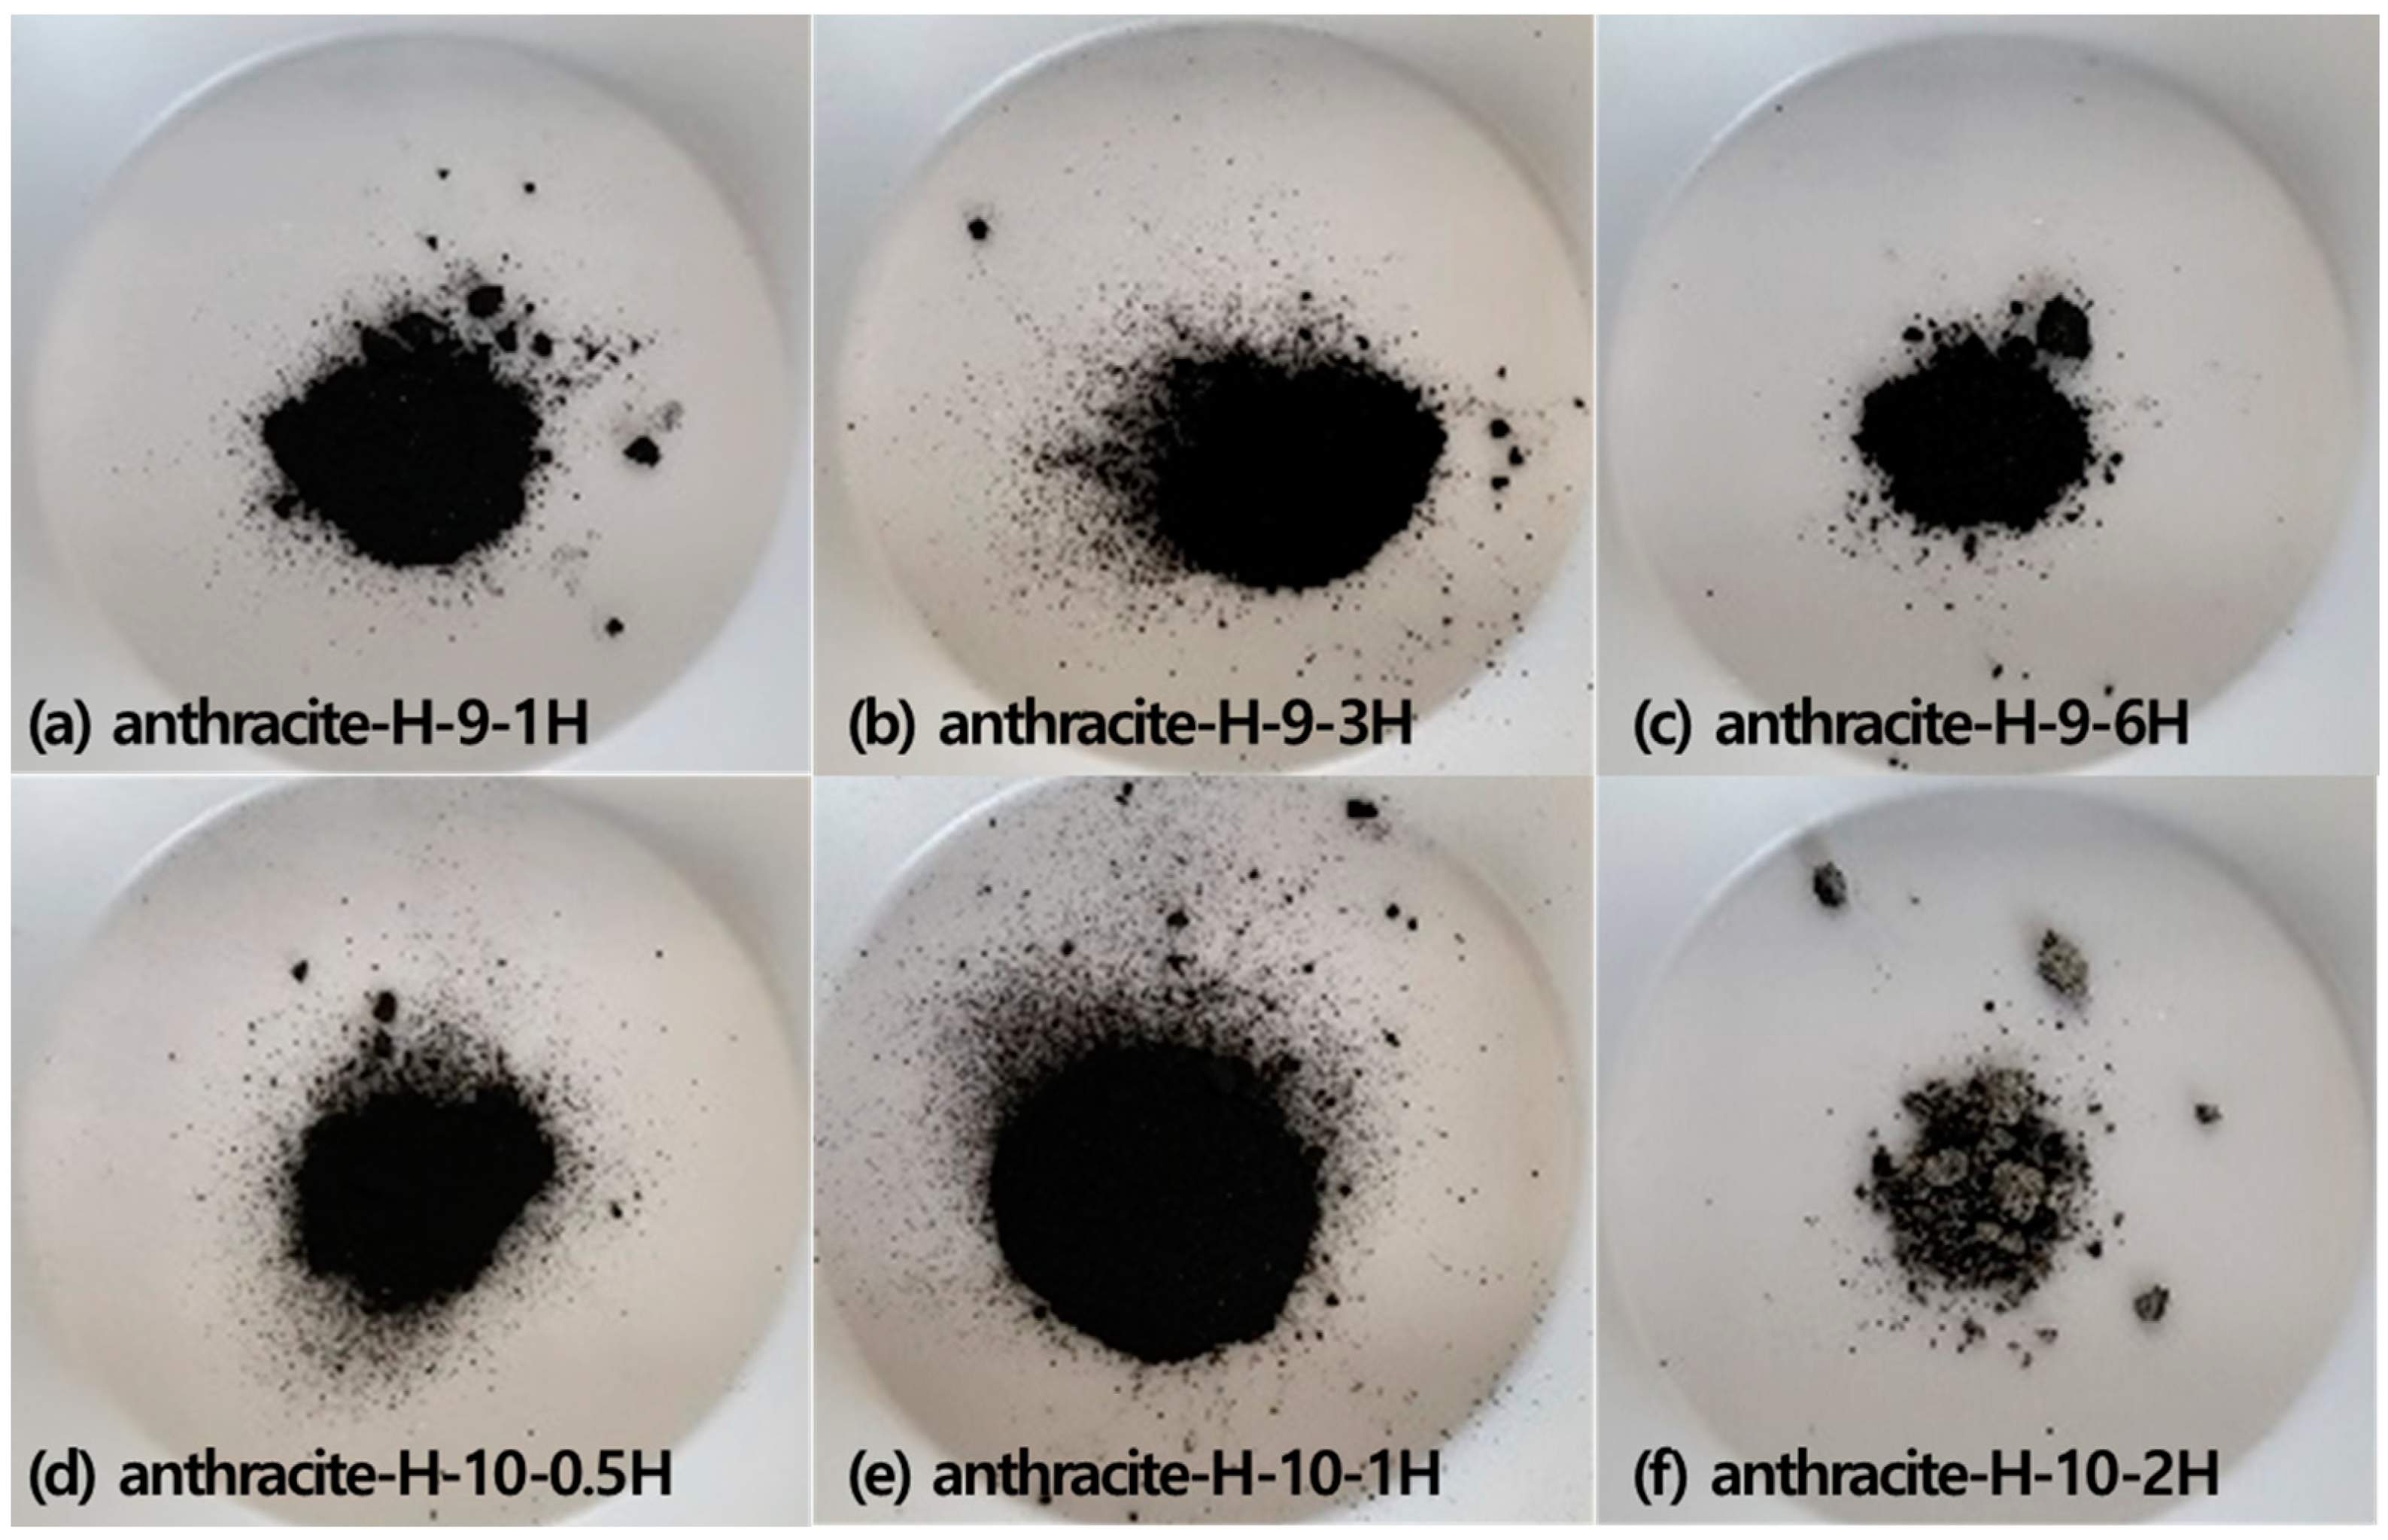
3.3.1. Physical Activation
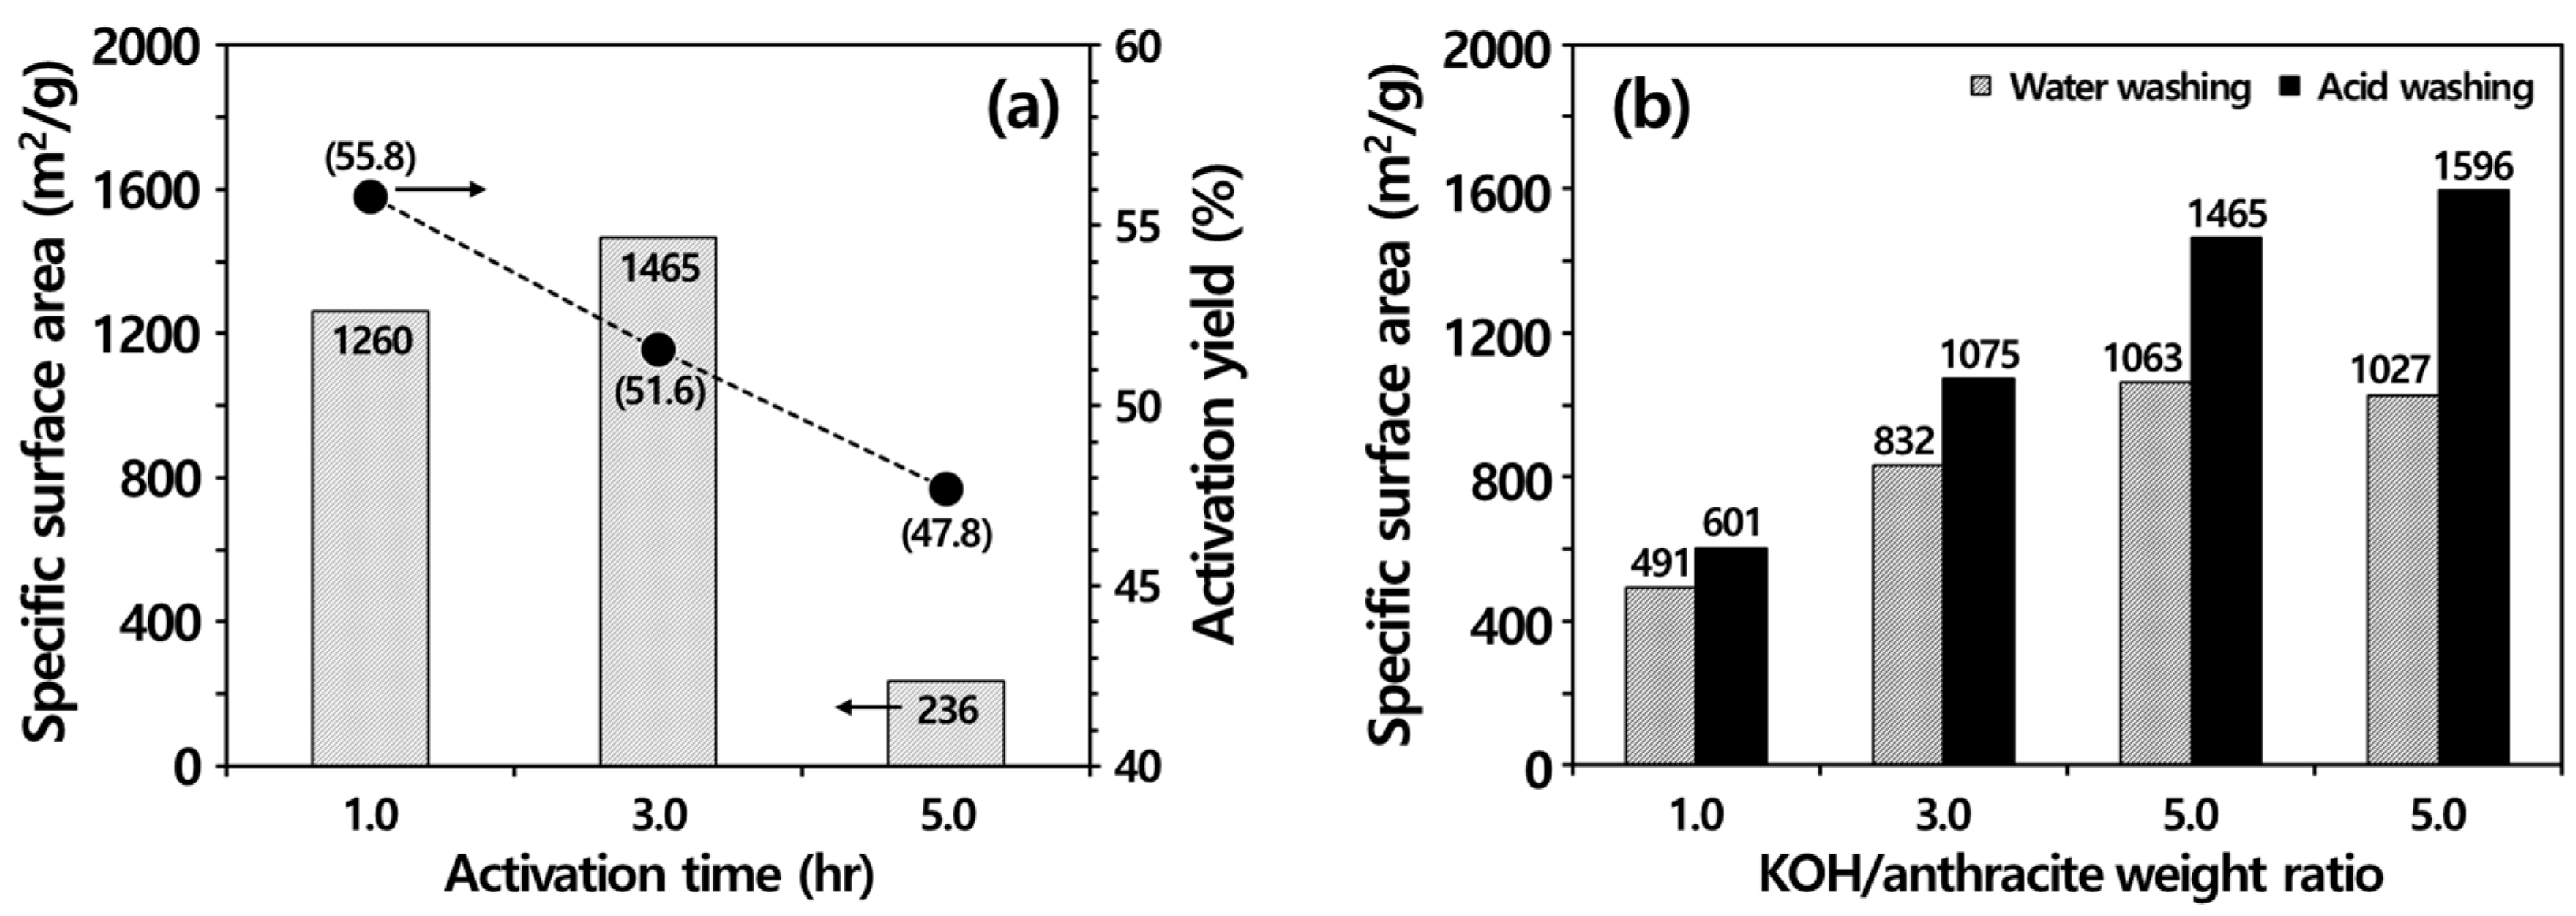
3.3.2. Chemical Activation
3.4. Ash Removal Properties during Chemical Activation
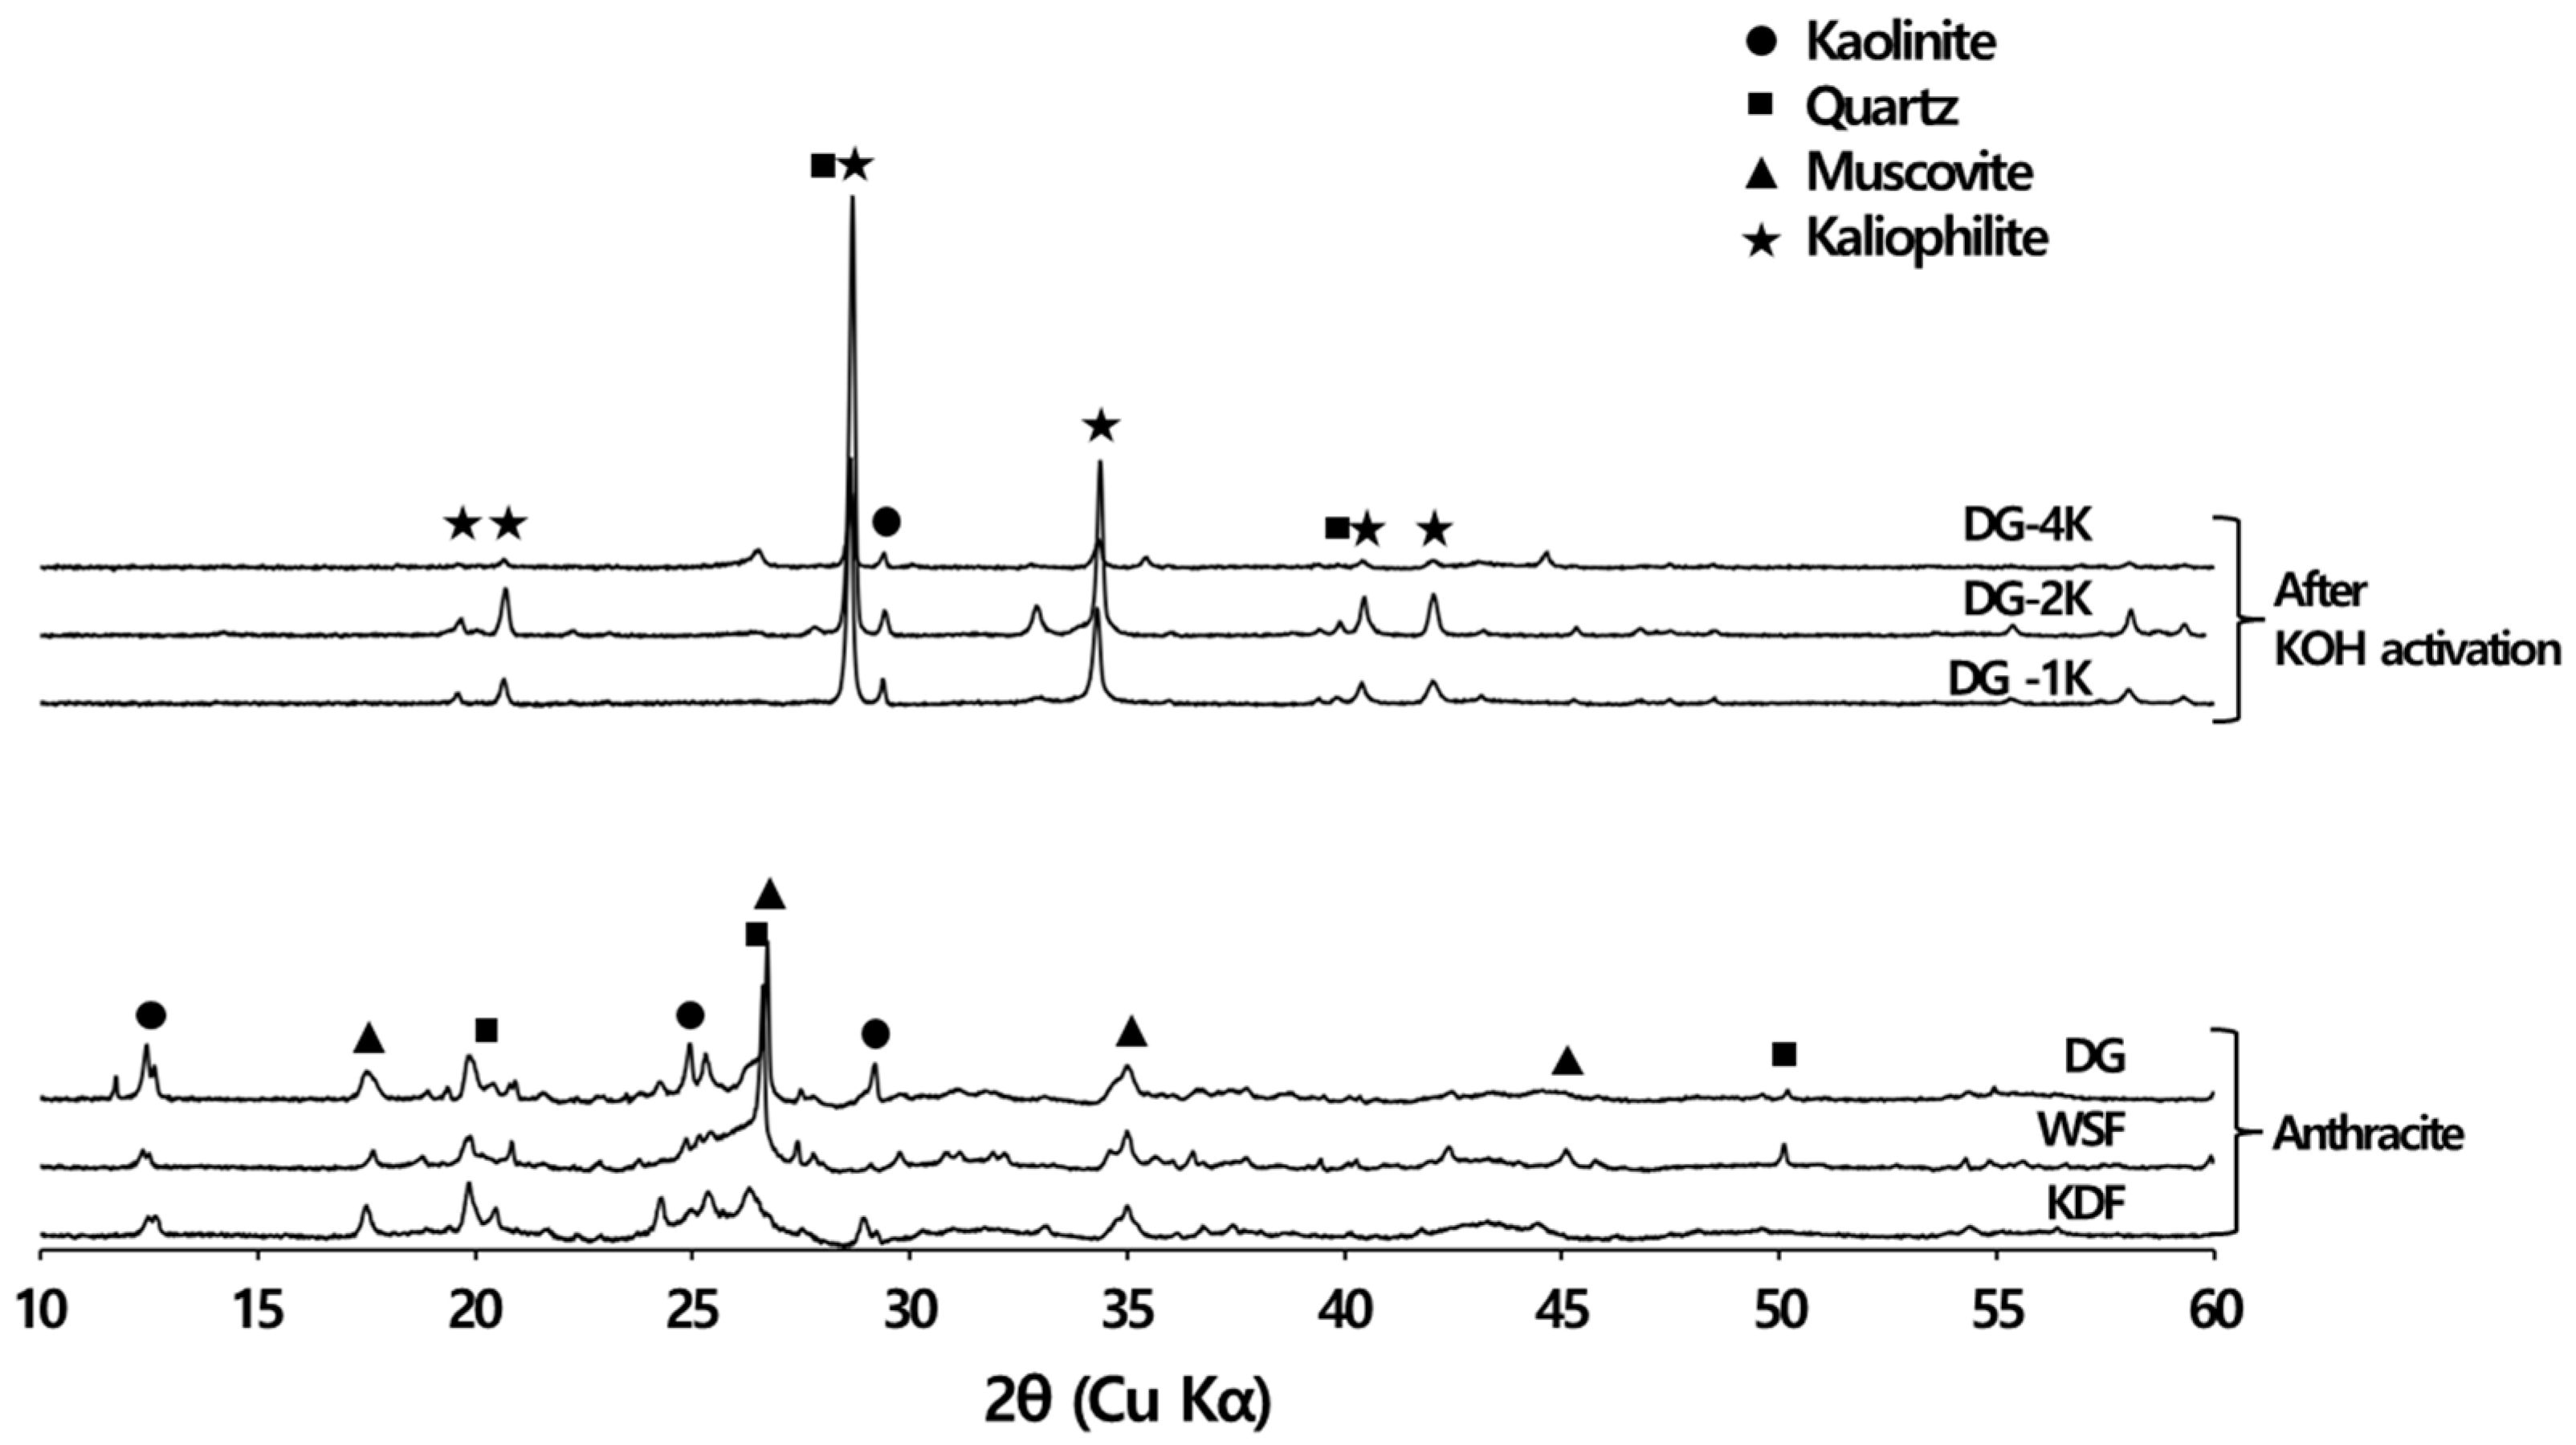
3.4.1. XRD
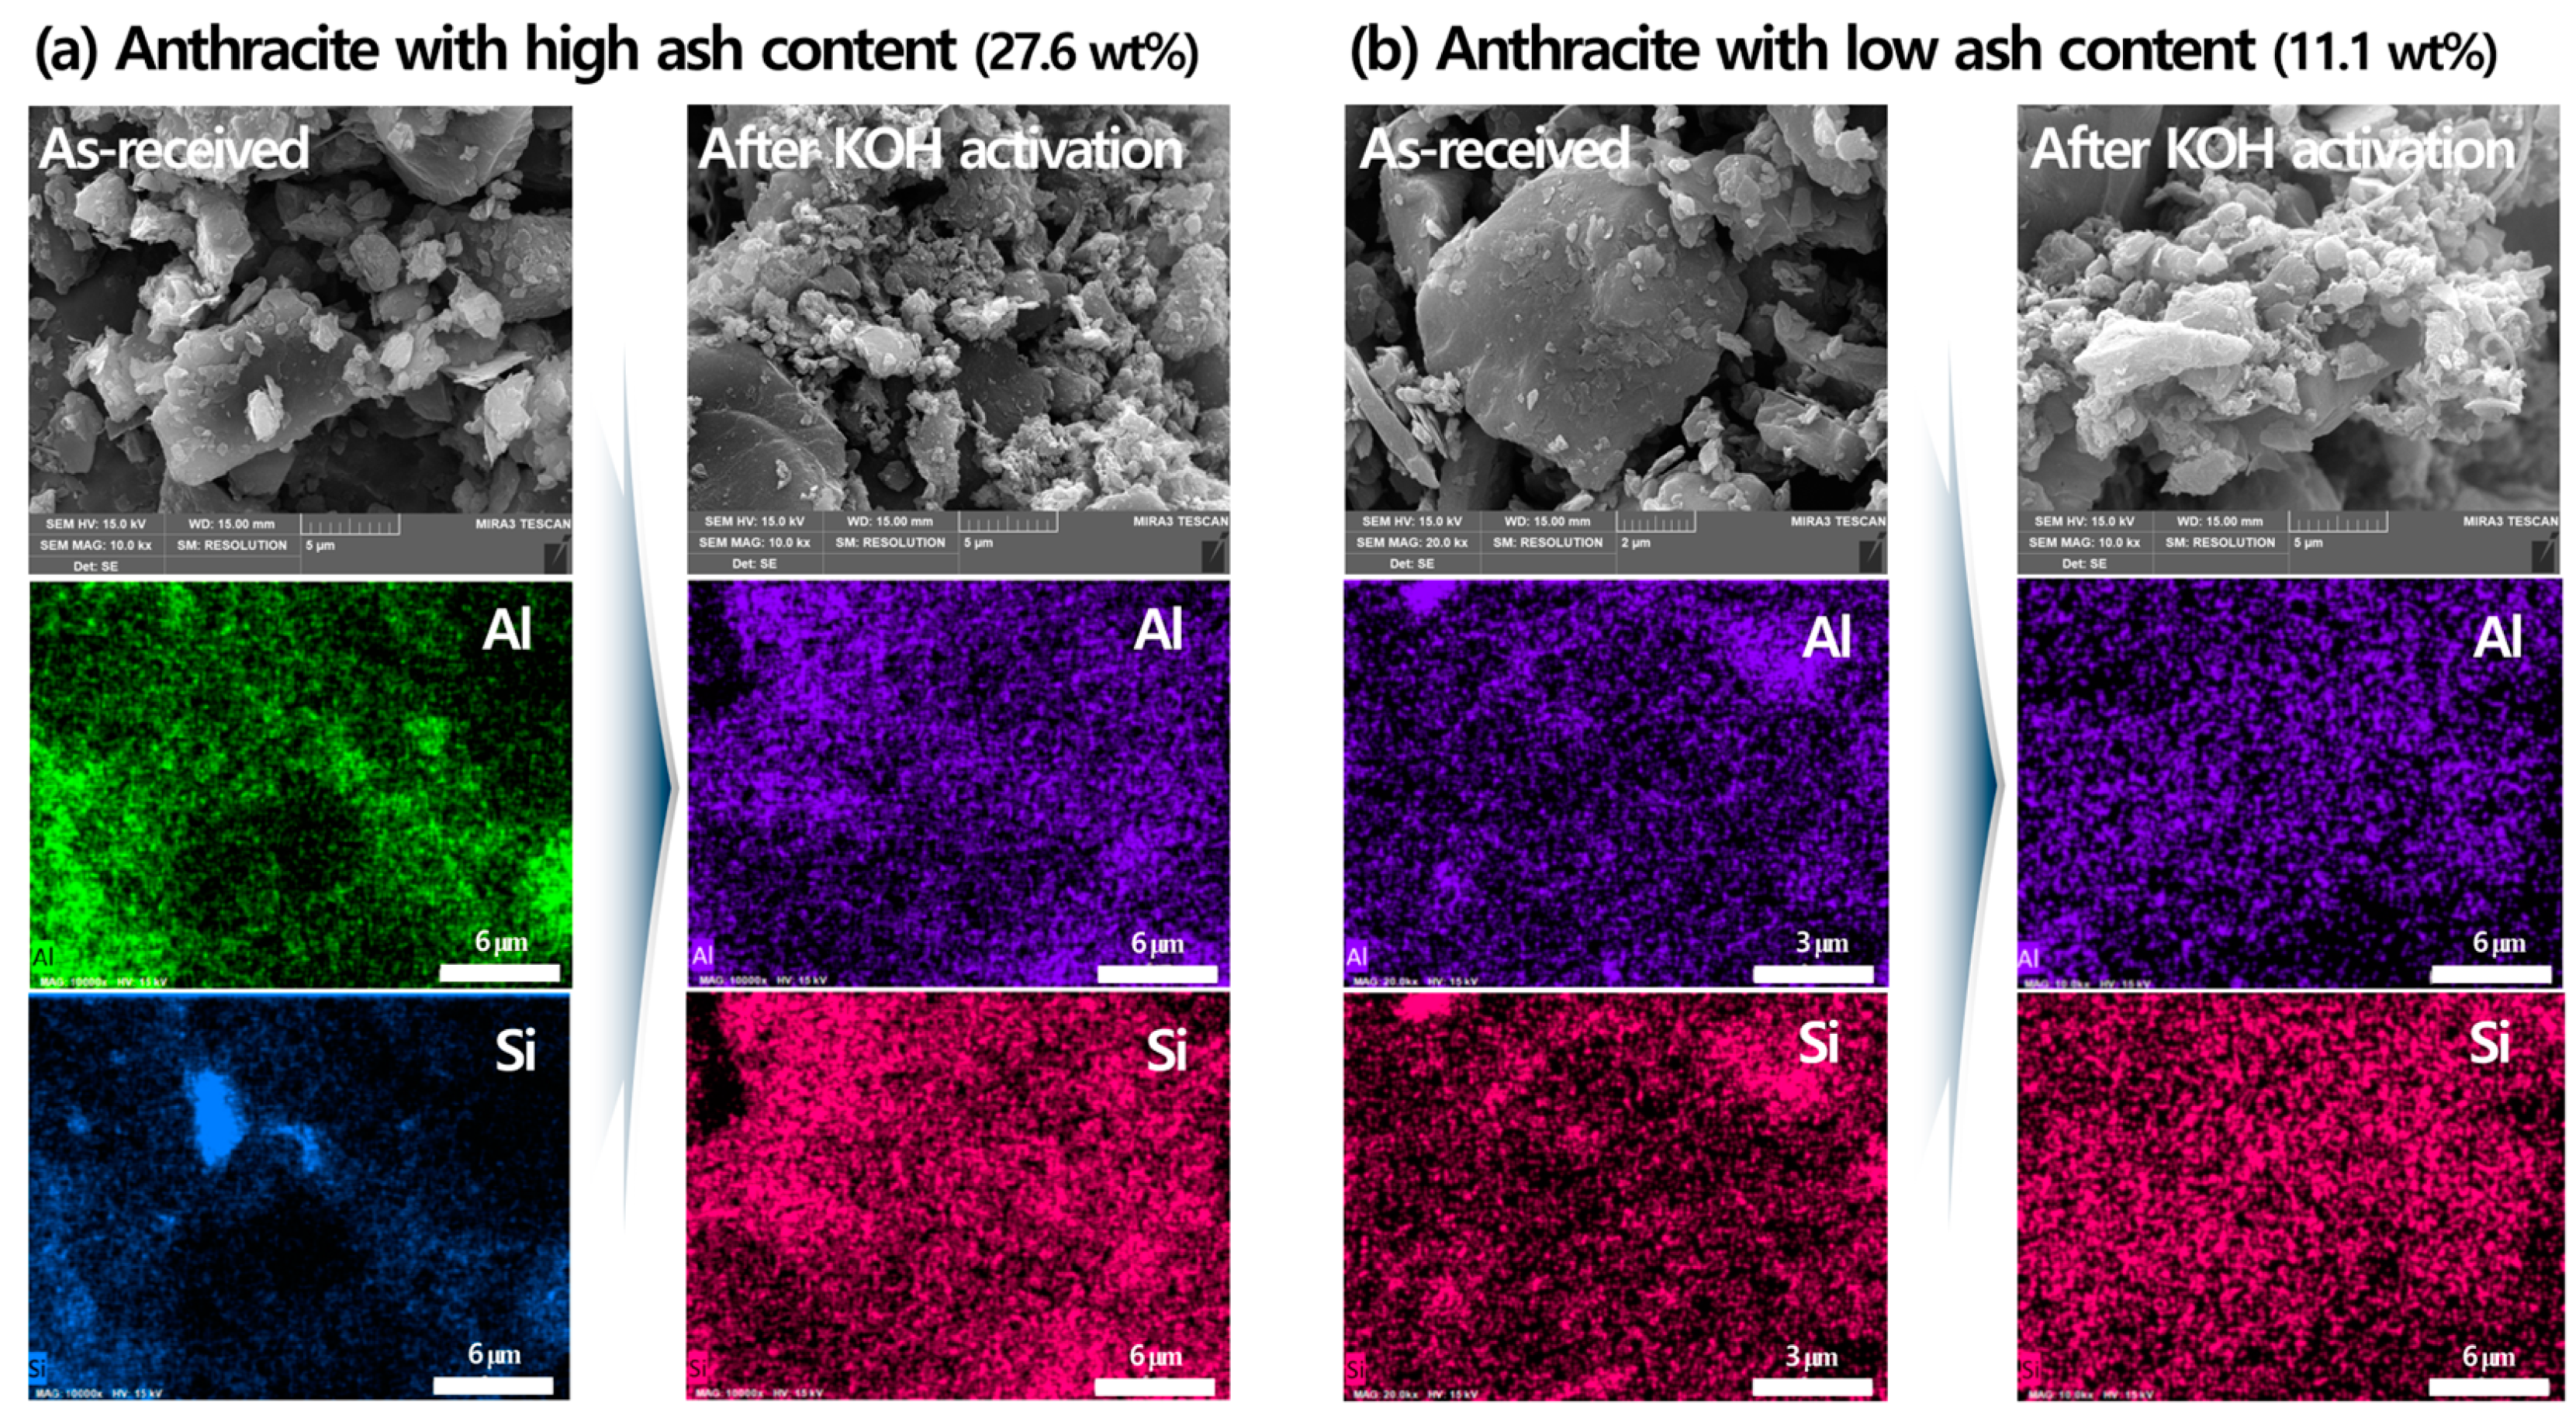
3.4.2. SEM-EDS
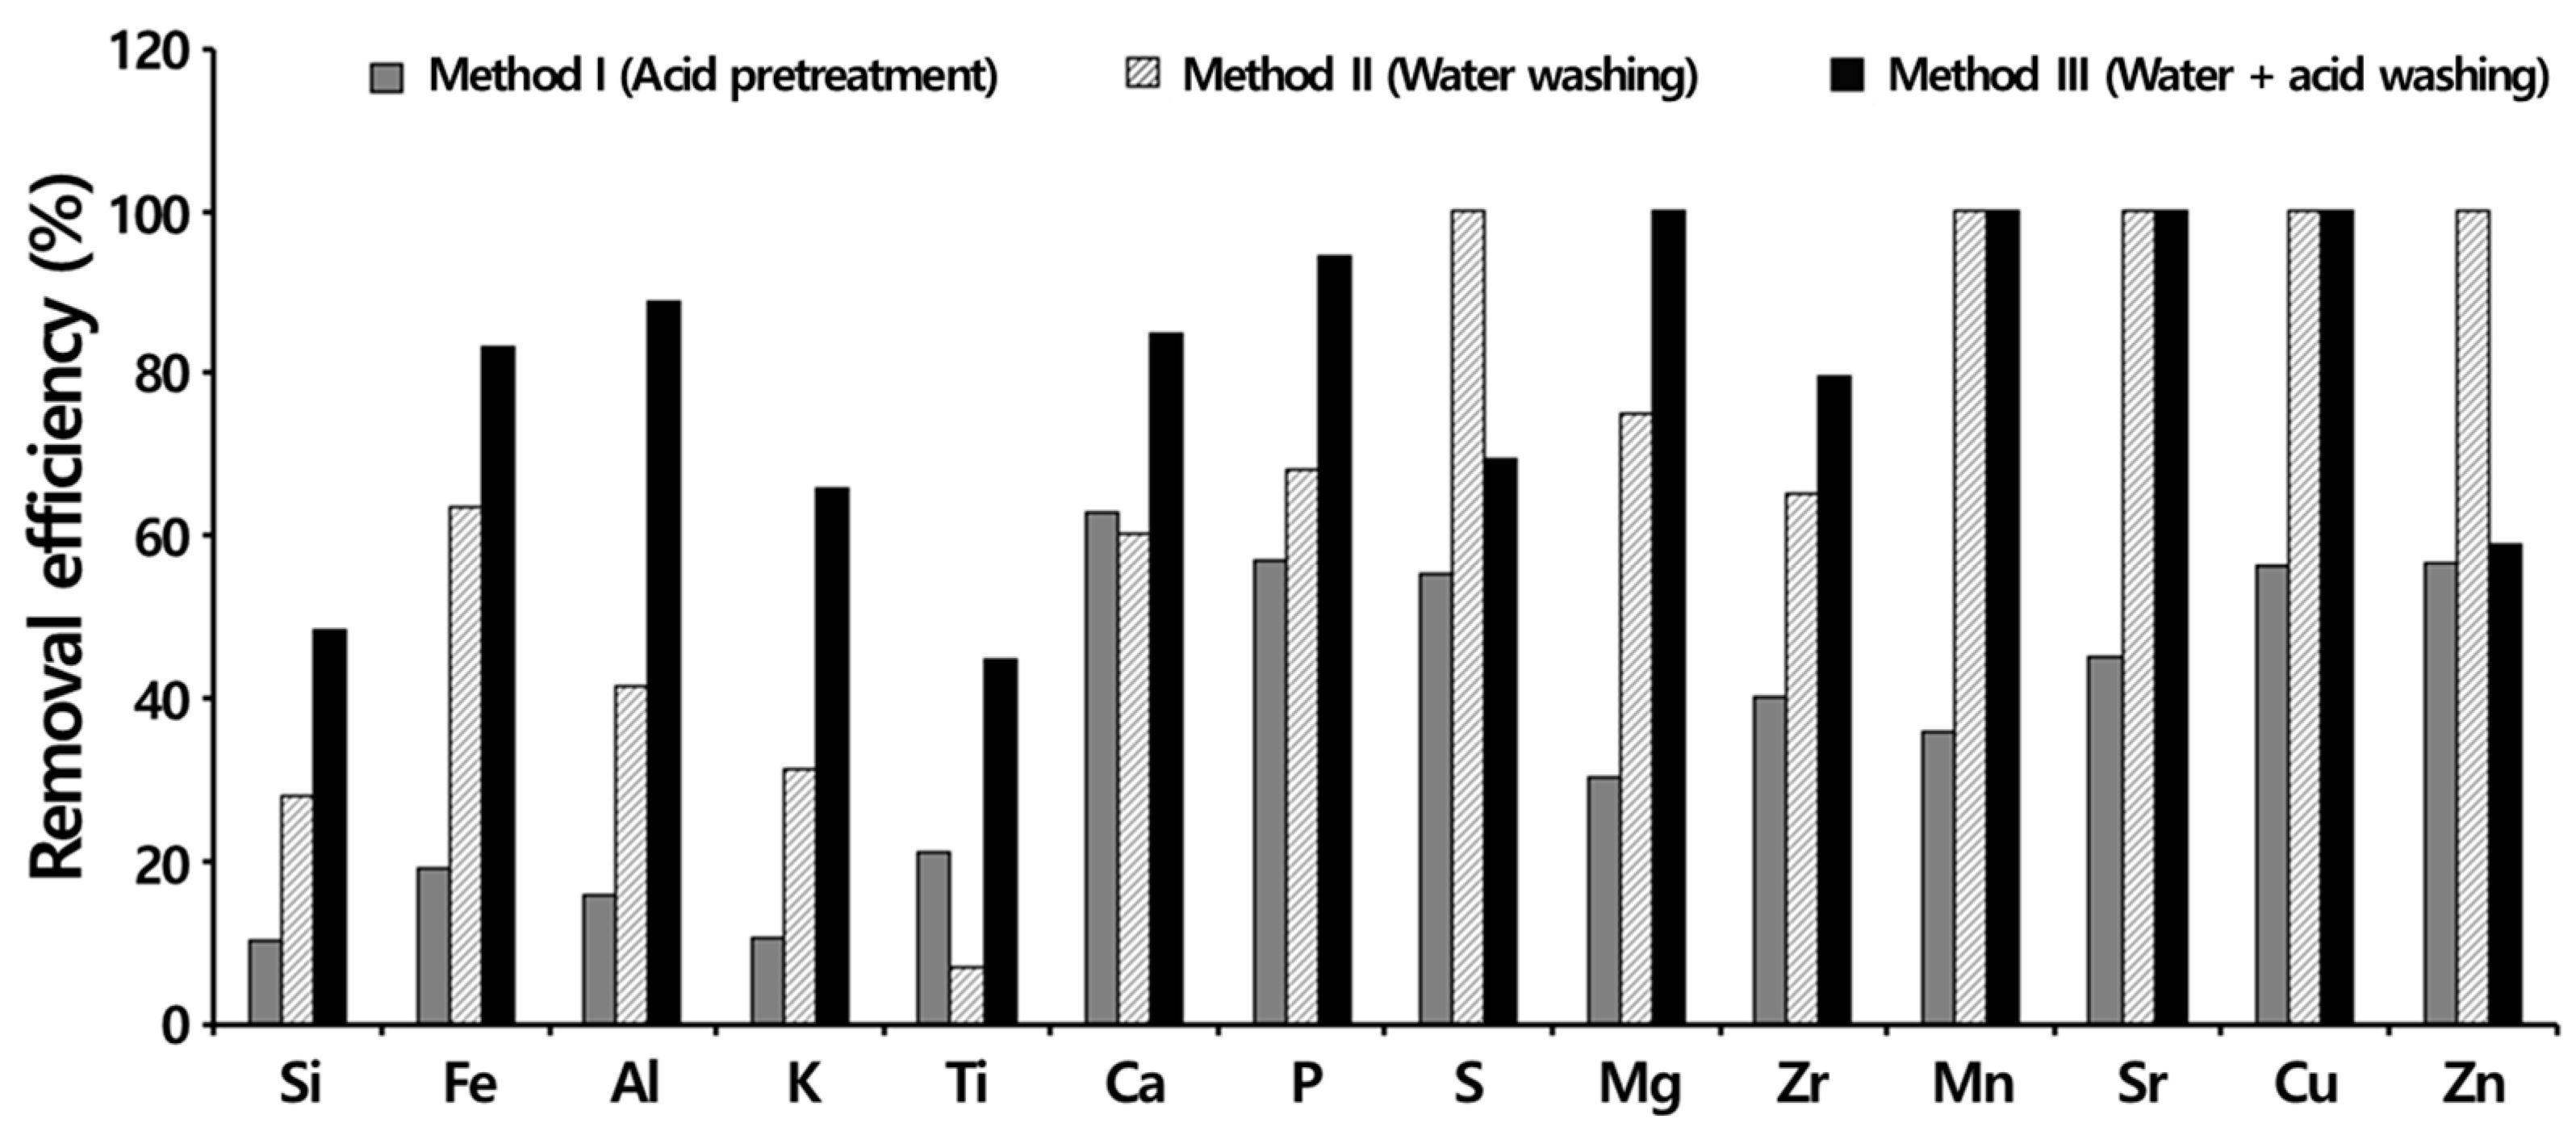
3.4.3. Importance of Acid Washing after KOH Activation
4. Conclusions
Author Contributions
Funding
Data Availability Statement
Conflicts of Interest
References
- Diercks, R.; Arndt, J.D.; Freyer, S.; Ceier, R.; Machhammer, O.; Schwartze, J.; Volland, M. Raw material changes in the chemical industry. Chem. Eng. Technol. 2008, 31, 631–637. [Google Scholar] [CrossRef]
- Tost, M.; Hitch, M.; Chandurkar, V.; Moser, P.; Feiel, S. The state of environmental sustainability consideration in mining. J. Clean. Prod. 2018, 182, 969–977. [Google Scholar] [CrossRef]
- Zhou, H.; Bhattarai, R.; Li, Y.; Dong, X.; Wang, T.; Yao, Z. Towards sustainable coal industry: Turning coal bottom ash into wealth. Sci. Total Environ. 2022, 804, 149985. [Google Scholar] [CrossRef] [PubMed]
- Trinks, A.; Scholtens, B.; Mulder, M.; Dam, L. Fossil fuel divestment and portfolio performance. Ecol. Econ. 2018, 146, 740–748. [Google Scholar] [CrossRef]
- Gueye, E.H.M.; Badri, A.; Boudreau-Trudel, B. Sustainable development in the mining industry: Towards the development of tools for evaluating socioeconomic impact in the Canadian context. Environ. Dev. Sustain. 2021, 23, 6576–6602. [Google Scholar] [CrossRef]
- Li, Y.; Chiu, Y.H.; Lin, T.Y. Coal production efficiency and land destruction in China’s coal mining industry. Resour. Policy 2019, 63, 101449. [Google Scholar] [CrossRef]
- Gui, X.; Liu, J.; Cao, Y.; Miao, Z.; Li, S.; Xing, Y.; Wang, D. Coal preparation technology: Status and development in China. Energy Environ. 2015, 26, 997–1014. [Google Scholar] [CrossRef]
- Xu, J.; Gao, W.; Xie, H.; Dai, J.; Lv, C.; Li, M. Integrated tech-paradigm based innovative approach towards ecological coal mining. Energy 2018, 151, 297–308. [Google Scholar] [CrossRef]
- Zhao, S.; Alexandroff, A. Current and future struggles to eliminate coal. Energy Policy 2019, 129, 511–520. [Google Scholar] [CrossRef]
- Lozano-Castello, D.; Lillo-Rodenas, M.A.; Cazorla-Amoros, D.; Linares-Solano, A. Preparation of activated carbons from Spanish anthracite. I. Activated by KOH. Carbon 2001, 39, 741–749. [Google Scholar] [CrossRef]
- Cuhadaroglu, D.; Uygun, O.A. Production and characterization of activated carbon from bituminous coal by chemical activation. Afr. J. Biotechnol. 2008, 7, 3703–3710. [Google Scholar]
- Zhao, C.; Ge, L.; Mai, L.; Li, X.; Chen, S.; Li, Q.; Li, S.; Yao, L.; Wang, Y.; Xu, C. Review on coal-based activated carbon: Preparation, modification, application, regeneration, and perspectives. Energy Fuels 2023, 37, 11622–11642. [Google Scholar] [CrossRef]
- DeBarr, J.A.; Lizzio, A.A.; Daley, M.A. Adsorption of SO2 on bituminous coal char and activated carbon fiber. Energy Fuels 1997, 11, 267–271. [Google Scholar] [CrossRef]
- Zhao, H.; Wang, L.; Jia, D.; Xia, W.; Li, J.; Guo, Z. Coal based activated carbon nanofibers prepared by electrospinning. J. Mater. Chem. A 2014, 2, 9338–9344. [Google Scholar] [CrossRef]
- Ye, R.; Xiang, C.; Lin, J.; Peng, Z.; Huang, K.; Yan, Z.; Cook, N.P.; Samuel, E.L.G.; Hwang, C.C.; Ruan, G.; et al. Coal as an abundant source of graphene quantum dots. Nat. Commun. 2013, 4, 2943. [Google Scholar] [CrossRef]
- Zhang, Y.; Zhang, K.; Jia, K.; Liu, G.; Ren, S.; Lia, K.; Long, X.; Lia, M.; Qiu, J. Preparation of coal-based graphene quantum dots/α-Fe2O3 nanocomposites and their lithium-ion storage properties. Fuel 2019, 241, 646–652. [Google Scholar] [CrossRef]
- Patney, H.K.; Nordlund, C.; Moy, A.; Rose, H.; Young, B.; Wilson, M.A. Fullerenes and nanotubes from coal. Fuller. Sci. Technol. 1999, 7, 941–971. [Google Scholar] [CrossRef]
- Moothi, K.; Iyuke, S.E.; Meyyappan, M.; Falcon, R. Coal as a carbon source for carbon nanotube synthesis. Carbon 2012, 50, 2679–2690. [Google Scholar] [CrossRef]
- Wu, L.; Liu, J.; Reddy, B.R.; Zhou, J. Preparation of coal-based carbon nanotubes using catalytical pyrolysis: A brief review. Fuel Process. Technol. 2022, 229, 107171. [Google Scholar] [CrossRef]
- Qiu, J.S.; Zhou, Y.; Yang, Z.G.; Wang, D.K.; Guo, S.C.; Tsang, S.C.; Harris, P.J.F. Preparation of fullerenes using carbon rods manufactured from Chinese hard coal. Fuel 2000, 79, 1303–1308. [Google Scholar] [CrossRef]
- Awasthi, S.; Awasthi, K.; Ghosh, A.K.; Srivastava, S.K.; Srivastava, O.N. Formation of single and multi-walled carbon nanotubes and graphene from Indian bituminous coal. Fuel 2015, 147, 35–42. [Google Scholar] [CrossRef]
- Zhang, Y.; Lebedev, M.; Smith, G.; Jing, Y.; Bush, A.; Lalauer, S. Nano-mechanical properties and pore-scale characterization of different rank coals. Nat. Resour. Res. 2020, 29, 1787–1800. [Google Scholar] [CrossRef]
- Kim, J.H.; Lee, G.; Park, J.E.; Kim, S.H. Limitation of K2CO3 as a chemical agent for upgrading activated carbon. Processes 2021, 9, 1000. [Google Scholar] [CrossRef]
- Montes, V.; Hill, J.M. Activated carbon production: Recycling KOH to minimize waste. Mater. Lett. 2018, 220, 238–240. [Google Scholar] [CrossRef]
- Hwang, S.Y.; Lee, G.B.; Kim, J.H.; Hong, B.U.; Park, J.E. Pre-treatment methods for regeneration of spent activated carbon. Molecules 2020, 25, 4561. [Google Scholar] [CrossRef]
- Zou, X.; Ding, L.; Guo, X.L.; Lu, H.; Gong, X. Study on effects of ash on the evolution of physical and chemical structures of char during CO2 gasification. Fuel 2018, 217, 589–596. [Google Scholar] [CrossRef]
- Oglou, R.C.; Gokce, Y.; Yagmur, E.; Ghobadi, T.G.Y.; Aktas, Z. Highly stable megalopolis lignite based N and S self-doped hierarchically porous activated carbons for high performance supercapacitors and ash content effects on performance. J. Energy Storage 2022, 46, 103817. [Google Scholar] [CrossRef]
- Yaman, S.; Yavuz, R. Stepwise demineralisation and chemical isolation of the mineral matter of Göynük lignite. Energy Convers. Manag. 2001, 42, 2119–2127. [Google Scholar] [CrossRef]
- Meshram, P.; Purohit, B.K.; Sinha, M.K.; Sahu, S.K.; Pandey, B.D. Demineralization of low grade coal—A review. Renew. Sustain. Energy Rev. 2015, 41, 745–761. [Google Scholar] [CrossRef]
- Parthasarathy, P.; Choi, H.S.; Park, H.C.; Hwang, J.G.; Yoo, H.S.; Lee, B.K. The review of upgrading coal techniques in South Korea. J. Korea Soc. Waste Manag. 2016, 33, 419–445. [Google Scholar] [CrossRef]
- Pan, J.; Hassas, B.V.; Rezaee, M.; Zhou, C.; Pisupati, S.V. Recovery of rare earth elements from coal fly ash through sequential chemical roasting, water leaching, and acid leaching processes. J. Clean. Prod. 2021, 284, 124725. [Google Scholar] [CrossRef]
- Motlagh, E.K.; Sharifian, S.; Asasian-Kolur, N. Alkaline activating agents for activation of rice husk biobar and simulated bio-silica extraction. Bioresour. Technol. Rep. 2021, 16, 100853. [Google Scholar] [CrossRef]
- Peterson, C.A.; Brown, R.C. Oxidation kinetics of biochar from woody and herbaceous biomass. Chem. Eng. J. 2020, 401, 126043. [Google Scholar] [CrossRef]
- Hilton, R.; Bick, P.; Tekeei, A.; Leimkuehler, E.; Pfeifer, P.; Suppes, G.J. Mass balance and performance analysis of potassium hydroxide activated carbon. Ind. Eng. Chem. Res. 2021, 52, 9129–9135. [Google Scholar] [CrossRef]
- Romanos, J.; Beckner, M.; Rash, T.; Firlej, L.; Kuchta, B.; Yu, P.; Suppes, G.; Wexler, C.; Pfeifer, P. Nanospace engineering of KOH activated carbon. Nanotechnology 2012, 23, 015401. [Google Scholar] [CrossRef]
- Ohm, T.I.; Chae, J.S.; Lim, J.H.; Moon, S.H. Evaluation of a hot oil immersion drying method for the upgrading of crushed low-rank coal. J. Mech. Sci. Technol. 2012, 26, 1299–1303. [Google Scholar] [CrossRef]
- Rao, Z.; Zhao, Y.; Huang, C.; Duan, C.; He, J. Recent developments in drying and dewatering for low rank coals. Prog. Energy Combust. Sci. 2015, 46, 1–11. [Google Scholar] [CrossRef]
- Nasir, S.; Kucerik, J.; Mahmood, Z. A study on the washability of the Azad Kashmir (Pakistan) coalfield. Fuel Process. Technol. 2012, 99, 75–81. [Google Scholar] [CrossRef]
- Han, O.H.; Kim, M.K.; Kim, B.G.; Subasinghe, N.; Park, C.H. Fine coal beneficiation by column flotation. Fuel Process. Technol. 2014, 126, 49–59. [Google Scholar] [CrossRef]
- Lu, G.; Zhang, K.; Cheng, F. The fusion characteristics of ahes from anthracite and biomass blends. J. Energy Inst. 2018, 91, 797–804. [Google Scholar] [CrossRef]
- Davaadorj, T.; Baek, S.H.; Kim, B.G.; Jeon, H.S. Recovery of clean coal for the use of synthetic fuels from anthracite by forth flotation. J. Korean Soc. Miner. Energy Resour. Eng. 2018, 55, 285–292. [Google Scholar] [CrossRef]
- Yao, Z.; Meisheng, X.; Ying, Y.; Lu, Z. Kaliophilite from fly ash: Synthesis, characterization and stability. Bull. Mater. Sci. 2011, 34, 1671–1674. [Google Scholar] [CrossRef]
- Chen, X.; Chen, J.; Li, M.; Wang, J.; Zhou, Z.; Du, P.; Zhang, X. Synthesis of kaliophilite from high calcium fly ash: Effect of alkali concentration. Case Stud. Constr. Mater. 2022, 17, e01542. [Google Scholar] [CrossRef]
- Nayak, P.P.; Nandi, S.; Datta, A.K. Comparative assessment of chemical treatments on extraction potential of commercial grade silica from rice husk. Eng. Rep. 2019, 1, e12035. [Google Scholar] [CrossRef]


| Source | Raw Anthracite | Froth Flotation | |||||||
|---|---|---|---|---|---|---|---|---|---|
| Sample ID | DG | WS | JS | KD | DGF | WSF | JSF | KDF | |
| Proximate analysis (wt%) | Volatile | 7.79 | 12.9 | 8.62 | 8.94 | 3.27 | 4.70 | 3.43 | 2.31 |
| Fixed carbon | 61.6 | 51.7 | 50.6 | 67.7 | 74.4 | 67.8 | 70.3 | 86.6 | |
| Ash | 30.6 | 35.5 | 40.8 | 23.3 | 22.4 | 27.6 | 26.2 | 11.1 | |
| Elementa analysis (%) | Carbon | 61.7 | 62.3 | 56.4 | 68.9 | 77.7 | 69.6 | 69.9 | 84.3 |
| Hydrogen | 0.88 | 0.54 | 1.02 | 0.95 | 1.03 | 0.75 | 0.96 | 0.87 | |
| Oxygen | 1.39 | 1.68 | 1.81 | 1.45 | 1.14 | 1.51 | 1.16 | 0.43 | |
| Nitrogen | 0.45 | 0.24 | 0.58 | 0.57 | 0.56 | 0.53 | 0.54 | 0.46 | |
| Sulfur | 0.62 | 0.04 | 0.90 | 0.82 | 0.00 | 0.00 | 0.76 | 0.23 | |
| Components * (%) | SiO2 | 49.1 | 48.7 | 48.2 | 43.8 | 44.5 | 44.4 | 49.3 | 42.8 |
| Al2O3 | 21.5 | 21.1 | 22.7 | 21.9 | 20.9 | 19.3 | 21.4 | 22.7 | |
| Fe2O3 | 11.1 | 8.45 | 11.0 | 17.5 | 15.6 | 11.7 | 10.2 | 13.7 | |
| K2O | 9.28 | 10.2 | 10.5 | 7.37 | 9.43 | 11.1 | 10.8 | 8.42 | |
| TiO2 | 5.70 | 5.15 | 5.16 | 5.00 | 6.76 | 6.80 | 6.09 | 9.30 | |
| CaO | 2.09 | 4.81 | 1.30 | 2.41 | 1.80 | 4.74 | 1.54 | 2.19 | |
| MgO | 0.33 | 0.93 | 0.31 | 0.38 | 0.35 | 0.70 | N.D | N.D | |
| P2O5 | N.D | 0.32 | 0.25 | 0.39 | 0.38 | 0.29 | 0.29 | 0.65 | |
| SO3 | 0.80 | 0.37 | 0.50 | 1.12 | N.D | 0.68 | 0.28 | N.D | |
| MnO | 0.12 | N.D | N.D | 0.14 | 0.15 | 0.12 | N.D | N.D | |
| ZrO2 | N.D | N.D | 0.11 | N.D | 0.15 | 0.11 | 0.11 | 0.16 | |
| SrO | N.D | N.D | N.D | N.D | N.D | 0.09 | N.D | N.D | |
| sum | 100.0 | 100.0 | 100.0 | 100.0 | 100.0 | 100.0 | 100.0 | 100.0 | |
| Sample ID | SBET (m2/g) | VTotal (m3/g) | VMicro (m3/g) | VMeso (m3/g) | VF_Meso * (%) | Activation Yield (%) | |
|---|---|---|---|---|---|---|---|
| Physical activation ** | Anthracite-H-9-1H | 420 | 0.200 | 0.160 | 0.040 | 20.0 | 83.7 |
| Anthracite-H-9-3H | 600 | 0.360 | 0.200 | 0.160 | 44.4 | 46.0 | |
| Anthracite-H-9-6H | 110 | 0.140 | 0.040 | 0.100 | 71.4 | 21.3 | |
| Anthracite-H-10-0.5H | 470 | 0.230 | 0.180 | 0.050 | 21.7 | 79.6 | |
| Anthracite-H-10-1H | 670 | 0.390 | 0.230 | 0.160 | 41.0 | 54.6 | |
| Anthracite-H-10-2H | 9 | 0.030 | 0.000 | 0.030 | 100 | 22.3 | |
| Chemical activation *** | Anthracite-1K-850-3H | 616 | 0.306 | 0.266 | 0.040 | 13.1 | 54.8 |
| Anthracite-2K-850-3H | 963 | 0.421 | 0.386 | 0.036 | 8.55 | 59.1 | |
| Anthracite-3K-850-3H | 1381 | 0.669 | 0.592 | 0.077 | 11.5 | 31.9 | |
| Anthracite-4K-850-3H | 1413 | 0.719 | 0.644 | 0.075 | 10.4 | 21.5 | |
Disclaimer/Publisher’s Note: The statements, opinions and data contained in all publications are solely those of the individual author(s) and contributor(s) and not of MDPI and/or the editor(s). MDPI and/or the editor(s) disclaim responsibility for any injury to people or property resulting from any ideas, methods, instructions or products referred to in the content. |
© 2023 by the authors. Licensee MDPI, Basel, Switzerland. This article is an open access article distributed under the terms and conditions of the Creative Commons Attribution (CC BY) license (https://creativecommons.org/licenses/by/4.0/).
Share and Cite
Kim, S.; Lee, S.-E.; Baek, S.-H.; Choi, U.; Bae, H.-J. Preparation of Activated Carbon from Korean Anthracite: Simultaneous Control of Ash Reduction and Pore Development. Processes 2023, 11, 2877. https://doi.org/10.3390/pr11102877
Kim S, Lee S-E, Baek S-H, Choi U, Bae H-J. Preparation of Activated Carbon from Korean Anthracite: Simultaneous Control of Ash Reduction and Pore Development. Processes. 2023; 11(10):2877. https://doi.org/10.3390/pr11102877
Chicago/Turabian StyleKim, Seokhwi, Sang-Eun Lee, Seung-Han Baek, Uikyu Choi, and Hyo-Jin Bae. 2023. "Preparation of Activated Carbon from Korean Anthracite: Simultaneous Control of Ash Reduction and Pore Development" Processes 11, no. 10: 2877. https://doi.org/10.3390/pr11102877
APA StyleKim, S., Lee, S.-E., Baek, S.-H., Choi, U., & Bae, H.-J. (2023). Preparation of Activated Carbon from Korean Anthracite: Simultaneous Control of Ash Reduction and Pore Development. Processes, 11(10), 2877. https://doi.org/10.3390/pr11102877