Abstract
The surge is a typical aerodynamic instability phenomenon in the compression system, which can lead to serious consequences such as engine performance degradation and structural damage. A deep understanding of the surge process can support the development of a compressor with a wider operating range. In this paper, an experimental study was carried out and high-responding pressure sensors were used to obtain the aerodynamic instability process and the post-surge characteristics of an axial–centrifugal compressor at design and off-design speeds. The evolution of the flow field and instability behavior before and after the surge were analyzed. The results showed that the inlet temperature change can reflect the aerodynamic instability to some extent, and as the operating condition moves from the choke to surge boundary, the inlet temperature undergoes a sudden increase at a certain condition and further increases with the decrease in mass flow rate. At the design speed, the instability of the combined compressor featured a deep surge with an obvious rotating stall behavior before its inception, and the amplitude of the stall cell was gradually enhanced, finally leading to the surge. At the off-design speed, affected by the stage mismatching, the axial stage mainly worked near the unstable operating condition. Therefore, the compressor successively experiences two modes of mild surge and deep surge, and the rotating stall can also be observed during the surge cycle.
1. Introduction
Aerodynamic instability is one of the key concerns in compressor design, and rotating stall and surge are two typical instability phenomena. The former is characterized by high-frequency and small-amplitude circumferential pressure pulsations, which mainly cause the reduction of isentropic efficiency and blade fatigue. In contrast, the latter is mainly characterized by the reverse flow in the mainstream, which results in rapid performance degradation and even engine shut-down. What is worse, the reverse flow during the surge can cause structural damage. The serious consequences of the aerodynamic instability mean it is always a key point in academic research and engineering practice. Researchers want to deeply understand the instability process and mechanism, which plays an important role in suppressing the instability and proposing better measures. Therefore, many studies have been conducted in the past 70 years [1]. However, as the demand changes, the performance requirements of the compressor are getting higher and higher, and the loading of the blade gradually increases, so the internal flow in the blade passages becomes more complicated. Currently, it is still challenging to clearly understand or predict the aerodynamic instability of a new compressor [1].
Aerodynamic instability is related to the structure of the compressor. According to the configuration, it can be divided into axial, centrifugal, and axial–centrifugal combined compressors. Due to the different physical structures and work processes, their unstable flow field also has a large difference. In addition, the aerodynamic instability of the compressor is also highly correlated with the pipe system. The compressor exhibits various instability processes with different piping characteristics [2] and also has different surge boundaries [3], so the pipe system must be considered in the engine design process. When the downstream pressure increases up to a certain value, almost every compressor would enter the surge condition, which will be the main aerodynamic instability phenomenon focus in this paper.
The study of phenomena usually originates from experimental observations. The early study of the surge can be traced back to the work of Emmons [4] in the last century, who found the phenomenon of the surge in experiments and made some descriptions from the perspective of the noise characteristics, which can be as low as 1 Hz. The compression system undergoes a huge vibration. In order to reveal the cause of this phenomenon, Emmons [4] analyzed the flow characteristics at different locations during the surge process using a hot-wire technique to measure the flow parameters, such as velocity at different locations. Due to the difficulty of obtaining detailed flow fields by testing techniques and the expensive cost, the causes and influencing factors of the phenomena in the tests need to be analyzed with the aid of theories. Greitzer [5] established a typical lumped parameter model, which takes the characteristics of the whole compression system into account, and the model captures the main flow features of the surge. In addition, B parameter was proposed for analyzing different aerodynamic instability processes. Furthermore, Spakovszky [6] developed and extended the model to capture the rotating stall. With the development of CFD algorithms and computational power, Vahdati [7] and Ghimire [8] used their algorithms to simulate the 3D flow field of the axial compressors, obtaining detailed flow processes and explain some of the flow instability mechanism. 3D CFD plays an important role in analyzing some special cases, such as inlet distortions [9]. Vo [10] also summarized two conditions for blade instability through three-dimensional CFD simulation: the interface between the inlet flow and the tip leakage flow overflows the leading edge of the blade, and the backflow occurs at the trailing edge to the pressure surface of the adjacent blade. Full three-dimensional models are usually accompanied by time-consuming calculations, especially some higher precision algorithms [11], which are difficult to apply to engineering applications and are reasonable for the scientific research.
Another widely used configuration is the centrifugal compressor, mainly used for small mass flow rates and high-pressure ratios, such as turbochargers. The work done by centrifugal force makes it have more unstable phenomena, which are not found in axial compressors. Hansen [12] applied the lumped parameter model to the centrifugal compressor and successfully simulated the dynamic characteristics of the surge. However, the empirical coefficients, such as the hysteresis factor, are not the same as that in the axial compressors. Since the centrifugal compressors used in turbochargers suffer from speed fluctuations, Fink [2] further introduced inertia equations into this model to capture the speed fluctuations. Three-dimensional CFD calculations have also been widely used in centrifugal compressors [13], especially for some components, such as the diffuser [14] and the impeller [15]. Sundström [16] employed compressible large eddy simulations (LES) to explore the generation mechanisms of rotating stall and surge. The flow field of tip leakage flow and how it influences the instability is exposed. Galindo [17] investigated the influence of compression system characteristics on surge behavior by building a one-dimensional (1D) aerodynamic model for the ducting system. The predictive results showed good agreement with the experiment. Several other experiments were also performed to show the effects of different pipe systems on post-surge behaviors [18]. Dehner [19,20] also investigated the mild surge and deep surge by the one-dimensional engine simulation code, of which the results show good agreement with the experimental results available in the literature. His code also took the pipe system into consideration, which has a deep impact on the instability process. As described above, the surge is characterized by one-dimensional features, so a 1D aerodynamic model has the capability to simulate the surge. Compared to the axial compressor, the centrifugal compressor suffers from both the same instability phenomena, such as rotating stall, mild surge, and deep surge, and different instability phenomena, such as the two-regime-surge, which is currently reported only in the centrifugal compressors [4,21]. This phenomenon is that the compressor first undergoes the mild surge, then exits the unstable conditions, and finally enters the deep surge again.
In addition to the two commonly used configurations, another one is the combined compressor, which is the core component in turboshaft engines and large-power industrial equipment. Past research mainly focused on axial or centrifugal compressors. However, the aerodynamic behavior of the combined compressor under different operating conditions is still unclear, so more work should be done on such kind of compressor [22]. In this paper, an experimental investigation was carried out based on a one-stage axial and one-stage centrifugal combined compressor. The dynamic data were obtained by high-responding transducers, and then its spatial and temporal characteristics were analyzed.
2. Experimental Setup
2.1. Case Description
The object of this paper was an axial–centrifugal combined compressor (1A1C) consisting of one axial stage (1A) and one centrifugal stage (1C). 1A1C had the vaned radial diffuser (VD), and the volute was used to collect the high-pressure air discharged from the diffuser outlet. Its three-dimensional structural diagram and the meridional view are shown in Figure 1, and the other key geometrical parameters of this compressor are shown in Table 1. As 1A1C must enter the surge several times during the test, it retains a large tip clearance for the safety reason.
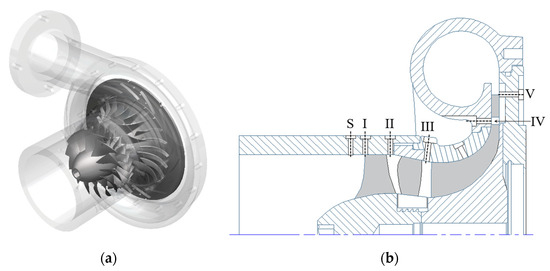
Figure 1.
Structure features of 1A1C. (a) 3D model, (b) meridional view of 1A1C, I, II, III, IV, V, S denote different streamwise positions.

Table 1.
Geometrical parameters of 1A1C.
2.2. Test Rig
The structure of the test rig is shown in Figure 2. High-pressure gas (up to 600 kPa) can reach 650 °C after combustion. High-temperature and high-pressure gas (Gas1) is expanded by a turbine, which drives the compressor. The gas is discharged into the atmosphere through the downstream pipe system (Gas2). For the compressor, the inlet was the atmospheric condition (Gas3), and the outlet used a throttling valve to provide the back pressure. The operating point of the compressor was moved by closing the valve step by step. The high-pressure gas (Gas4) was discharged through the pipe system to the outside. The intermediate body between the compressor and the turbine was fed with cooling water to minimize the effect of the heat transfer inside the turbine on the performance of the compressor. A straight pipe was installed upstream and downstream of the compressor for uniform flow. The parameters of the compression system are in Table 2. Steady pressure and temperature sensors were installed at the inlet and outlet of the compressor for measuring the steady-state performance. Temperature sensors at the inlet and outlet were PT100 with a measurement error of 0.55 K and 1.8 K, respectively. The outlet pressure sensor had a measurement error of 0.25% of full-scale output (FSO). The compressor inlet was equipped with a flowmeter for measuring the steady-state mass flow rate, and the measurement error of its wall static pressure sensor was 0.1%. In addition, in order to study the sound and vibration characteristics of the compressor during the instability process, microphones were arranged around the test rig to record the acoustic characteristics, and acceleration sensors were arranged on the intermediate body to measure the vibration signal.
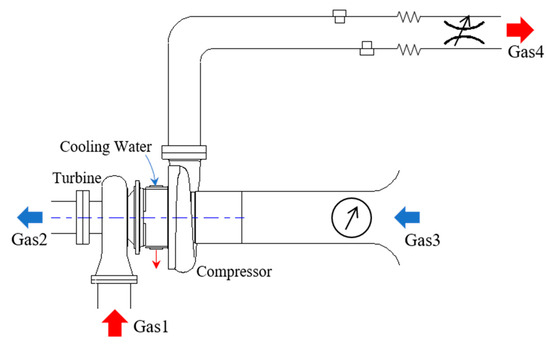
Figure 2.
Schematic diagram of the test rig.

Table 2.
Parameter of the compression system.
In order to obtain the dynamic process, more than 20 fast-responding Kulite pressure transducers were fitted on the casing wall. Based on the evaluation of pressure and temperature, two series of dynamic pressure sensors, XTE-140(M) and XTEH-10L-190(M) series, were selected for the transient pressure measurement in the low-temperature region and the high-temperature region, respectively. The parameters of two types of sensors are shown in Table 3. The streamwise probes distribution is shown in Figure 1b, where the R1 leading edge, the interface between R1 and S1, the interface between S1 and IMP, the interface between IMP and VD, and VD outlet are marked as I~V, respectively. S denotes the position upstream of section I, and two T-type thermocouples are arranged at section S for measuring the temperature. The circumferential distribution of the pressure probes in each section is shown in Figure 3. The voltage signals generated by the dynamic probes were transmitted to the data acquisition system, which is the Dewesoft SIRIUS-STGM+ device in the test. The throttling valve is a stepping valve, and the minimum step length was used when it is close to the surge boundary. Figure 4 shows the sign when the surge occurs, where Figure 4a indicates that after the occurrence of the deep surge, the obvious pressure pulsation can be observed from the timing diagram. Figure 4b is the real-time FFT of the pressure signal, and the occurrence of the low-frequency component is the sign of the surge.

Table 3.
Parameter of Kulite transducers.
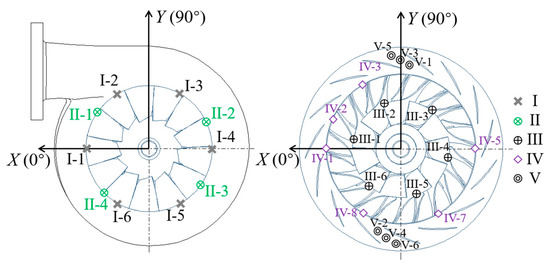
Figure 3.
Distribution of Kulite transducers at each section.
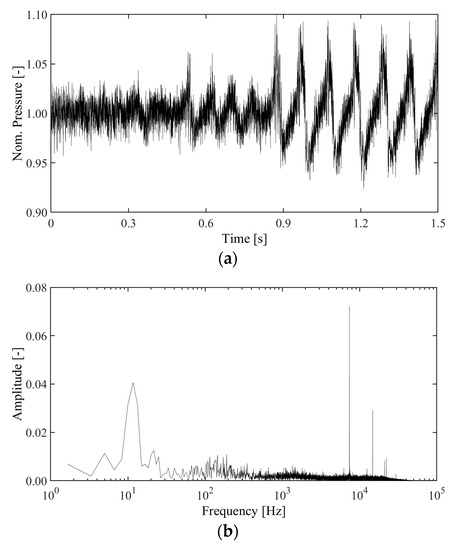
Figure 4.
Real-time pressure signal analysis. (a) Pressure time history, (b) pressure frequency spectrum.
In the test, there were many factors leading to the uncertainty of the data measurements. The first one comes from the error of the transducers, which has been described in Table 3. The combined non-linearity, hysteresis, and repeatability was 0.5% full-scale output (FSO). The pressure transcoders were fast-responding but have a larger pressure absolute value error. However, we focused more on the trend of the transient history, and all these data were normalized. Therefore, this error has little influence on the analysis. In addition, this test was conducted on the turbocharger rig, and the compressor was driven by the turbine. It had the shaft speed oscillation, and the maximum amplitude was about tens of revolutions, about 0.1% of the design speed. Generally, it was ignored in the turbocharger experiment. According to the above analysis, although there are some uncertainties, the data process and results are reliable.
3. Steady Map
The MAP of 1A1C is shown in Figure 5. Four speed lines, 50%, 70%, 90%, and 100% of the design speed (Nd), are demonstrated. The horizontal and vertical axes are the normalized mass flow rate and total pressure ratio, respectively. To further analyze the characteristics of different components, Figure 6 shows the pressure rise characteristics at different sections, where the y-axis is the average static pressure divided by the total pressure at the compressor inlet. Figure 6a,b show the pressure rise characteristics at sections II and III, representing the characteristics of the axial rotor and the whole axial stage. At the design speed, the pressure rise line of the axial stage undergoes a shift from a negative to positive slope as the valve closes. In this process, the slope change of the R1 characteristic is earlier than that of the whole axial stage, indicating that S1 suppresses the instability of the axial stage to some extent. At 90% Nd, the line slope of R1 and 1A is positive in a wider range of mass flow rates, where the axial stage has been already operating on the instability characteristic near the surge. As for the 50% Nd and 70% Nd, although the characteristic line shows a negative slope, it does not mean that the axial stage works stably. Generally, the front stage is more likely to surge for a multi-stage compressor due to the matching between different blade rows. It should be noted that at low off-design speeds, the characteristic lines of the axial rotor, and the axial stage in Figure 6a,b re-exhibit a negative slope, which can not fully represent that the characteristics of the two components. This is because the data in the plots are based on the static pressure probes, which are fitted on the casing wall, and are not the area-averaged or mass-averaged values of the section. The flow processes inside the axial stage at low off-design speeds will be analyzed in the next section based on the measured data and the literature. However, 1A1C can still work normally at this off-design speed because of the strong workability of the downstream centrifugal stage.
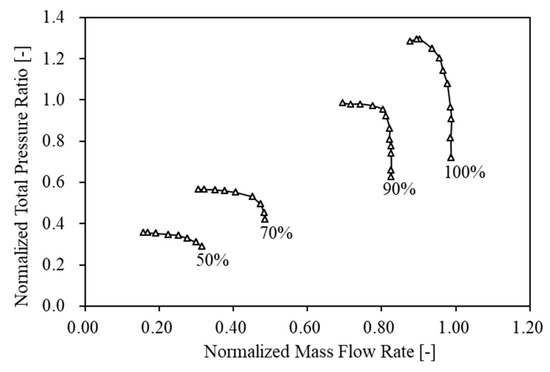
Figure 5.
Map of 1A1C.
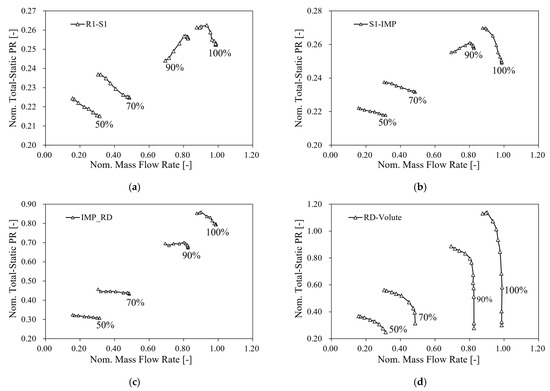
Figure 6.
Total-static pressure ratio. (a) R1-S1 (Section II), (b) S1-IMP (Section III), (c) IMP-RD (Section IV), (d) RD-volute (Section V).
Figure 6c,d show the total-static pressure ratio at sections IV and V, respectively. At 100% Nd, the pressure characteristics at sections III, IV, and V change from negative to positive almost simultaneously. At 90% Nd, within four operating points close to the surge boundary, the pressurizing capacity of R1 and S1 decreases significantly. However, the impeller still has strong pressurization capability, so the pressure at the impeller outlet does not show a significant drop. Meanwhile, the diffuser also can continue to pressurize, so the static pressure at the VD outlet is higher. With the increase of downstream backpressure, the shock wave in the diffuser passages gradually disappears, and the mass flow rate decreases. When it works near the surge boundary, the pressurizing ability of the diffuser is also further developing. Therefore, although the static pressure at the impeller outlet does not change very much near surge condition, the pressurizing effect of the diffuser still makes its pressure at the compressor outlet continue to rise. A similar instability exists at the other two speeds.
As the downstream valve closes, the flow separation occurs. According to the classical stall theory [4], when the flow separation develops to some extent, the choked passage causes the blockage of the adjacent passage and then forms the rotating stall cells. In the centrifugal compressor, the separation flow can develop into two modes: the circumferentially distributed reverse region and the traditional rotating stall at the impeller tip. The occurrence of the reverse flow or stall cells greatly increases the friction losses in the airflow, reduces the work capacity of the compressor, and improves the temperature at the reverse area. For a conventional centrifugal compressor, a stable reverse bubble exists at the leading edge of the impeller when it works near the surge boundary. In order to verify whether a similar phenomenon exists at the inlet of 1A1C, two thermocouples are arranged at the inlet position of the compressor (section S in Figure 1b). The temperature variations at this position under different operating conditions are shown in Figure 7. At 50% Nd, the inlet temperature increases gradually with the decrease of mass flow rate, indicating the development of a reverse bubble. The maximum temperature increase is about 30 K from the choke to the near surge condition. At 70% Nd, the inlet temperatures near choke conditions remain basically unchanged, and with the decrease of mass flow rate, there is a clear break point, after which the temperature increases rapidly. The temperature variation reaches about 50 K. At 90% Nd and 100% Nd, the inlet temperature remains almost constant and nearly equal to the atmospheric temperature. According to the experimental results shown in Figure 7, at 50% Nd and 70% Nd, the obvious features have appeared based on the temperature signal. According to Li [22], the main structure of this feature is shown in Figure 8; i.e., there is a uniform reverse region at the R1 tip area, but the mainstream does not have large-area reverse. Therefore, for the combined compressor at some off-design speeds, even if an axial stage exists upstream of the centrifugal stage, the flow instability characteristics are similar to the single-stage centrifugal compressor.
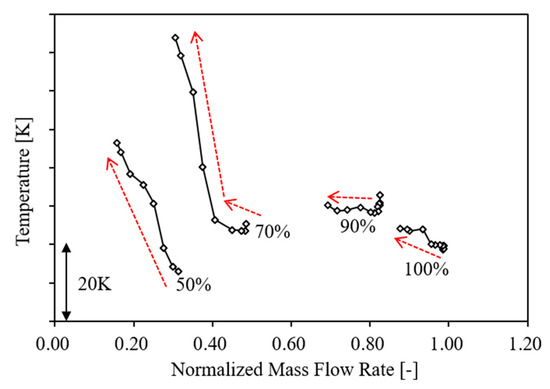
Figure 7.
Temperature at the compressor inlet (Section S).
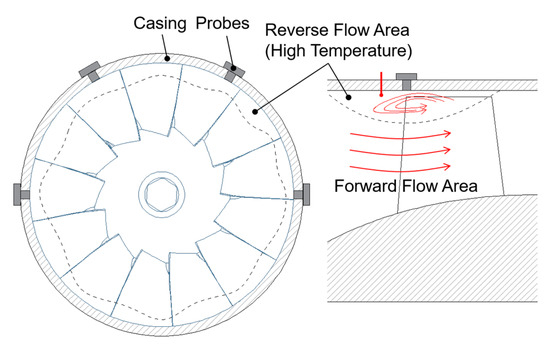
Figure 8.
Flow schematic at R1 tip.
4. Discussion
The AMP of each stage was presented in the previous section, and in this section, the instability process and surge characteristics of 1A1C at design and off-design speeds will be further analyzed based on the acquired high-frequency dynamic data.
4.1. Design Speed
The MAP at the design speed is shown in Figure 9, where P1 is the choke point, while P2–P4 and NS are four points gradually closer to the surge boundary. It is noted that DS denotes the deep surge condition, in which the data recorded by the steady-state sensor has low credibility due to the unsteadiness in the surge cycle.
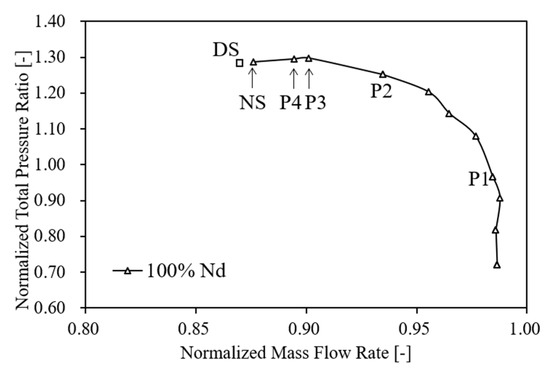
Figure 9.
Steady MAP at design speed.
4.1.1. Instability Behavior Prior to Surge
Figure 10 shows the frequency spectrum from P1 to NS at the R1 tip I-1 and impeller tip III-1. With the gradual decrease of the valve opening, neither of the two locations showed significant low-frequency signals. No significant unstable signals were found by further analyzing the data at other locations. When the valve was closed to an opening smaller than the NS point, the compressor experienced a deep surge. Therefore, at the design speed, the instability process of 1A1C is a direct entry into the deep surge. It is more likely to suffer more unstable phenomena according to the lumped parameter model [5] when 1A1C works at the off-design speed because of a lower B value.
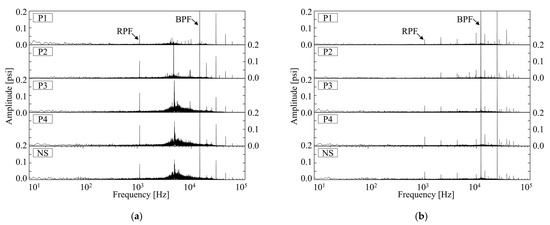
Figure 10.
Pressure frequency spectrum from P1 to NS. (a) Position I-1, (b) Position III-1.
4.1.2. Flow Behavior in Surge Condition
Surge is usually considered as a one-dimensional unsteady flow along the streamwise direction [5], so one circumferential probe among all is selected as the representative of the section when analyzing the surge characteristics. When further closing the outlet valve after the NS point, the compressor comes into a deep surge, which is the DS point labeled in Figure 9. The measures are taken to exit the unstable condition once the surge occurs for safety reasons. Figure 11 shows the dynamic pressure history at different streamwise positions in a deep surge cycle. In order to show the trend clearly, the raw data were filtered with a moving average method, and the length of the window was 51. Since the compressor in the test is driven by a turbine, the shaft speed fluctuation also exists in the surge. According to Fink [2], the rotational speed fluctuation will prolong the time between two cycles, so the moment when the outlet pressure reaches the pre-surge pressure, it is taken as the end of the surge as in Figure 11; i.e., stages ① to ④ is a complete surge cycle. The horizontal axis of each graph denotes the time in terms of shaft revolutions, and the vertical coordinate denotes the ratio of the average static pressure p to the reference pressure pref, which is defined by Equation (1), where U denotes the tip velocity of the impeller trailing edge, and ρ denotes the atmospheric density. It should be noted that the four stages of surge defined in Figure 11 are different from the definition in classical literature [23]. The definition here is according to the pressure trend and only for convenience to analyze the characteristics of the deep surge.
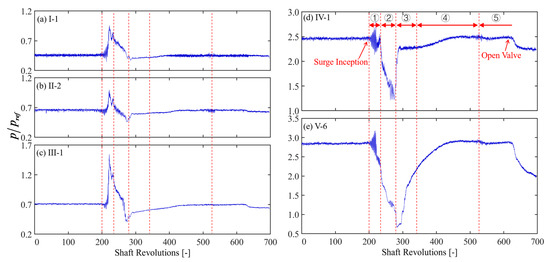
Figure 11.
Pressure history of 1A1C at different streamwise positions.
At the design speed, the sudden pressure increase was first observed at section III. In contrast, the pressure at the impeller outlet decreased slightly, denoting that the reverse happens in the impeller passages. With decreasing pressure at the impeller outlet, the airflow in the vaned diffuser has a larger pressure gradient. Then, the second reverse occurs in the diffuser passages, leading to the pressure at the impeller outlet increasing slightly and the pressure at the diffuser outlet decreasing rapidly, i.e., stage ①. After the collapse occurs, the downstream high-pressure air continues to flow backward, leading to the pressure in the volute, and the downstream piping system continues to decrease until p = 0.7pref or so, i.e., stage ②. When the outlet pressure decreases to the minimum value, the direction of the airflow changes from backward flow to forward flow. Meanwhile, the operating point moves quickly to the choke point, and the compressor recovers its workability. From now on, the pressure of each section inside the compressor as well as the downstream piping system increases continuously, i.e., stage ③ and stage ④. As mentioned above, the compressor has speed fluctuations, so there will be a stable interval between two cycles, i.e., stage ⑤, when the valve is opened to avoid the next deep surge. The following content will give more detail concerning the deep surge at the design speed.
The pressure history at different streamwise locations at the onset of the surge is shown in Figure 12. Figure 12a represents the time history of three circumferential probes at section I, which are evenly distributed. Before the onset of the surge, significant pressure pulsation occurs at each circumferential location, and there is a significant phase lag between two adjacent probes, as shown by the green dashed line in the figure. This frequency of 684 Hz is 61.2% of the rotor passing frequency (RPF), which is consistent with the features of the rotating stall. The green dashed line in the figure indicates that the pressure fluctuation experienced one cycle after 360 degrees, indicating the number of the stall cell is one. Similarly, Figure 12b demonstrates the pressure signals at section II, from which the same signals as that in section I are present, so that S1 suffers from a similar stall phenomenon. The circumferential probe distribution is shown in Figure 13, where the I-1 and II-1 probes are located inside the same R1 passage. The cross-correlation results of these two probes are shown in Figure 14, which proves that the signal of I-1 lags about 0.5 revolutions behind the signal of II-1, so the stall cells at different blade rows are not synchronized along the streamwise direction.

Figure 12.
Time history at Section I and II. (a) Section I, (b) Section II.
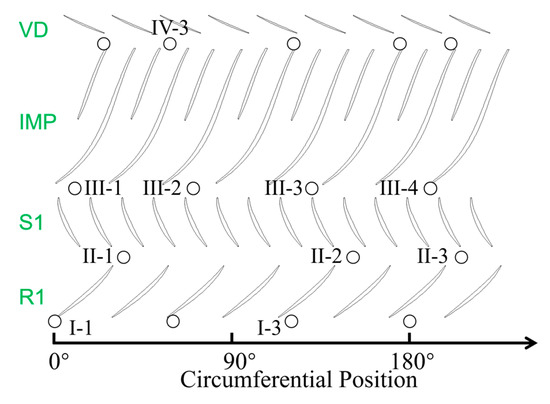
Figure 13.
Probes distribution at Sections I, II, III, and IV.
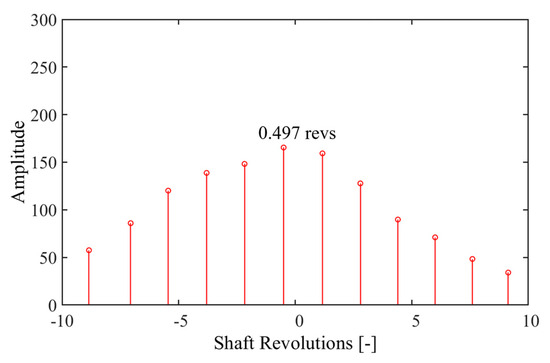
Figure 14.
Cross-correlation results of I-1 and II-1.
The pressure history of the centrifugal stage during the above period is shown in Figure 15. Figure 15a,b represent the pressure at the impeller inlet (Section III) and diffuser outlet (Section V). Each one has two circumferential measurement probes. Similar to the axial stage, at the onset of the deep surge, the centrifugal stage also has stall cells appearing. After FFT calculation, its frequency is 674 Hz, basically the same as the frequency of the previous stall. V-1, V-3, and V-5 in Figure 15c indicate the pressure history of three probes inside the diffuser passage from the leading edge to the trailing edge, respectively. The amplitude of pressure pulsation at each position becomes larger and larger before entering the surge. Then, a sudden pressure rise is observed at the leading edge of the diffuser, which is the sign of reverse flow. Meanwhile, the pressure at the upstream locations increases to its maximum value, and the stall cells disappears rapidly. After the reverse occurs, there is still a pressure fluctuation inside the diffuser passages, as shown in Figure 15b,c, and this frequency is 663 Hz, which is very close to the above frequency. There is also a phase difference along the circumferential direction, which indicates that the rotating stall is also generated inside the diffuser after the occurrence of the surge. The traditional theory of stall formation applies to the forward flow. In contrast, the formation mechanism of the stall cells observed in this paper in the reverse flow needs to be further investigated in the future.
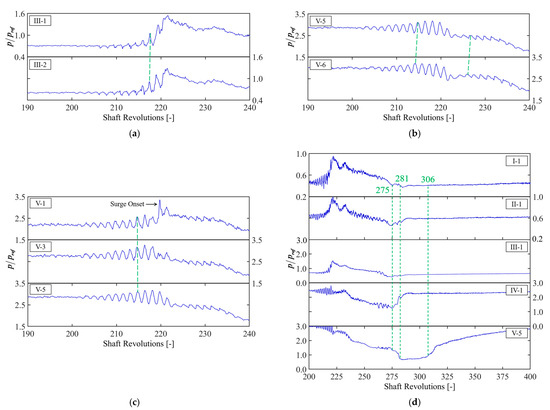
Figure 15.
Time history at different positions. (a) Section III, (b) Section V, (c) inside the diffuser passage, (d) different streamwise positions.
1A1C experienced a complex flow process in the short time before the occurrence of the surge. However, when the reverse flow was fully formed, the pressure at each position decreased, mainly showing the one-dimensional and streamwise characteristics. Figure 15d shows the pressure history during the surge, and the downstream high-pressure gas was completely discharged at 275 rev. Then, the airflow became positive, and the pressure at section IV and the upstream position grew rapidly. Due to the sudden increase of mass flow rate, the back pressure at the diffuser outlet is very low, so the shock wave occurs in the diffuser passage, in which the flow field is similar to that of the choke condition. From 275 rev to 281 rev, the pressure of probe V-5 continues to decrease because a negative attack angle was generated at the leading edge of the vaned diffuser [22], and the VD has a weak workability. With the positive increase of mass flow rate, the downstream pressure increases continuously. However, due to the existence of the shock wave, the information concerning downstream back pressure can not be transferred to the upstream components, so the operating point of the upstream components remains unchanged, i.e., the pressure of these positions, which are upstream to the diffuser, remains constant between 281 rev and 306 rev. After 306 rev, the shock wave gradually becomes weak, and with the increase of the downstream back pressure, the operating point of the each component is further moved from the steady state to the surge boundary until the next surge occurs.
4.2. Off-Design Speed
At 50% Nd, the pressure ratio is lower than higher speeds, making it less destructive. The transient data of many surge cycles was obtained in the test, so this off-design speed was chosen as the representative for analyzing the instability characteristics. Since the stators of 1A1C are not adjustable and there is no bleed, there is a mismatching between the axial and centrifugal stages at the off-design speed, which may lead to more unstable phenomena.
4.2.1. Instability Behavior Prior to Surge
Figure 16 shows the total pressure ratio of 1A1C at 50%Nd, and the five points that were selected for analysis, labeled P1–P4, NS. At this speed, 1A1C is choked at the centrifugal stage, which restricts the mass flow rate of the whole compressor, resulting in the front axial stage operating at near surge conditions. The frequency spectrum of the compressor at the axial rotor I-1 and the impeller tip III-1 from P1 to NS are shown in Figure 17. From Figure 17a, at point P1, a hump appears on the spectrum, which is usually considered as the feature of the rotating instability. This hump disappears as the mass flow decreases; this phenomenon has been analyzed in the literature [22]. As the mass flow rate decreases, the flow field does not become more stable, but a circumferential reverse flow occurs at the axial rotor tip, which has been shown in Figure 8. It is difficult for the probes fixed on the casing wall to perceive the obvious stall, i.e., all the circumferential probes are in the reverse region. Therefore, the negative slope measured by the wall probe cannot represent the average value of this section. Figure 17b shows that an unstable signal with a 100–300 Hz starts to appear from P3, and there is a low-frequency signal of 12 Hz at points P4 and P5. According to the Helmholtz frequency of the compression system and the examination of the timing data, it corresponds to the mild surge of the compressor. When further reducing the valve opening, the compressor enters a deep surge, which will be analyzed in the next part.
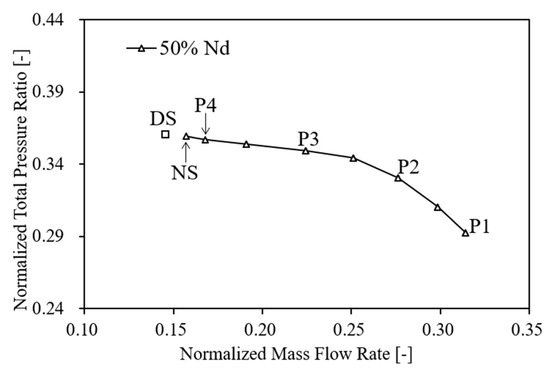
Figure 16.
Steady MAP at 50% Nd.
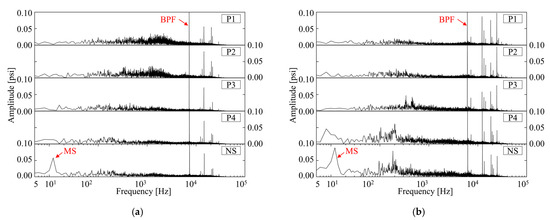
Figure 17.
Pressure frequency spectrum from P1 to NS at 50% Nd. (a) Position I-1, (b) Position III-1.
4.2.2. Flow Behavior in Surge Conditions
The NS operating conditions were analyzed first. Unlike at the design speed, where 1A1C went directly from the steady state to the deep surge, it first went into the mild surge before going into the deep surge at this off-design speed. According to Figure 17b, a mild surge occurred at the NS point in the MAP. The pressure history at different streamwise positions under this condition is shown in Figure 18a, where the dynamic data at axial rotor inlet I-1, impeller inlet III-1, diffuser inlet IV-1, and volute outlet (labeled as Out) are shown. The pressure pulsation at the volute outlet is the clearest after the occurrence of the mild surge. It is not affected by high-frequency disturbances, so this location is more suitable to monitor the surge and obtain the dynamic process when measuring the surge dynamic data.

Figure 18.
Mild surge at 50% Speed. (a) Pressure history, (b) frequency spectrum.
Figure 18b further shows the frequency components corresponding to the pressure signals at these locations. At probe III-1, in addition to the mild surge frequency of 12 Hz, a frequency component of about 184 Hz exists (blue box). There are other forms of instability at the impeller leading edge, and this frequency is 32.7% RPF. The time history of six circumferential probes at the impeller leading edge is further plotted in Figure 19, and there also exists a clear hysteresis, which is consistent with the main feature of the rotating stall. The uniformly distributed probes in the circumferential direction capture a completed stall cycle, so only one stall cell is rotating. Since the front stage becomes unstable first at the off-design speed, the backstage dominates the instability of the combined compressor. Therefore, when the backstage observes the obvious instabilities, the front axial stage has had a worse flow condition. The reverse flow does not happen in the mainstream because of the strong workability of the centrifugal stage.
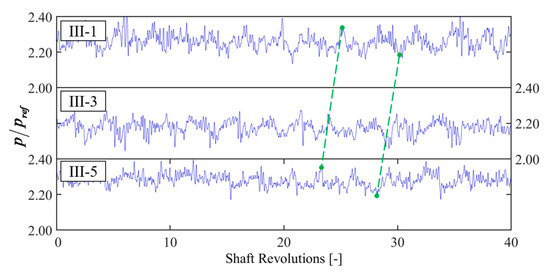
Figure 19.
Pressure history at different circumferential positions.
After further closing the throttling valve, the compressor enters the deep surge, the DS point in Figure 16. Before entering the deep surge, four mild surge cycles occurred, and their amplitude was larger than that in the NS condition. After entering the deep surge, the mainstream inside the compressor has a large-area reverse flow, so there is a sudden increase of upstream pressure, especially at the inlet, instead of a slow change like the mild surge. It can be judged that the frequency of deep surge is 9.9 Hz.
At the peak of the pressure fluctuation, there is another high-frequency oscillation, as shown by the green arrow in Figure 20. Zooming in on this flow is shown in Figure 21a, which shows the pressure pulsation at different circumferential positions. A clear phase lag at different circumferential positions indicates that a rotating stall is generated at the pressure peak. During the first surge cycle, this stall cell rotates for multiple cycles, whereas during the later deep surge cycles, only 1 or 2 revolutions occur in each cycle. In addition, Figure 21b demonstrates its flow distribution pattern. According to Figure 13, IV-3 and III-1 are in the same impeller passage, which is more able to represent the characteristic distribution along the flow direction, so probe IV-3 was chosen to show characteristic of section III. According to the green dotted line in Figure 21b, it can be seen that the stall histories at different streamwise positions are highly synchronized, indicating that the stall cells generated during the surge interact with each other at different streamwise positions and rotate along the circumferential direction synchronously, which is different from rotating stall at the design speed.
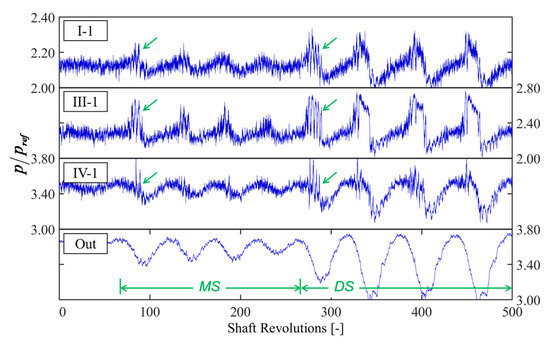
Figure 20.
Pressure history at DS point, 50% speed.
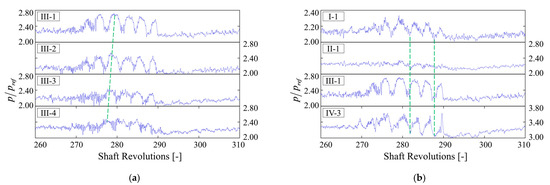
Figure 21.
Pressure history of high-frequency oscillation in the surge cycle. (a) Different circumferential positions at Section III, (b) different streamwise positions.
5. Conclusions
An experimental investigation was carried out on a combined compressor, including one axial and one centrifugal stage. The surge inception and evolution processes were analyzed, and the main conclusions are summarized as follows.
- (1)
- The centrifugal stage dominates the aerodynamic instability of the whole compressor. At the design speed, the axial rotor first operates on the characteristic curve with a positive slope. Then, as the operating condition of the centrifugal stage moves to the instability boundary, the compressor comes into surge. At the off-design speed, because of stage mismatching, even though the axial stage operates on the left branch of the characteristic curve in a wide range of operating conditions, the centrifugal stage continues to maintain the stability of the whole compressor. According to the temperature change near the axial rotor tip, a reverse flow area gradually develops as the operating point moves towards the instability boundary to cause the continuous temperature increment near the axial rotor tip, similar to the flow phenomena featured in the single-stage centrifugal compressor near the surge condition.
- (2)
- At the design speed, the compressor directly enters the deep surge with the decreased mass flow rate. Firstly, the reverse flow successively occurs in the impeller and diffuser, eventually in the mainstream, accompanied by a sudden pressure drop at the outlet and a sudden increase at the inlet. Before the onset of the deep surge, one rotating stall cell can be detected through each blade row with a frequency equal to 61.2% of the shaft rotational speed. When the reverse flow fully develops during the surge cycle, a rotating stall still exists in the diffuser while those in other blade passages vanish.
- (3)
- At the off-design speed, the compressor successively experiences mild and deep surges. During the mild surge, one rotating stall cell can be detected near the leading edge of the impeller with a frequency equal to 32.7% of the rotational speed, and no rotating stall can be observed in other blade rows. The amplitude of the mild surge gets larger until the occurrence of a deep surge with the throttle of the outlet valve. During the deep surge, the rotating stall also appears in each blade row.
This paper gives a detailed analysis concerning the surge process of 1A1C. In the future, more work will be conducted on the influence of the design parameters and pipe system on aerodynamic instability to reveal the flow mechanisms further.
Author Contributions
Experimental investigation and original draft preparation, J.L.; review and editing: B.W.; resources and supervision: X.Z. All authors have read and agreed to the published version of the manuscript.
Funding
This research was funded by the National Major Science and Technology Project of China [grant numbers 2017-II-0004-0016 and J2019-I-0011-0011].
Data Availability Statement
Data available on request due to restrictions eg privacy or ethical. The data are not publicly available.
Acknowledgments
The authors appreciate Shandong FuYuan Turbocharging Co., Ltd. for their support to the experiment of 1A1C.
Conflicts of Interest
The authors declare no conflict of interest.
References
- Day, I.J. Stall, Surge, and 75 Years of Research. ASME J. Turbomach. 2016, 138, 011001. [Google Scholar] [CrossRef]
- Fink, D.A.; Cumpsty, N.A.; Greitzer, E.M. Surge Dynamics in a Free-Spool Centrifugal Compressor System. ASME J. Turbomach. 1992, 114, 321–332. [Google Scholar] [CrossRef]
- Tamaki, H. Effect of Piping Systems on Surge in Centrifugal Compressors. J. Mech. Sci. Technol. 2008, 22, 1857–1863. [Google Scholar] [CrossRef]
- Emmons, H.W.; Pearson, C.E.; Grant, H.P. Compressor Surge and Stall Propagation. Trans. ASME 1955, 77, 455–469. [Google Scholar] [CrossRef]
- Greitzer, E.M. Surge and Rotating Stall in Axial Flow Compressors—Part I: Theoretical Compression System Model. J. Eng. Gas Turbines Power 1976, 98, 190–198. [Google Scholar] [CrossRef]
- Spakovszky, Z.S. Applications of Axial and Radial Compressor Dynamic System Modeling. Ph.D. Thesis, Massachusetts Institute of Technology, Cambridge, MA, USA, 2001. [Google Scholar]
- Dodds, J.; Vahdati, M. Rotating Stall Observations in a High Speed Compressor—Part II: Numerical Study. ASME J. Turbomach. 2015, 137, 051003. [Google Scholar] [CrossRef]
- Ghimire, S.; Turner, M. Detailed Simulations of a Three-Stage Supercritical Carbon Dioxide Axial Compressor with a Focus on the Shrouded Stator Cavities Flow. Processes 2023, 11, 1358. [Google Scholar] [CrossRef]
- Yang, B.; Zhu, G. Impacts of Inlet Circumferential Distortions on the Aerodynamic Performance of a Transonic Axial Compressor. Processes 2023, 11, 2175. [Google Scholar] [CrossRef]
- Vo, H.D.; Tan, C.S.; Greitzer, E.M. Criteria for Spike Initiated Rotating Stall. ASME J. Turbomach. 2008, 130, 011023. [Google Scholar] [CrossRef]
- Watson, R.A.; Tucker, P.G.; Wang, Z.N.; Yuan, X. Towards Robust Unstructured Turbomachinery Large Eddy Simulation. Comput. Fluids 2015, 118, 245–254. [Google Scholar] [CrossRef]
- Hansen, K.E.; Jorgensen, P.; Larsen, P.S. Experimental and Theoretical Study of Surge in a Small Centrifugal Compressor. J. Fluids Eng. 1981, 103, 391–395. [Google Scholar] [CrossRef]
- Li, M.; Li, Y.; Jiang, F.; Hu, J. An Optimization of a Turbocharger Blade Based on Fluid–Structure Interaction. Processes 2022, 10, 1569. [Google Scholar] [CrossRef]
- Lou, F.; Fabian, J.C.; Key, N. Stall Inception in a High Speed Centrifugal Compressor During Speed Transients. ASME J. Turbomach. 2017, 139, 121004. [Google Scholar] [CrossRef]
- Cao, T.; Hayashi, Y.; Tomita, I. Pressure Characteristic Rollover of a Transonic Centrifugal Impeller. In Proceedings of the ASME Turbo Expo 2023, Boston, MA, USA, 26–30 June 2023. [Google Scholar]
- Sundström, E.; Semlitsch, B.; Mihăescu, M. Generation Mechanisms of Rotating Stall and Surge in Centrifugal Compressors. Flow Turbul. Combust. 2017, 100, 1–15. [Google Scholar] [CrossRef] [PubMed]
- Galindo, J.; Serrano, J.R.; Climent, H.; Tiseira, A. Experiments and Modelling of Surge in Small Centrifugal Compressor for Automotive Engines. Exp. Therm. Fluid Sci. 2008, 32, 818–826. [Google Scholar] [CrossRef]
- Galindo, J.; Tiseira, A.; Navarro, R.; Tarí, D.; Meano, C.M. Effect of the Inlet Geometry on Performance, Surge Margin and Noise Emission of an Automotive Turbocharger Compressor. Appl. Therm. Eng. 2017, 110, 875–882. [Google Scholar] [CrossRef]
- Dehner, R.; Selamet, A.; Keller, P. Simulation of Deep Surge in a Turbocharger Compression System. ASME J. Turbomach. 2016, 138, 111002. [Google Scholar] [CrossRef]
- Dehner, R.; Selamet, A.; Keller, P. Simulation of Mild Surge in a Turbocharger Compression System. SAE Int. J. Engines 2010, 3, 197–212. [Google Scholar] [CrossRef][Green Version]
- Zheng, X.; Liu, A. Phenomenon and Mechanism of Two-Regime-Surge in a Centrifugal Compressor. ASME J. Turbomach. 2015, 137, 081007. [Google Scholar] [CrossRef]
- Li, J.; Wen, M.; Wang, B.; Zheng, X. Investigation on the Unsteady Surge Flow Behavior of an Axial-Centrifugal Compressor. In Proceedings of the ASME Turbo Expo 2023, Boston, MA, USA, 26–30 June 2023. ASME Paper No. GT2023-103407. [Google Scholar]
- Cumpsty, N.A. Compressor Aerodynamics; Krieger Publishing Company: Malabar, FL, USA, 2004. [Google Scholar]
Disclaimer/Publisher’s Note: The statements, opinions and data contained in all publications are solely those of the individual author(s) and contributor(s) and not of MDPI and/or the editor(s). MDPI and/or the editor(s) disclaim responsibility for any injury to people or property resulting from any ideas, methods, instructions or products referred to in the content. |
© 2023 by the authors. Licensee MDPI, Basel, Switzerland. This article is an open access article distributed under the terms and conditions of the Creative Commons Attribution (CC BY) license (https://creativecommons.org/licenses/by/4.0/).