Abstract
Lupin is an agriculturally economical plant seed. It is considered a rich source of protein for both humans and animals in several regions of the world. Lupin proteins also could act as an encapsulation agent for vitamins and other nutritional factors after extraction. This research evaluated the effects of microwave and ultrasound extraction methods on sweet and bitter lupin proteins intended to act as encapsulation agents. Two distinct sizes of nanoparticles were detected using different types of treatments. Bitter lupin was optimal for generating large nanoparticles, while sweet lupin was optimum for generating small nanoparticles. Ultrasound treatment of bitter lupin after microwave treatment hydrolyzed some of the β-conglutin, which suggested a method to reduce the potential allergic reactions caused by lupin products. The total phenolic content and alpha-amylase inhibitory effect of sweet and bitter lupin proteins was high. Furthermore, the microwave extraction method showed the benefits of reduced solvent consumption and less time. The current results showed a positive effect of the combined application of ultrasound-assisted and microwave-assisted processes on the nutraceutical and functional properties of lupin protein extracts.
1. Introduction
Lupin (Lupinus) is a legume belonging to the Fabaceae family, an important part of the human lifestyle since the first civilizations. Legumes such as peas, lentils, and chickpeas are still considered a necessary food in different regions worldwide [1]. They can be found in the Mediterranean region and Latin America. There are many types of lupins, each with a different chemical composition [2].
Lupin, a non-starchy grain legume, has only 6% fat, 28% dietary fiber, a good amount of dietary minerals, a good amount of essential amino acids, and higher protein content (40% content), all of which make it an excellent food ingredient [3].
The proteins in a food ingredient attract considerable attention because of their influence on the nutritional quality and function of the final food product. The function of a protein relates to its physicochemical properties, which affect food production decisions due to their influence on the organoleptic and structural properties of the final products [4]. Some of these functional properties include protein foaming, gelling, and solubility. Therefore, lupin’s high protein content makes the legume a perfect candidate for a functional component in food production [5].
To extract protein from lupin seeds, researchers commonly explore three traditional main approaches (micellization (salt extraction), selective fractionation (involves acid extraction), and alkaline extraction. Among these methods, the most frequently used is the alkaline solution with a pH range of 8 to 9 to extract proteins, followed by a refining step using isoelectric precipitation at a pH of 4.5 to 5. This method has been extensively studied and is preferred due to its uncomplicated nature and potential utility in the food sector. However, this strategy can result in the alteration of the protein’s structure, which might affect its functional properties [6,7,8,9]. As a consequence, many studies have recently explored alternative methods such as employing a membrane-based process. In comparison to traditional isoelectric precipitation, ultrafiltration stands out as an effective method for generating lupin protein concentrates with a high protein recovery rate (90% compared to 50% from ultrafiltration and isoelectric precipitation) and significantly enhanced solubility [6,10]. Another technique employed to produce lupin protein isolate involves using a salt-induced extraction method followed by a controlled precipitation process, which is commonly referred to as micellization. Although this method has shown promise in preventing protein structural alterations and irreversible changes, it needs to use a substantial amount of salt, which could pose a significant challenge when attempting to industrialize the process [7,8,11].
Food nanomaterials, such as nanoemulsions composed of oil droplets (droplet size of less than 500 nm), can be usually stabilized by an emulsifying agent [12]. Furthermore, nanoemulsions can have different rheological and stability characteristics due to their different structures and compositions [13]. Nanoemulsions have been used as a substitute for liposomes and vesicles to increase the bioavailability, stability, and solubility of bioactive compounds in the body. They also protect them from environmental conditions such as temperature, pH, light, and moisture [12]. Nanoemulsions have potential applications in the food industry in relation to antimicrobials, flavoring and coloring agents and the delivery of nutraceuticals as well as other physicochemical properties of bioactive compounds in food systems [14]. Therefore, these nanoemulsions have different values of functional and physiochemical properties and allergenicity that need to be investigated to determine the possibility of using these new nanoemulsions in food products [15]. Nanoemulsions can be prepared using surfactants of different kinds, such as synthetic, natural (phospholipids, glycolipids, saponins), polysaccharides, and [16].
Nanoemulsions have several advantages over conventional emulsions, e.g., the preparation of transparent beverages and foods that are physically stability and enhanced bioavailability [17]. However, the application of nanoemulsions is a technology under development, although is already introduced in different food industries because it is a more feasible way to increase several healthier aspects of a food product. Using the technology of nanoemulsion for encapsulating functional compounds can improve the compounds’ bioavailability and delay the decomposition process, which can have a direct positive impact on the shelf life and improve the quality of products [18]. The nanoemulsions maintain the quality and extend the shelf life of king mackerel steaks stored at 20 °C [19], control the food-borne bacteria on fresh lettuce [20], improve fresh orange juice quality [21], and control the stability of vegetable cream and chicken broth [22]. Furthermore, it was proved that nanoemulsions exhibit broad antimicrobial activity against different food pathogens, including bacteria, fungi, viruses, and spores [23]. Oil-in-water-based nanoemulsion is considered a promising technology for encapsulating and stabilizing lipophilic vitamins to prevent common life-threatening diseases [24]. Moreover, nanoemulsions with diameters of less than 60 nm are visually transparent, making them appropriate to be used in foods and beverages since the delivery of colors and flavors in food systems is a very challenging task, which should take into consideration the preservation of volatile molecules, thus emerging as a simple yet efficient solution [25].
The extraction of proteins from raw materials can be achieved via different methods, such as the alkaline extraction/isoelectric precipitation technique, ultrasound-assisted extraction, and enzymatic (protease)-assisted extraction [26]. Lately, there has been increasing interest in reducing environmental pollutants (such as CO2 emission); therefore, finding and developing alternative methods that are sustainable and cost-effective is important. Ultrasound has been used as a green technology for the purpose of cell-wall destruction to release intracellular components based on different mechanisms, such as erosion, fragmentation, and cavitation [27]. Using ultrasound, a process can be completed in a few minutes, with the high efficiency, high purity, and low cost of the final product [28]. On the other hand, the microwave-assisted food process is a green and novel method that can be completed in a shorter time with high reproducibility, lower energy demand, and reduced solvent consumption. The microwave is known as an environmentally friendly process that has economic advantages compared to traditional methods [29]. Microwaves are non-ionizing electromagnetic waves with a frequency located between 300 MHz and 300 GHz [30]. Microwaves provide a rapid, clean, convenient, and cost-effective method for heating, causing a thermal effect by polarizing macromolecules [31]. Microwaves are more environmentally friendly due to the minimal heat losses to the environment because the heating takes place in a closed system [32]. Therefore, the combined microwave–ultrasonic method can improve the extraction process for both the desorption and adsorption of compounds from the food matrix. While the ultrasonic/microwave-assisted process has been widely investigated, the application of this method to the production of edible nanoemulsions in food systems from lupin has not been studied. This study evaluates the effects of microwave and ultrasound extraction methods on lupin’s sweet and bitter protein properties. Thus, this study aims to find a good way to improve the extraction processes that preserve the quality of the nutrients extracted from food that can be used in mass production processes for edible food such as lupin.
2. Materials and Methods
2.1. Materials
In this study, the sweet lupin and bitter lupin proteins were purchased locally (Irbid, Jordan). All the purchased chemicals were of analytical grade. The DPPH (2,2-diphenyl-1-picrylhydrazyl), (+)-catechen hydrate, Folin–Ciocalteu’s phenol reagent, gallic acid, ascorbic acid, aluminum chloride, butylated hydroxytoluene (BHT) and methanol (HPLC grade) were purchased from local sources (Irbid, Jordan).
2.2. Preparation of Lupin Extracts
Modification of the lupin protein emulsifying properties via pH shifting (pH 12) and ultrasonication of the lupin protein was used to study the in-solution microwave digestion. In general, it was reported that when proteins are exposed to highly alkaline or acidic pH conditions, the increase in the ionic strength in the medium results in a partial unfolding of the proteins, also known as a “molten globule (MG)” structure [33]. Three grams of each lupin protein sample (sweet or bitter) was mixed with distilled water (100 mL) and stirred for 30 min (at room temperature). The pH was then adjusted to 12 with 2 M NaOH. Each type of sample (bitter or sweet lupin) was subjected to microwave-assisted digestion (M), a sequence of ultrasonic then microwave treatment (U + M) or vice-versa (M + U).
The ultrasound treatments were conducted using an ultrasound (Sonics & Materials, Inc., Newtown, CT, USA) for 30 min at room temperature at 20 kHz. The generated acoustic energy was delivered to a probe (12.5 mm diameter) placed in the samples. The temperature was controlled through the water jacket connected to the ultrasonic bath.
The treatment with ultrasound was performed using an ultrasonic bath Sonics Vibra-Cell (VC505) (Sonics & Materials, Inc., Newtown, CT, USA). The temperature was controlled through the water jacket connected to the ultrasonic bath.
The microwave-assisted treatment (Milestone Inc., Shelton, CT, USA) consisted of the MAXI-14 High Performance (HP) and high throughput rotor that was designed with double pressure limits and greater capacity than other high throughputs, with an adjustable maximum output power of 800 W. The microwave irradiation duration was 25 min, and the cooling time was 15 min, and then the samples were collected and dried using a freeze-dryer at (−50) °C for 48 h (LFD-5508, Daihan Labtech Co. LTD, Namyangju, Republic of Korea).
After the microwave treatment or dual treatment, the samples were stored in a refrigerator at 4 °C until further analysis. A control (sample without treatment) was used along with the tested samples.
2.3. Phytochemical Properties of Lupin Extracts
2.3.1. Extraction Preparation
The examined extracts were prepared as follows: 0.5 g of sample in 50 mL methanol was stirred for 60 min at 60 °C; then, the extract was filtered using filter paper with a fast speed (101, 125 mm, Hanker International Group, Rizhao, China); the filtrate was made up to 50 mL via the addition of methanol before being stored in the dark for further analysis.
2.3.2. Total Phenolic Content
The total phenol content was determined as described previously by Singleton and Rossi, [34] with slight modifications. Where the Folin–Ciocalteu method was used, 100 microliters of the extract was mixed with 8.4 mL distilled water and 0.5 mL of Folin–Ciocalteu reagent, and it was left at room temperature for 4 min. Then, 1 mL of 5% sodium carbonate solution (5 g/100 mL distilled water) was added and left for 1 h. The absorbance was measured at 725 nm using a spectrophotometer CELL (model CE 1020, Cecil Instruments, Cambridge, UK). The standard curve was prepared by using gallic acid solutions (50 mg 50 mL−1 distilled water) at different concentrations (0, 25, 0.5, 0.75, and 1 mg/mL). The total phenolic content was expressed as milligrams of gallic acid equivalent (mg of GAE/g).
2.3.3. Total Antioxidant Activity
Methanol extracts (500 µL) mixed with 0.2 mL of DPPH solution were brought up to 4 mL with methanol. Then, they were mixed and allowed to stand in the dark for 30 min (room temperature). The absorbance was measured at 515 nm. The antioxidant activity was expressed as a percentage of inhibition according to the following Equation (1):
Inhibition (%) = (Abs. of blank − Abs. of sample)/Abs. of blank × 100
2.3.4. Inhibitory Activity of α-Amylase Enzyme
The inhibitory activity of the α-amylase enzyme of the phenolics compound samples was determined as described previously by McCue et al. [35] with slight modifications. A standard curve was prepared as 0, 0.5, 1.0, 1.5, 2, and 2.5 mL, where 50 mg of porcine pancreatic maltose was mixed with 10 mL distilled water and 1 mL of colorimetric reagent was added, which was prepared as follows (19.8 g sodium hydroxide, 10.6 g of 3 g, 5-dinitrosalicyclic acid (DNS), 7.6 g of phenol, 3.06 g of sodium potassium tartrate and 8.3 g of sodium metabisulfite in 1416 mL of distilled water), and the volume was completed to 10 mL using distilled water. Each tube was covered and heated in a water bath (FALC Instruments, Treviglio, Italy) (100 rpm) at 95 °C for 10 min. The absorbance was measured at 540 nm. Determination of the maltose percentage of the phenolics compound samples was carried out, where 100 µL of each sample was added to 1 mL of calorimetric reagent and 8.9 mL of distilled water was added. The test tubes were covered and boiled in a water bath for 10 min at 90 °C. The absorbance was measured at 540 nm. The determination of the inhibitory activity of the phenolics compound samples was carried out, where 0.1 mL of each sample was added to 0.5 mL phosphate buffer (pH 7) and 0.5 mL α-amylase (30 mg of α-amylase mixed with 100 mL of distilled water), the test tubes were incubated at 25 °C for 10 min in a water bath; then, 0.5 mL of starch (0.5 g of starch dissolved in 50 mL distilled water and stirred at 70 °C) was added. Afterward, the test tubes were incubated at 25 °C for 10 min. Then, 1 mL of colorimetric reagent was added, and the tubes were boiled by using a water bath at 90 °C for 5 min, and 7.4 mL distilled water was added to the tubes. After that, the absorbance was measured at 540 nm. The inhibitory activity of α-amylase was calculated according to Equation (1).
2.4. Particle Size
The volume-weighted mean diameters were measured via dynamic light scattering (DLS) using a Zeta-PAL (zeta potential analyzer) (Brookhaven Instruments Co., Brookhaven, NY, USA). The samples were diluted 500-fold with distilled water before the measurement. The measurement was conducted at a temperature of 23 °C, and the refraction index and liquid viscosity were respectively set according to water (respectively, 1.333 and 0.933 cP).
2.5. Electrophoresis
2.5.1. Sample Preparation
The examined samples were mixed with sample buffer at a 1:1 ratio (5× sample buffer) and boiled for 3 min.
2.5.2. Gradient PAGE
Mini-Protean TGX Precast Gels (BioRad, Hercules, CA, USA) were used for the gradient polyacrylamide gel electrophoresis (gradient PAGE) according to the manufacturer’s instruction manual. It was performed using an electrophoresis cell unit (mini-protean II). The samples were loaded into ready-cast gradient gels in the electrophoresis apparatus and allowed to run using a running buffer (0.025 M Tris, 0.192 M glycine, and 0.1% SDS) at 60 volts, which was gradually increased to 120 volts.
2.5.3. PAGE Staining
Modified Coomassie was used. Briefly, the gel was incubated in a fixing solution that contained 10% v/v acetic acid, 10% v/v methanol, and 40% v/v ethanol (for 1 h). The gel was then transferred to a sensitization solution that contained 1% v/v acetic acid and 10% v/v ammonium sulfate for additional stirring (2 h). The staining solution consisted of 5% v/v acetic acid, 45% v/v ethanol, and 0.125% (w/v) CBB R-250. The gel was then placed into 20 volumes of staining solution and stirred overnight. The gel was transferred to destaining solution I, consisting of 5% v/v acetic acid and 40% v/v ethanol (stirred for 1 h), and then into the destaining solution II, consisting of 3% v/v acetic acid and 30% v/v ethanol, until the background was clear. The gel image was taken using a GS-800 Densitometer and analyzed using Quantity One Software (BioRad, USA).
2.6. Statistical Analysis
The data were expressed as the mean ± standard deviation (SD). All the experiments and analyses were performed in duplicate. The data were analyzed using the procedure of the general linear model (GLM) using the JMP statistical package (JMP Institute Inc., Cary, NC, USA). The means were separated via a least significant difference analysis (LSD) of p ≤ 0.05 values.
3. Results and Discussion
3.1. Chemical Composition
The chemical compositions of the sweet and bitter seeds are shown in Table 1. The results showed that bitter lupin has higher ash and protein percentages than sweet lupin. In addition, the color values are significantly different between them.

Table 1.
Chemical compositions and color values of sweet and bitter lupin flour.
3.2. Antioxidant Activity
The antioxidant activities of sweet and bitter lupin protein treated via microwave and ultrasound are shown in Table 2. Our results showed that sweet lupin results in higher antioxidant activity than bitter lupin whichever the treatment sequence, since sweet lupin has an initial higher antioxidant activity. The extraction method affected the antioxidant activity. Using ultrasound after the microwave treatment significantly decreases the antioxidant activity, while using it before the microwave treatment or as a single treatment does not result in differences from the single treatment with microwave. The antioxidant activity analysis showed that microwave-assisted extraction was better and more effective than the ultrasound extraction method.
Table 2.
Antioxidant activities (% of inhibition) and total phenol contents of sweet and bitter protein samples.
Stevenson et al. [36]) studied the antioxidant activity of oat bran concentrate obtained via microwave-assisted extraction and found that the antioxidant capacity (expressed as l m Trolox) (3.58) was enhanced at 150 °C in 50% ethanol for 10 min. Pinelo et al. [37] reported an antioxidant activity increase as the ethanol or methanol percentage increases in grapes. In addition, Duan et al. [38] used microwave treatment to extract antioxidants (279.96 ± 0.1 µmol g/L) from Chinese bayberry at 80 °C and 15 min, and they found that it increased and could have good potential for recovering bioactive compounds. Mangang et al. [39] reported that antioxidant extraction using the microwave-assisted technique (73.64%) from A. myriophylla bark could be an efficient process that leads to high production of antioxidant activity.
This might be because microwave efficiency is due to localized heating that results in cell rupture due to an increase in cells’ internal pressure. Heat mass and transfer usually take place from inside to outside in MAE, which results in increasing the speed of the solute solubilization [40]. Moreover, Alara et al. [41] reported the important role of microwave irradiation in plant cell wall breakage. This phenomenon can be explained by the liquid rotation and the permanent dipole molecular movement, causing rapid heating of the solvent. This results in a structural change, which allows the easier entry of the solvent into the cellular channels, resulting in higher extraction effectiveness.
As for the samples that were sonicated before or after microwave extraction, the lower antioxidant value may be attributed to the formation of free radicals due to cavitation. In some compounds, cavitation generates the formation of free radicals due to the high temperature and the high energy caused by the probe. It was reported that the area of exposure to the solvent and the cavitation increase when the particle size decreases [42]. This leads to chemical alterations in the vapor phase within the cavitation bubble and in the immediate surrounding fluid [43].
3.3. Total Phenol Content
The total phenol content (TPC) is considered one of the most important antioxidant plant components [44]. Their antioxidant activity is believed to result from their redox properties [45]. The results in Table 2 show that the percentage of the total phenol content of the different treatments of sweet and bitter lupin protein ranges from 15.00 to 61.40%. Our data show that the amount of the total phenolic content varies in the different treatments and within the different types, where bitter lupin protein shows a higher amount than sweet lupin protein. TPC and AA are not correlated (Table 2), which indicates that the antioxidant activity of both lupin samples is not only due to phenolic compounds. Other compounds may be responsible for the additional activity.
Studies concerning the effects of microwave irradiation on the antioxidant activity and phenolic content of lupin protein were found in the literature. Stevenson et al. [36] reported using MAE for evaluating the phenolics content of oat bran concentrate. They reported an enhanced level of extraction in both phenolic compounds and antioxidant capacity when using microwave-assisted extraction. Li et al. [46] and Randhir and Shetty, [47] found that the total phenolic contents of tomatoes and fava beans were in general higher in MAE (7.21%) than that obtained by the conventional solvent method. In addition, Fang et al. [48] showed similar results at 50–70 °C, where they obtained higher yields of phenolic compounds during the MAE from Eclipta prostrata. Sutivisedsak et al. [49] reported an effective method for extracting phenolic compounds from eight types of beans (3.45–39.98 mg/g bean, GAE) using microwave-assisted extraction. They reported that the TPC values were affected by different factors, such as the type of solvent, bean type, and extraction temperature. Dinardo et al. [50] explained this as the mechanisms of dipole rotation and ionic conduction exhibited by MAE. These mechanisms resulted in an overall extraction yield due to a pressure buildup increase inside the cell, which resulted in increased mass transfer due to an increase in cell porosity.
The low values of the phenolic contents in the sonicated samples can be caused by the prolonged sonication that resulted in decreased diffusion rate, diffusion area, and increased diffusion distance, which could lead to a decreased yield of the total phenolic content over prolonged sonication. Therefore, the total phenolic compounds were not related to the extraction yield but depended on the sonication interval [51].
3.4. Alpha-Amylase Inhibitory Activity
The sweet and bitter lupin protein extracts were investigated for their anti-diabetic activity using an α-amylase inhibitory assay. The lowest and highest inhibitory activities were found to be between 83.78 and 69.62% (Table 2). The best specific activity was with sweet and bitter protein that was irradiated by microwave only.
No research has been performed on the microwave-assisted extraction of lupin species and their properties. However, Yuan et al. [52] reported better α-amylase activity with microwave-assisted extraction compared to conventional fractions. Alara and Abdurahman, [53] reported significant differences between the extracts when using the Soxhlet and optimized MAE extraction techniques. They further observed that the extracts obtained via optimized MAE had the highest activity. In addition, Oomah et al. [54] found that the amount of inhibitor and α-amylase inhibition increased significantly in the extract with microwave treatment (by 3-fold, 10-fold, and 33-fold for red, black, and pinto beans and 43, 82, and 200%, respectively). They reported also that microwave-assisted extraction’s contribution to the changes in the α-amylase inhibitory activities of beans was bean cultivar-dependent. Abdennabi et al. [55] reported that microwave-assisted extraction was shown to be a good technology in date palm saps “Lagmi”. It was shown that the MAE samples are rich in alpha-amylase inhibitory activity other than conventional treatments, and also, they mentioned that extracts vary with varieties.
Our results can be explained by what was described by Oomah et al. [54]—that is, the α-amylase inhibitory activity of lupin showed a correlation with the phenolic content. Moreover, the effective α-amylase inhibitory activity is dependent on the total phenolics content. Numerous phenolic compounds and flavonoids were reported as potential antidiabetic agents because they may show a good inhibiting action of α-amylase and could help prevent diabetes [56], whereas for samples treated with ultrasound, it can be explained, as mentioned by Feng et al. [57], that the α-amylase activity was clearly inactivated by ultrasound irradiation, while the decrease in a-amylase may be due to the observed alteration of their secondary and tertiary structures. Furthermore, it was also known that the common trends of enzyme inactivation mostly consist of the formation of aggregates or the irreversible breakdown of molecules into fragments.
3.5. Particle Size of Lupin Protein Particles
The sizes of the soluble lupin protein particles (aggregates) were measured via dynamic light scattering (DLS). The assumption was that the lupin protein generates spherical aggregates. Therefore, the hydrodynamic diameter of a sphere had a similar translational diffusion coefficient as that of the aggregates. As shown in Figure 1, there were two different populations of sizes in each treatment (peak 1 and peak 2). Peak 1 represents the smaller size of protein nanoparticles (less than 110 nm). The average hydrodynamic diameter (nm) of the lupin protein samples is shown in Figure 2. Since the focus was on detecting small amounts of aggregation, the best choice was the intensity distribution, and the polydispersity index in all the samples was <0.1. As illustrated in Figure 2A,B, bitter protein, under all the treatments, generated the smallest sizes compared to the sweet protein. Moreover, no significant changes in sizes the and intensities were measured for the bitter protein samples under the different treatments. In sweet protein, the case was different, as the microwave treatment alone generated the largest size (106 nm) with the highest intensity (25%).
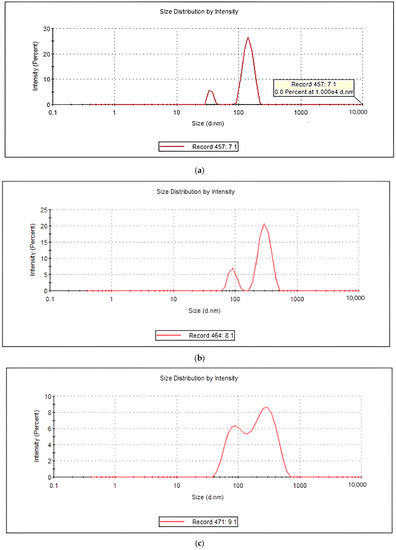
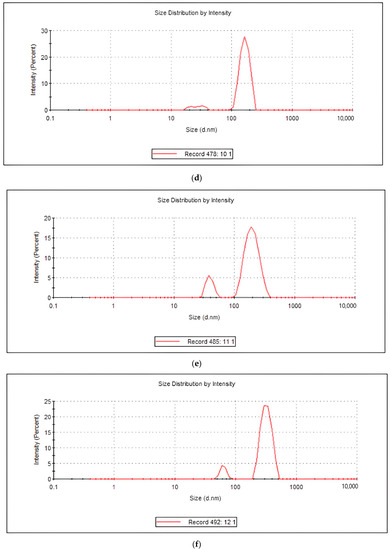
Figure 1.
(a–f): The sizes of the lupin protein isolate samples that were measured via dynamic light scattering: (a) sweet lupine protein isolate (microwave); (b) sweet lupine protein isolate (microwave + sonication); (c) sweet lupine protein isolate (sonication + microwave); (d) bitter lupine protein isolate (microwave); (e) bitter lupine protein isolate (microwave + sonication); and (f) bitter lupine protein isolate (sonication + microwave).
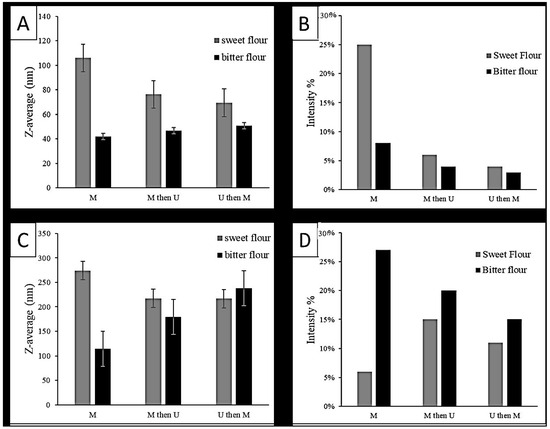
Figure 2.
The mean hydrodynamic diameters and intensities for the lupin proteins (sweet and bitter) under the different treatment (M = microwave, U = ultrasonic): (A,B) represent normal protein size (peak 1), while (C,D) represent the aggregates (peak 2).
Peak 2 contains large nanoparticles or aggregates (more than 110 nm). As shown in Figure 2C,D, the size of the nanoparticles in the bitter protein was in an inverse relationship with the intensity under the different treatments. The intensity decreased as the size increased. This was expected since the intensity of scattering is proportional to the sixth power of the diameter (from Rayleigh’s approximation). Thus, the intensity of the scattering is higher in large nanoparticles. In the sweet protein samples, under the different treatments, no significant changes were observed; however, the highest intensity was observed using the (M + U) treatment.
The DLS results illustrate the variability of the nanoparticles that can be generated from bitter and sweet lupin protein. Bitter lupin was optimal for generating large nanoparticles, while sweet lupin was optimum for generating small nanoparticles. Furthermore, U + M in bitter lupin successfully generated nanoparticles two times bigger than M alone. Subsequently, the sequence of treatment is crucial for the size of nanoparticles.
3.6. Sodium Dodecyl Sulfate-Polyacrylamide Gel Electrophoresis (SDS-PAGE)
To study the type of interaction required to generate the nanoparticles, SDS-PAGE was conducted. As illustrated in Figure 3, the three lanes of the sweet protein samples were identical, which implies that the nanoparticles were destructed to their original size under the reducing condition. Therefore, the type of interaction was primarily hydrophobic, involving hydrogen and disulfide bonds, which can be disturbed using SDS and beta-mercaptoethanol, respectively.
Figure 3.
Sodium dodecyl sulfate-polyacrylamide gel electrophoresis (SDS-PAGE) patterns of different treatments of the sweet and bitter lupin protein samples. Lane 1: sweet lupin (microwave) lane 2: sweet lupin (microwave + sonication); lane 3: sweet lupin (sonication + microwave); lane 4: bitter lupin (microwave); lane 5: bitter lupin (microwave + sonication); and lane 6: bitter lupin (sonication + microwave).
In the bitter protein samples, as shown in Figure 3 (lanes 4, 5, and 6), there are differences. A band at 69 kDa was not present in lane 5. It most likely hydrolyzed to several smaller proteins. That band is expected to be β-conglutins (the major lupin allergen). Therefore, the treatment M + U has the potential to be used to reduce the content of β-conglutins, subsequently reducing the allergy.
In general, microwave-assisted extraction significantly reduces the preparation time and reduces the solvent usage, as radiation breaks down the cell walls, allowing the substances to come into contact with the solvent [58]. On the other hand, a drawback of MAE is the rapid rise in temperature of the extraction mixture, which might stop the extraction process rapidly due to solvent boiling. When the extraction ends early, the desired compounds do not diffuse from the material into the solvent and thus reduce the extraction yield [59,60].
The considerable advantage of probe system ultrasounds is that the extraction process can be optimized in terms of parameters such as time, pressure, and amplitude to guarantee that the structure of the desired molecules is not damaged [61]. However, ultrasound is not a standardized, large-scale technology that could be adjusted at a commercial scale to modify herbs and other foods. Furthermore, phytochemical changes can be caused by the free radicals that are generated by the cavitation caused by the ultrasound shock wave energy. These modifications to phytochemicals are a major challenge for ultrasound technology [62].
4. Conclusions
The growing concern for sustainable and cost-effective methods in various industries has driven increased interest in the exploration of more economical and efficient treatments. This study has detailed the utilization of ultrasonic-assisted extraction (UAE) and microwave-assisted extraction (MAE) techniques for the extraction of bioactive compounds from sweet and bitter lupin proteins, such as the phenolic content, antioxidant activity, and alpha-amylase inhibitory activity. Our research has sought to assess the potential of the microwave and ultrasound extraction methods for sweet and bitter lupin proteins intended as encapsulation agents. Our findings suggest that microwave-assisted extraction exhibits promising effectiveness in the extraction process. Notably, the application of microwave power led to significantly higher phenolic content, antioxidant activity, and alpha-amylase inhibitory activity when compared to the combined extraction method. Furthermore, examination under a scanning electron microscope revealed the existence of two distinct populations of nanoparticles, the characteristics of which were influenced by the type of lupin and the extraction method employed. Bitter lupin was found to be optimal for generating larger nanoparticles, whereas sweet lupin excelled in producing smaller nanoparticles. To further optimize the extraction methods, it is imperative to investigate the interaction effects of various parameters and determine the optimal conditions for both MAE and UAE. Looking ahead, the potential of nanoemulsions holds great promise for the food industry. Nanoemulsions have the capacity to safeguard and encapsulate highly sensitive bioactive compounds, enabling controlled release and targeted delivery. This opens up exciting possibilities for fortifying food products with antioxidants, vitamins, antimicrobial agents, and other valuable components, contributing to the advancement of sustainable and efficient food processing techniques.
Author Contributions
Methodology, M.A.U. and A.A.K.; Validation, M.A. (Malak Angor) and N.A.-R.; Formal analysis, M.A. (Majdi Almahasneh); Investigation, S.G.; Resources, A.A.K.; Data curation, G.M.; Writing—original draft, T.R.; Writing—review & editing, N.A.-R.; Funding acquisition, A.A. All authors have read and agreed to the published version of the manuscript.
Funding
This research was funded by King Saud University, Riyadh, Saudi Arabia, grant number RSP2023R502.
Data Availability Statement
The data are available upon request.
Acknowledgments
The support provided by the Scientific Research Support Fund (Number128-2018) at Jordan University of Science and Technology is appreciated. The authors extend their appreciation to the Researchers Supporting Project (RSP2023R502), King Saud University, Riyadh, Saudi Arabia, for funding this project.
Conflicts of Interest
The authors declare that there are no conflicts of interest regarding the publication of this paper.
References
- Bryant, L.; Rangan, A.; Grafenauer, S. Lupins and health outcomes: A systematic literature review. Nutrients 2022, 14, 327. [Google Scholar] [CrossRef] [PubMed]
- Villarino, C.B.J.; Jayasena, V.; Coorey, R.; Chakrabarti-Bell, S.; Johnson, S.K. Nutritional, health, and technological functionality of lupin protein addition to bread and other baked products: Benefits and challenges. Crit. Rev. Food Sci. Nutr. 2016, 56, 835–857. [Google Scholar] [CrossRef] [PubMed]
- Guemes-Vera, N.; Martinez-Herrera, J.; Hernandez-Chavez, J.F.; Yanez-Fernandez, J.; Totosaus, A. Comparison of chemical composition and protein digestibility, carotenoids, tanins and alkaloids content of wild lupinus varieties protein. Pak. J. Nutr. 2012, 11, 676–682. [Google Scholar] [CrossRef]
- Zayas, J. Functionality of Proteins in Food, 1st ed.; Springer: Berlin/Heidelberg, Germany, 1997; p. 916. [Google Scholar]
- Lo, B.; Kasapis, S.; Farahnaky, A. Lupin protein: Isolation and techno-functional properties, a review. Food Hydrocoll. 2021, 112, 106318. [Google Scholar] [CrossRef]
- Jayasena, V.; Chih, H.J.; Nasar-Abbas, S. In Efficient isolation of lupin protein. Food Aust. 2011, 63, 306–309. [Google Scholar]
- Muranyi, I.S.; Volke, D.; Hoffmann, R.; Eisner, P.; Herfellner, T.; Brunnbauer, M.; Koehler, P.; Schweiggert-Weisz, U. Protein distribution in lupin protein isolates from Lupinus angustifolius L. prepared by various isolation techniques. Food Chem. 2016, 207, 6–15. [Google Scholar] [CrossRef]
- El-Adawy, T.A.; Rahma, E.H.; El-Bedawey, A.A.; Gafar, A.F. Nutritional potential and functional properties of sweet and bitter lupin seed protein isolates. Food Chem. 2001, 74, 455–462. [Google Scholar] [CrossRef]
- Wong, A.; Pitts, K.; Jayasena, V.; Johnson, S. Isolation and foaming functionality of acid-soluble protein from lupin (Lupinus angustifolius) kernels. J. Sci. Food Agric. 2013, 93, 3755–3762. [Google Scholar] [CrossRef]
- Chew, P.G.; Casey, A.J.; Johnson, S.K. Protein quality and physico-functionality of Australian sweet lupin (Lupinus angustifolius cv. Gungurru) protein concentrates prepared by isoelectric precipitation or ultrafiltration. Food Chem. 2003, 83, 575–583. [Google Scholar]
- Muranyi, I.S.; Otto, C.; Pickardt, C.; Koehler, P.; Schweiggert-Weisz, U. Microscopic characterisation and composition of proteins from lupin seed (Lupinus angustifolius L.) as affected by the isolation procedure. Food Res. Int. 2013, 54, 1419–1429. [Google Scholar] [CrossRef]
- Li, J.; Xu, X.; Chen, Z.; Wang, T.; Lu, Z.; Hu, W.; Wang, L. Zein/gum Arabic nanoparticle-stabilized Pickering emulsion with thymol as an antibacterial delivery system. Carbohydr. Polym. 2018, 200, 416–426. [Google Scholar] [CrossRef] [PubMed]
- Odriozola-Serrano, I.; Oms-Oliu, G.; MartÃn-Belloso, O. Nanoemulsion-Based Delivery Systems to Improve Functionality of Lipophilic Components. Front. Nutr. 2014, 1, 24. [Google Scholar] [CrossRef] [PubMed]
- Saini, P.; Kumar, N.; Kumar, S.; Mwaurah, P.W.; Panghal, A.; Attkan, A.K.; Singh, V. Bioactive compounds, nutritional benefits and food applications of colored wheat: A comprehensive review. Crit. Rev. Food Sci. Nutr. 2021, 61, 3197–3210. [Google Scholar] [CrossRef]
- Weiss, D.N.; Brokmann, X.; Calvet, L.E.; Kastner, M.A.; Bawendi, M.G. Multi-island single- electron devices from self-assembled colloidal nanocrystal chains. Appl. Phys. Lett. 2006, 88, 143507. [Google Scholar] [CrossRef]
- Banasaz, S.; Morozova, K.; Ferrentino, G.; Scampicchio, M. Encapsulation of Lipid-Soluble Bioactives by Nanoemulsions. Molecules 2020, 25, 3966. [Google Scholar] [CrossRef]
- Salem, M.A.; Ezzat, S.M.; Salem, M.A.; Ezzat, S.M. Nanoemulsions in Food Industry. In Some New Aspects of Colloidal Systems in Foods; IntechOpen: London, UK, 2018; pp. 31–51. [Google Scholar] [CrossRef]
- Silva, H.D.; Cerqueira, M.Â.; Vicente, A.A. Nanoemulsions for Food Applications: Development and Characterization. Food Bioprocess Technol. 2012, 5, 854–867. [Google Scholar] [CrossRef]
- Joe, M.M.; Chauhan, P.S.; Bradeeba, K.; Shagol, C.; Sivakumaar, P.K.; Sa, T. Influence of sunflower oil based nanoemulsion (AUSN-4) on the shelf life and quality of Indo-Pacific king mackerel (Scomberomorus guttatus) steaks stored at 20 °C. Food Control 2012, 23, 564–570. [Google Scholar] [CrossRef]
- Bhargava, K.; Conti, D.S.; da Rocha, S.R.P.; Zhang, Y. Application of an oregano oil nanoemulsion to the control of foodborne bacteria on fresh lettuce. Food Microbiol. 2015, 47, 69–73. [Google Scholar] [CrossRef]
- Ghosh, V.; Saranya, S.; Mukherjee, A.; Chandrasekaran, N. Cinnamon oil nanoemulsion formulation by ultrasonic emulsification: Investigation of its bactericidal activity. J. Nanosci. Nanotechnol. 2013, 13, 114–122. [Google Scholar] [CrossRef]
- Maté, J.; Periago, P.M.; Palop, A. Combined effect of a nanoemulsion of D-limonene and nisin on Listeria monocytogenes growth and viability in culture media and foods. Food Sci. Technol. Int. Cienc. Tecnol. Aliment. Int. 2016, 22, 146–152. [Google Scholar] [CrossRef]
- Jin, W.; Xu, W.; Liang, H.; Li, Y.; Liu, S.; Li, B. Nanoemulsions for food: Properties, production, characterization, and applications. Emulsions 2016, 3, 1–36. [Google Scholar] [CrossRef]
- Öztürk, B. Nanoemulsions for food fortification with lipophilic vitamins: Production challenges, stability, and bioavailability. Eur. J. Lipid Sci. Technol. 2017, 119, 1500539. [Google Scholar] [CrossRef]
- Singh, H. Scope of nanoemulsions in food industry: A review Harmanjot Singh. Pharma Innov. 2023, 12, 3462–3468. [Google Scholar]
- Hadnađev, M.S.; Hadnađev-Dapčević, T.; Pojić, M.M.; Šarić, B.M.; Mišan, A.Č.; Jovanov, P.T.; Sakač, M.B. Progress in vegetable proteins isolation techniques: A review. Food Feed. Res. 2017, 44, 11–21. [Google Scholar] [CrossRef]
- Chemat, F.; Rombaut, N.; Sicaire, A.G.; Meullemiestre, A.; Fabiano-Tixier, A.S.; Abert-Vian, M. Ultrasound assisted extraction of food and natural products. Mechanisms, techniques, combinations, protocols and applications. A review. Ultrason Sonochem. 2017, 34, 540–560. [Google Scholar] [CrossRef] [PubMed]
- Chemat, F.; Khan, M.K. Applications of ultrasound in food technology: Processing, preservation and extraction. Ultrason. Sonochem. 2011, 18, 813–835. [Google Scholar] [CrossRef]
- Jambrak, A. Application of High Power Ultrasound and Microwave in Food Processing: Extraction. J. Food Process Technol. 2012, 3, e111. [Google Scholar] [CrossRef]
- Letellier, M.; Budzinski, H. Microwave assisted extraction of organic compounds. Analusis 1999, 27, 259–270. [Google Scholar] [CrossRef]
- Gohi, B.; Du, J.; Zeng, H.; Cao, X.; Zou, K. Microwave Pretreatment and Enzymolysis Optimization of the Lotus Seed Protein. Bioengineering 2019, 6, 28. [Google Scholar] [CrossRef]
- Mandal, V.; Mohan, Y.; Hemalatha, S. Microwave assisted extraction—An innovative and promising extraction tool for medicinal plant research. Pharmacogn. Rev. 2007, 1, 7–18. [Google Scholar]
- Jiang, S.; Ding, J.; Andrade, J.; Rababah, T.M.; Almajwal, A.; Abulmeaty, M.M.; Feng, H. Modifying the physicochemical properties of pea protein by pH-shifting and ultrasound combined treatments. Ultrason. Sonochem. 2017, 38, 835–842. [Google Scholar] [CrossRef] [PubMed]
- Singleton, V.L.; Rossi, J.A. Colorimetry of total phenolics with phosphomolybdic-phosphotungstic acid reagents. Am. J. Enol. Vitic. 1965, 16, 144–158. [Google Scholar] [CrossRef]
- McCue, P.; Kwon, Y.-I.; Shetty, K. Anti-amylase, anti-glucosidase and anti-angiotensin converting enzyme potential of selected foods. J. Food Biochem. 2005, 29, 278–294. [Google Scholar] [CrossRef]
- Stevenson, D.; Inglett, G.; Chen, D.; Biswas, A.; Eller, F.; Evangelista, R. Phenolic content and antioxidant capacity of supercritical carbon dioxide-treated and air-classified oat bran concentrate microwave-irradiated in water or ethanol at varying temperatures. Food Chem. 2008, 108, 23–30. [Google Scholar] [CrossRef]
- Pinelo, M.; Rubilar, M.; Sineiro, J.; Nuñez, M.J. A thermal treatment to increase the antioxidant capacity of natural phenols: Catechin, resveratrol and grape extract cases. Eur. Food Res. Technol. 2005, 221, 284–290. [Google Scholar] [CrossRef]
- Duan, W.; Jin, S.; Zhao, G.; Sun, P. Microwave-assisted extraction of anthocyanin from Chinese bayberry and its effects on anthocyanin stability. Food Sci. Technol. 2015, 35, 524–530. [Google Scholar] [CrossRef]
- Mangang, K.; Chakraborty, S.; Deka, S. Optimized microwave-assisted extraction of bioflavonoids from Albizia myriophylla bark using response surface methodology. J. Food Sci. Technol. 2020, 57, 2107–2117. [Google Scholar] [CrossRef]
- Kaderides, K.; Papaoikonomou, L.; Serafim, M.; Goula, A. Microwave-assisted extraction of phenolics from pomegranate peels: Optimization, kinetics, and comparison with ultrasounds extraction. Chem. Eng. Process.-Process Intensif. 2019, 137, 1–11. [Google Scholar] [CrossRef]
- Alara, O.; Abdurahman, N.; Olalere, O. Optimization of microwave-assisted extraction of flavonoids and antioxidants from Vernonia amygdalina leaf using response surface methodology. Food Bioprod. Process. 2018, 107, 36–48. [Google Scholar] [CrossRef]
- Azuola, R.; Vargas-Aguilar, P. Extracción de sustancias asistida por ultrasonido (EUA). Rev. Tecnol. Marcha 2007, 20, 30–40. Available online: https://revistas.tec.ac.cr/index.php/tec_marcha/article/view/449 (accessed on 21 April 2021).
- Anaya-Esparza, L.M.; Velázquez-Estrada, R.M.; Roig, A.X.; García-Galindo, H.S.; Sayago-Ayerdi, S.G.; Montalvo-González, E. Thermosonication: An alternative processing for fruit and vegetable juices. Trends Food Sci. Technol. 2017, 61, 26–37. [Google Scholar] [CrossRef]
- Djeridane, A.; Yousfi, M.; Nadjemi, B.; Boutassouna, D.; Stocker, P.; Vidal, N. Antioxidant activity of some algerian medicinal plants extracts containing phenolic compounds. Food Chem. 2006, 97, 654–660. [Google Scholar] [CrossRef]
- Zheng, W.; Wang, S. Antioxidant Activity and Phenolic Compounds in Selected Herbs. J. Agric. Food Chem. 2001, 49, 5165–5170. [Google Scholar] [CrossRef] [PubMed]
- Li, H.; Deng, Z.; Wu, T.; Liu, R.; Loewen, S.; Tsao, R. Microwave-assisted extraction of phenolics with maximal antioxidant activities in tomatoes. Food Chem. 2012, 130, 928–936. [Google Scholar] [CrossRef]
- Randhir, R.; Shetty, K. Microwave-induced stimulation of L-DOPA, phenolics and antioxidant activity in fava bean (Vicia faba) for Parkinson’s diet. Process Biochem. 2004, 39, 1775–1784. [Google Scholar] [CrossRef]
- Fang, X.; Wang, J.; Hao, J.; Li, X.; Guo, N. Simultaneous extraction, identification and quantification of phenolic compounds in Eclipta prostrata using microwave-assisted extraction combined with HPLC–DAD–ESI–MS/MS. Food Chem. 2015, 188, 527–536. [Google Scholar] [CrossRef]
- Sutivisedsak, N.; Cheng, H.; Willett, J.; Lesch, W.; Tangsrud, R.; Biswas, A. Microwave-assisted extraction of phenolics from bean (Phaseolus vulgaris L.). Food Res. Int. 2010, 43, 516–519. [Google Scholar] [CrossRef]
- Dinardo, A.; Brar, H.; Subramanian, J.; Singh, A. Optimization of microwave-assisted extraction parameters and characterization of phenolic compounds in Yellow European Plums. Canad J. Chem. Eng. 2018, 97, 256–267. [Google Scholar] [CrossRef]
- Annegowda, H.V.; Anwar, L.N.; Mordi, M.N.; Ramanathan, S.; Mansor, S.M. Influence of sonication on the phenolic content and antioxidant activity of Terminalia catappa L. leaves. Pharmacogn. Res. 2010, 2, 368–373. [Google Scholar] [CrossRef]
- Yuan, Y.; Zhang, J.; Fan, J.; Clark, J.; Shen, P.; Li, Y.; Zhang, C. Microwave assisted extraction of phenolic compounds from four economic brown macroalgae species and evaluation of their antioxidant activities and inhibitory effects on α-amylase, α-glucosidase, pancreatic lipase and tyrosinase. Food Res. Intern. 2018, 113, 288–297. [Google Scholar] [CrossRef]
- Alara, O.; Abdurahman, N. Anti-diabetic activity and mineral elements evaluation of Vernonia amygdalina leaves obtained from Malaysia. J. Res. Pharm. 2019, 23, 514–521. [Google Scholar] [CrossRef]
- Oomah, B.; Kotzeva, L.; Allen, M.; Bassinello, P. Microwave and micronization treatments affect dehulling characteristics and bioactive contents of dry beans (Phaseolus vulgaris L.). J. Sci. Food Agric. 2013, 94, 1349–1358. [Google Scholar] [CrossRef] [PubMed]
- Abdennabi, R.; Gaboriaud, N.; Ahluwalia, V.; Tchoumtchoua, J.; Elgheryeni, A.; Leandros Skaltsounis, A.; Gharsallah, N. Microwave-Assisted Extraction of Phenolic Compounds from Date Palm Saps (Phoenix dactylifera L.) and Their Antioxidant, Antidiabetic and Antibacterial Activities Evaluation. Mathews J. Diabetes Obes. 2017, 2, 1–6. [Google Scholar]
- Orhan, I.; Aslan, S.; Kartal, M.; Şener, B.; Başer, K.H. Inhibitory effect of Turkish Rosmarinus officinalis L. on acetylcholinesterase and butyrylcholinesterase enzymes. Food Chem. 2008, 108, 663–668. [Google Scholar] [CrossRef]
- Feng, H.; Barbosa-Canovas, G.; Weiss, J. Ultrasound technologies for food and bioprocessing. In Ultrasound in Enzyme Activation and Inactivation; Mawson, R., Gamage, M., Terefe, N.S., Knoerzer, K., Eds.; Springer: New York, NY, USA, 2010; pp. 369–404. [Google Scholar]
- Zhu, Z.Y.; Dong, F.; Liu, X.; Lv, Q.; Yingyang; Liu, F.; Chen, L.; Wang, T.; Wang, Z.; Zhang, Y. Effects of extraction methods on the yield, chemical structure and anti-tumor activity of polysaccharides from Cordyceps gunnii mycelia. Carbohydr. Polym. 2016, 140, 461–471. [Google Scholar] [CrossRef] [PubMed]
- Hiranvarachat, B.; Devahastin, S. Enhancement of microwave-assisted extraction via intermittent radiation: Extraction of carotenoids from carrot peels. J. Food Eng. 2014, 126, 17–26. [Google Scholar] [CrossRef]
- Nguyen, V.T.; Vuong, Q.V.; Bowyer, M.C.; Van Altena, I.A.; Scarlett, C.J. Microwave-Assisted Extraction for Saponins and Antioxidant Capacity from Xao Tam Phan (Paramignya trimera) Root. J. Food Process. Preserv. 2017, 41, e12851. [Google Scholar] [CrossRef]
- Panda, D.; Manickam, S. Cavitation Technology—The Future of Greener Extraction Method: A Review on the Extraction of Natural Products and Process Intensification Mechanism and Perspectives. Appl. Sci. 2019, 9, 766. [Google Scholar] [CrossRef]
- Gouda, M.; El-Din Bekhit, A.; Tang, Y.; Huang, Y.; Huang, L.; He, Y.; Li, X. Recent innovations of ultrasound green technology in herbal phytochemistry: A review. Ultrason. Sonochem. 2021, 73, 105538. [Google Scholar] [CrossRef]
Disclaimer/Publisher’s Note: The statements, opinions and data contained in all publications are solely those of the individual author(s) and contributor(s) and not of MDPI and/or the editor(s). MDPI and/or the editor(s) disclaim responsibility for any injury to people or property resulting from any ideas, methods, instructions or products referred to in the content. |
© 2023 by the authors. Licensee MDPI, Basel, Switzerland. This article is an open access article distributed under the terms and conditions of the Creative Commons Attribution (CC BY) license (https://creativecommons.org/licenses/by/4.0/).