1. Introduction
China has made a commitment to reach the peak of carbon dioxide emissions prior to 2030 and attain carbon neutrality by 2060. In light of this, the Central Economic Work Conference has emphasized the need for expedited measures to develop an action plan that facilitates the achievement of emission peaking [
1]. There is a need for intensified efforts to enhance the restructuring of the energy composition and energy utilization within the coal-fired power sector. According to recent data, it is projected that by the conclusion of 2022, the installed capacity of coal-fired units assembly will represent approximately 52.8% of the overall installed capacity of power generation in China. Furthermore, the installed capacity of cogeneration units is anticipated to exceed 46% of the installed capacity of a coal-fired unit assembly [
2]. Nevertheless, the implementation of a flexible operation mechanism in coal-fired power units can potentially lead to a decline in performance and an increase in energy consumption. Furthermore, optimizing the energy performance of these units through various technical reconstruction projects has become a challenging task in the present times [
3]. Hence, the coal-fired power industry has witnessed rapid development in the optimization of the energy performance of operating units. This optimization aims to assess the energy efficiency status and identify any degradation in performance [
4]. A crucial aspect of identifying the state of energy efficiency involves the determination of the benchmark value section within the energy efficiency status index.
There exist multiple methods of establishing the benchmark of variables in order to assess the degradation of unit performance. In their study, Wang et al. [
5] utilized exergy-based methodologies to establish the benchmark state for energy consumption, taking into account different operational boundaries. Fan et al. [
6] employed sophisticated exergy-based methods to effectively identify the modules that exhibited performance degradation. Lee et al. [
7] proposed a comprehensive and efficient method based on exergetic and exergoeconomic analysis. This method enables the precise identification of malfunctioning components and the quantification of the impact caused by multiple anomalies. Nevertheless, the utilization of the exergy-based approach presents challenges in terms of computational complexity and its applicability in the identification of operating conditions. The suitability of the unit operating under a flexible operation mechanism is determined by the designed parameters [
8].
Over the past few years, a significant volume of historical data has been accumulated within the plant-level monitoring information system (SIS) of the power plant unit. These data encompass the actual operational condition of the unit, as well as information regarding equipment parameters. Consequently, these data serve as a foundation in conducting data mining activities aimed at establishing benchmark values for energy efficiency. The utilization of substantial quantities of data has facilitated the emergence of the data-driven methodology for the identification of performance deterioration [
9]. In recent times, a number of data mining techniques have been employed to enhance the efficiency of power plants, yielding favorable outcomes [
10]. Xu et al. [
11] introduced a data-driven approach aimed at determining the reference values of independent variables. This methodology enables operators to effectively minimize the heat consumption rate by accounting for variations in key indexes. Tsoutsanis et al. [
12] introduced a derivative-driven algorithm that integrates adaptive regression analysis with the moving window methodology. The objective of this algorithm is to predict the expected value of the performance degradation indicator. Wang et al. [
13] introduced a benchmark for the optimization of the operations of direct air-cooled combined heat and power plants. This benchmark is founded on the utilization of dynamic data mining technology. Zhao et al. [
14] created a comprehensive replica of the physical space in a digital environment. The objective of their research was to uncover the reference values of controllable operating parameters related to heat consumption in the context of typical load conditions. The aforementioned studies establish a benchmark as a invariable factor in order to maximize the performance. However, when considering the identification of the energy efficiency state, it is crucial to acknowledge that the benchmark should be a variable section that is subject to change based on the prevailing operating conditions, rather than a fixed value. The benchmark value section pertains to the limits of the energy efficiency status index during periods of normal performance. Furthermore, cogeneration units possess a distinctive operational mechanism that sets them apart from the majority of coal-fired units, thus warranting further discussion. Based on the aforementioned studies, it is imperative to categorize the operational parameters and establish a benchmark value for mining activities when conducting an analysis to optimize energy efficiency.
This study presents a methodology that utilizes the data mining technique to establish the benchmark value section of the energy efficiency status index for cogeneration units. The objective is to accurately identify any performance degradation in these units. The determination of the benchmark value section is accomplished through the application of the Gaussian mixture model (GMM), a commonly employed data-driven technique. This entails the estimation of historical data in relation to various operational circumstances, such as the unit load, ambient temperature, and extraction heating flow.
The present paper is structured in the following manner. The methodology proposed to identify the state of energy efficiency is outlined in
Section 2. The case study in
Section 3 focuses on a subcritical cogeneration unit with a capacity of 320 MW. The findings and analysis are presented in
Section 4.
Section 5 presents several conclusions.
2. Materials and Methods
The presented interval estimation method is intended to clean historical data and detect the steady state. The presented GMM includes the classical expectation maximum (EM) algorithm, which determines the benchmark value section.
2.1. Description of Online Monitoring Methodology for Cogeneration Unit Efficiency
The fundamental concept underlying this online monitoring methodology is to ascertain the benchmark value section of cogeneration units’ efficiency states for various operating conditions. To accomplish this objective, the suggested approach is partitioned into the subsequent four stages.
- (1)
Historical data cleaning and steady-state detection—The massive historical data need to be cleaned and detected for subsequent data analysis. Therefore, a sliding window is employed to clean the historical data and detect the steady state.
- (2)
Division of the operating conditions—To transform a global problem into a portion problem, equal interval division is used for the classification of the operating conditions.
- (3)
Identification of the benchmark value section—Deep clustering is employed to estimate the benchmark value section of the energy efficiency state according to the similarity.
- (4)
Identification of the energy efficiency state—After the benchmark value section is identified for every operating condition, real-time data are introduced and evaluated to investigate whether data are outside the benchmark value section. When data outrange is detected, the efficiency state of the cogeneration unit can be evaluated as degradation.
The flow chart of the proposed methodology is shown in
Figure 1.
2.2. Historical Data Cleaning and Steady-State Detection
The operation state of the unit can generally be divided into the startup/shutdown and the operation periods. Because the unit parameters will change sharply during the startup and shutdown periods, and these periods are not long-term operating conditions, considering the energy efficiency state of the unit is unnecessary. Therefore, historical data cleaning is a prerequisite. In addition, excessive real-time performance will inevitably lead to a lack of sufficient data for each performance evaluation or performance calculation to eliminate the influence of randomness. This is not helpful in monitoring and analyzing the energy efficiency state of the unit. Simultaneously, the energy efficiency state of the unit exhibits a gradual change. Therefore, the necessary steady-state detection is essential.
The unit can intuitively distinguish the startup/shutdown period and the operating period by monitoring the changing trend of the load. Owing to the demand for stable combustion of the boiler, generally, few units operate at 20% or below load for a long time. Therefore, historical data cleaning can limit the unit load to clean the data. By setting a limit to 20% of the designed load, all the data below 20% of the designed load are regarded as the data of the startup and shutdown periods of the unit and are cleaned.
Table 1 lists the four key variables of the steady energy efficiency state based on ASME PTC6 for the detection of the steady state [
15]. The unit is operating under a steady state when these four key variables are relatively stable.
Using the load as an example, the discrimination method can be described as follows:
where
is the measured value of the load at time
t,
is the real-time value of the load at time
t,
is the rate of change of the load, and
is the random error of the load, which follows a normal distribution. The difference between a steady state and unsteady state is whether the load response rate is 0 [
16].
The estimation value of
can be expressed as
where
is the load difference between two adjacent times. For
, the expectation of
is
, which leads to
.
where
is the sample size in a given time window. Then,
can be estimated by the mean of this sample. To ensure the reliability of the estimation, the interval estimation method is used as follows:
where
and
are two statistics at a given confidence level
. The real value of
is probably within the confidence interval of
. Consequently, in cases where the interval does not encompass the value of 0, it is postulated that the unit load is in a state of unsteadiness throughout the specified duration. Similarly, the method of determination for the other three key variables is the same. When all four key variables are in a steady state, the unit is said to be in a steady state.
2.3. Classification of the Operating Conditions Based on Equal Interval Division
Even in the steady state, boundary conditions have an impact on the operational efficiency of the unit. To reduce the difficulty of evaluating the energy efficiency state of the unit and isolate the influence of boundary conditions, the steady-state data are divided into operating conditions. The two most important characteristic variables are the unit load and ambient temperature. Extraction heating flow is another important characteristic variable for cogeneration units when the unit is under heating conditions. In this study, the unit load and ambient temperature were chosen for pure condensing conditions, and the unit load and extraction heating flow were chosen for heating conditions.
Using equal interval division for condition classification, the variation ranges of the unit load, ambient temperature, and extraction heating flow must be identified. The calculations based on equal interval condition division are shown in Equations (5) and (6).
where
is the division of the pure condensing condition;
is the division of the heating condition;
and
are the minimum and maximum ambient temperatures, respectively;
and
are the minimum and maximum unit loads, respectively;
and
are the minimum and maximum extraction heating flows, respectively; and
,
, and
are the division intervals for the ambient temperature, unit load, and extraction heating flow, respectively.
2.4. Benchmark Value Section Determination Using GMM
The energy efficiency state value corresponds to the minimum heat consumption time that the unit can actually achieve under the current operating boundary conditions, reflecting the optimal operating level of the unit. To more accurately calculate the economic losses resulting from unit deviation and effectively identify operational and energy consumption weaknesses, it is imperative to obtain the baseline value of the efficiency status index correctly.
The GMM algorithm combines the advantages of parametric and nonparametric estimation methods and is not limited to a specific probability density form. However, it can approximate any continuous distribution with arbitrary accuracy if there are enough submodels. In this study, the GMM algorithm is used to cluster the sample data under a single operating condition based on the similarity. One or more clusters are then selected as the benchmark sample according to the predefined selection criteria. Subsequently, the probability density distribution is estimated to determine the benchmark value section.
The parameter estimation of the GMM algorithm utilizes the classical EM algorithm. EM is an iterative algorithm used for the parameter estimation of probability models that involve hidden variables. It iteratively determines the parameter values that maximize the likelihood, whose objective function is shown in Equation (7).
where
is the variable,
is the number of the sample,
is the weight coefficient of the submodel
K, and
is the probability density function of the
kth submodel.
The physical meaning corresponding to the number of GMM algorithm submodels is the number of unit state categories. To determine the number of submodels of the GMM algorithm, the AIC evaluation criteria are selected. The AIC evaluation criterion is based on the concept of entropy, which provides an evaluation method that balances the complexity of the model and quality of the fitting data. Its definition is shown in Formula (8) as follows:
where
represents the log-likelihood function of the model. As the quantity of submodels is augmented, the complexity of the model also escalates. In the case of
, the complexity initially diminishes and subsequently rises. The sample number when
decreases to the minimum is chosen as the optimal number of submodels for the GMM algorithm.
The data samples under different clustering groups of the GMM algorithm are compared. A group of data with the lowest average heat consumption is then selected as the benchmark sample. Subsequently, its probability density distribution is estimated to determine the benchmark value section of the energy efficiency state.
3. Data Preprocessing
To validate the results of the GMM model for benchmark value section determination, a set of historical data are used. Here, the historical data are subjected to a process of cleaning, wherein only the steady-state data are retained. The steady-state data of the cogeneration unit should be divided into two distinct periods: the heating condition and the pure condensation condition. Subsequently, the generalized method of the GMM model can be employed to derive the benchmark value section for the cogeneration unit in each of these periods.
3.1. Data Sources and Introduction
In this study, a 320 MW subcritical cogeneration unit in Hebei Province of China is taken as the research object. The N320-16.7/537/537-type steam turbine, manufactured by Dongfang Steam-Turbine Co., Ltd. (Deyang, China), is used. The unit underwent retrofitting in 2015, incorporating perforated steam extraction for heating. The rated extraction heating steam flow rate of each unit is 220 t/h, making it a representative case study of a typical cogeneration unit.
The historical data of the unit in the Supervisory Information System (SIS) are selected for analysis. The data are selected from January 2019 to December 2019 at a sampling frequency of 1 min, with a total of 525,600 groups of data.
3.2. Historical Data Cleaning and Steady-State Detection
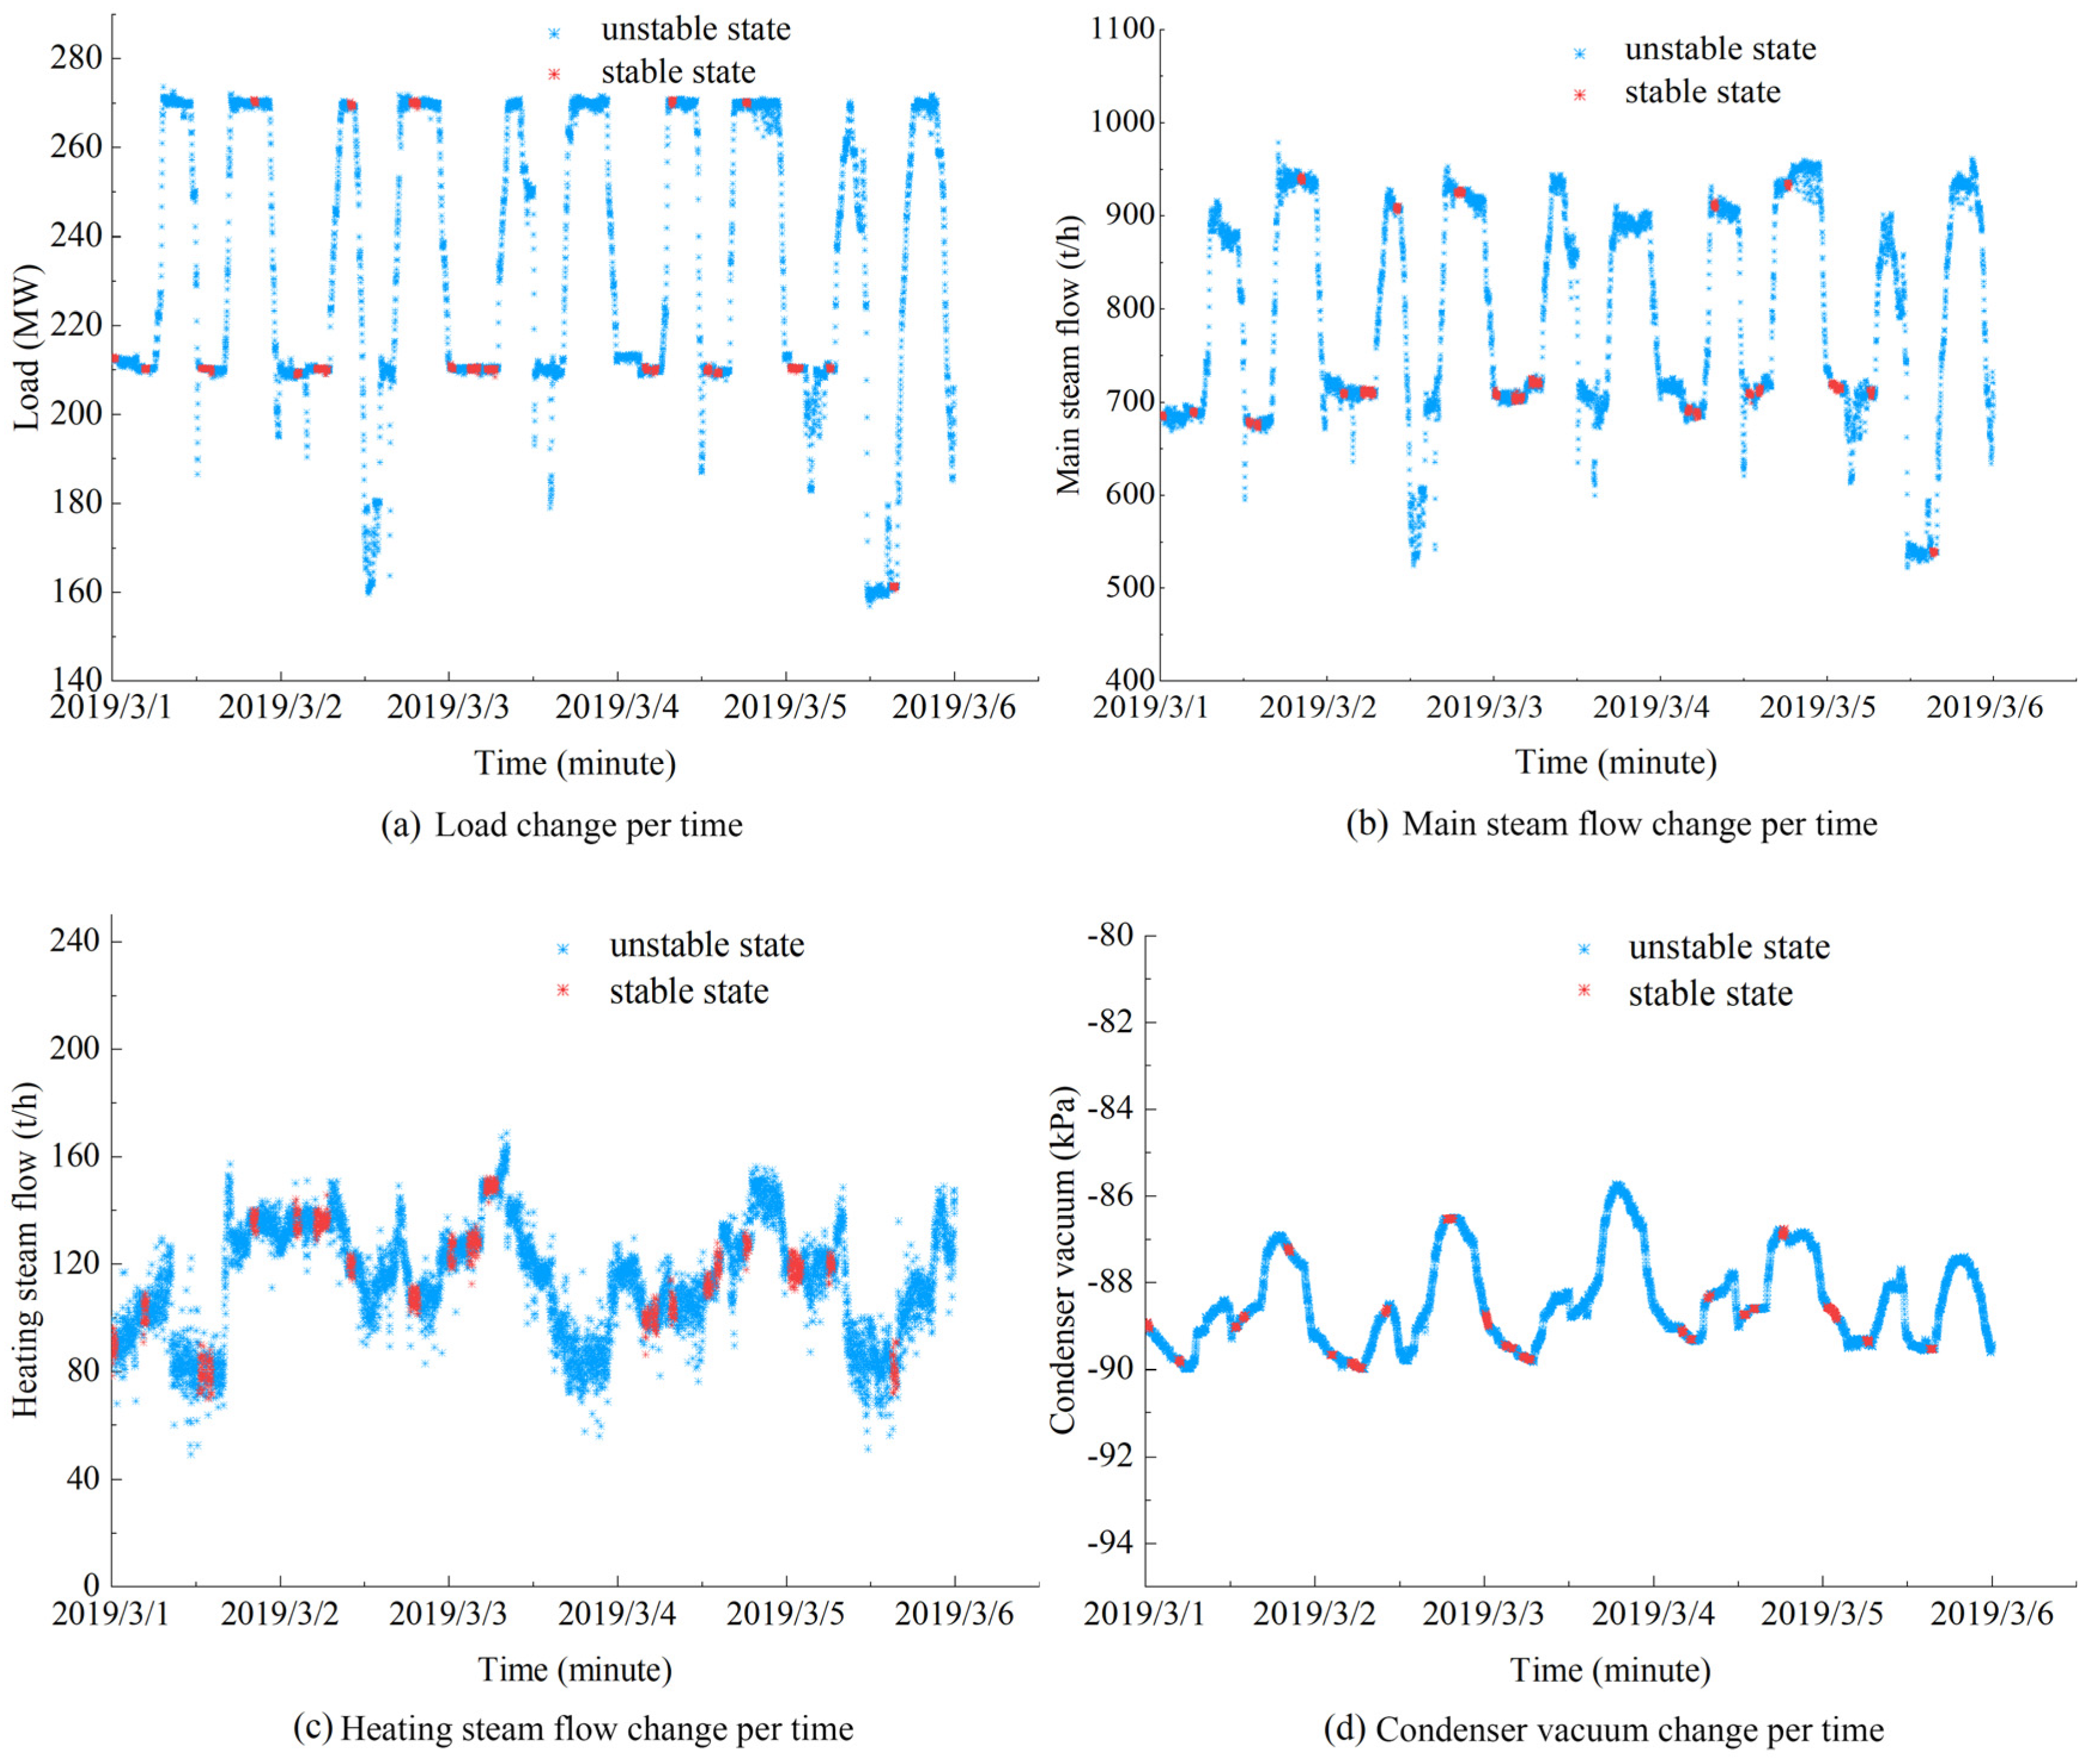
To set a limitation of 20% of the designed load, all data points below 20% of the designed load are considered representative of the startup and shutdown periods of the unit and are subsequently filtered out. After this process, a total of 373,131 groups of data remain.
For the identification of steady-state conditions, the difference between four key variables at adjacent times is used as the defining characteristic. A sliding window of length 30 and a significance level of 0.05 are employed. Following steady-state detection, 154,526 groups of steady-state operating condition samples are retained, resulting in a steady-state detection ratio of 29.4%. A total of 7200 groups of typical data are selected to compare the results after steady-state detection, as shown in
Figure 2.
As depicted in
Figure 2, the inclusion of non-stationary data can occur if solely the load parameter is utilized as the criterion to determine the steady state. In the context of cogeneration units, the accurate representation of steady-state data is contingent upon the simultaneous attainment of all four parameters in a steady-state condition. However, the availability of such data is severely restricted, necessitating the accumulation of a substantial volume of historical data for comprehensive analysis.
3.3. Classification of the Operating Conditions
During the heating period, the cogeneration unit operates flexibly. According to the statistics of historical data, the variation range of the unit load is between 100 and 320 MW and the variation range of the heating flow is between 20 and 240 T/h. A total of 240 operating conditions exist after combination. The number of steady-state samples in each operating condition is counted, and 196 effective operating conditions are obtained.
Figure 3 visually shows the sample density of the 196 operating conditions in the heating period. During a typical year’s historical operation, the cogeneration unit most often operates in the operating condition range with a load in the range of 210–220 MW and a heating flow in the range of 120–140 T/h.
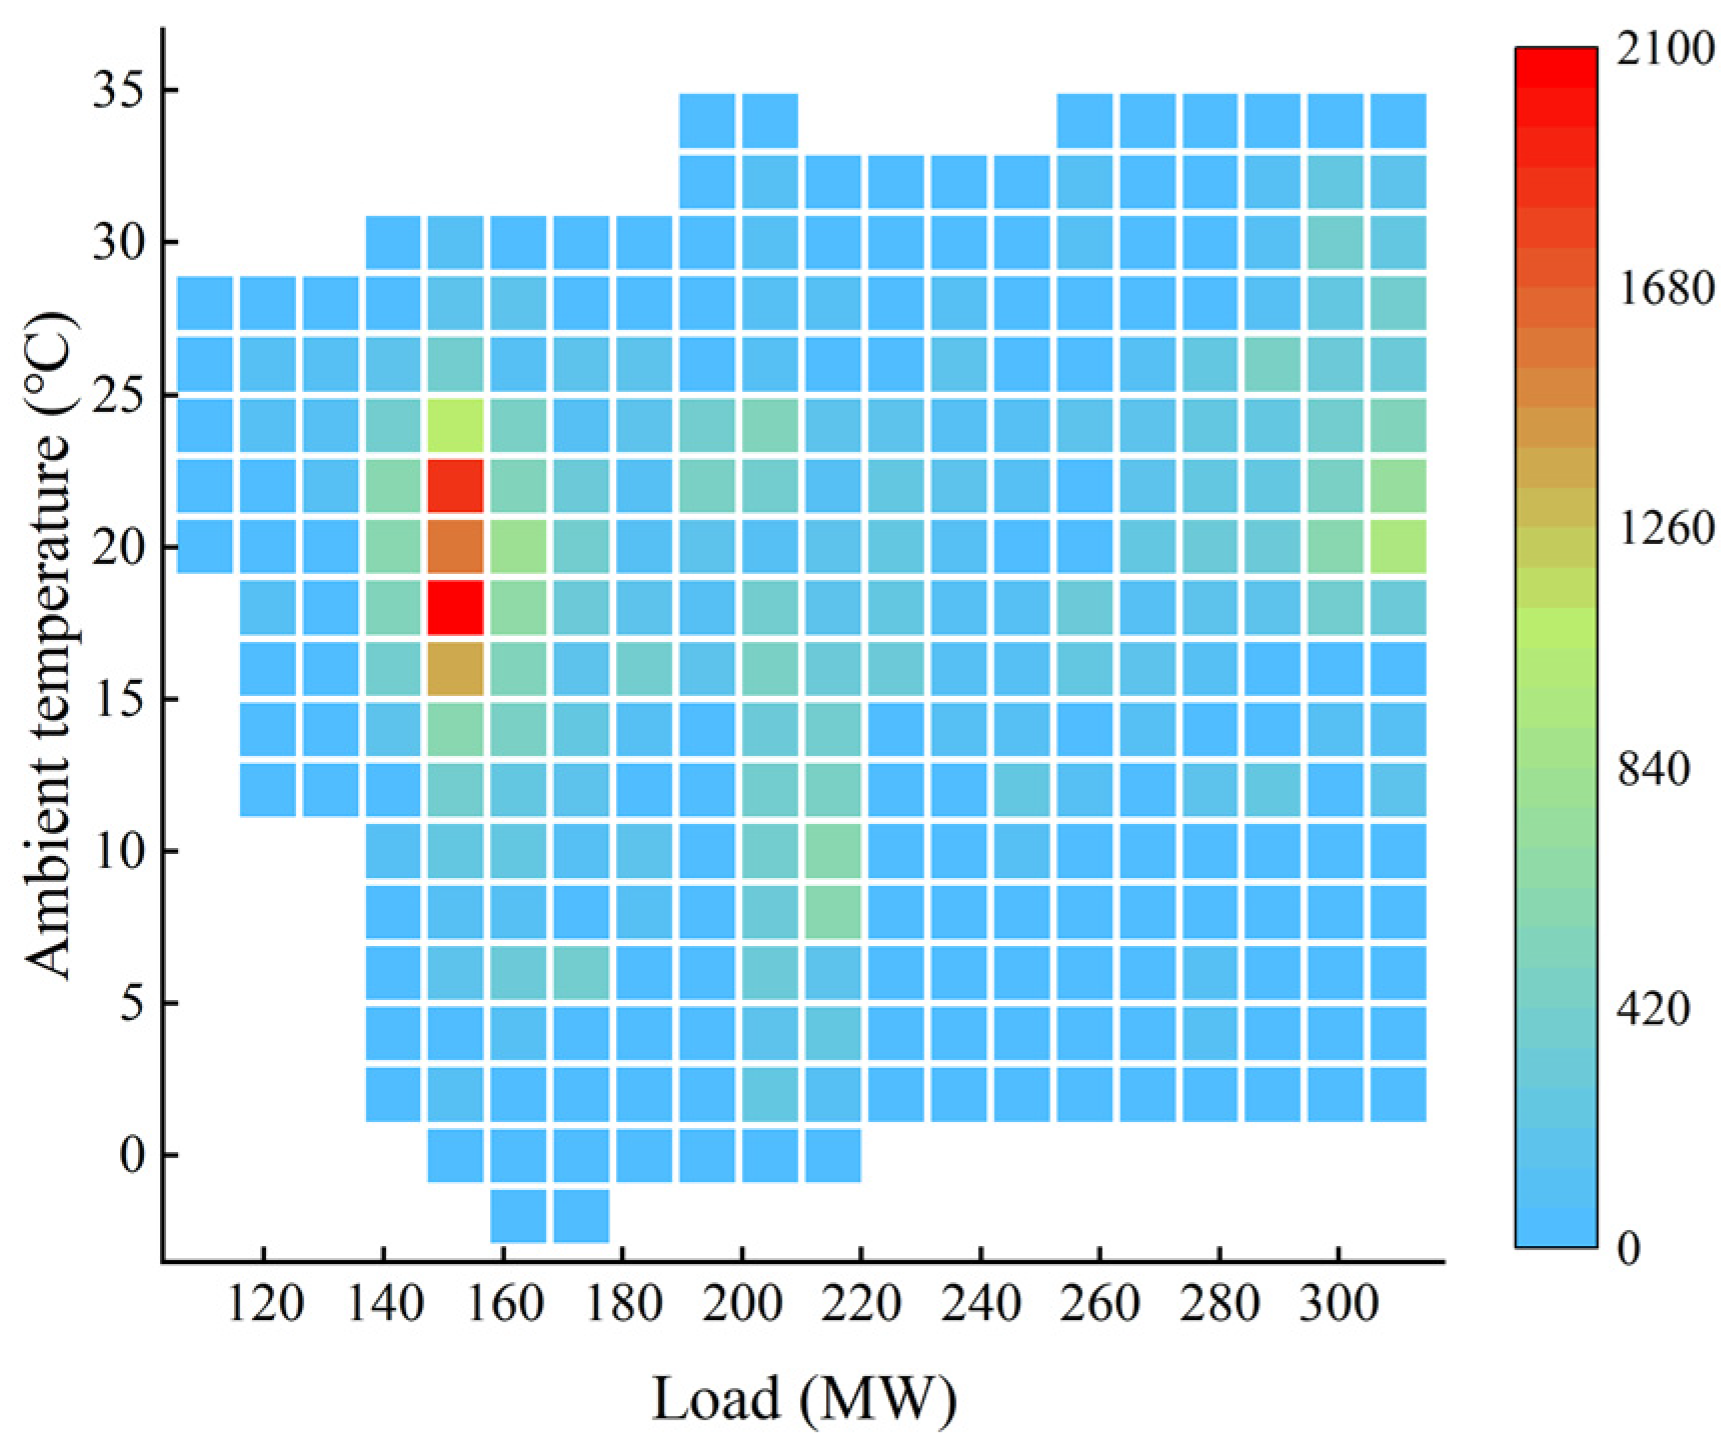
According to the statistics of the historical data, during the pure condensation period, the variation range of the unit load is 100–320 MW and the variation range of the ambient temperature is −3–35 °C, with a total of 380 operating conditions. The number of steady-state samples in each operating condition is counted, and 366 effective operating conditions are obtained.
Figure 4 visually shows the sample density of the 366 operating conditions in the pure condensation period. During the historical operation of the typical year, the cogeneration unit most often operates in the operating condition range with a load in the range of 150–160 MW and an ambient temperature in the range of 17–19 °C during the pure condensation period.
3.4. Excavation of Reference Value under Typical Operating Conditions
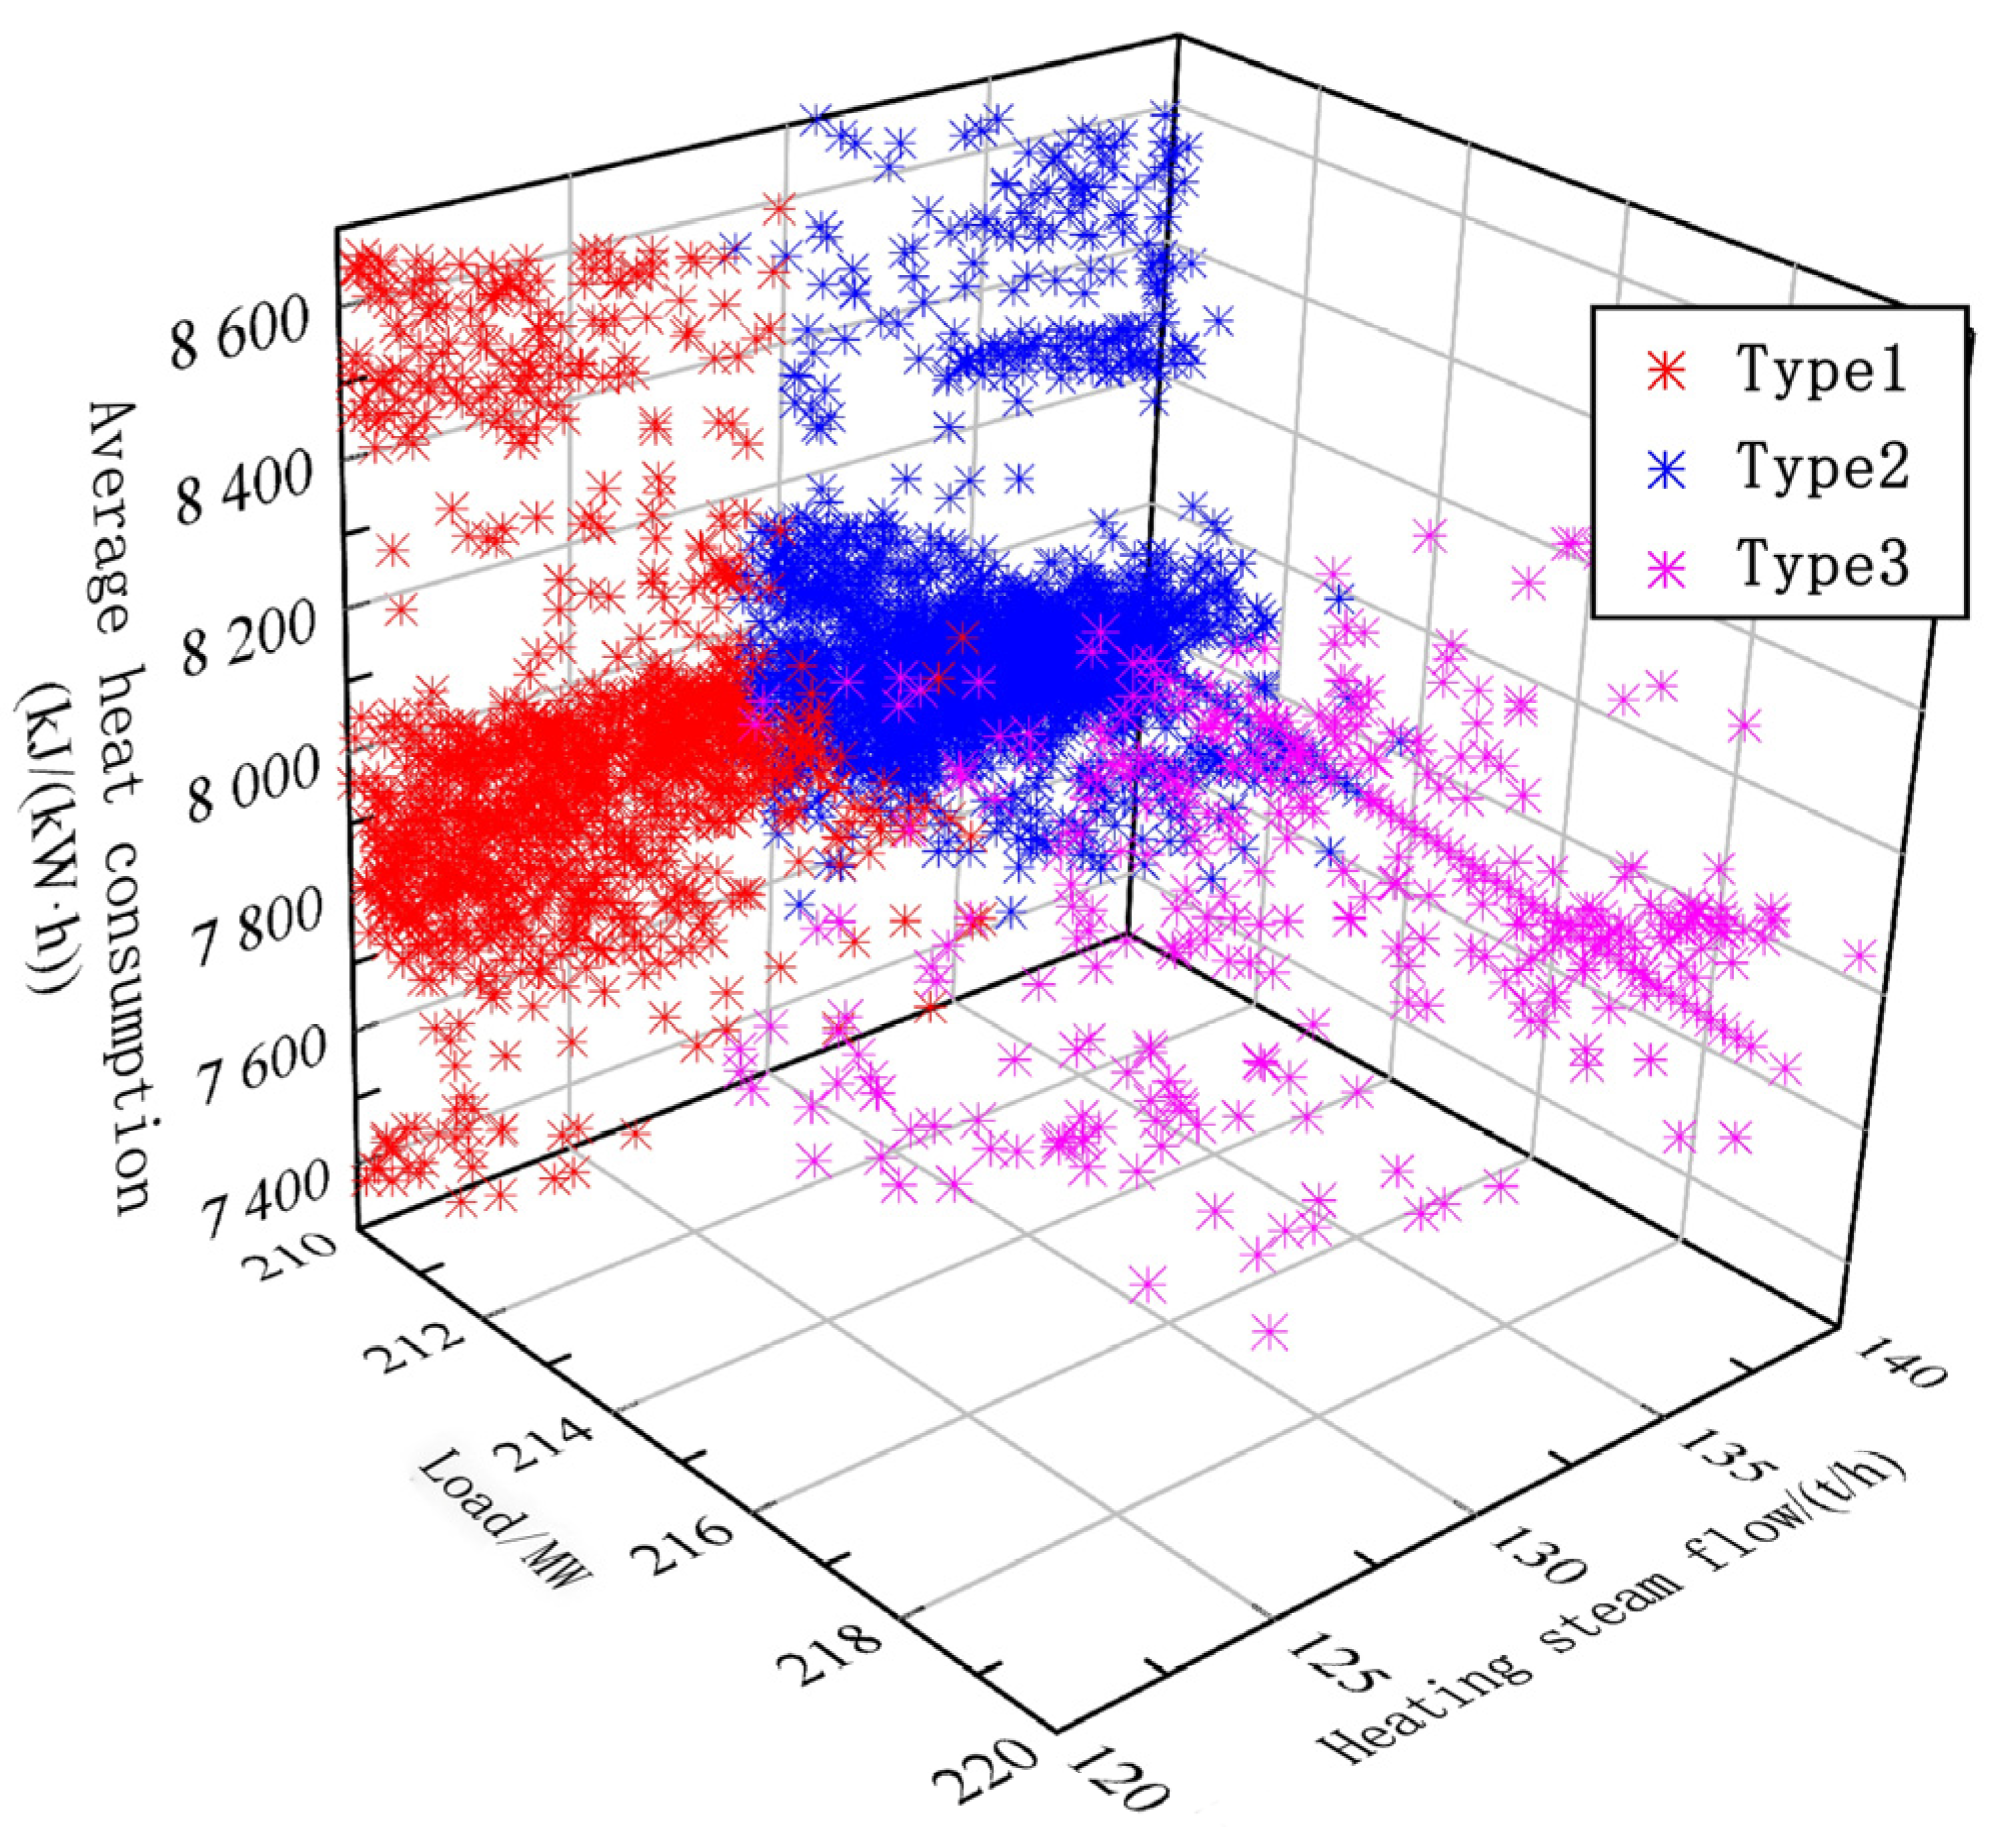
Through the analysis of the historical operation data, it is evident that during the heating period, the most common operational scenario falls within a load range of 210–220 MW and a heating flow range of 120–140 T/h, which is termed operating condition A. Consequently, the data samples falling under this operating condition are selected as an example to illustrate the benchmark mining process. GMM is used to cluster the samples of condition A, and the log-likelihood of sample points with respect to GMM is calculated. The optimal number of cluster samples identified under condition A is 3.
Table 2 lists the number of samples in each of the three categories with their corresponding average heat consumption values.
Figure 5 shows the clustering results of operating conditions based on GMM, which are marked with different colors. To show the data distribution characteristics of the operating condition in a three-dimensional space, three characteristic indexes of heat consumption, load, and heating flow are selected. When addressing the challenge of energy efficiency optimization, it is possible to further refine the benchmark sample selection by identifying the type 2 sample with the lowest heat consumption. Subsequently, the kernel density is estimated based on the benchmark sample to determine the benchmark value section for each energy efficiency state characteristic index within condition A, as detailed in
Table 3.


