Abstract
Enhancing the effective expansion ratio to further improve the fuel consumption, this study implemented a kind of Variable Port Timing (VPT) by designing a vertically moving sleeve on the outside of the scavenging port of a low-speed two-stroke diesel engine with a 340 mm bore. A 3D Computational Fluid Dynamics (CFD) model was constructed and calibrated to investigate the influence of the VPT strategy on the engine performance and the internal gas exchange process. The results indicated that the VPT can reduce the negative work from the compression stroke and increase the expansion work from the expansion stroke, which effectively enhances the fuel economy. However, the reduction in the mass flow rate would lead to the severe deterioration of the turbocharging system’s performance. The related matching analysis between the sleeve and the scavenging ports revealed that the sleeve velocity had a minimal influence on the scavenging flow rate, while increasing the height of the scavenging port can restore a certain mass flow rate, but will decrease the in-cylinder swirl intensity, deteriorating the combustion in the cylinders. The optimal approach is to raise the position of the scavenging port, achieving a Scavenging Port Closing (SPC) at a 235°CA, which will restore the scavenging flow rate of the original level to 90.7% and improve the indicated fuel consumption by 2.9 g/kWh.
1. Introduction
Two-stroke low-speed marine diesel engines, integral to global trade, with over 80% of goods transported by ships, are preferred by ship owners for their high efficiency and good reliability [1]. Due to the constraints of Nitrogen Oxides’ (NOx) emission regulations, researchers have proposed various strategies to meet these NOx emission limits. These strategies usually include a Selective Catalytic Reduction (SCR) system [2,3], which directly removes the NOx from the exhaust gases, an Exhaust Gas Recirculation (EGR) [4,5] system, which reintroduces the low-temperature combustion exhaust into the cylinder to reduce the combustion temperature, and the addition of water techniques [6,7]. However, these technologies may lead to a reduction in engine thermal efficiency or bring additional expenses, both of which will elevate the engine operating cost.
Improving the engine’s thermal efficiency is crucial for reducing the CO2 emissions and operational costs of the maritime transport sector. The engine charge–fuel matching has always been one of the most-pivotal methods to enhance the thermal efficiency of such machinery. With the integration of high-efficiency exhaust gas turbocharging systems and the optimization of valve timing and fuel injection parameters, the engine can operate in a high-efficiency range. By contrasting the effects of high-pressure and low-pressure Exhaust Gas Recirculation (EGR) systems, critical insights into their implications for turbochargers were uncovered. Notably, the study emphasized the importance of re-matching a suitable turbocharger system to improve the engine performance. Zhou et al. [8] investigated the combustion and the NOx emission of marine two-stroke engines through a simulation to guide the engine development and design. By optimizing the Exhaust Valve Closing (EVC) timing and the fuel injection direction, a reduction of approximately 13% in NOx emissions was achieved without compromising the fuel efficiency. Investigations to improve the fuel/air mixing also have insightful implications for enhancing the economic efficiency of marine low-speed engines: the Injected Fresh Air (IFA) strategy, aiming to amplify the swirl level of in-cylinder flow along with preserving the scavenging efficiency. The application of IFA under EGR conditions enhanced the swirl ratio by 163%, subsequently accelerating the fuel/air mixing process. The implementation of this strategic led to declines in NOx emissions and Brake Specific Fuel Consumption (BSFC) [9]. Then, they proposed an Injected Exhaust Gas Recirculation (IEGR) strategy, which not only augmented the in-cylinder swirl ratio, but also enabled a stratified EGR distribution. Their research underscored the potential of stratified EGR: by tailoring the fuel injection angle, the main combustion process could be confined to regions with high EGR rates while optimizing NOx reduction [10]. To alleviate the problem of extra blower power consumption, the Cylinder Gas Recirculation (CGR) strategy was introduced to enhance the swirl motion in the cylinder by using a differential pressure-driven self-circulation of the gas. This enhanced swirl motion was associated with superior fuel/air mixing and the consequent optimization of the combustion characteristics, ultimately signaling the potential for thermal efficiency enhancement and fuel consumption mitigation [11]. All three methods above actively enhance the in-cylinder airflow by incorporating additional piping and valves. This will accelerate the combustion process, leading to an increase in the engine’s isochoric phase, thereby improving its thermal efficiency.
Apart from the isochoric phase, the magnitude of the geometric compression ratio largely determines the engine’s thermal efficiency [12]. However, a high compression ratio can usually enhance the engine’s thermal efficiency and can also lead to various extra harmful issues, such as a rough operation due to the premature ignition of the fuel [13]. To address this concern, the over-expansion cycle technology has been widely adopted in various types of reciprocating engines [14]. This technique is also commonly referred to as the Miller cycle [15] or the Atkinson cycle [16]. By optimizing the valve timing, the engine’s actual working cycle has an effective expansion ratio greater than the effective compression ratio with a higher geometric compression ratio. Marine low-speed diesel engines feature a relatively high geometric compression ratio, with each cylinder equipped with a flexibly timed exhaust valve. Therefore, from the perspective of reducing the compression ratio, researchers primarily employ it as an auxiliary strategy to mitigate the thermal efficiency losses incurred by introducing the substantial EGR [17].
Increasing the effective expansion ratio usually requires a delayed EVO, but an excessively delayed EVO timing can lead to the backflow of combusted exhaust gases into the scavenging box at the SPO moment. However, if a movable sleeve mechanism is added to the exterior of the scavenging port, the EVO can be further postponed, and then, the scavenging port can be opened, even when the in-cylinder pressure drops below the scavenging pressure [18]. This kind of controlling gas exchange timing by a sleeve mechanism was first applied to small two-stroke engines [19]. It operates by introducing a movable sleeve between the cylinder wall and the piston to regulate the timing of gas exchange between the ports and the in-cylinder [20]. Yang et al. [21] explored the effects of varying the port dimensions in an OP2S diesel engine using an equivalent two-stroke simulation model. Their findings highlighted that the layered-port Variable Valve Timing (VVT) mechanism, achieved by sliding sleeves and barrier ribs, significantly enhances the engine efficiency and reduces the NOx emissions. Specifically, this adaptation resulted in a 2.2% increase of the Indicated Mean Effective Pressure (IMEP) and notable reductions in soot emissions. Ryser et al. [22] explored the potential of two-stage turbocharging and the impact of Variable Port Timing (VPT) for two-stroke engines. They discussed the optimization of the thermodynamic cycle and cylinder geometries to enhance the fuel efficiency without the deterioration of the NOx emissions. The authors found that combining two-stage turbocharging with asymmetric port timing may result in fuel consumption savings of 2–7 g/kWh at a 20% higher Brake Mean Effective Pressure (BMEP) within the considered load range. Cao [23] also explored the potential of the VPT strategy to enhance the thermal efficiency of low-speed engines. Through 1D model simulations on a diesel engine with a cylinder bore of 500 mm, the results indicated that this technology can improve the thermal efficiency, reduce the fuel consumption by 4.3 g/(kW·h), and benefit the design and cost-efficiency of SCR systems.
Computational Fluid Dynamics (CFD) has been extensively employed to analyze the scavenging and combustion processes of low-speed two-stroke diesel engines [24,25,26,27]. However, few literature works have utilized the CFD method to assess the effects of the VPT technology on the operational procedures of marine low-speed two-stroke engines. To investigate the impact of VPT on the in-cylinder flow, combustion processes, and performance of low-speed engines, a numerical study was conducted on a low-speed two-stroke diesel engine with a 340 mm bore based on a 3D CFD numerical model. The VPT was implemented by involving a reciprocating motion of a single sliding sleeve. By adjusting the motion of the sleeve, the study focused on the impact of the asymmetric scavenging timing on the performance and NOx emissions of low-speed engines. Subsequently, the geometric parameters of the variable scavenging port were studied to compensate for the reduced mass flow due to the shortened duration. Compared to the original condition, the analysis of the in-cylinder processes revealed that the application of VPT can significantly optimize the thermal efficiency of low-speed engines without the deterioration of the NOx emissions.
2. Methodology
2.1. Model Description and Validation
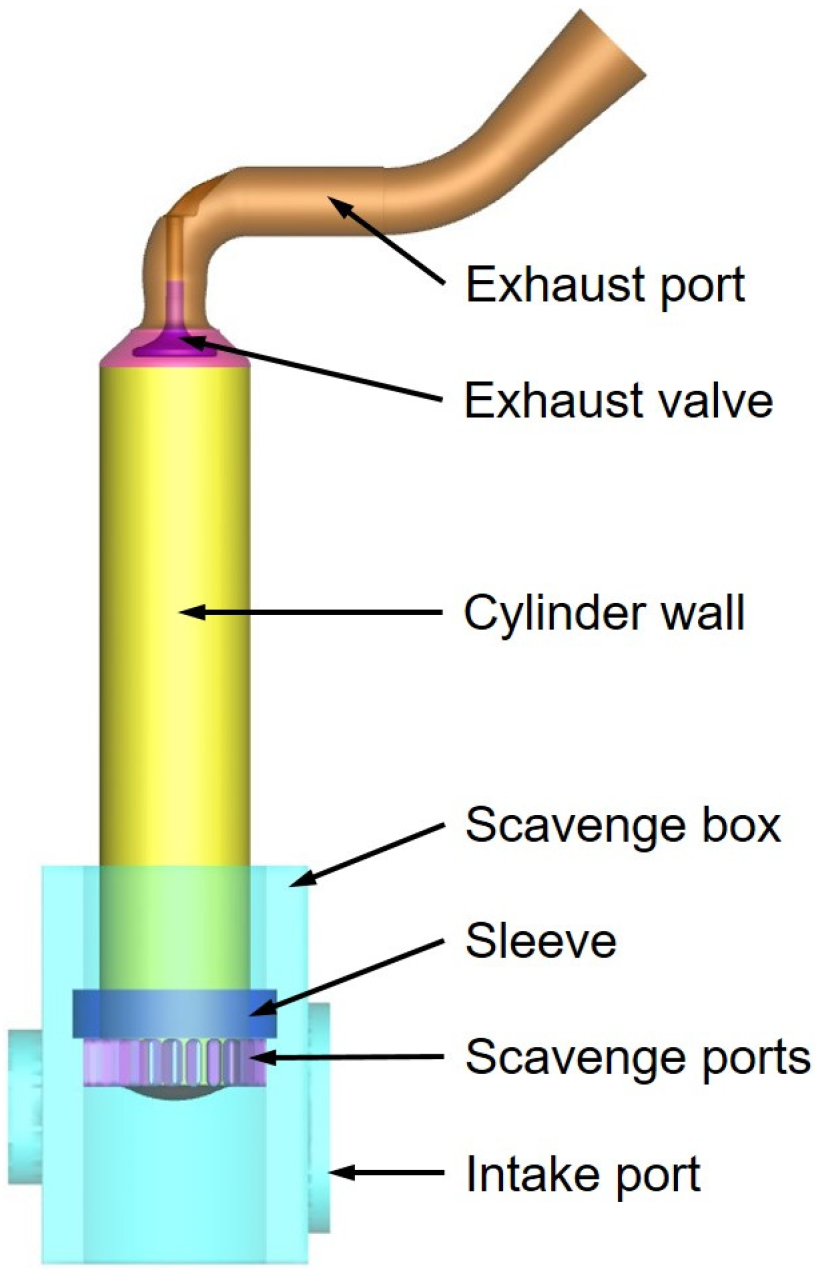
For marine low-speed engines, the common operating loads are within the load range from 60% to 90%, and a 100% load is rarely used. As for the E3 standard targeting NOx emissions’ limitation, the maximum weight factor load is 0.5 at 75% [11]. Therefore, this study mainly investigated the influence of the VPT strategy on marine low-speed engines operating at 75% load based on CFD simulations. The 6EX340EF marine low-speed two-stroke engine was modeled by utilizing the CONVERGE v3.0 software, which offers considerable flexibility in handling the motion of boundaries. The main parameters of the engine are demonstrated in Table 1. As shown in Figure 1, the modeled flow domain covers from the intake port (the interface between the scavenging air receiver and the scavenging box) to the exhaust pipe outlet (the interface between the exhaust port and the exhaust receiver), including the scavenging box, the scavenging ports, the cylinder, the exhaust valve, the exhaust port, and a vertically reciprocating sleeve.

Table 1.
Main parameters of the engine.

Figure 1.
Three-dimensional geometric structure of the CFD model.
The grid strategy was established based on the research by [28], who conducted a grid sensitivity analysis on an engine model with a similar structure. The maximum grid number occurs during the combustion process, with the total number of grids exceeding 1.4 million. The model uses n-tetradecane as a surrogate fuel, and Table 2 provides the related sub-models. The combustion model employs a detailed chemical mechanism with 42 species and 168 reactions [29].
Table 2.
Sub-models of the numerical simulation.
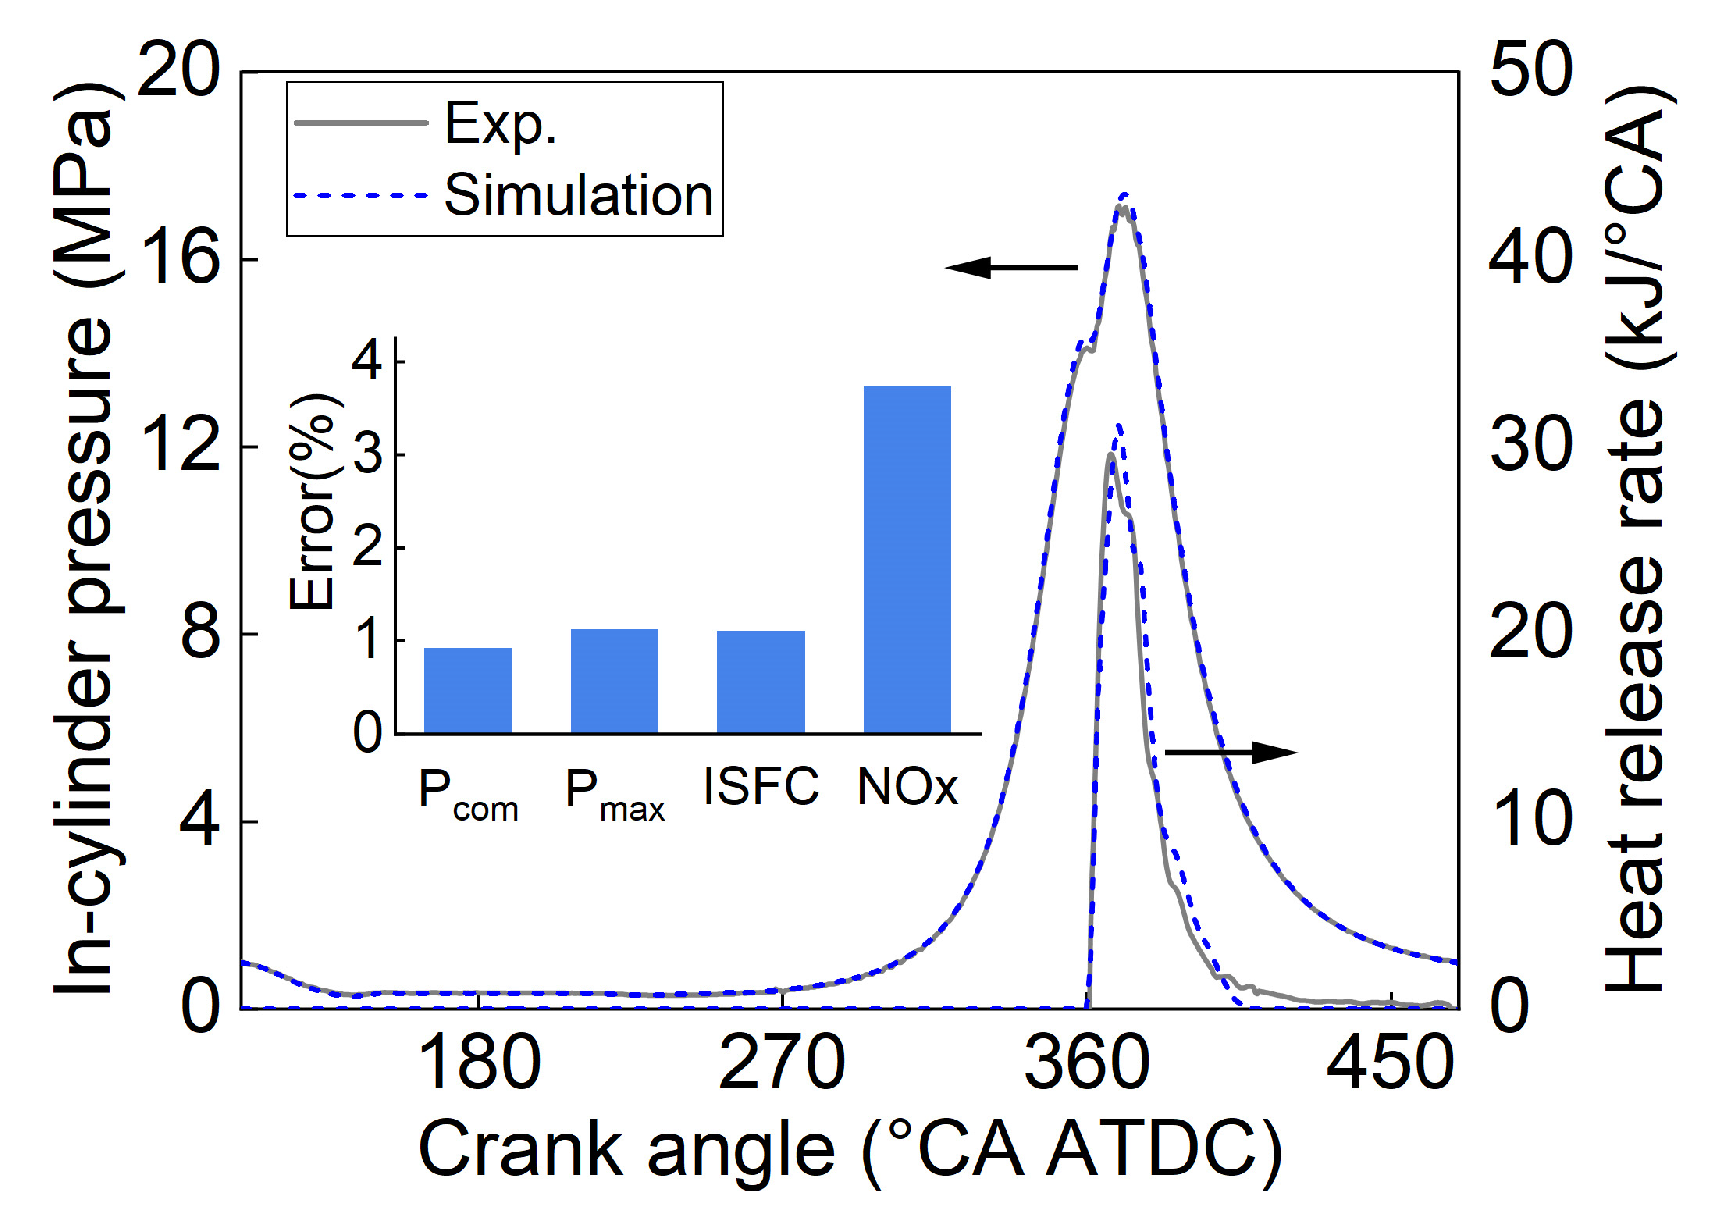
The comparison between the simulation and the experimental results is illustrated in Figure 2. It can be observed that the simulated in-cylinder pressure and the heat release rate curves were in good agreement with the experimental data. The discrepancies in end-of-compression pressure, peak pressure, Indicated Specific Fuel Consumption (ISFC), and NOx emissions were 0.9%, 1.1%, 1.1%, and 3.7% respectively. Therefore, it is feasible to predict the in-cylinder processes of the low-speed engine based on this model.
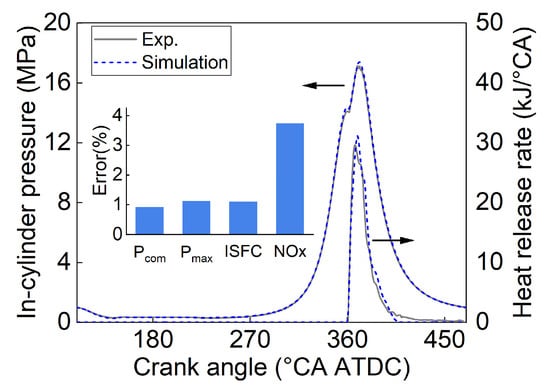
Figure 2.
Comparison of the results between the experiment and simulation.
2.2. Thermodynamic Cycle
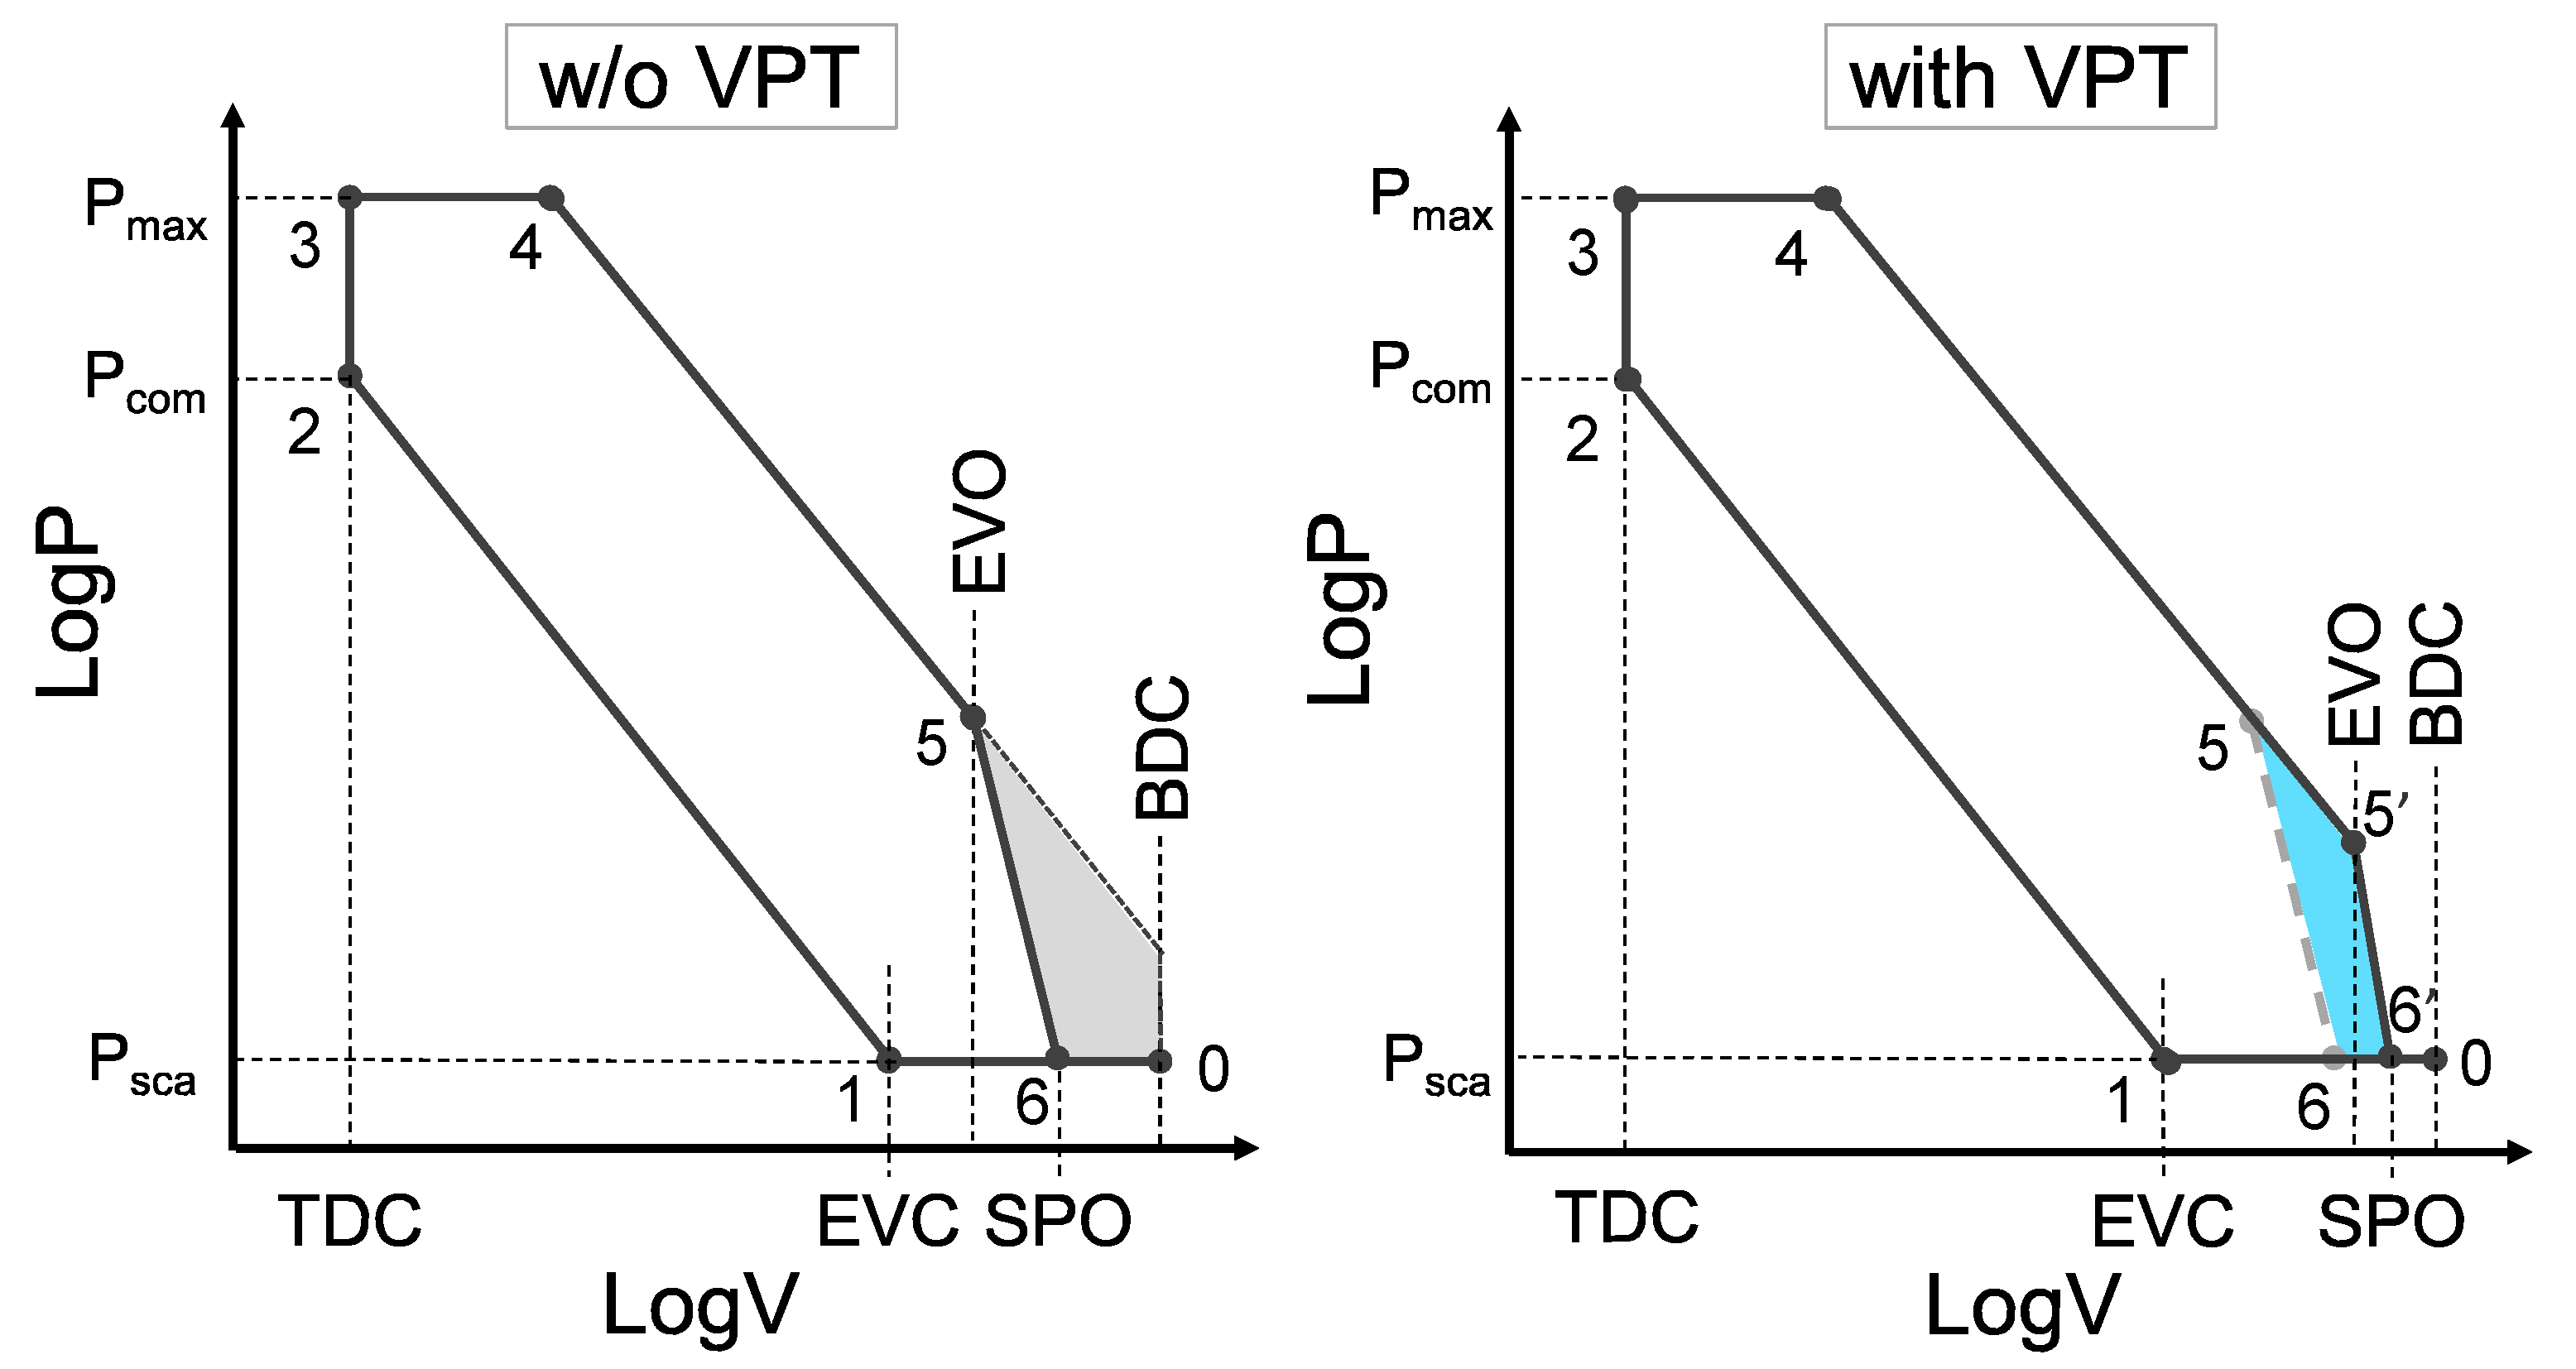
Figure 3 presents the thermodynamic cycle schematic of a low-speed two-stroke engine. According to the P–V diagram, the indicated work of the engine’s ideal thermodynamic cycle can be calculated. This shows the impact on engine thermal efficiency in an ideal state when utilizing the VPT strategy.
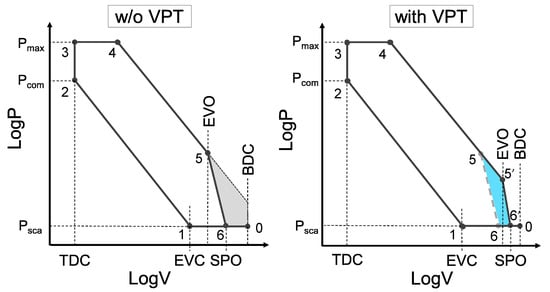
Figure 3.
P–V diagrams of the in-cylinder thermodynamic processes.
Points 1–2 represent the process from EVC to TDC, which corresponds to an isentropic compression process. The pressure and the volume satisfy the following relationship:
where is a constant and k1 is the adiabatic exponent. The work from 1–2 can be calculated using the following formula:
The stage from 2–3 indicates an isochoric (constant volume) heating process, while 3–4 is an isobaric (constant pressure) heating process. Hence, the work over 2–3–4 is given by:
where stands for the constant pressure pre-expansion ratio.
The span 4–5 represents an isentropic expansion process, and the work of this portion is:
where , k2 is the specific heat ratio, and C2 is a constant.
From EVO to Scavenging Port Opening (SPO), the cylinder pressure will precisely drop to the level of the scavenging pressure, and the span 5–6 can be described as a polytropic expansion process. 5′ and 6′ represent the delayed EVO and SPO, respectively, when employing the VPT strategy. Its work can be computed as below:
where .
6–0 and 0–1 depict the gas exchange process, where fresh air displaces the exhaust gases from the previous cycle via the scavenging port. The work during this stage can be represented as:
2.3. Brief Description of Variable Port Timing Strategy
Figure 4 shows the typical valve timing diagram of marine low-speed two-stroke diesel engines without the VPT strategy. The valve timings come from the 75% load of the 6EX340EF diesel engine. After the exhaust valve closes, the piston continues moving up to compress the fresh air trapped in the cylinder. Near the Top Dead Center (TDC), the fuel is injected into the cylinder. The fuel mixes with the air and burns, releasing a large amount of heat at the same time. This causes the working fluid inside the cylinder to expand, driving the piston to output work. When the exhaust valve opens, the free exhaust process begins. The burned gas comes into the exhaust gas manifold due to the pressure difference. Along with the piston moving down continuously, the scavenging port will be opened, and the fresh charge will enter the cylinder due to the difference between the scavenging pressure and the exhaust pressure and push the upper burned gases out. After the Bottom Dead Center (BDC), the piston moves up and closes the scavenging port, and fresh air will no longer enter the cylinder. The exhaust valve remains open to further eliminate the residual burned gas, which mixes with some fresh air during the early stages of scavenging. Therefore, the amount of fresh charge entering the cylinder during the scavenging process often exceeds the charge that is finally trapped in the cylinders.
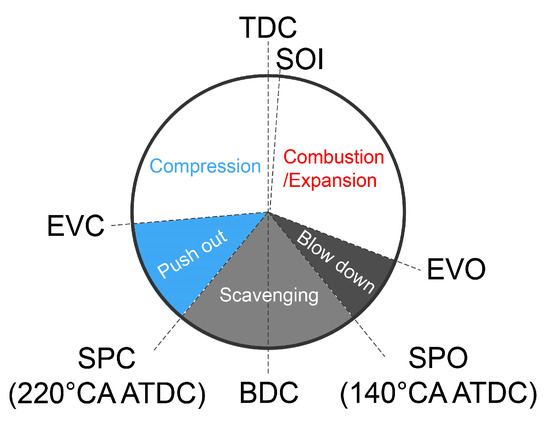
Figure 4.
Schematic of two-stroke diesel engine scavenging and exhaust timing.
For an engine with typical uni-flow scavenging, since the scavenging timing is controlled by the piston and port, the SPO and the Scavenging Port Closing (SPC) are usually symmetric based on the BDC. The VPT strategy can be applied with a sliding sleeve outside of the scavenging ports, and the sleeve–port–piston configuration is achieved. For this kind of device, the SPO and the SPC are adjusted by the position of the piston and sleeve. The scavenging air box cannot connect the cylinder until the piston and the sleeve are both in the proper positions.
The VPT strategy for low-speed engines can be divided into the symmetric and the asymmetric scheme [22,23]. The symmetric scheme usually has a variable scavenging port height by adjusting the position of the sleeve. The SPC and SPO are still symmetric based on the BDC, while, for the asymmetric scheme, although the port timing is still achieved by adjusting the sleeve position, the profile of the scavenging port is no longer symmetric.
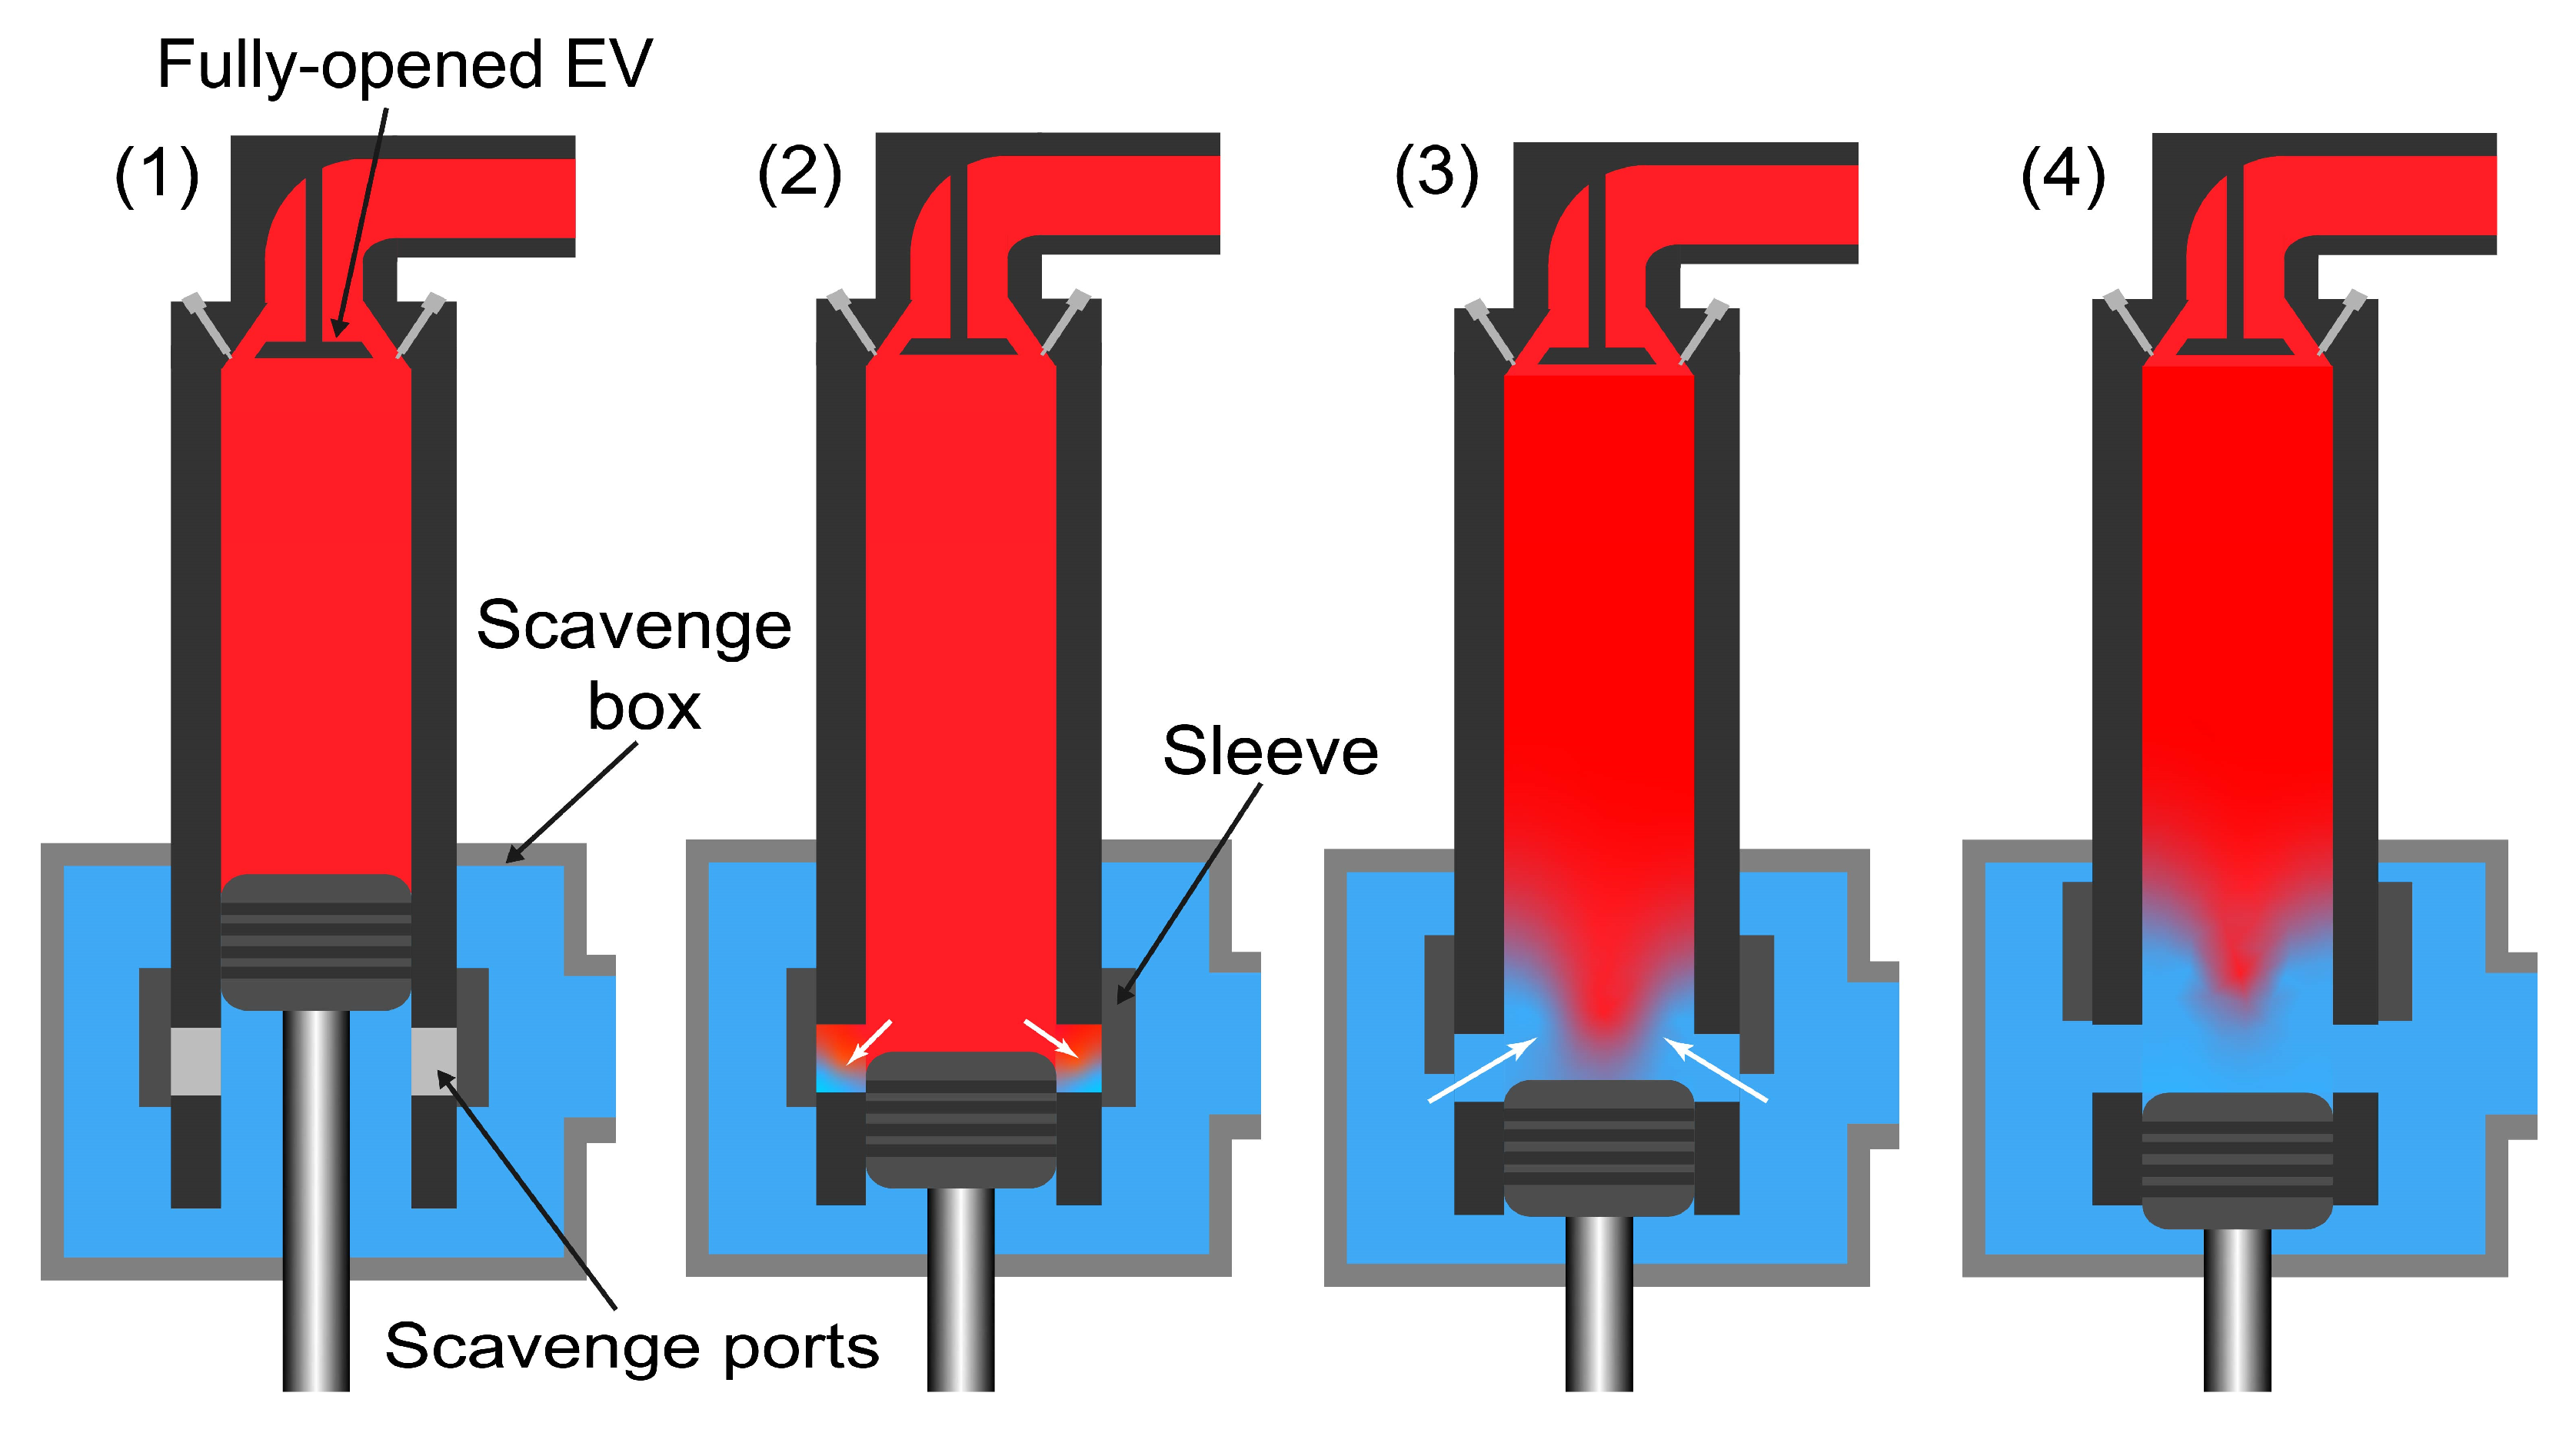
This article mainly focused on the influence of the asymmetric scavenging port on the exhaust emission of marine low-speed engines. Figure 5 details the opening sequence of the asymmetric scavenging port valve timing. (1) demonstrates that the exhaust valve is open. (2) means that the piston has moved down below the upper end of the scavenging port, and the cylinder pressure is still higher than the scavenging air pressure. The reverse of the exhaust gas will be inhibited by the sleeve on cylinder. (3) When the cylinder pressure is lower than outside, the sleeve begins to move up. Then, the fresh air in the scavenging box will enter the cylinder and push the burned gas out of the cylinder. (4) When the sleeve reaches the maximum movement, the connection between the scavenging box and port is completely open. The later connection state will be decided by the piston position. After the BDC, the piston will continue moving up, and fresh air will not enter the cylinder until the piston reaches the upper part of the scavenging port. Following a period of pushing out, the exhaust valve closes, concluding the entire gas exchange process. The introduction of the sleeve can assist low-speed engines in further enhancing the effective expansion ratio, achieving a more-extreme over-expansion cycle, subsequently improving the thermal efficiency of the engine.
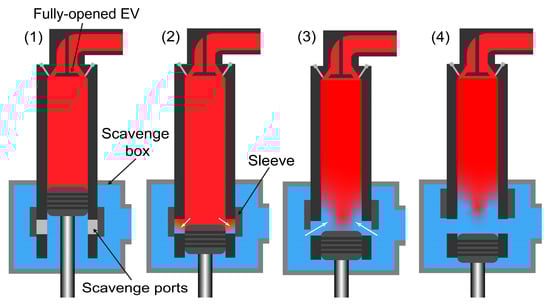
Figure 5.
Asymmetric scavenging port timing.
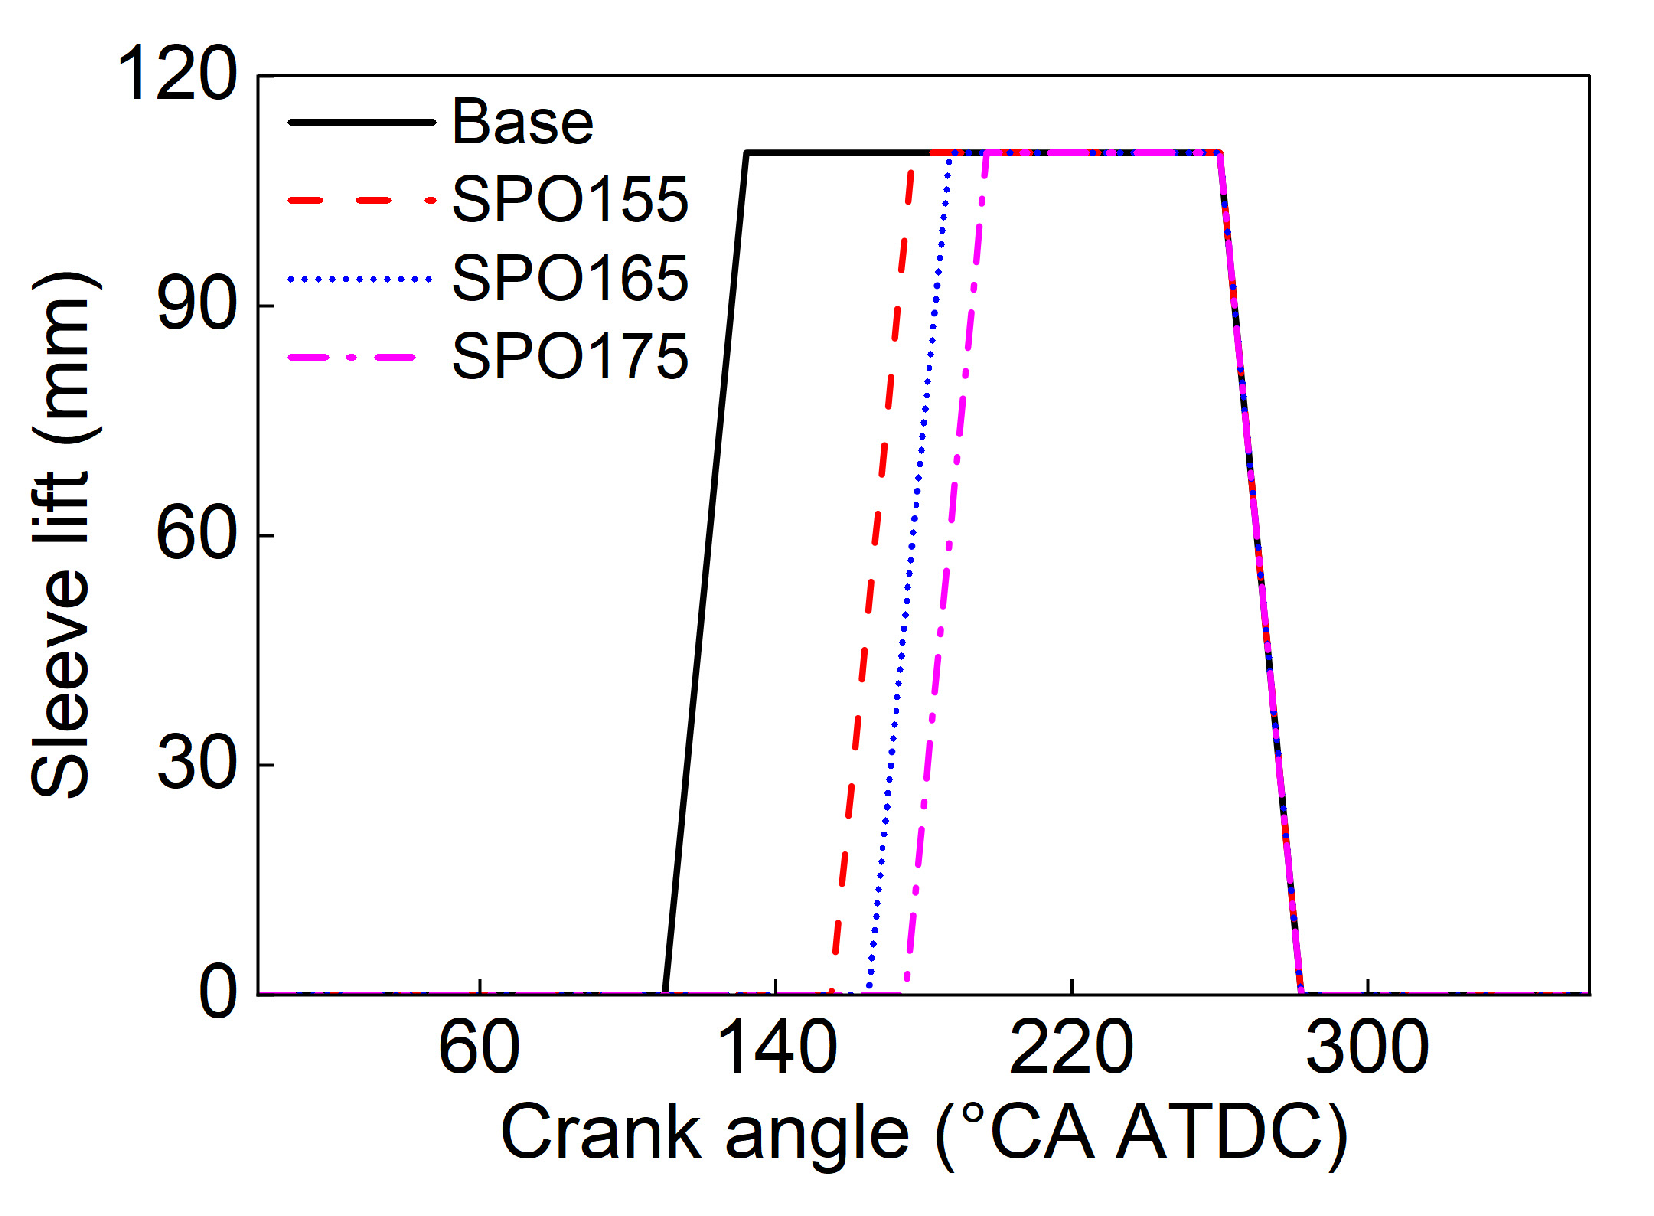
The influence of the VPT strategy on the engine’s gas exchange process and performance was simulated by adjusting the EVO and the motion of the sleeve. Related cases are demonstrated in Table 3. The sleeve’s lift curve is shown in Figure 6. SPO 155 to 175 represent the timing for the scavenging port opening resulting from the positions of the piston and sleeve. The maximum lift corresponds to the height of the scavenging port. Both the opening and closing speeds are maintained at 5 mm/°CA. This speed lies between the average speed of piston movement from 140°CA ATDC to BDC (2.75 mm/°CA) and the overall average speed of the piston (8.89 mm/°CA). In preliminary variants, the sleeve velocity was retained, and the structural parameters of the scavenging port remained unchanged. To compensate the scavenging air mass, further studies were conducted to explore the impact of different sleeve velocities and scavenging port structural parameters on the performance and emissions of the low-speed engine after adopting the VPT strategy.
Table 3.
Simulation matrix.
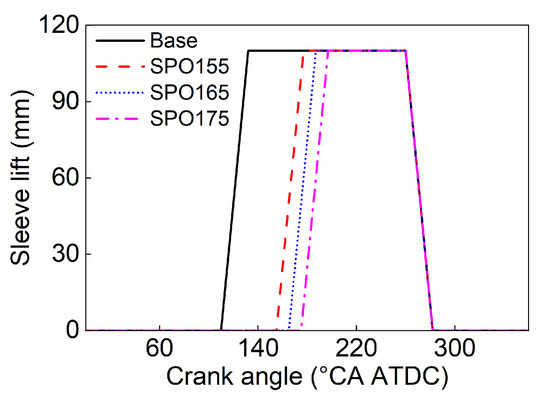
Figure 6.
Lift curve of the sleeve.
3. Results and Discussions
3.1. Influence of EVO on Indicated Work
Figure 7 illustrates the relationship between the EVO timing and the effective expansion ratio, based on the theoretical analysis. The EVC, the compression pressure (Pcomp), and the peak pressure (Pmax) were kept the same as the reference operating condition. A pre-expansion ratio of 2.2 was employed in the analysis [12]. When the EVO was delayed from 110°CA ATDC to 130°CA ATDC, there was a notable increase in the effective expansion ratio: 1.89, which subsequently led to a 1.4% enhancement of the indicated work. In contrast, delaying the EVO from 140°CA ATDC to 160°CA ATDC caused a greater increasement of the effective expansion ratio (0.86); the indicated work only showed a slight rise of 0.2%. This analysis suggests the benefits of further delaying the EVO. Specifically, as the EVO timing will be further postponed, the rate of increase in the effective expansion ratio will be reduced, and the subsequent improvement in the indicated work will become less significant. Consequently, while a certain delay in the EVO can optimize the expansion work, an excessively postponed EVO may not offer substantial advantages.
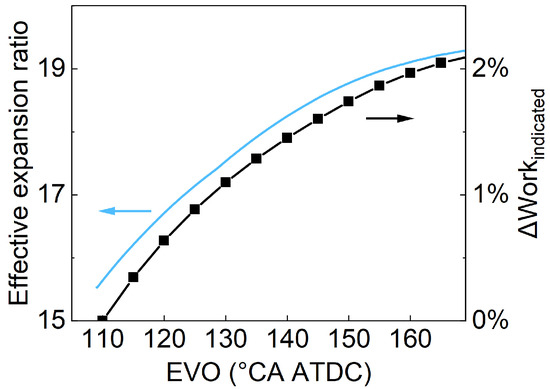
Figure 7.
Influence of EVO timings on effective expansion ratio and indicated work by the theoretical analysis.
3.2. Demand of Interval between EVO and SPO
With the implementation of the VPT strategy, the SPO timing is no longer governed by the port–piston structure alone. Instead, it will be determined by the integrated sleeve–port–piston configuration. The SPO is defined as the moment when the sleeve starts to move upward. To prevent the burned gas from entering the scavenging box, it is crucial to maintain an appropriate interval between the SPO and the EVO.
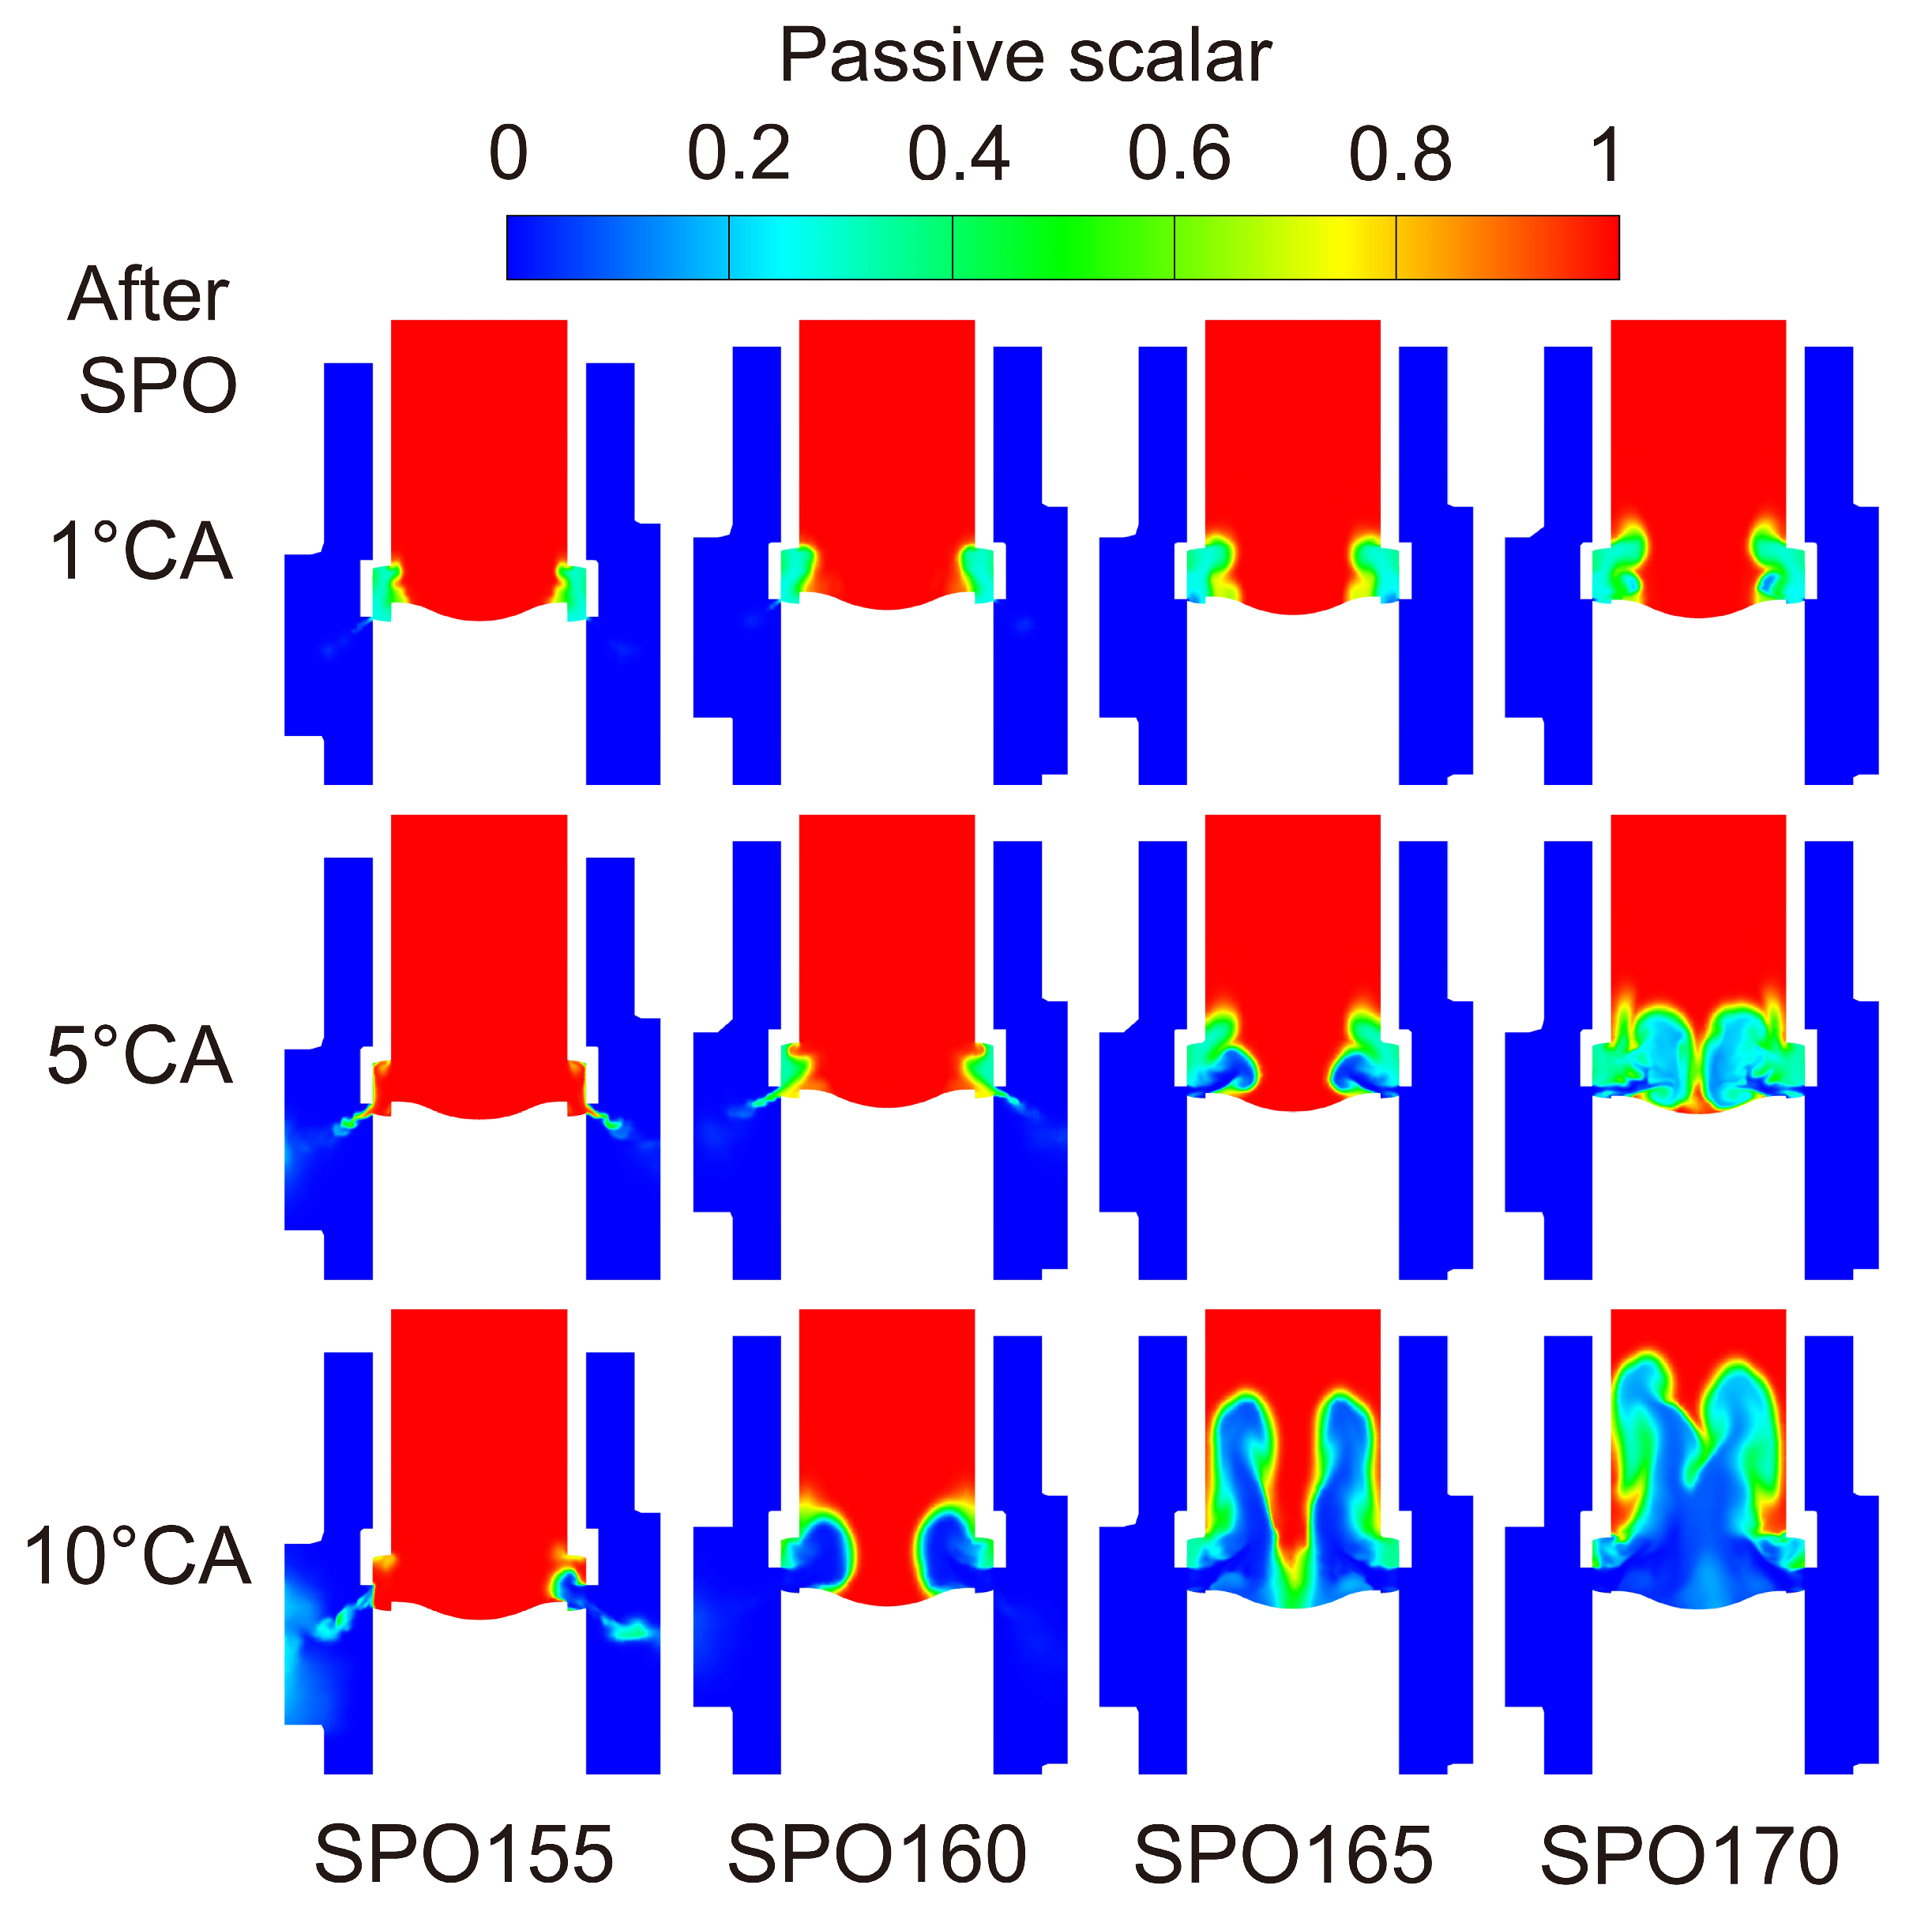
Figure 8 illustrates the effects of the SPO timing on the burned gas distribution during the early phases of the scavenging process. For the case SPO155 and the case SPO160, it can be found that the burned gases have entered the scavenging box from 1°CA to 5°CA after the SPO. Once the scavenging ports have been opened for 10°CA, the flow direction will be revised. In the case SPO155, the exhaust gases still remain near the scavenging box wall. In contrast, the burned gas distribution of the case SPO160 shows virtually no discernible exhaust gases at 10°CA after the SPO. The burned gas distribution of the case SPO165 and the case SPO170 suggest that, during the early phases of the scavenging process, the exhaust gases could be kept out of the scavenging port and cannot enter the scavenging box.

Figure 8.
Influence of SPO timing on burned gas distribution during early phases of the scavenging process (EVO = 140°CA ATDC).
Figure 9 shows the burned gas in the intake region, which consists of the scavenging box and scavenging ports under different SPO timings. It can be observed that, at a crank angle of 140°CA ATDC, the burned gas starts to increase. At this point, the in-cylinder pressure remains relatively high, prompting the burned gas to start entering the scavenging ports. This increase continues for 2~3°CA before it starts to gradually decline. This decline was attributed to the scavenging port pressure equilibrating with the in-cylinder pressure in a short timeframe, with the piston’s downward movement causing these gases in the scavenging ports to re-enter the cylinder.
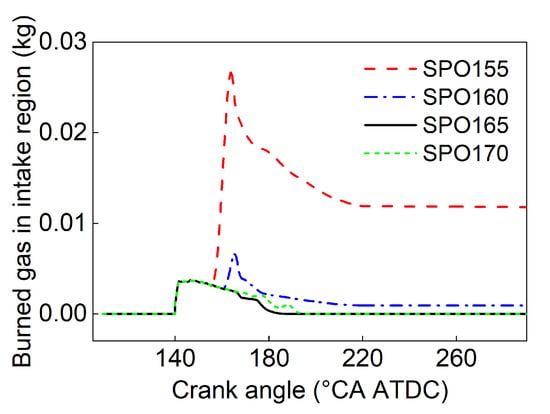
Figure 9.
Burned gas in the intake region under different SPO timings.
For the case SPO155, once the scavenging box and the scavenging ports become interconnected, burned gas flows into the scavenging box immediately, reaching the peak mass at 10°CA after the SPO. Some of these burned gases will re-enter the cylinder in a subsequent process after the flow direction is reversed. The distribution diagram in Figure 8 shows that there was no burned gas in the case SPO160 at 10°CA after the SPO, but a small amount of burned gas still existed in the scavenging box after the scavenging process completed, as shown in Figure 9. For the cases SPO165 and SPO170, the scavenging box remained free from any burned gas.
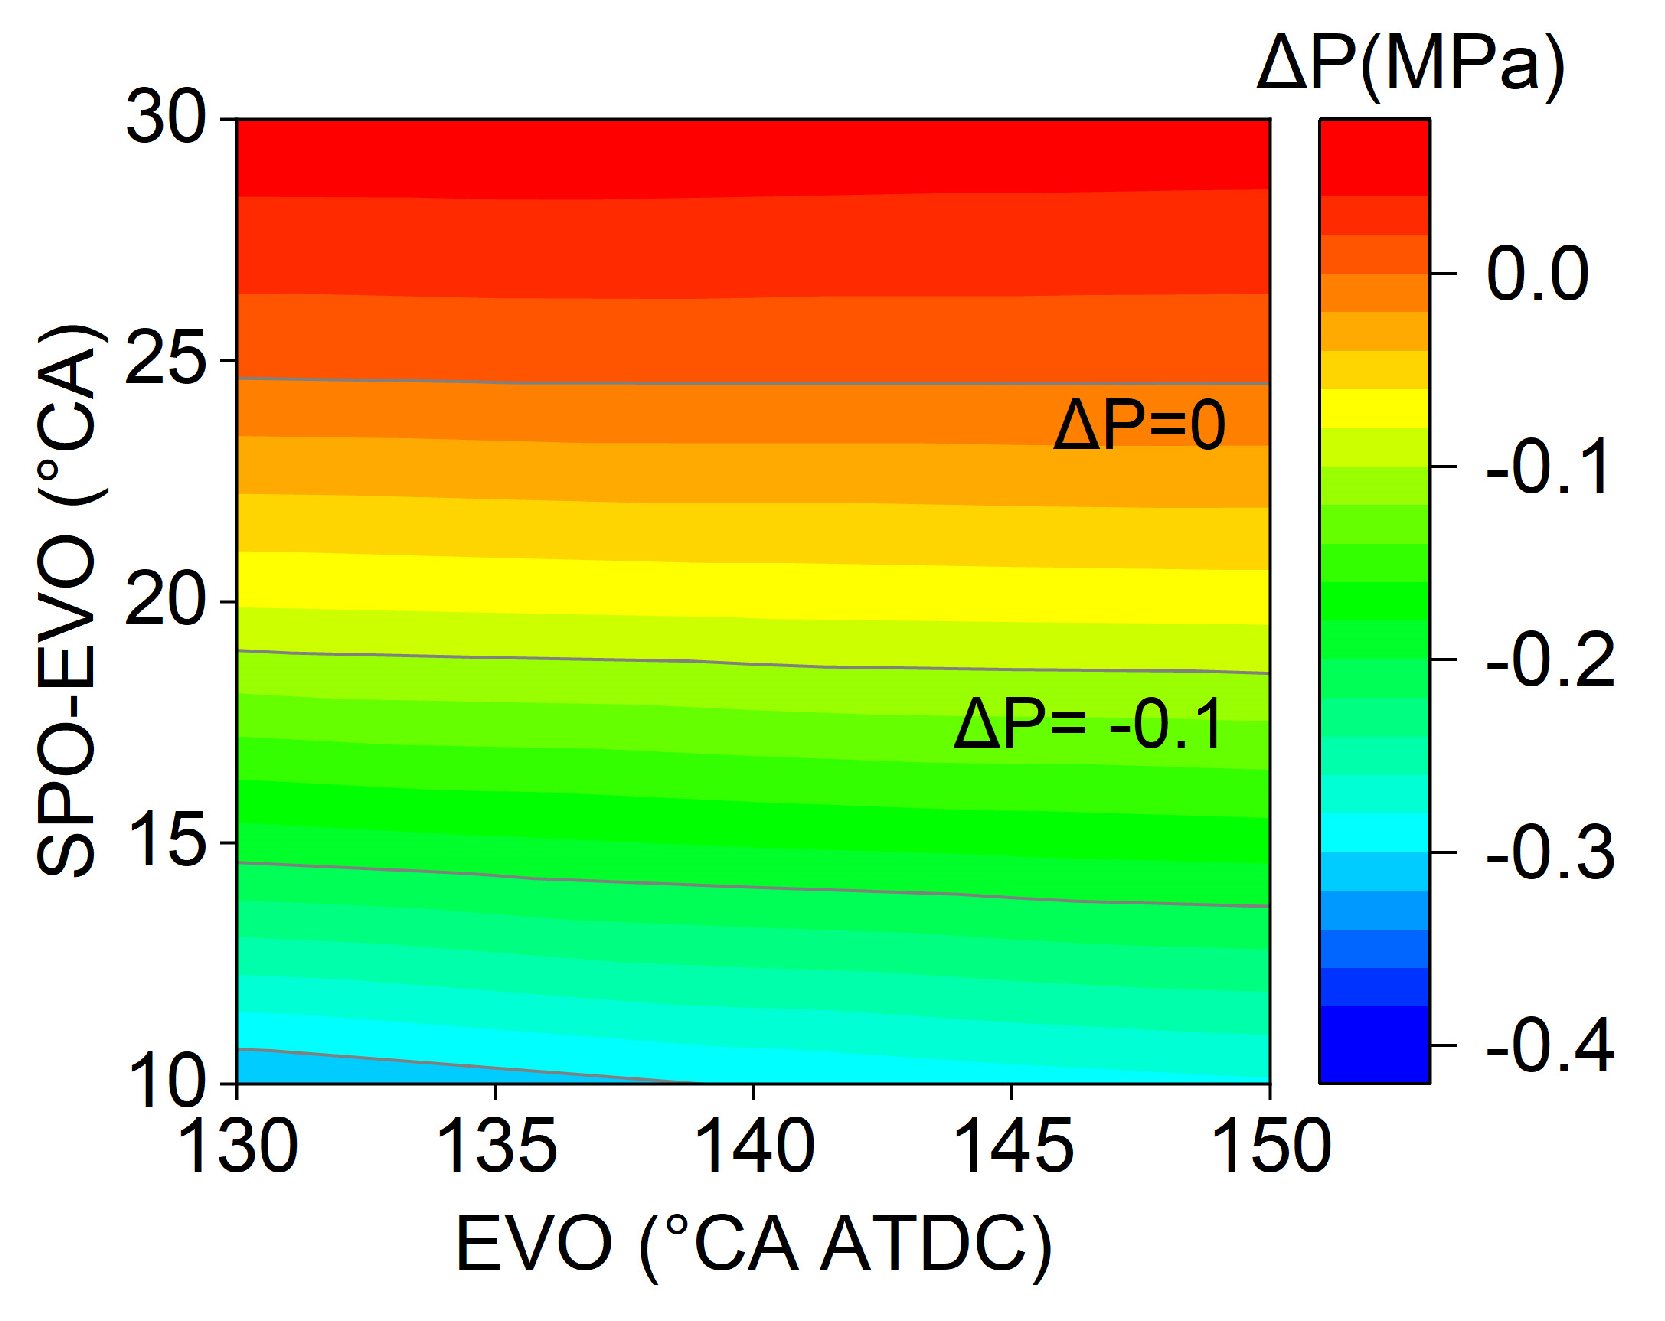
Figure 10 shows the difference between the scavenging pressure and the in-cylinder pressure at the moment of the SPO with various EVO and SPO timings. Notably, regardless of the delay of the EVO, the in-cylinder pressure at the SPO remained lower than the scavenging pressure, only if the difference between the SPO and EVO surpassed 25°CA. This condition prevents the burned gas from flowing into the scavenging box.
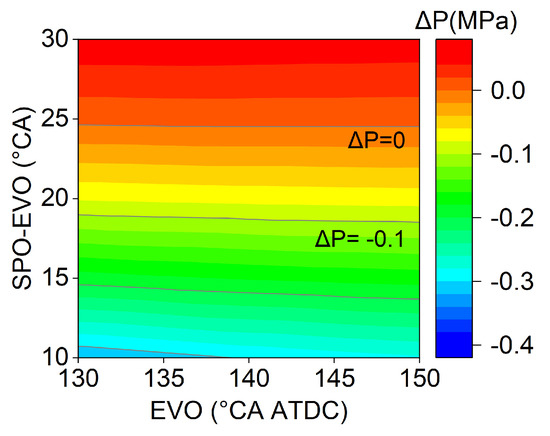
Figure 10.
Difference between scavenging pressure and in-cylinder pressure at SPO with various EVO and SPO timings.
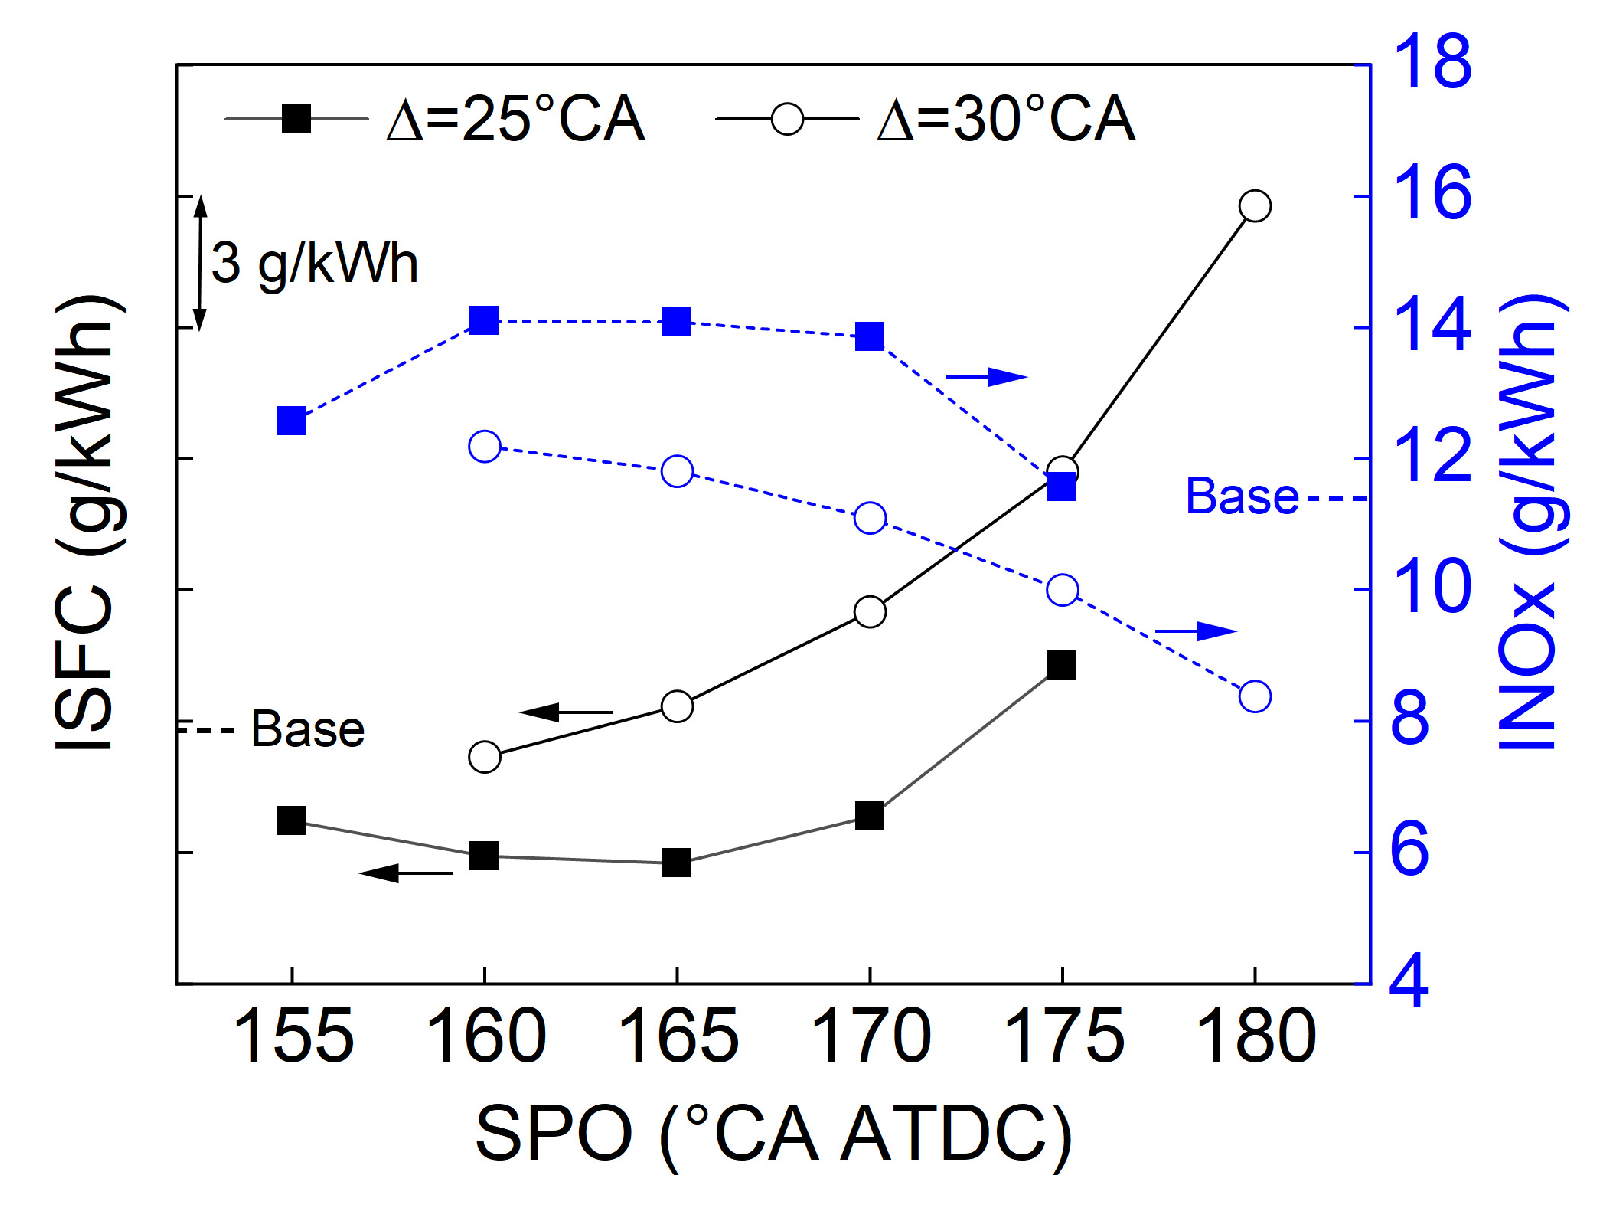
Figure 11 illustrates the impact of SPO timings on the ISFC and NOx emissions of the low-speed engine, when the differences between the SPO and EVO are 25°CA and 30°CA, respectively. With a fixed SPO, the smaller the difference between the SPO and EVO, the lower the ISFC is. Under the precondition of avoiding the intake backflow, a later EVO led to a better engine fuel economy, improving about 1.8% relative to the original condition, while the NOx emissions increased by 22.0%. When the difference between the SPO and EVO was small, delaying SPO implies that the engine cycle had a higher effective expansion ratio, leading to the improvement of the fuel efficiency. However, once the SPO exceeded 165°CA ATDC, the ISFC no longer decreased. On the one hand, the increase in the effective expansion ratio was minimal. On the other hand, the duration of the scavenging reduced from 80°CA to below 55°CA, severely compromising the gas exchange quality, which deteriorated the combustion process. The more the delay in the SPO, the greater the magnitude of the deterioration in the fuel efficiency is.
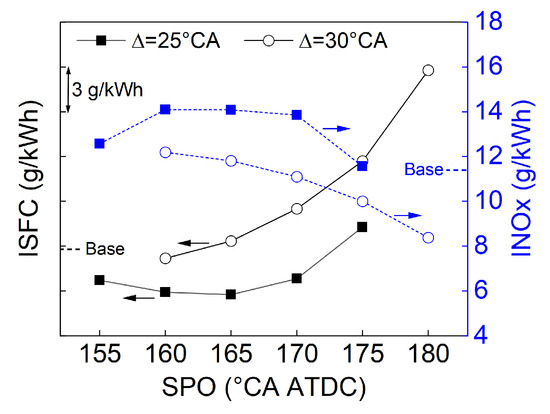
Figure 11.
Influence of SPO on ISFC and NOx emission.
3.3. Influence of VPT on In-Cylinder Gas Exchange Process
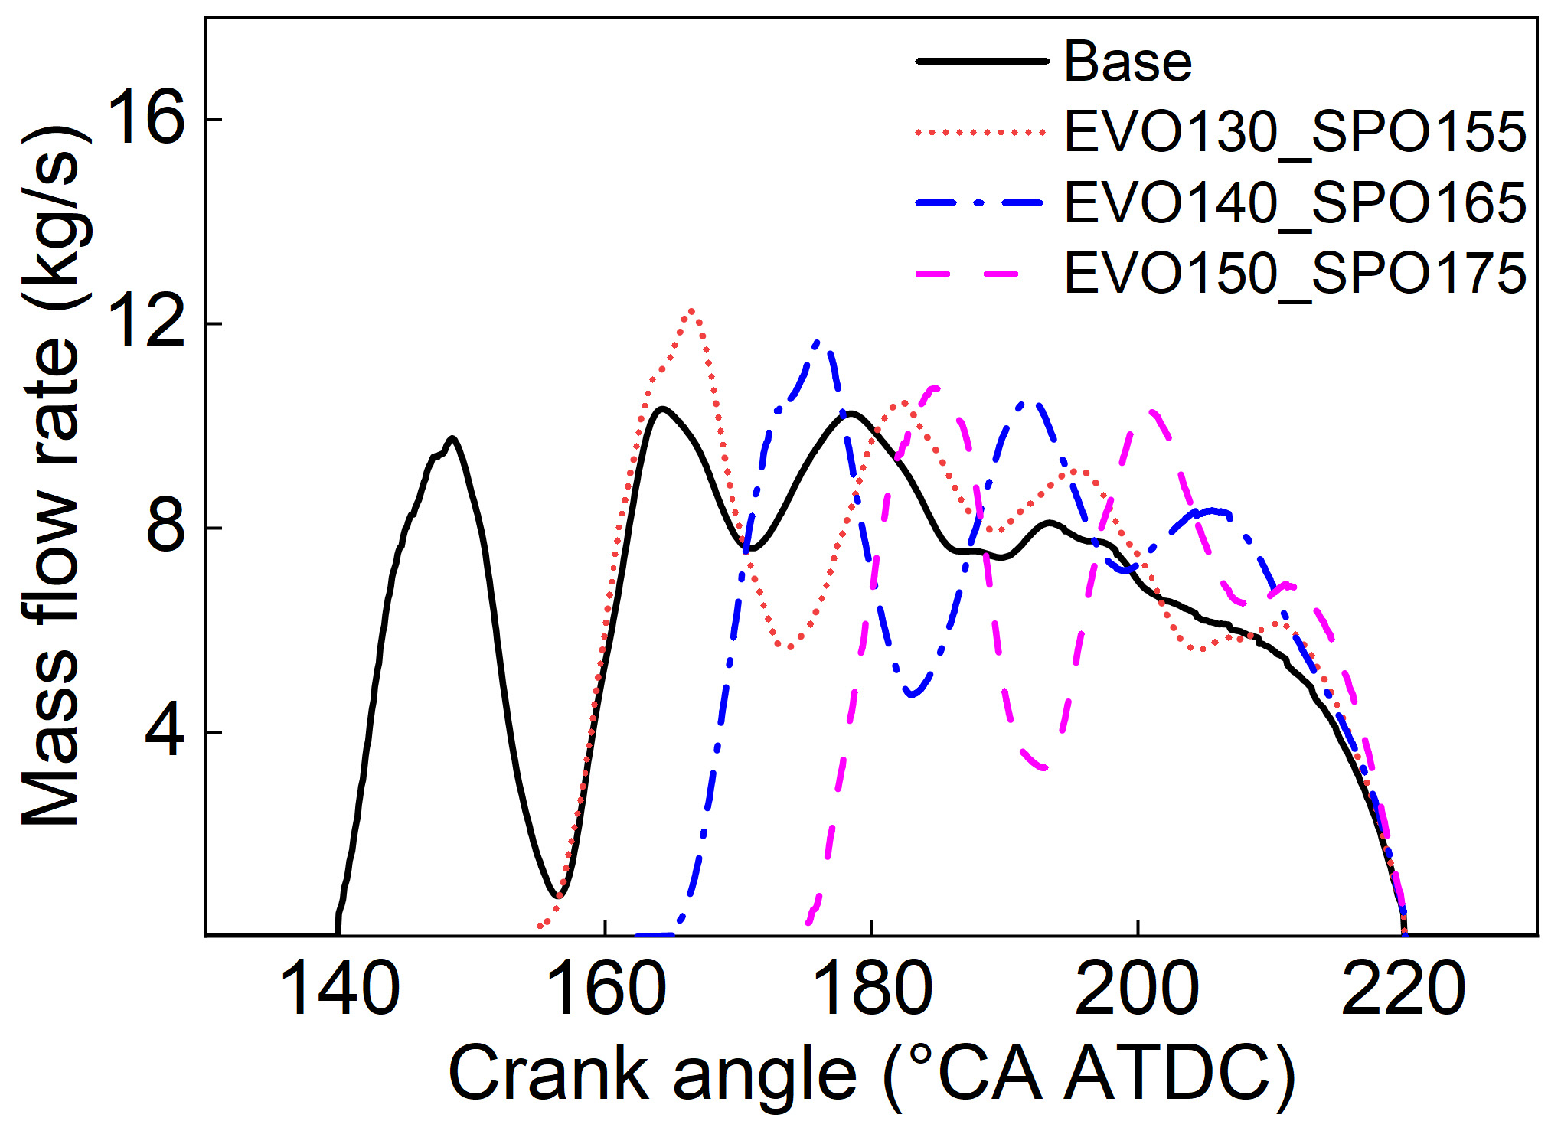
Figure 12 shows the mass flow rate from the scavenging box to the cylinder at various SPO timings, where the difference between the EVO and SPO timings consistently remained at about 25°CA. Upon the opening of the scavenging ports, it is evident that the initial peak of the mass flow rate curve diminished with a delayed SPO. However, all these peaks surpassed the initial peak observed in the base condition.

Figure 12.
Mass flow rate from scavenging box to cylinder at various SPO timings.
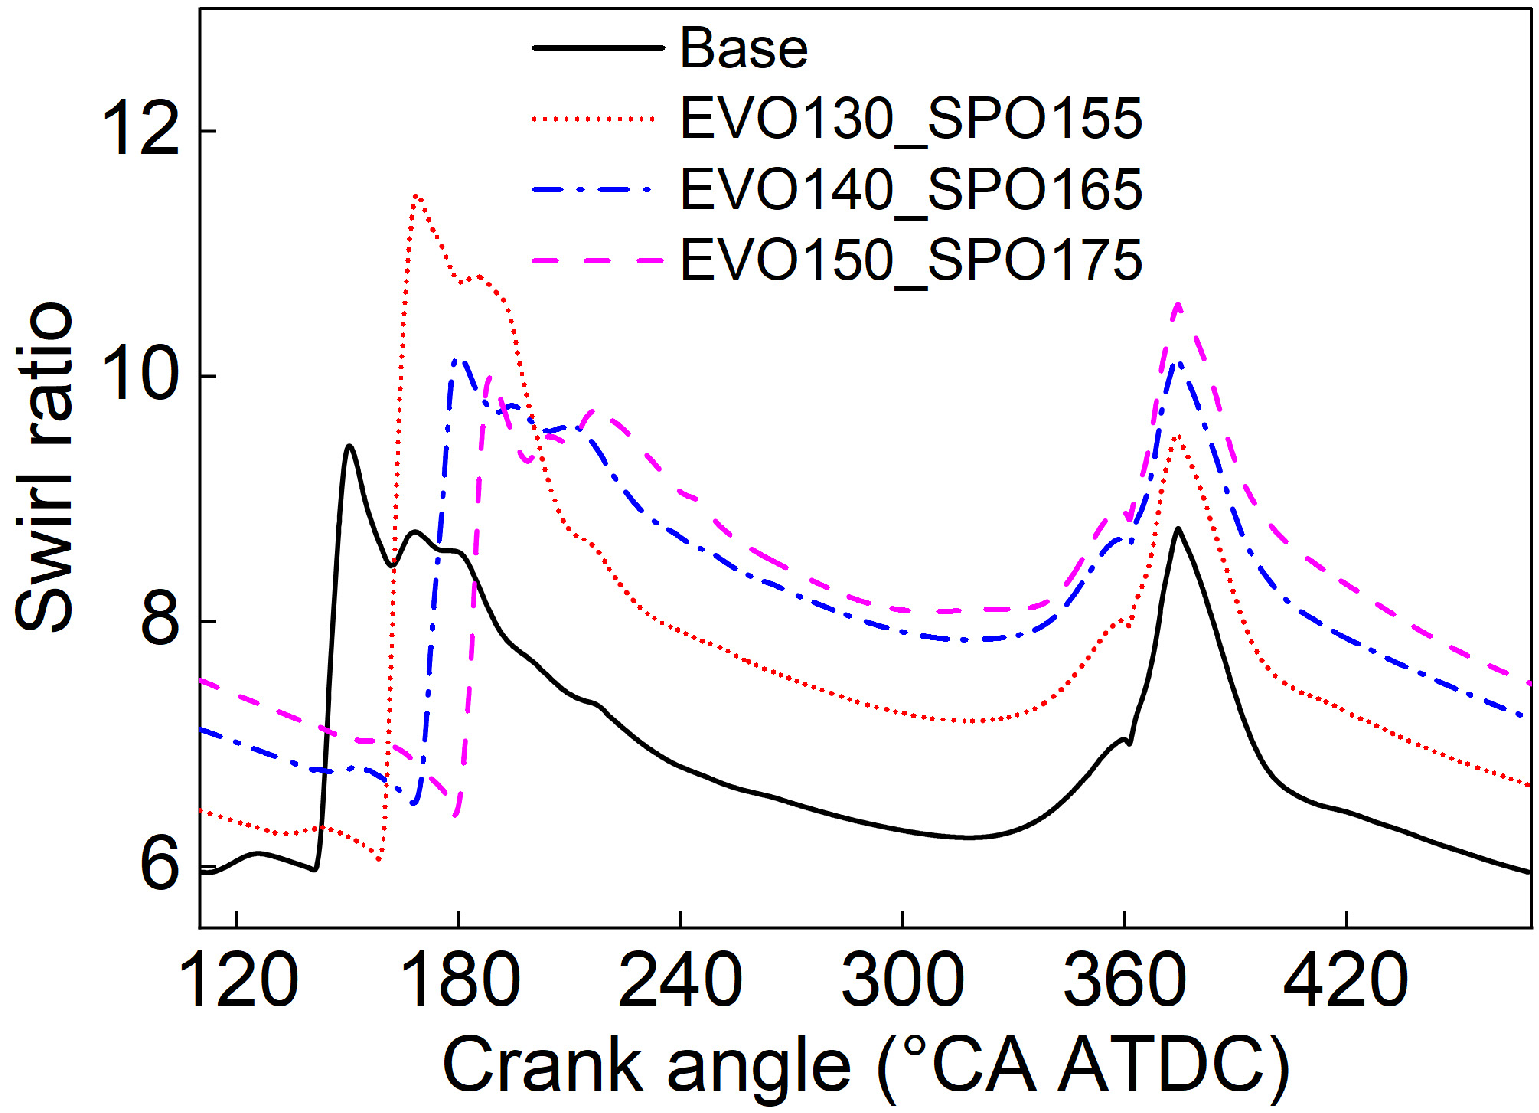
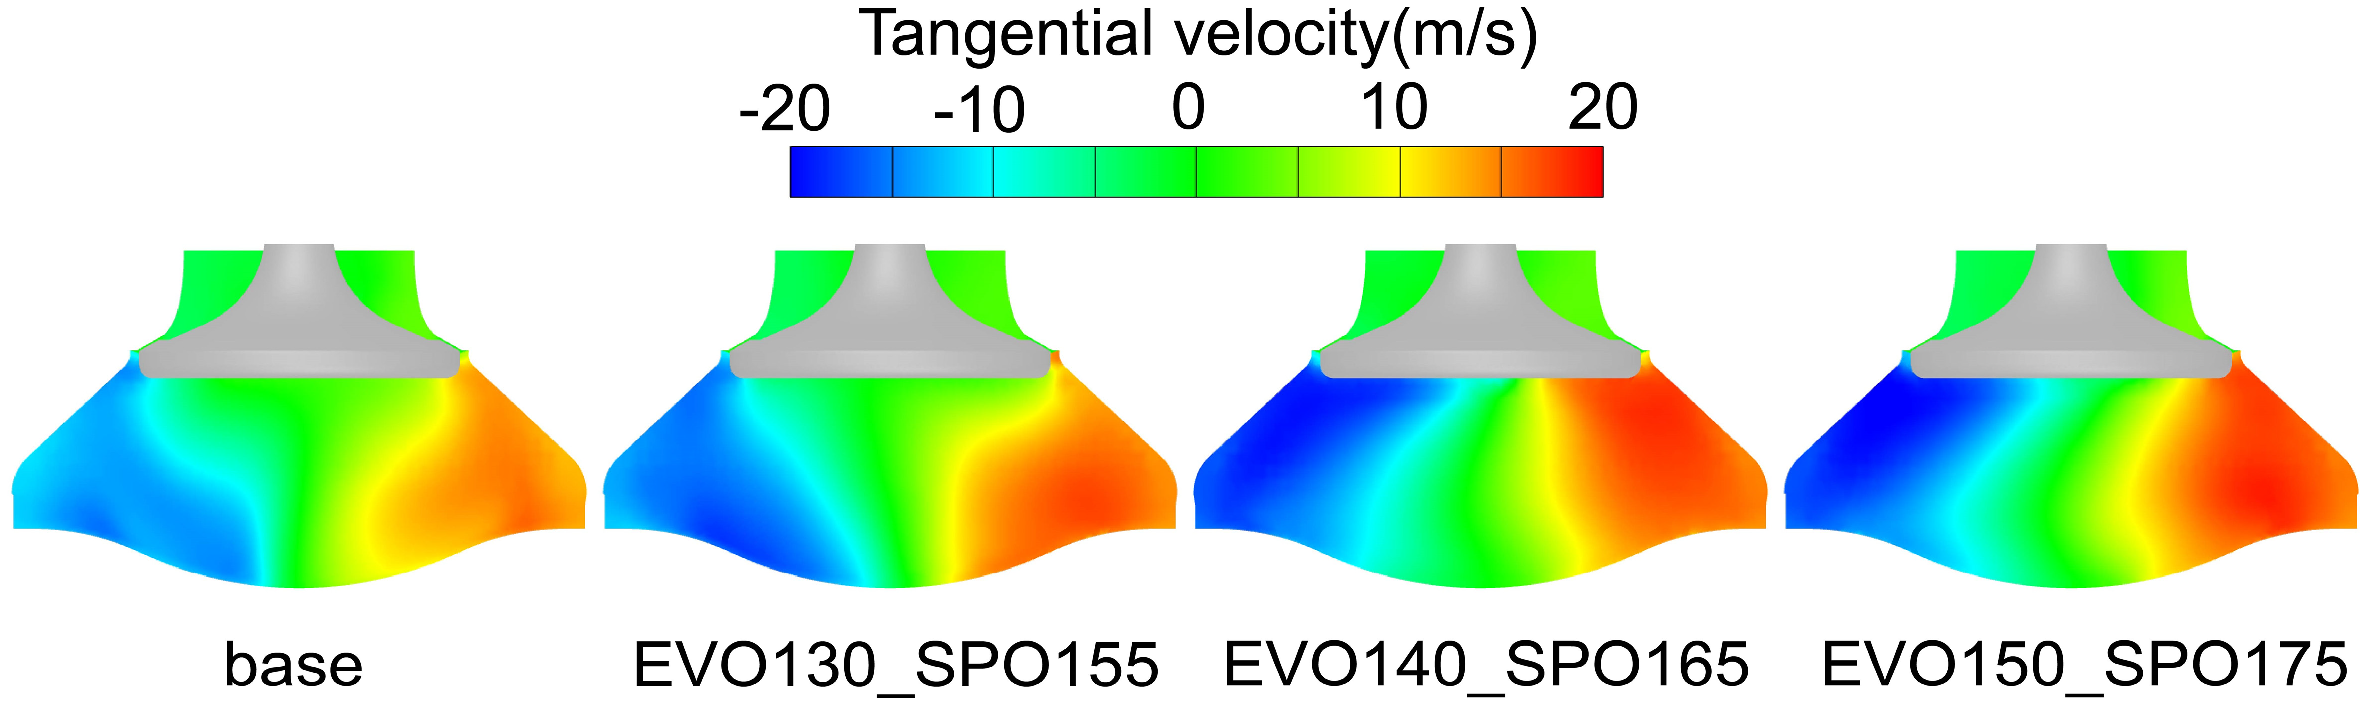
Figure 13 shows the variation in the in-cylinder swirl ratio at different EVO timings, while Figure 14 highlights the distribution of the tangential velocity at the TDC. The in-cylinder swirl ratio reached its peak value between 10 and 15°CA after the SPO, then it began to decline. This decrease was primarily due to the dominance of the axial flow, which disrupted the swirl structure, leading to the reduction of the swirl magnitude. By approximately 40°CA BTDC, the swirl ratio began to ascend since the exhaust valve was already sealed. The cooperative influence of the cylinder head and the piston movement inhibited the axial flow, thereby enhancing the swirl flow. Subsequent to this, as the fuel was introduced and the combustion occurred, the in-cylinder gas motion intensified. The swirl ratio started to wane as the injection ended. A delayed SPO corresponded to a more-pronounced swirl ratio at TDC, and in turn, a more potent peak swirl was observed during the combustion. With SPO timings of 155°CA ATDC, 165°CA ATDC, and 175°CA ATDC, the TDC swirl ratios were 8.2, 9.0, and 9.2, respectively. However, under the baseline’s valve timing, this ratio decreased to 7.3.
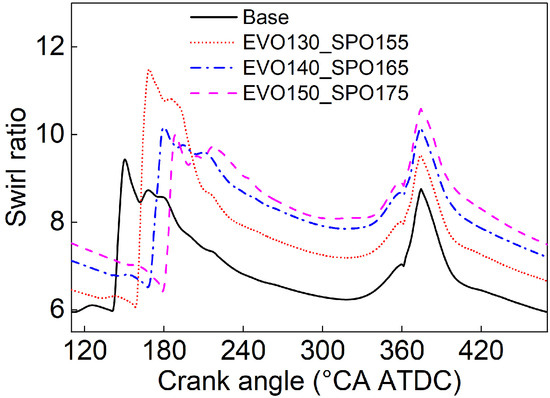
Figure 13.
In-cylinder swirl ratio at different SPO timings.

Figure 14.
Distribution of tangential velocity at TDC.
Table 4 presents the most-applied indicators for evaluating the scavenging efficiency of a uniflow scavenging engine. These include the delivery ratio, which refers to the proportion of total mass passing through the scavenging ports to the final fresh charge retained in the cylinder. The excess air ratio quantifies the relationship between the total fresh charge and the air mass needed for the stoichiometric combustion. Meanwhile, the residual gas coefficient measures the fraction of combustion residuals from the preceding cycle to the complete mass in the cylinder at the end of the gas exchange.
Table 4.
Parameters for evaluating the gas exchange process at various SPO timings.
When the baseline’s valve timing was employed, the delivery ratio remained at 1.50. This suggests that a third of the fresh charge moving through the scavenging ports will directly exit through the exhaust valve into the exhaust port, bypassing the combustion process. A high delivery ratio can be advantageous as it can promote a reduced residual gas coefficient. However, for the fresh air that does not undergo combustion, after pressurized, the fresh charge can directly influence the turbine after navigating through the associated piping and the cylinder. This mechanism enhances the turbocharging system’s performance, similar to the effect of bypassing the fresh air for the EGR implementation. Furthermore, an increased engine mass flow rate usually needs a diminished turbocharger efficiency at comparable boost ratios [22].
The simulation results illustrated that, as the SPO was delayed, the scavenging duration diminished, resulting in a decreased delivery ratio. Concurrently, there was an increment in the mass fraction of the residual gas, leading to a decline in the excess air ratio. When adjusting the SPO from 165°CA ATDC to 175°CA ATDC, the scavenging duration contracted by nearly half in relation to the baseline. In particular, in contrast to the alteration from 155°CA ATDC to 165°CA ATDC, all metrics indicated a more-marked decline. The residual fraction reached 0.11, and the excess air ratio rested at just 1.82.
3.4. Influence of VPT on Combustion Process and Engine Performance
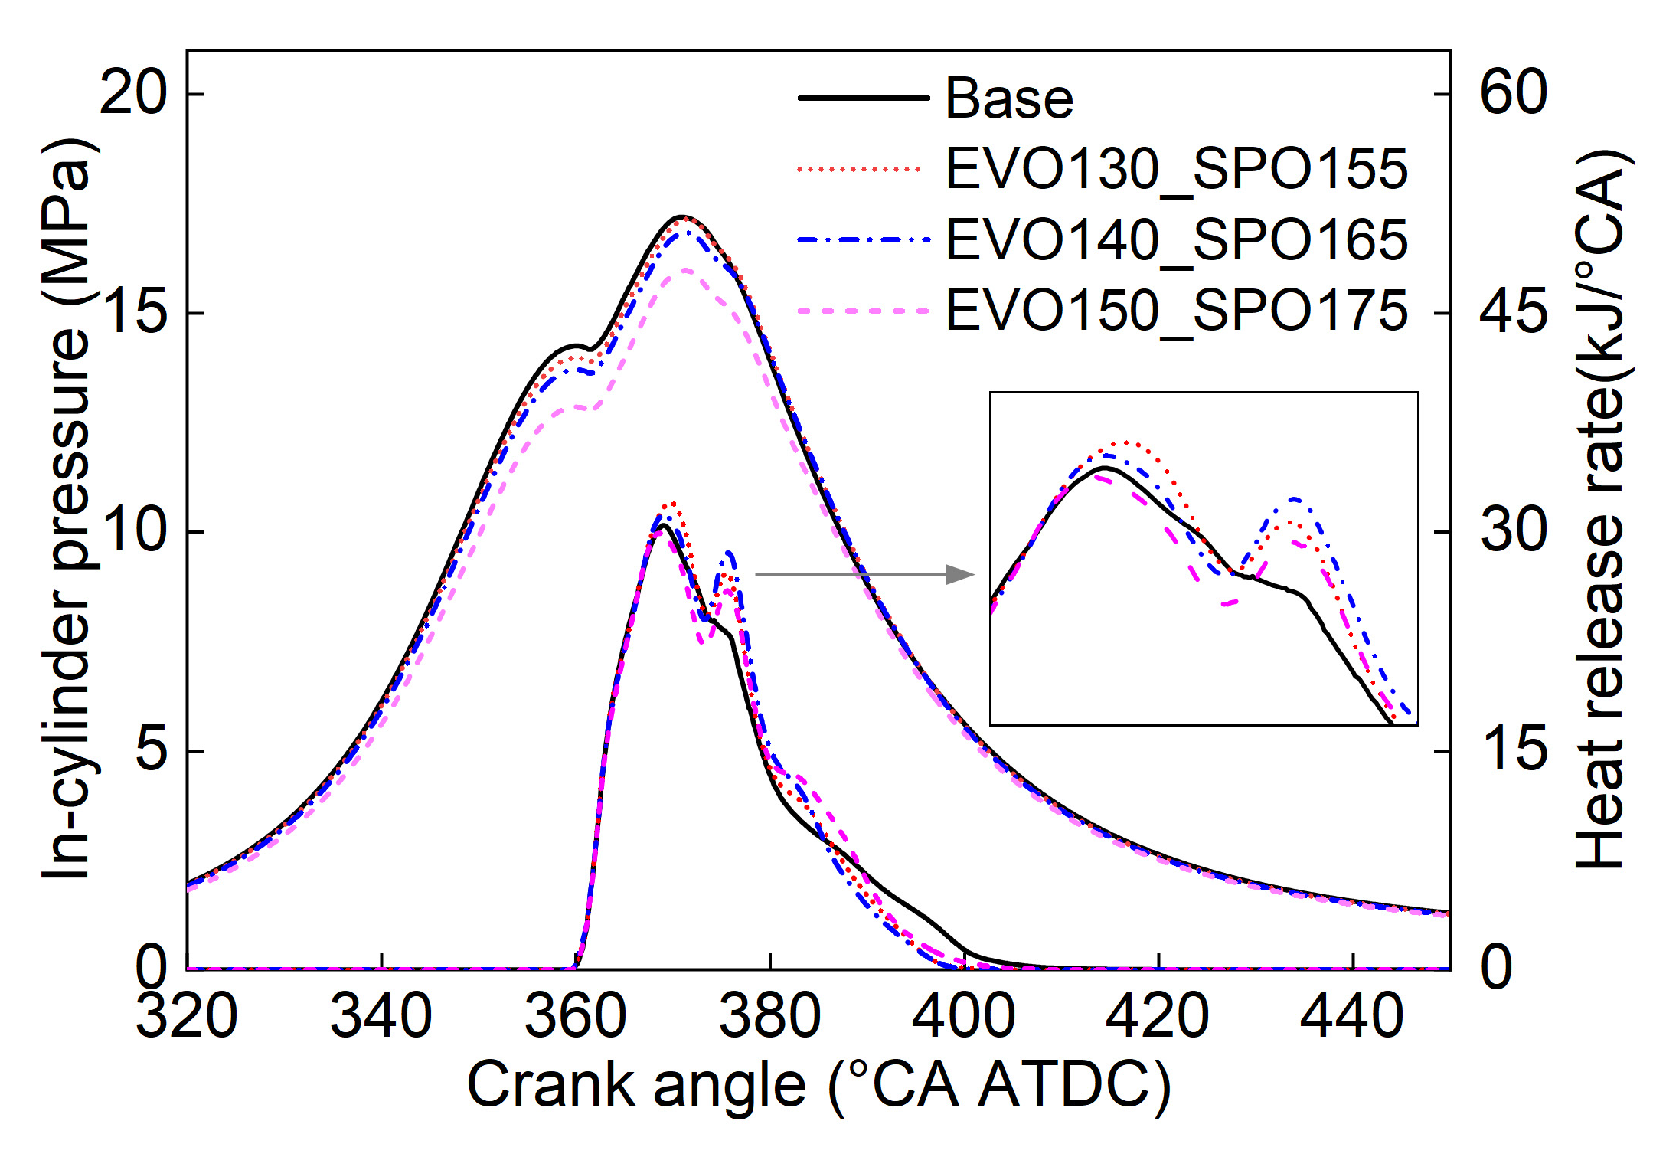
Figure 15 illustrates the impact of different SPO timings on the in-cylinder pressure and the heat release rate. It can be observed that the in-cylinder pressure gradually decreased with the delay of the SPO. This was attributed to the reduction in the scavenging duration, which was, in turn, adverse to the scavenging efficiency, making more burned gas left in the cylinder. Even though the scavenging pressure, exhaust pressure, scavenging temperature, and EVC timing were all identical, a greater amount of residual exhaust gas implies a higher initial in-cylinder temperature at the EVC movement. This resulted in a reduction in pressure at the end of the compression stroke with the same effective compression ratio, subsequently reducing the peak combustion pressure, which also exhibited a declining trend.
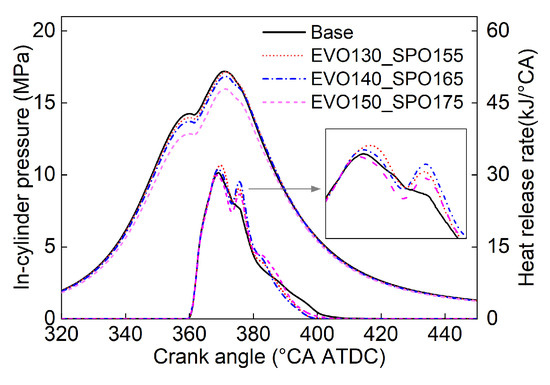
Figure 15.
In-cylinder pressure and heat release rates at different SPO timings.
With the adoption of the VPT strategy, the heat release rate curves, like the baseline, prominently exhibited a dual-peak characteristic. When the SPO was delayed to 155°CA ATDC and 165°CA ATDC, both the first and second peaks of heat release rate increased. This primarily benefitted from the rise in the swirl ratio. However, when the SPO was set to 175°CA ATDC, although the second peak remained higher than that of the baseline, a lower excess air ratio resulted in a reduced first peak.
Regarding the trough between the two peaks, it is evident that, as the SPO was delayed, the appearance of this inflection point progressively advanced. The main reason was that a larger swirl ratio caused the high-temperature gases in the current semi-region to contact the fuel entering the other half of the cylinder and its atomized mixture at a faster speed and earlier timing. This accelerated the combustion and heat release process, as shown in Figure 16.
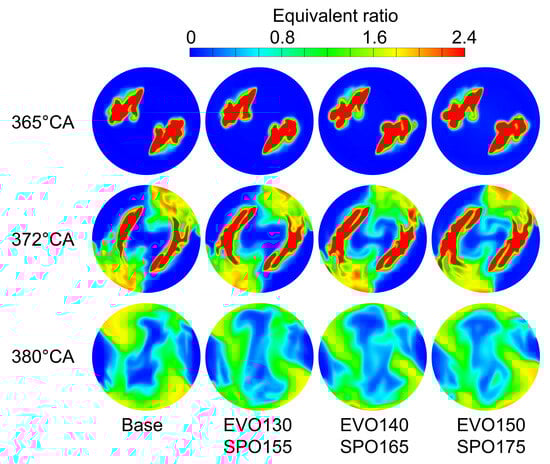
Figure 16.
Distribution of equivalent ratio at different SPO timings.
Figure 17 presents the influence of the SPO on the combustion phase. With the implementation of the VPT strategy, the variation in CA10 was minimal. The CA50 initially advanced and, then, retarded. This variation was primarily attributed to the fact that the positive effect of an increased swirl ratio on advancing the center of combustion became weaker than the negative influence caused by the reduction in the excess air ratio. The CA90 consistently advanced, indicating that the increase in the swirl ratio brought by the VPT strategy effectively shortened the combustion duration.
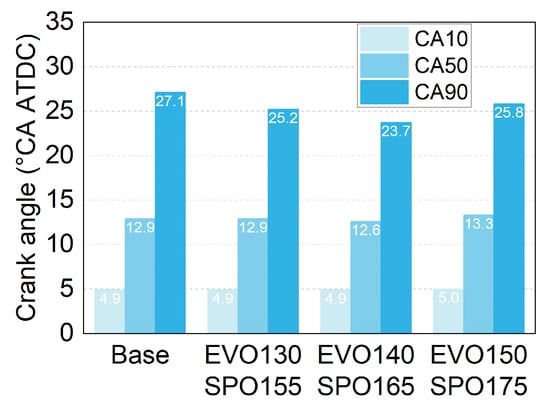
Figure 17.
Influence of SPO on combustion phase.
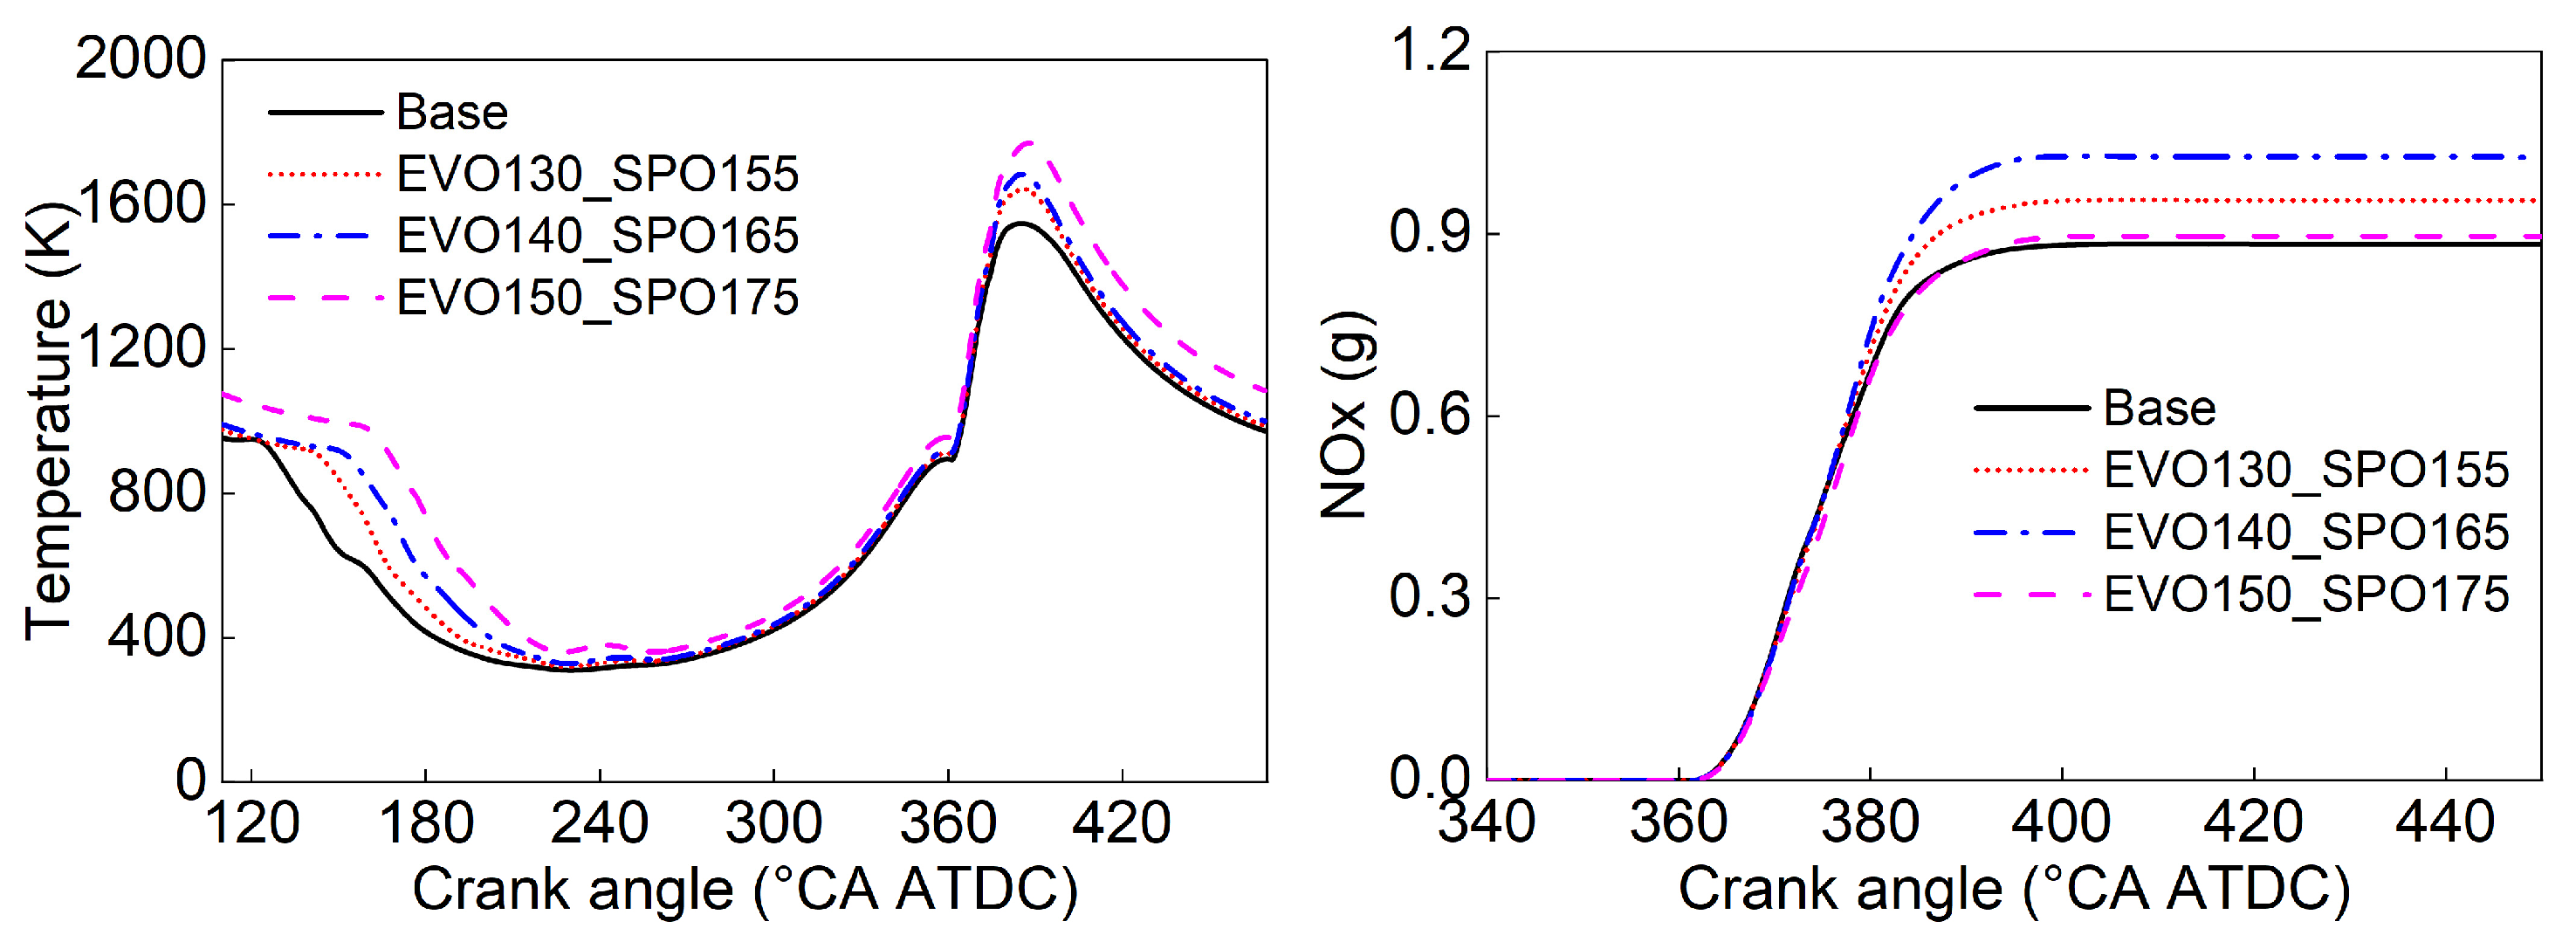
Figure 18 illustrates the influence of the SPO on the in-cylinder temperature and NOx formation. As the SPO was delayed, the in-cylinder temperature progressively rose. This increment was primarily attributed to the reduced scavenging duration, which resulted in increased residual gases. These residual gases elevated the average temperature during the compression phase. During the combustion process, a reduced proportion of fresh charge meant that, at the same level of heat release, there was a greater rise in the in-cylinder temperature.
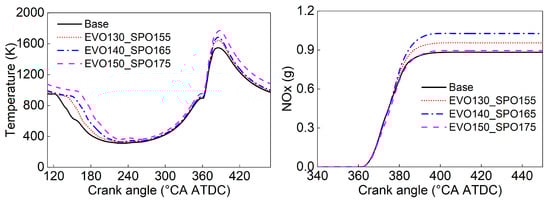
Figure 18.
Influence of SPO on in-cylinder temperature and NOx formation.
The formation of NOx was predominantly determined by the high temperature and rich oxygen conditions. As the SPO was delayed, an increased swirl ratio ensured a better fuel–air mixing, resulting in enhanced formation of NOx. However, when the SPO was further delayed, the in-cylinder excess air ratio decreased, suppressing the rich oxygen condition. Consequently, the rate of NOx formation slowed down, and the cumulative amount of NOx generated no longer rose.
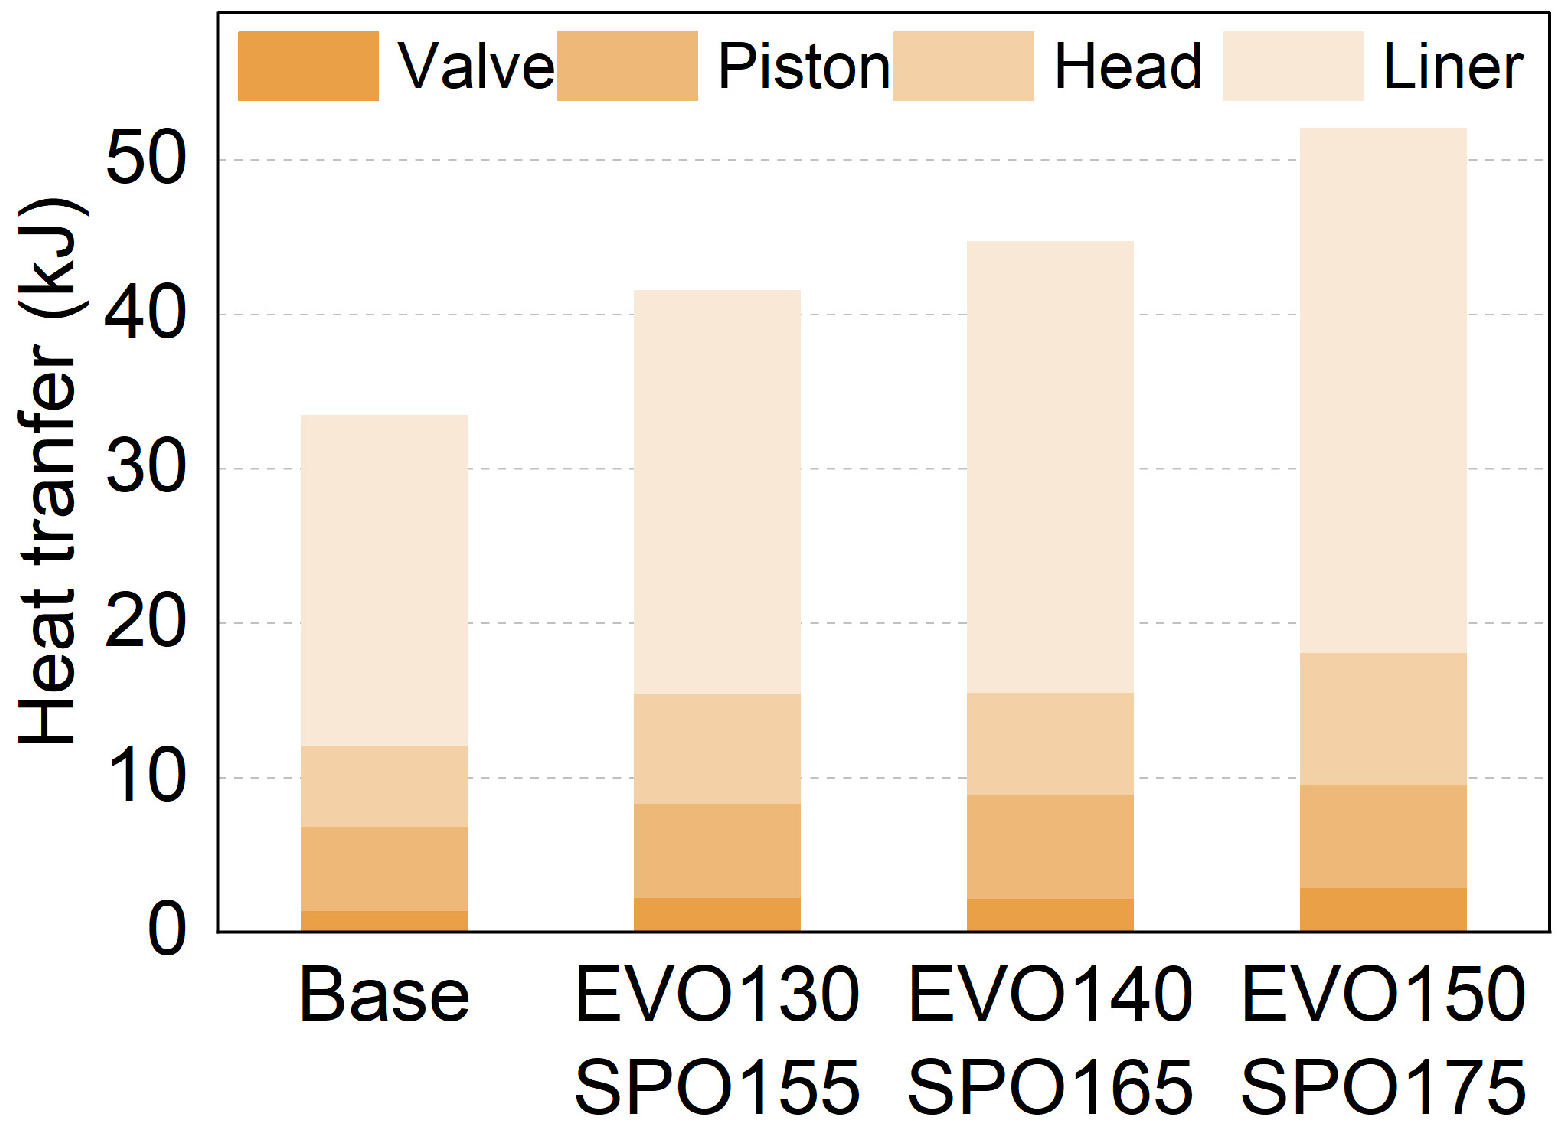
Figure 19 gives the impact of the SPO timing on the heat transfer loss within the cylinder. As the SPO was delayed, the heat transfer loss gradually increased. The enhanced gas flow and the elevated in-cylinder temperatures contributed to an increased heat transfer between the charge and the cylinder wall.
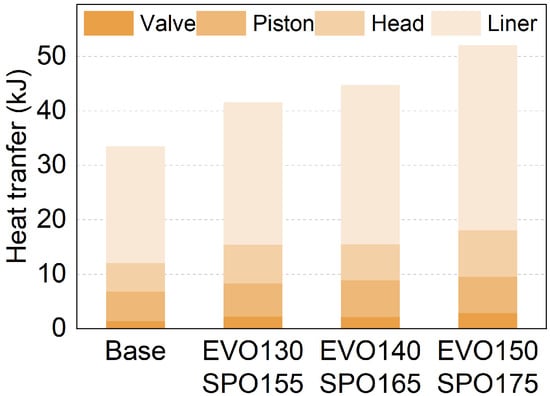
Figure 19.
Influence of SPO on in-cylinder heat transfer loss.
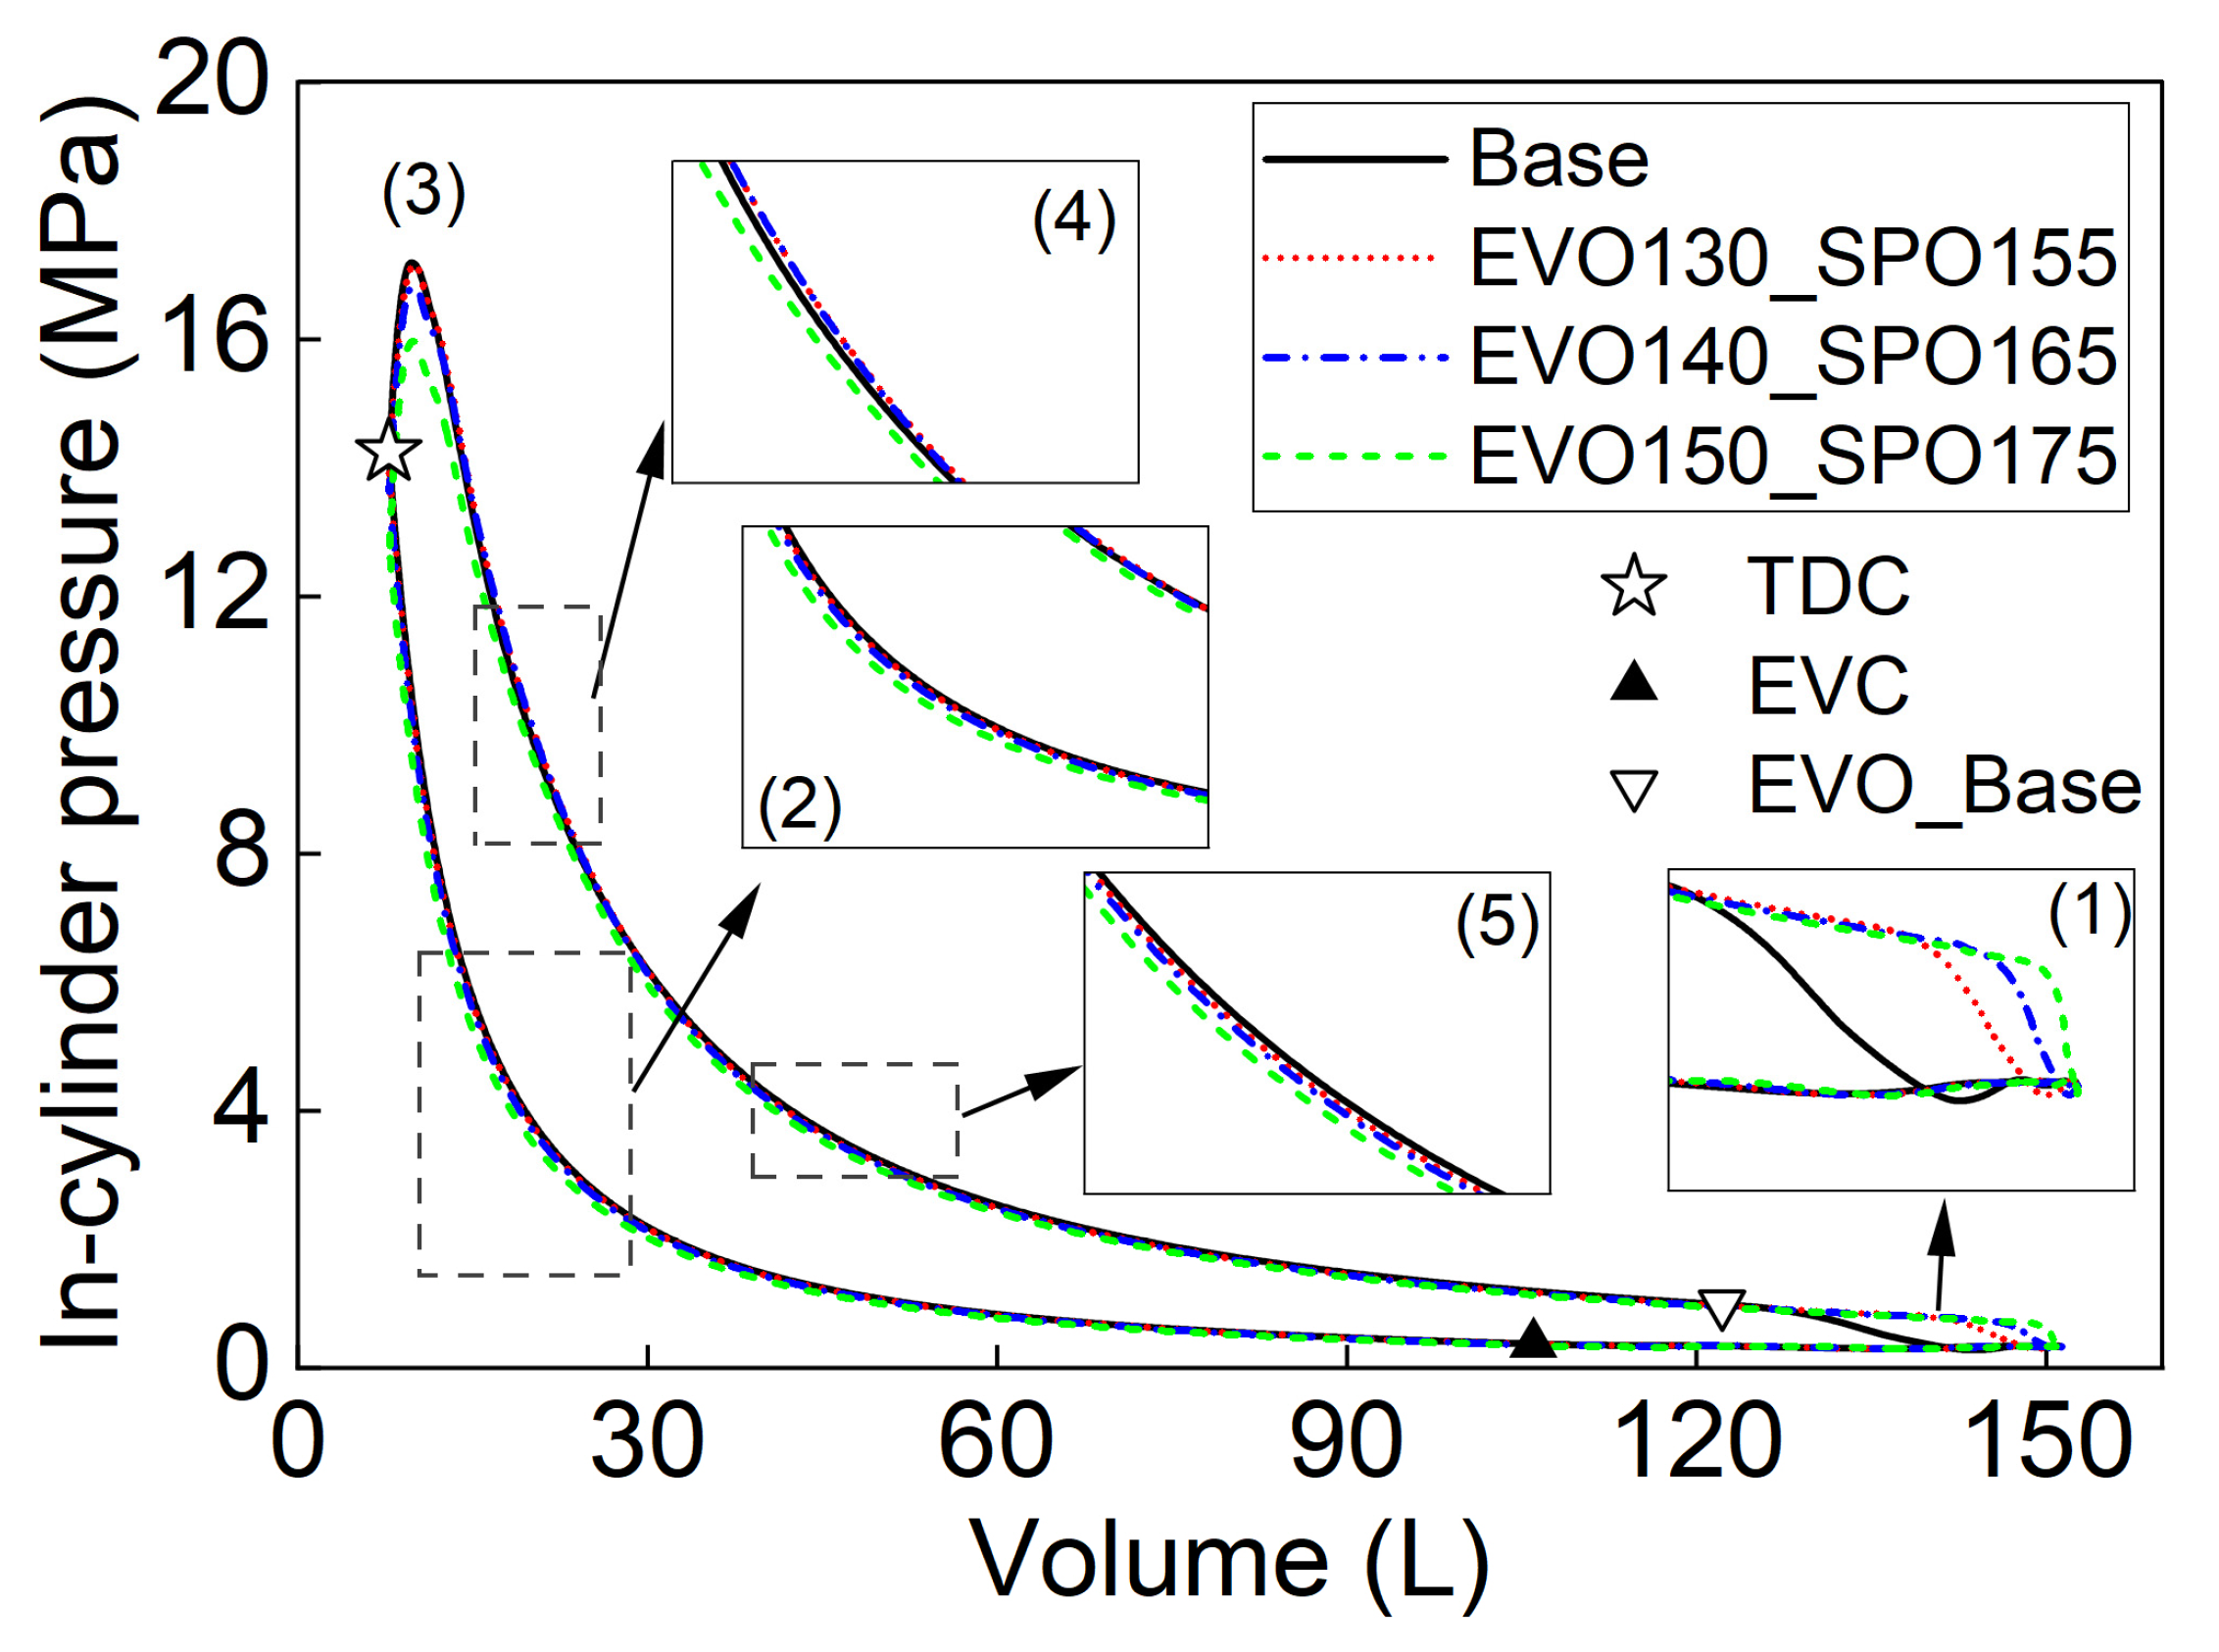
Figure 20 shows the P–V diagram of the engine’s thermodynamic cycle with different SPO timings, obtained from the simulation results. With the employment of the VPT strategy, during the compression stroke, more expansion work and less negative work could be obtained along with the delayed EVO. When the EVO was delayed to 150°CA ATDC, the in-cylinder pressure decreased to the scavenging pressure directly, as shown Region (1), the main reason for which was that, for the baseline, the piston moved only 3.5% of the engine stroke from 150°CA ATDC to 180°CA ATDC, while for the VPT strategy, the piston covered 14.8% of the engine stroke from 110°CA ATDC to 140°CA ATDC. This suggests that further delaying the EVO would result in marginal gains in positive work. With the postponement of the SPO, the in-cylinder pressure during the compression phase will decrease compared to the baseline, as shown in Region (2). This means the negative work during compression will decrease. From Region (3), it can be found that both Pcom and Pmax continuously declined with the retarding of the SPO.
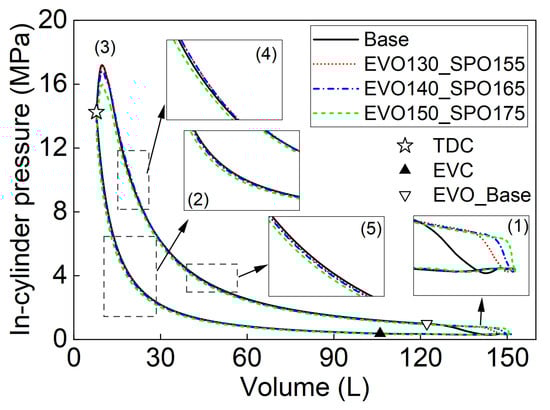
Figure 20.
Influence of SPO on P–V diagram of thermodynamic cycle.
When the SPO was delayed to 155°CA ATDC and 165°CA ATDC, the in-cylinder pressure during the mid-expansion phase was higher than that of the baseline, but it dropped below the baseline during the late expansion phase, as shown in Regions (4) and (5). This was mainly due to the accelerated heat release rate during the middle of the expansion phase, leading to the gradual increase of the in-cylinder pressure. However, along with the end of combustion, the in-cylinder pressure dropped quickly, which was due to the expansion effect and the heat transfer influence. The enhanced gas flow amplified the heat transfer, causing a swifter decline of the in-cylinder pressure. When the SPO was further delayed to 175°CA ATDC, the in-cylinder pressure throughout the expansion phase still remained lower than the baseline, and this was primarily attributed to the significant reductions in the peak combustion pressure and excess air coefficient.
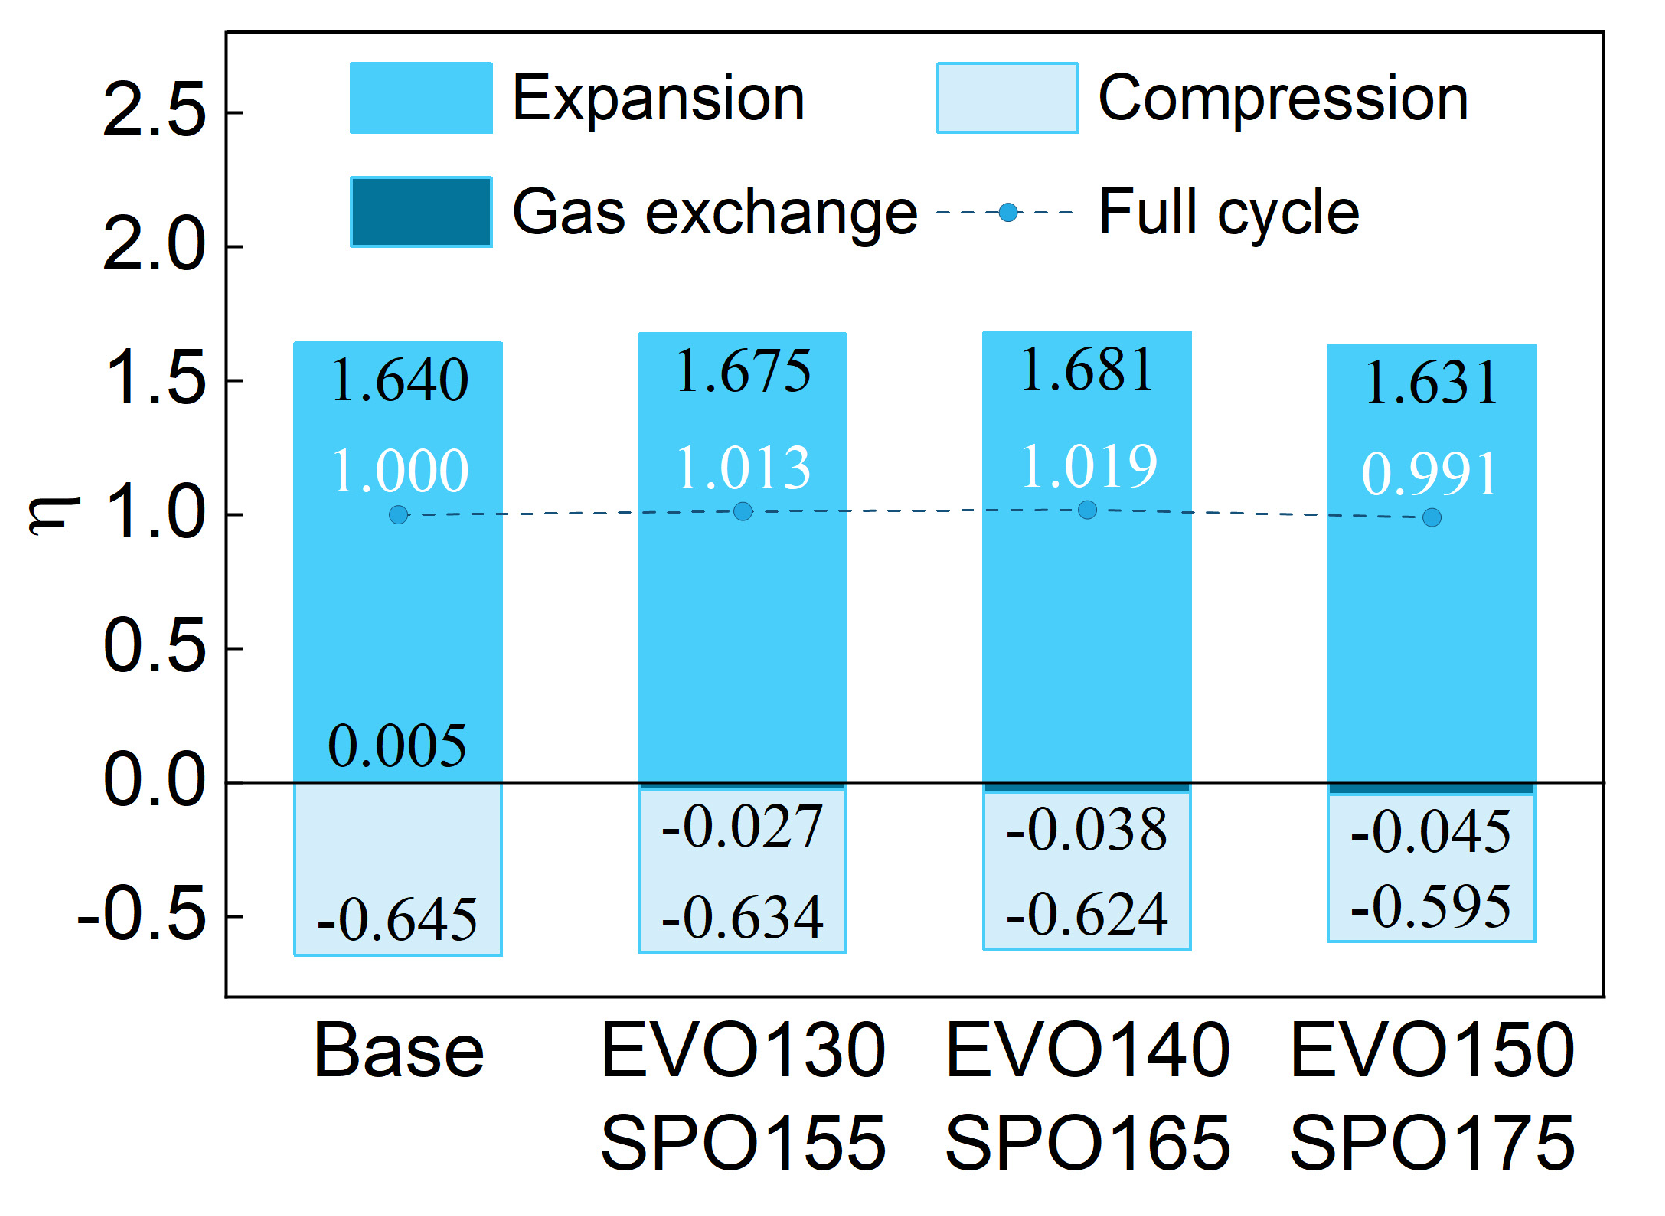
Figure 21 presents the results obtained from the segmental integration of the P–V diagram, utilizing the followed formulas from (7) to (11) to calculate the ratio of the indicated work to the indicated work, at the baseline engine in various phases.
where i means indicated and j denotes the different processes within the engine cycle.

Figure 21.
Influence of SPO on indicated work.
The indicated work over the entire cycle initially increased and, then, decreased with the delay of the SPO. The highest could be reached when the SPO reached 165°CA ATDC, with an increase of 1.9% compared to the baseline. The increase of the effective expansion ratio resulted in a maximum 2.5% rise in the indicated expansion work compared to the baseline. However, when the SPO timing was further delayed to 175°CA ATDC, there was a dramatic decline below the baseline in the indicated expansion work. This suggests that the additional expansion work gained from increasing the effective expansion ratio could no longer compensate for the adverse effects caused by the reduction in the peak cylinder pressure.
The negative compression work gradually decreased with the retarding of the SPO. The reduction of the scavenging duration resulted in a deteriorated gas exchange, leading to the increase of the high-temperature residual exhaust gases in the cylinder and the decrease of the compression pressure compared to the baseline.
During the gas exchange phase, the exhaust valve remained open, and the positive work was relatively minor in the whole contribution. Notably, during the gas exchange process of the baseline, there was a 70°CA duration from the EVO to the BDC, where the piston performed positive work. With the delay of the EVO, the period of positive work continuously decreased, while the negative work from the BDC to the EVC remained relatively stable. As a result, the indicated work during the scavenging phase transitioned from positive to negative.
3.5. Compensating Scavenge Air Mass
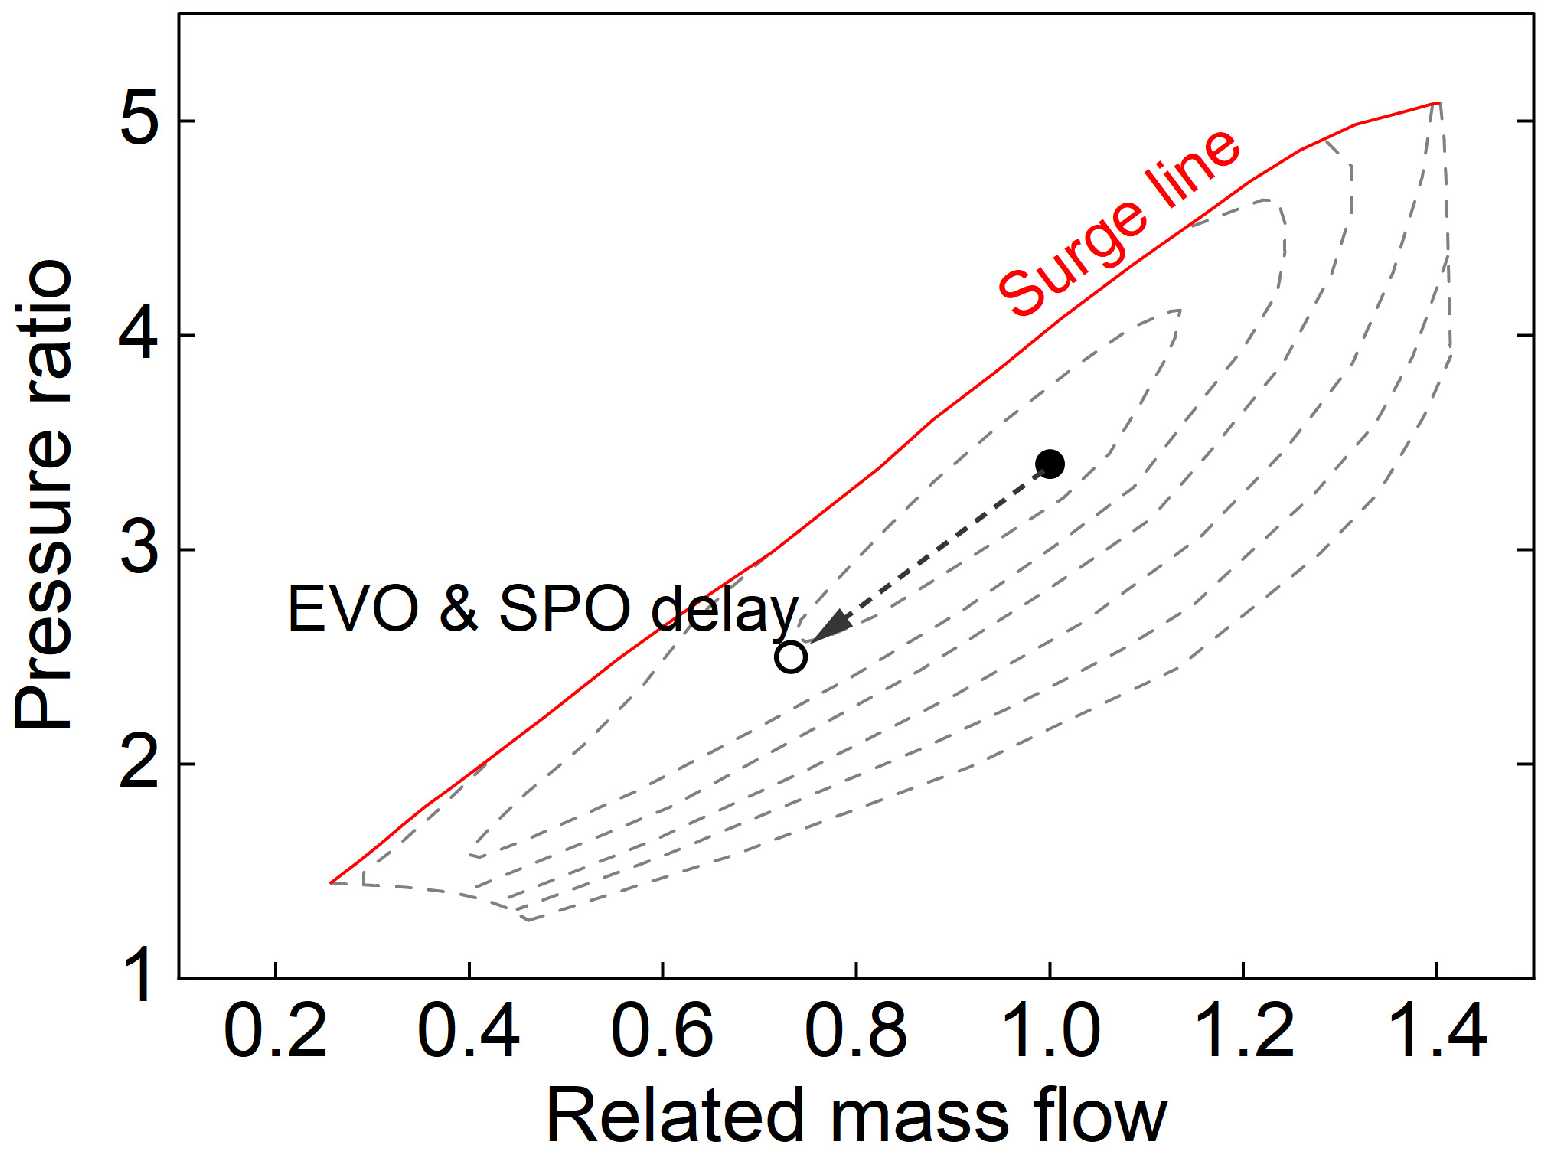
From the aforementioned analysis, it was evident that introducing the VPT strategy could effectively improve the engine fuel consumption. However, the reduction in the scavenging duration led to a decrease in the mass flow rate. Figure 22 shows the change in the direction of the compressor operating point after adopting the VPT strategy. Although the compressor might still operate within a high-efficiency range, the decline in the turbocharging ratio is noteworthy, as this will directly result in the engine power being below the baseline level. Modern marine low-speed two-stroke engines are usually equipped with efficient turbocharging systems. To maintain the same turbocharging ratio with reduced mass flow, an enhancement in the efficiency of the turbocharging system is imperative. Adopting the two-stage turbocharging system is a potential solution [22]. Considering the intricate matching of two-stage turbocharging systems and the non-negligible costs associated with them, this study further explored the feasibility of solely introducing the VPT strategy, that is through a redesign of the scavenging process, ensuring that the existing turbocharging system operates efficiently.
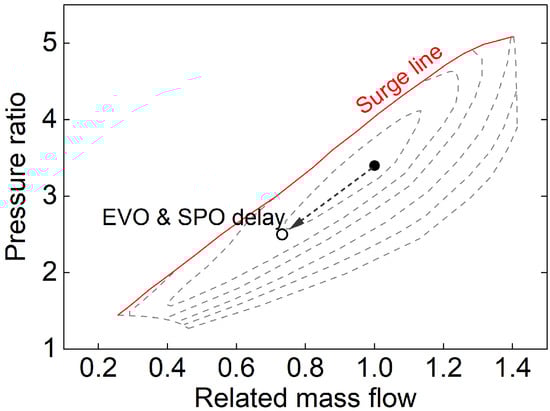
Figure 22.
Influence of VPT strategy on compressor operating point.
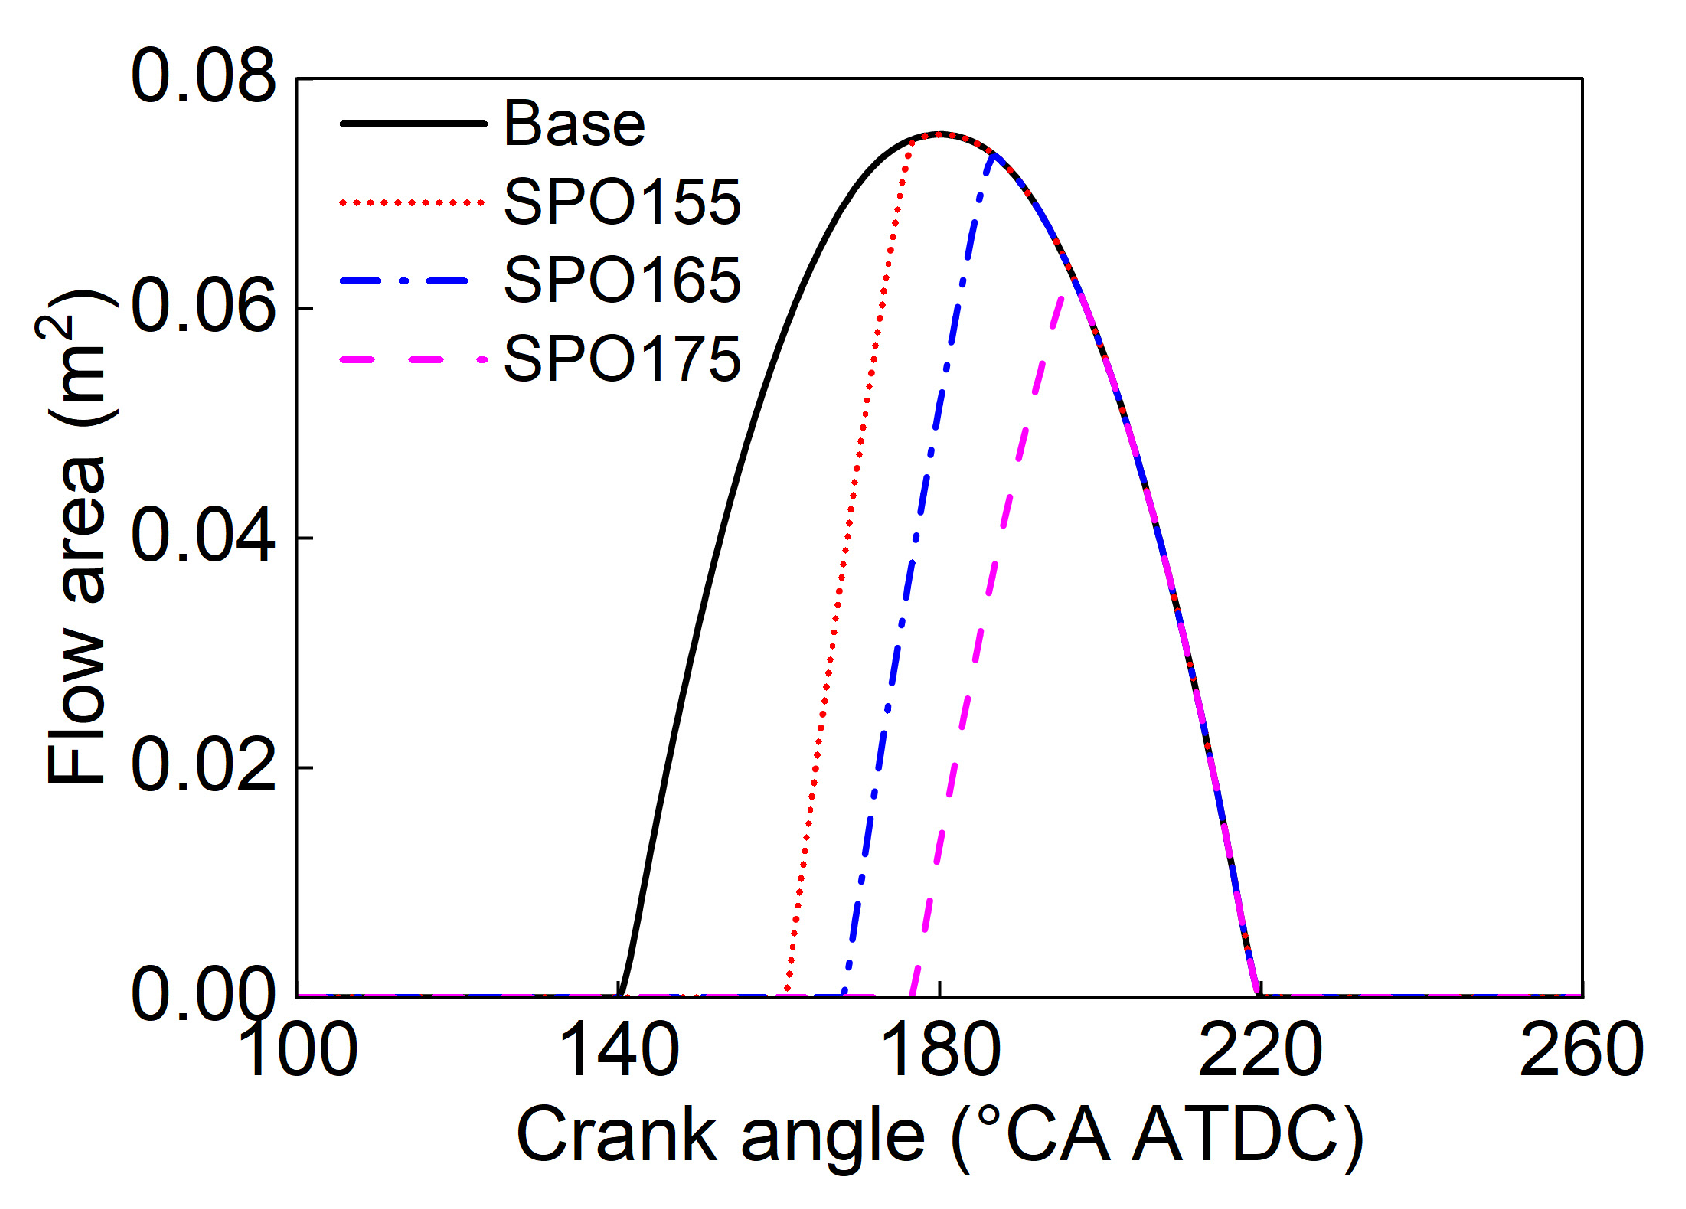
Figure 23 provides a schematic representation of the scavenging ports’ flow area. Figure 24 displays the flow area corresponding to different SPO timings. In order to enhance the overall mass flow rate after introducing the VPT strategy, parameterized studies on the sleeve velocity, the scavenging ports’ height, and the scavenging ports’ position were conducted, based on the reference of the case EVO140_SPO165.
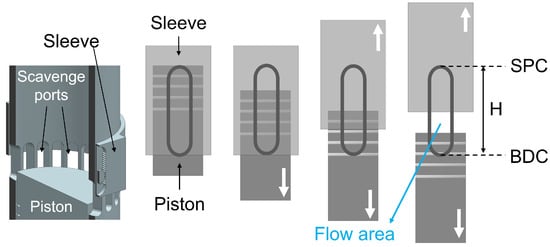
Figure 23.
Flow area of scavenging ports with VPT.
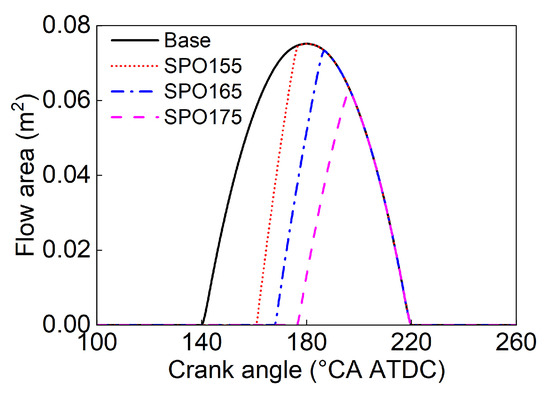
Figure 24.
Influence of SPO on flow area.
Table 5 presents the simulation matrix of various sleeve velocities or scavenging ports with different VPT strategies. The EVO timing was set at 140°CA ATDC and the SPO timing at 165°CA ATDC. The sleeve velocity for Levels 1 through 6 ranged from 2 to 7 mm/°CA, respectively. The calculation schemes for the increased scavenging port heights ranged from Levels 1 to 6, corresponding to heights of 108 mm, 136 mm, 169 mm, 206 mm, 248 mm, and 294 mm. These heights corresponded to SPC intervals of 5°CA. Raising the ports’ position means the scavenging ports were shifted upward without modifying their heights to delay the SPC timing, with the interval also set at 5°CA. When the SPC was at 245°CA ATDC, the scavenging durations matched those of the baseline setup, specifically from 165 to 245°CA ATDC and from 140 to 220°CA ATDC, respectively.
Table 5.
Simulation matrix of various sleeve velocities or scavenging ports with the VPT strategy.
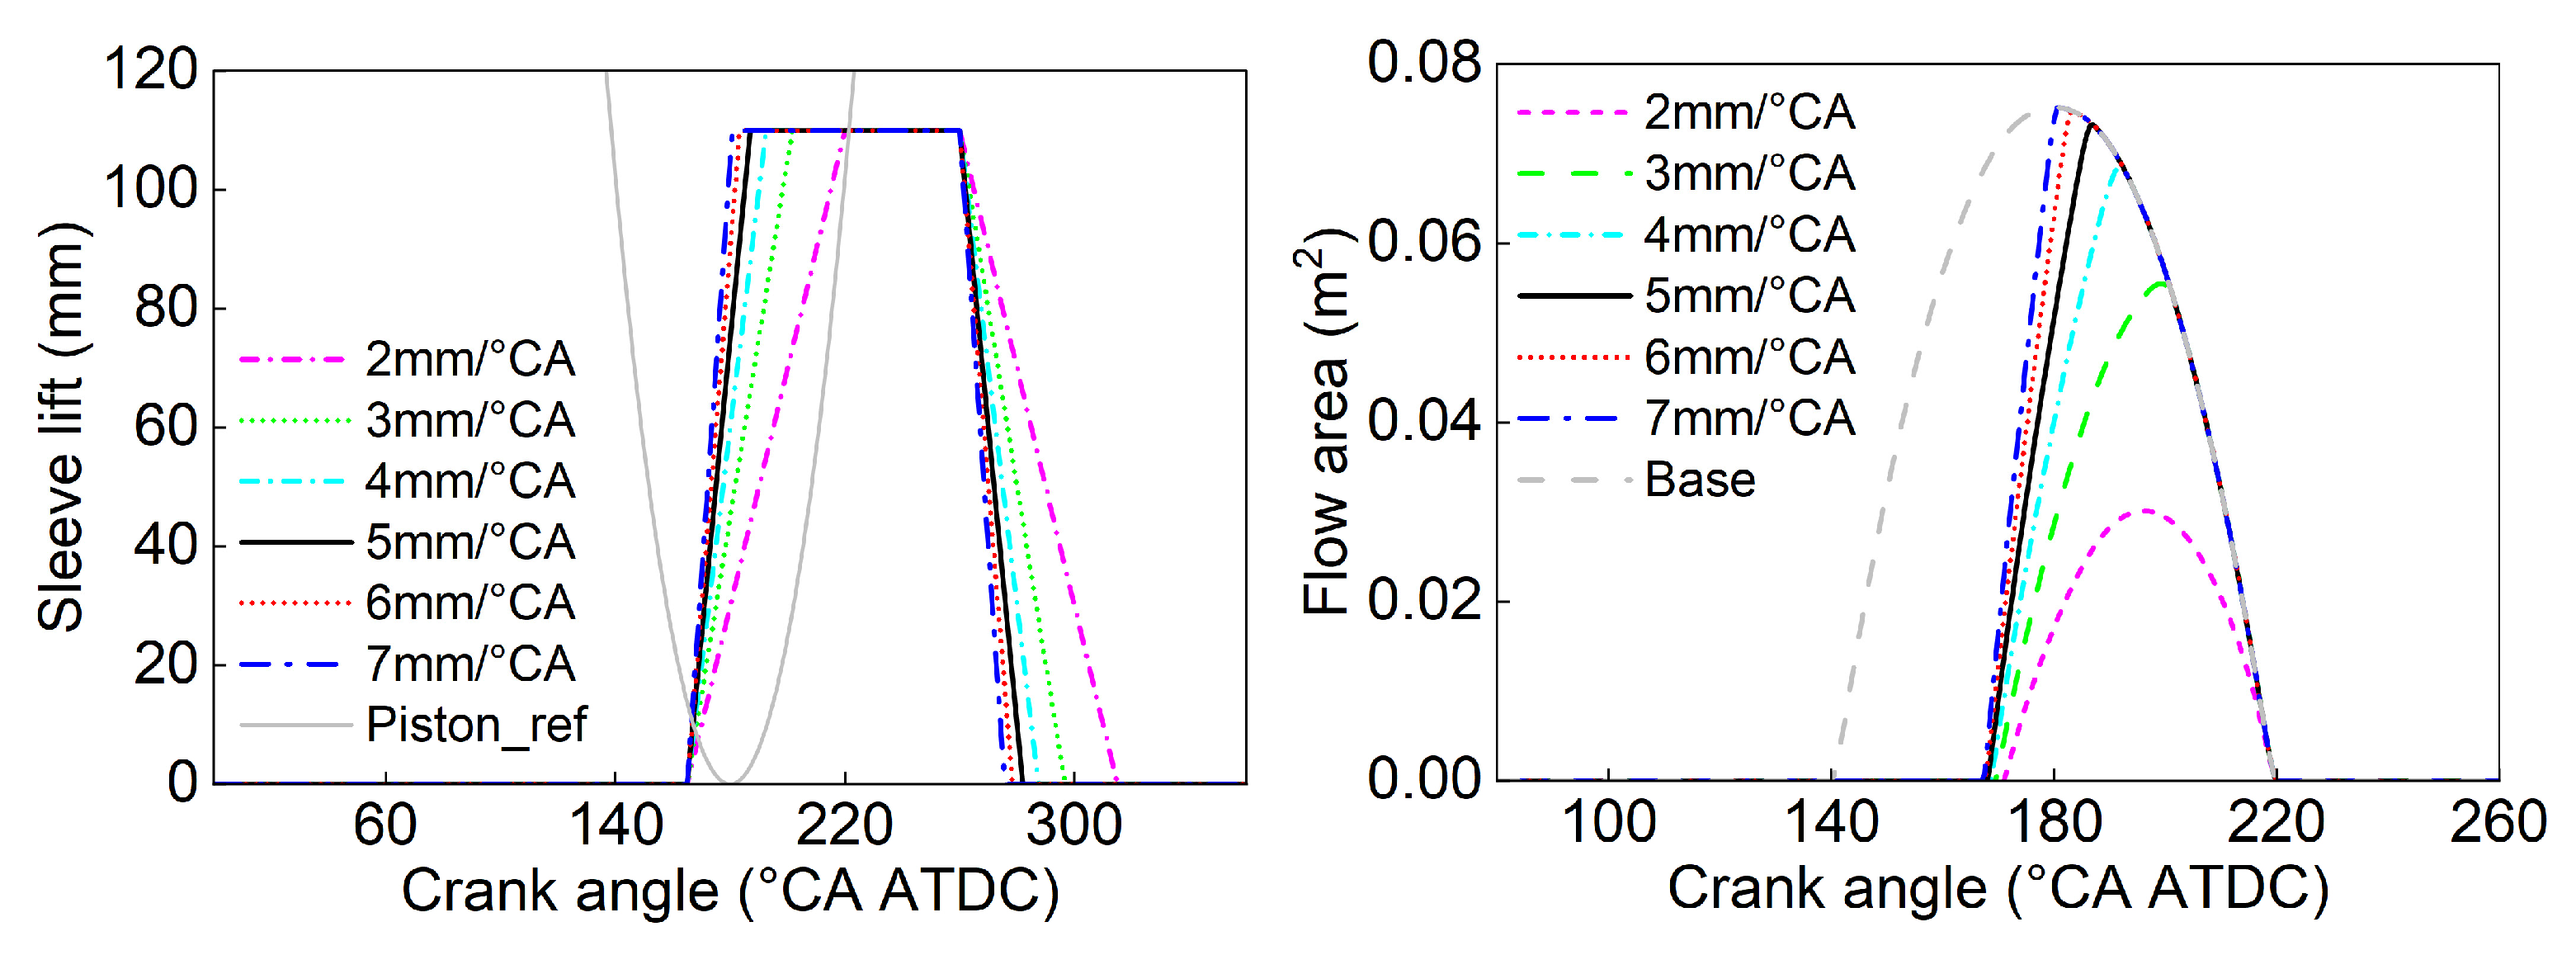
Figure 25 presents the schematic of the sleeve’s lift and flow area under varying sleeve velocities, where the gray solid line represents the distance from the piston to the bottom edge of the scavenging ports. It is evident that the sleeve’s velocity primarily affected the flow area during the initial stages of scavenging port opening. Furthermore, when the sleeve velocity surpassed 5 mm/°CA, variations in the flow area curve became less pronounced.
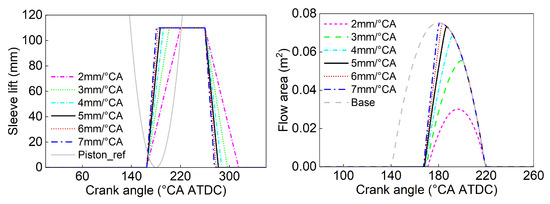
Figure 25.
Lift of sleeve and flow area under different sleeve velocities.
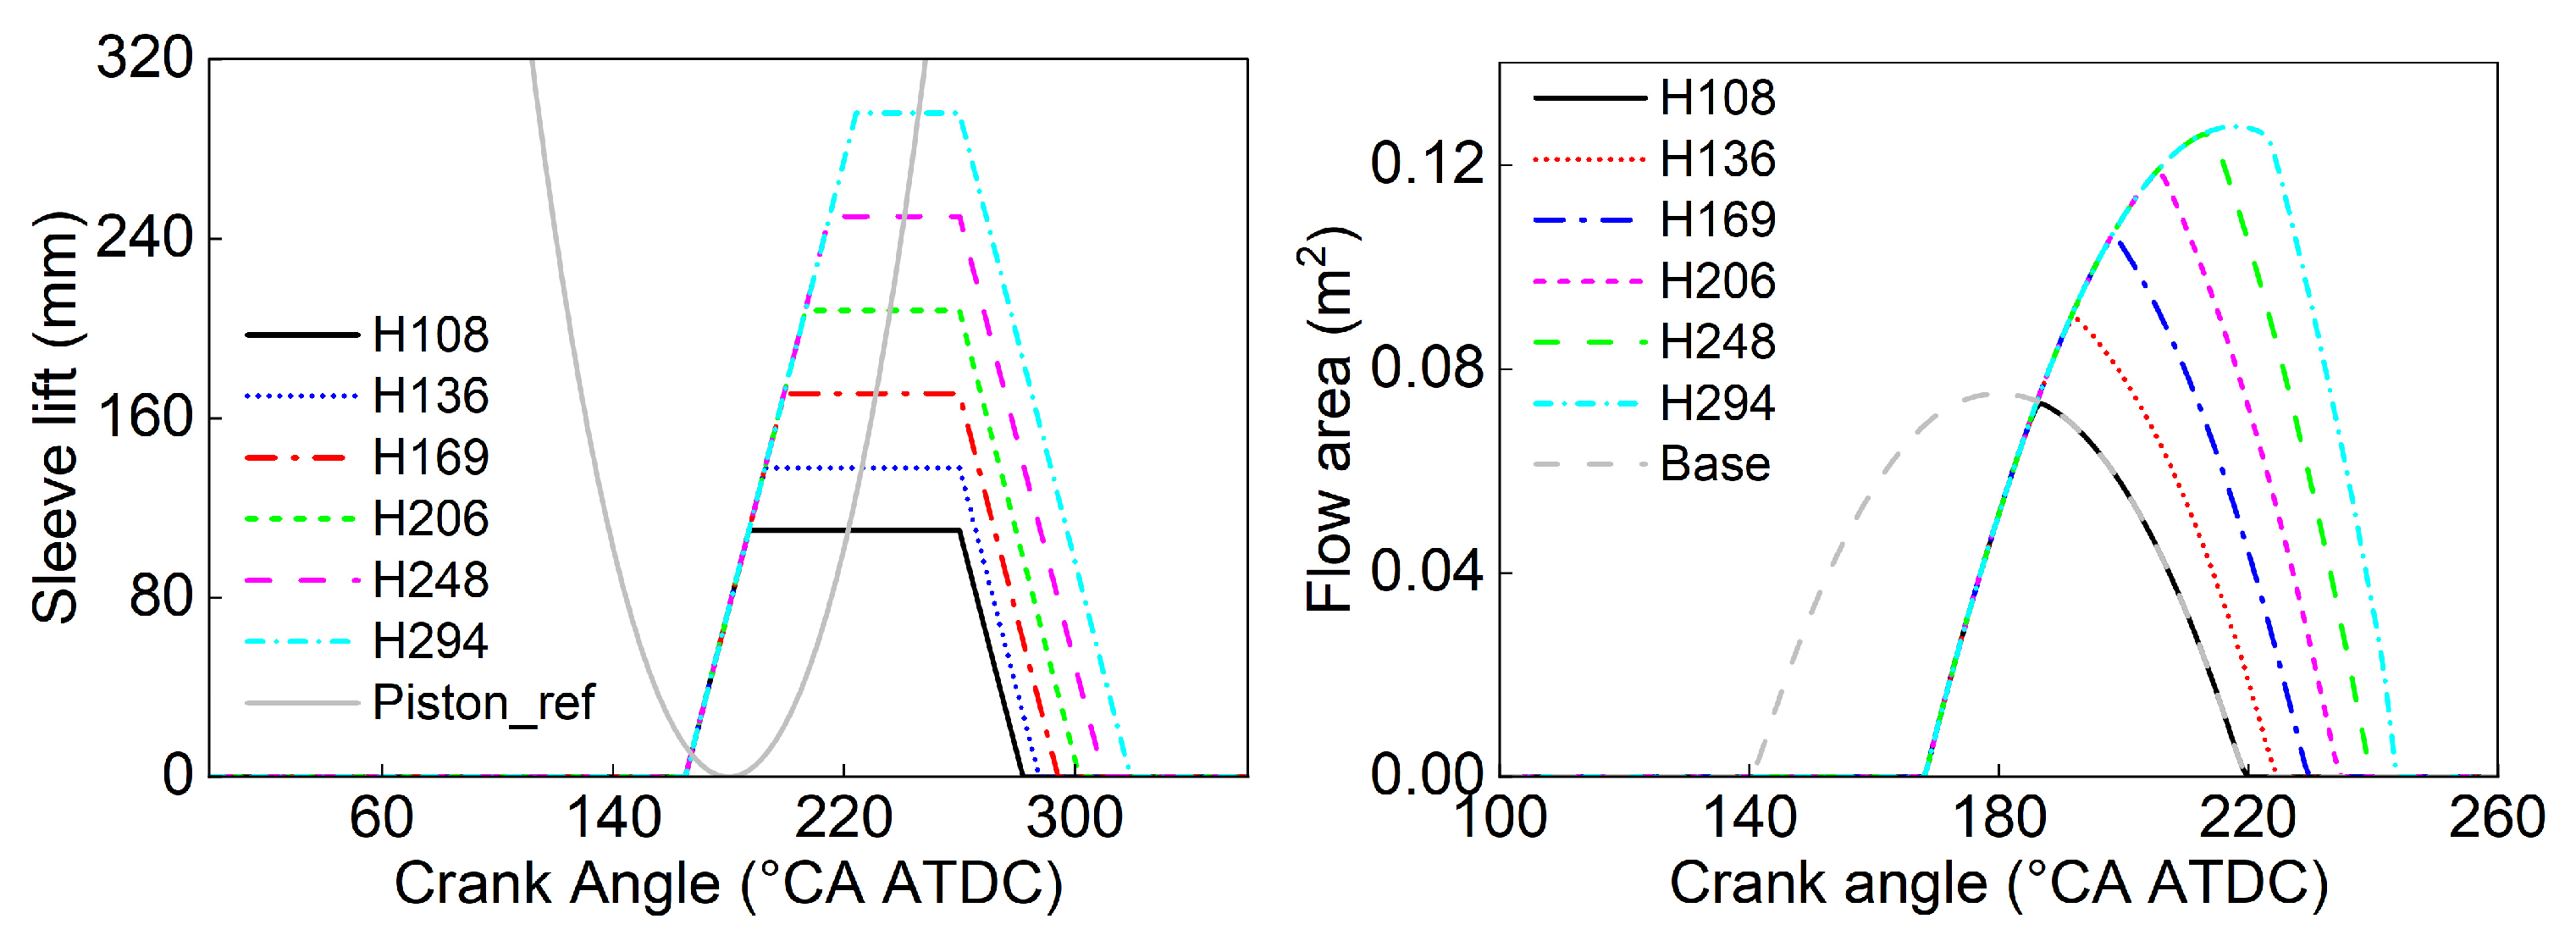
Figure 26 illustrates the sleeve’s lift and the flow area at different scavenging port heights. As mentioned above, the increase in the scavenging port height was based on a 5°CA interval. The further the SPC was delayed, the greater the required increase in the scavenging port height would be. With the augmentation of the scavenging port height, the maximum flow area gradually enlarged. When the height extended to 294 mm (SPC = 245°CA ATDC), the maximum flow area was nearly twice that of the baseline’s configuration.
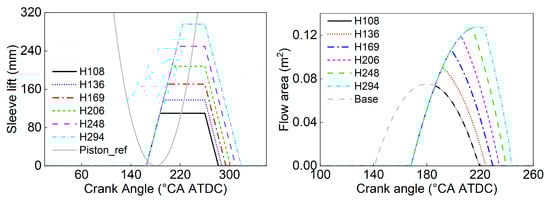
Figure 26.
Lift of sleeve and flow area at different scavenging port heights.
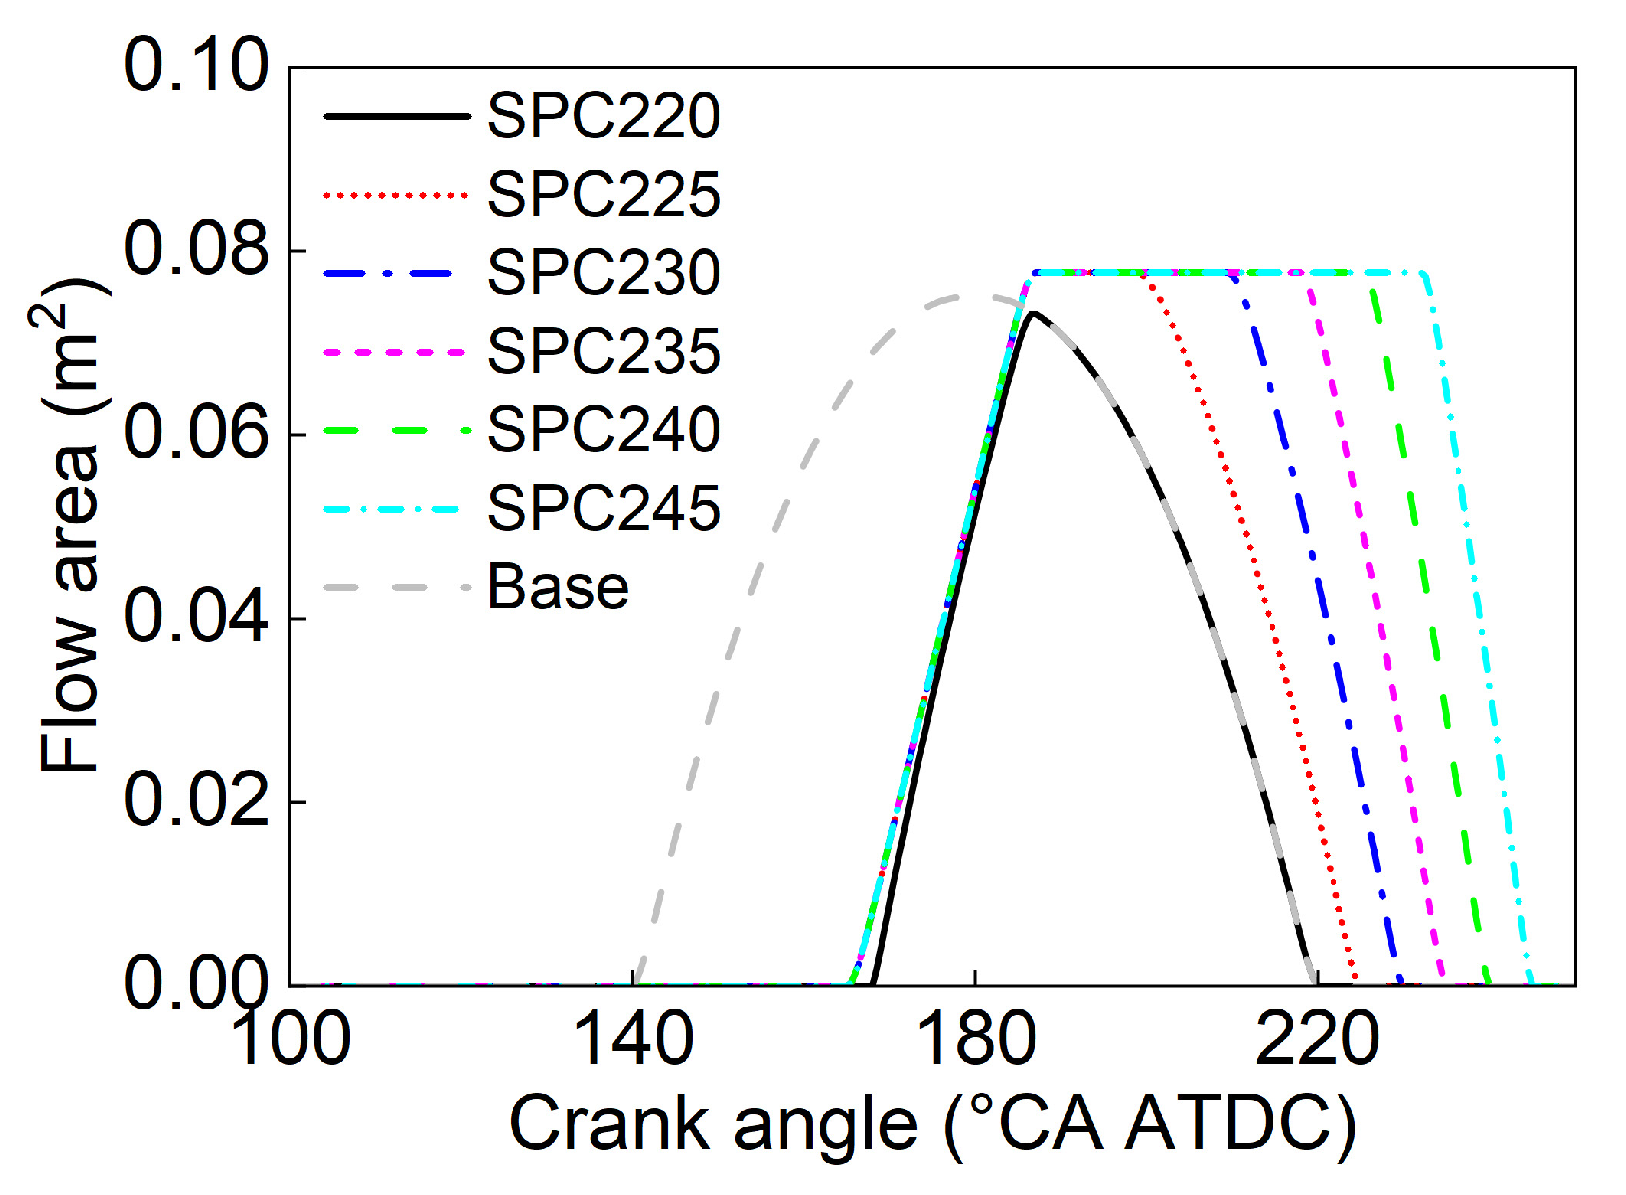
Figure 27 illustrates the flow area at different port positions, with the lift of the sleeve remaining consistent with the baseline. The scavenging port was progressively shifted upwards in intervals of 5°CA. The upper edge of the modified scavenging port in this scheme aligned with the upper edge of the scavenging port with increased height (at the same SPC level), but the height of the scavenging port remained consistent with the baseline. It can be observed that, by raising the position of the scavenging ports, the maximum flow area remained consistent with the baseline, while the scavenging duration continually increased.
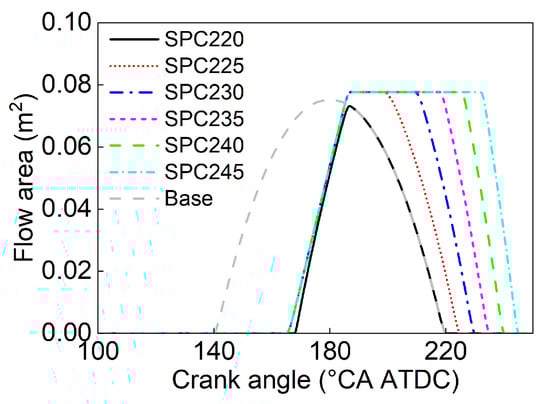
Figure 27.
Flow area at different port positions.
Figure 28 illustrates the impact of three different schemes on the total mass flow through the scavenging ports and in-cylinder residual exhaust gas. It can be observed that both increasing the height of the scavenging ports and raising the ports’ position can effectively augment the cumulative mass flow. When the height of the scavenging ports reached 284 mm, corresponding to an SPC of 240°CA ATDC, the mass flow was already comparable to the baseline. However, only when the scavenging ports were shifted upwards to an SPC of 245°CA ATDC did the mass flow match the baseline, maintaining a consistent scavenging duration of 80°CA. Increasing the sleeve velocity had a pronounced effect on the flow area at the lower levels. However, after the sleeve velocity exceeded 4 mm/°CA, the fresh charge through the scavenging ports only saw minor variations.
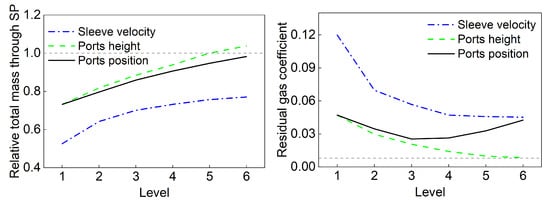
Figure 28.
Influence of sleeve velocity, ports’ height, and ports’ position on the total mass through the scavenging ports and in-cylinder residual gas.
Regarding the residual exhaust gas in the cylinder, it is evident that increasing the height of the scavenging port can significantly reduce the residual burned gas. When the scavenging port height reached 294 mm, the level of residual exhaust gas aligned with the baseline. Increasing the sleeve velocity can similarly reduce the residual exhaust gas in the cylinder, but a diminishing return was observed, with the minimum still being about five-times that of the baseline. When the scavenging port was shifted upwards, the trend of residual exhaust gas changed and would no longer be linear. After shifting to a position where the SPC was later than 235°CA, the residual exhaust gas in the cylinder started to increase. This was because, with the overall upward movement of the scavenging port, the residual exhaust gas between the piston and the lower edge of the scavenging port did not move upward with the flow during the piston’s downward movement. This portion of exhaust gas was only pushed away from the piston during its upward motion, when the piston exceeded the lower edge of the scavenging port due to the action of the fresh charge. Therefore, the amount of residual exhaust gas in the cylinder is partly dependent on the distance between the BDC and the lower edge of the scavenging port and partly on the duration it takes for the piston to move from the lower to the upper edge of the scavenging port during its upward motion. Although the absolute distance of the traveling of the piston remained consistent, the corresponding time interval progressively decreased.
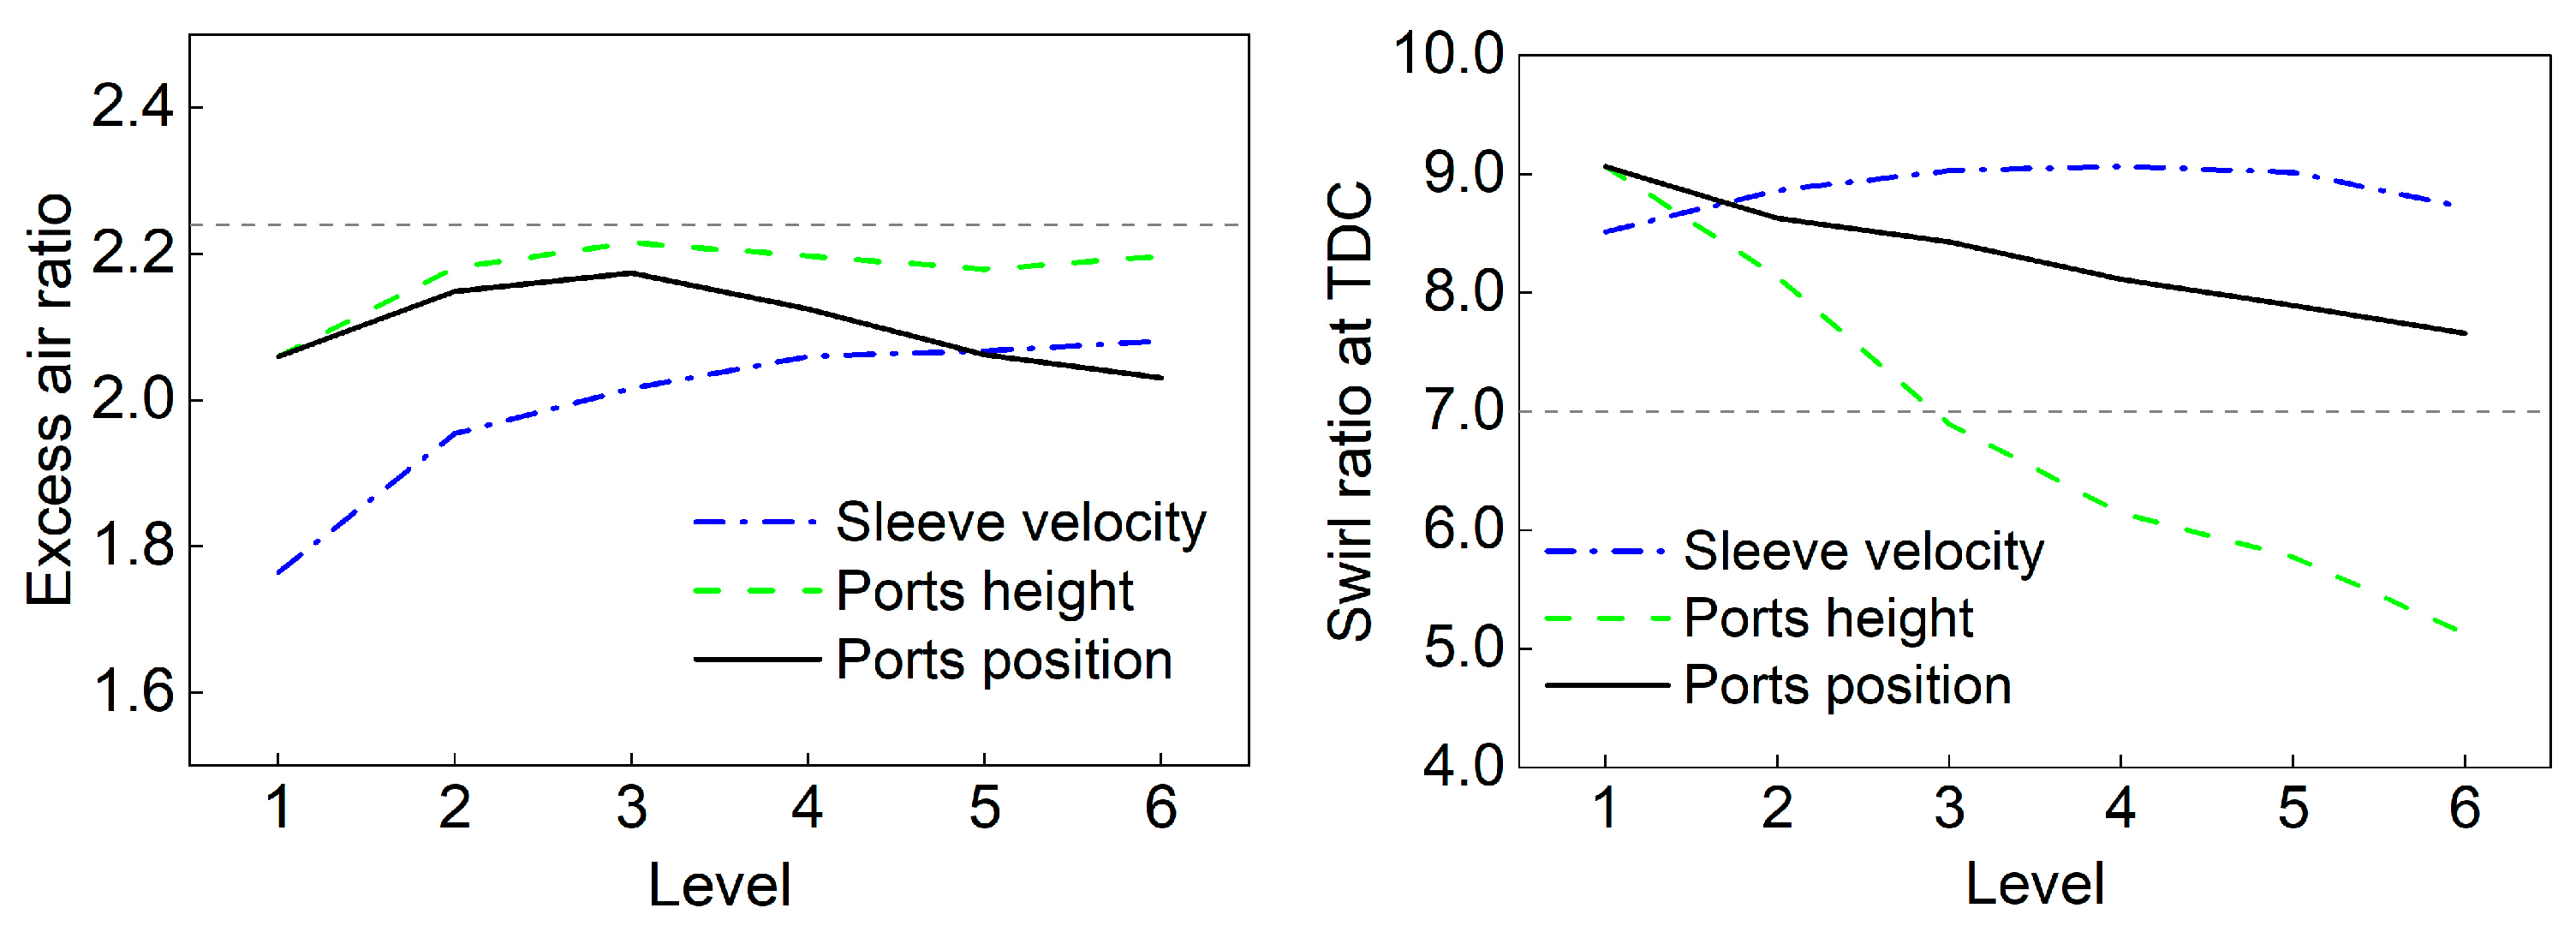
Figure 29 shows the influence of different schemes on the excess air ratio and the swirl ratio at the TDC. With constant fuel injection parameters, these two factors will directly determine the combustion and the expansion process. The trend in the excess air ratio was inversely related to the residual exhaust gas. However, none of the three methods could restore the excess air ratio to the baseline level. After increasing the height of the scavenging port to 169 mm, the excess air ratio peaked. Subsequently, although the residual exhaust gas in the cylinder continued to decrease and the scavenging box pressure and temperature remained stable, the excess air coefficient no longer rose and even showed a declining trend to some degree. This was primarily due to the fact that, as the scavenging port height continued to increase, the intake swirl gradually diminished. The static pressure of the gas in the cylinder remained consistent with the baseline, but its dynamic pressure deviated significantly from the baseline, leading to a reduction in the total pressure. This implies that the fresh charge retained in the cylinder will decrease. It was evident that both increasing the sleeve velocity and shifting the scavenging port upwards had a minimal effect on the swirl ratio at the TDC, much less than the impact of increasing the height of the scavenging port. When the scavenging port height increased to 169 mm, the swirl ratio already dropped to the baseline. Moreover, when the height was further augmented to 294 mm, the swirl ratio at the TDC decreased to around 5, which would be detrimental to the combustion process.
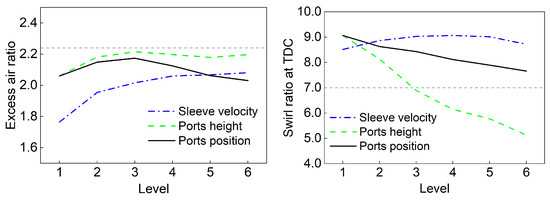
Figure 29.
Influence of sleeve velocity, ports’ height, and ports’ position on the excess air ratio and swirl ratio at TDC.
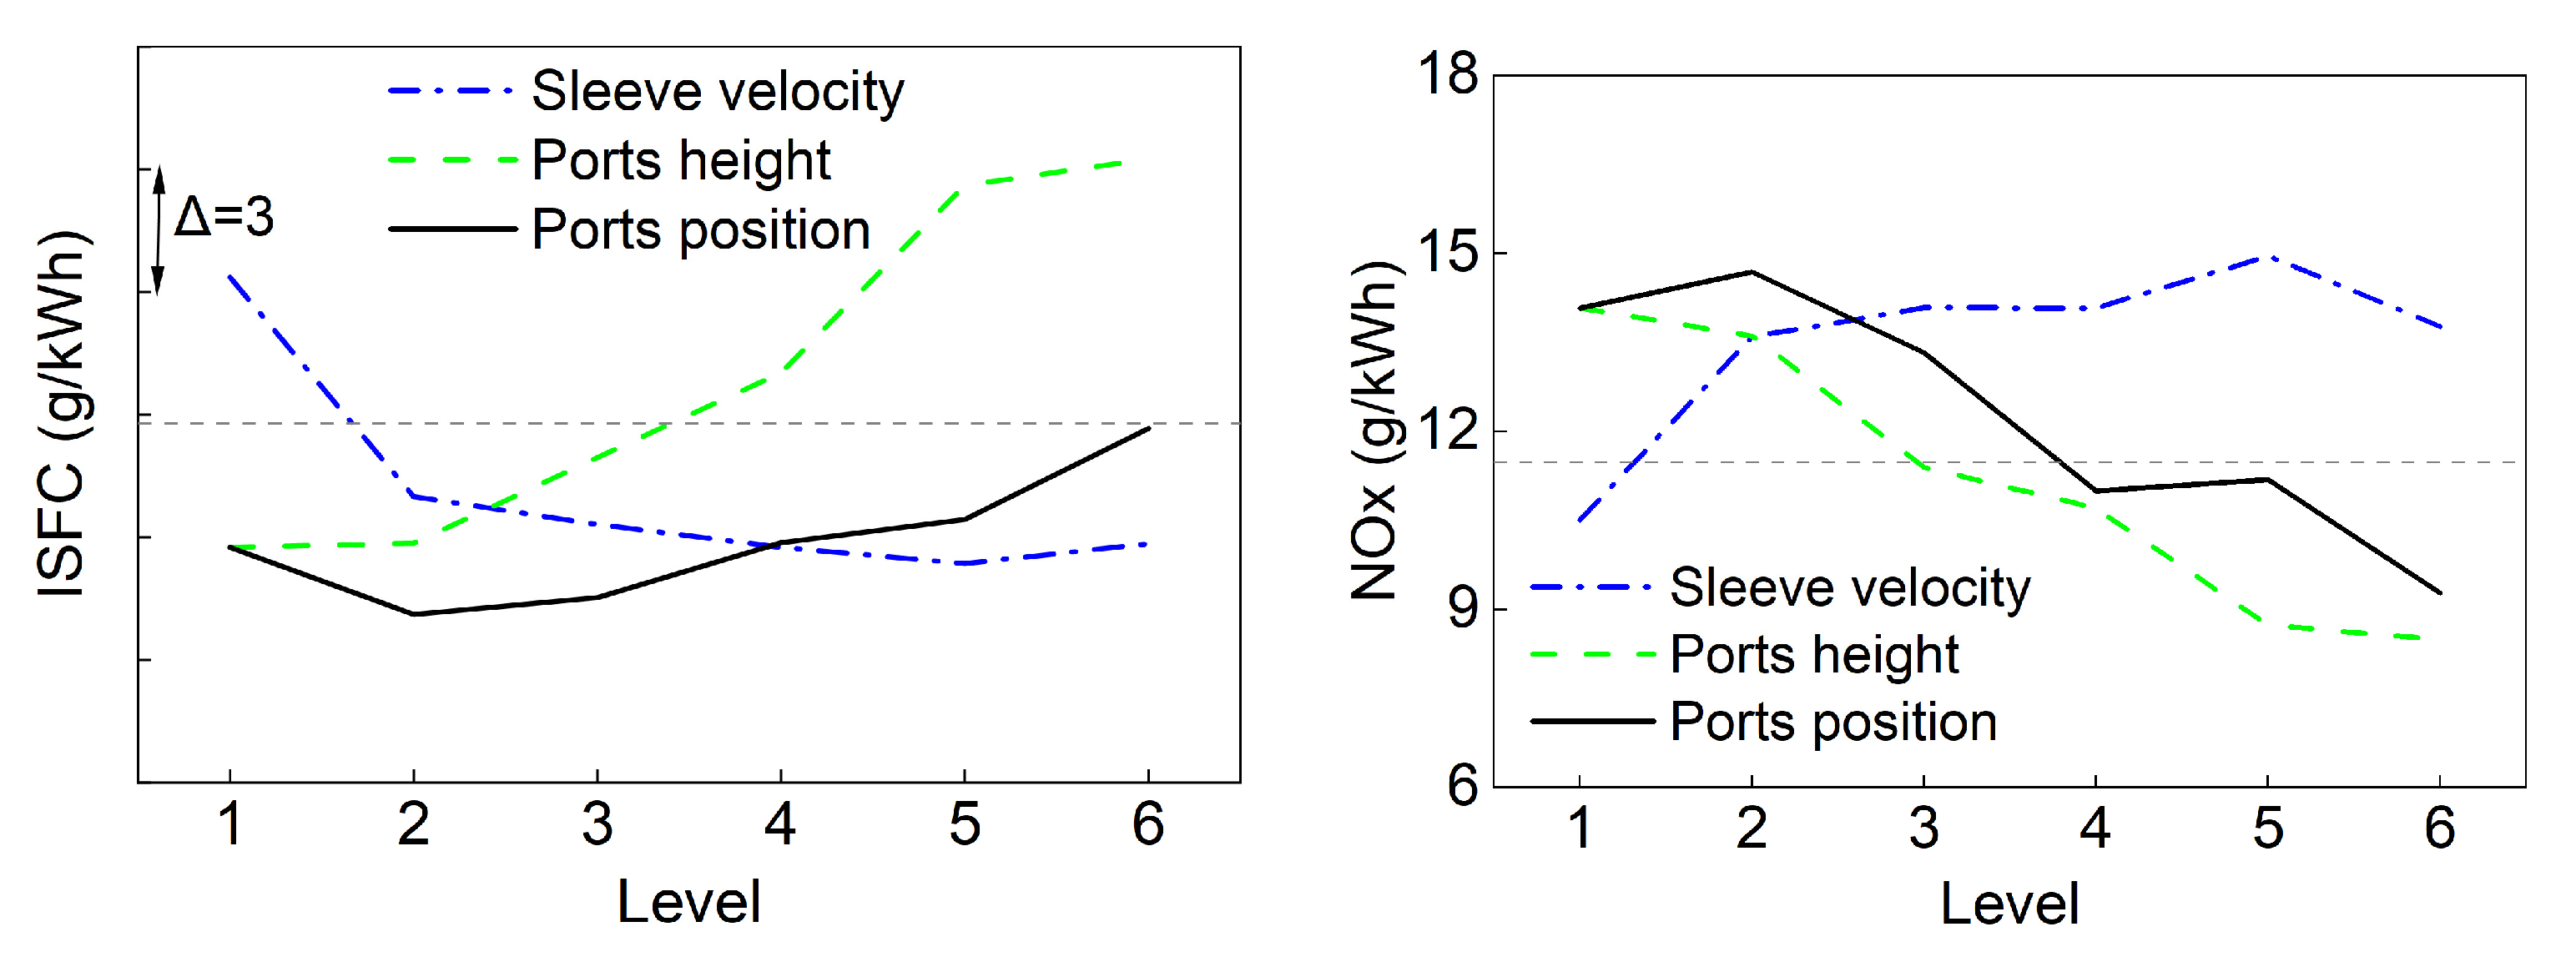
Figure 30 illustrates the impact of different schemes on the ISFC and the NOx emission. After the sleeve velocity increased to 4 mm/°CA, its effect became negligible. Elevating the height of the scavenging port led to a gradual increase in the ISFC and a corresponding decrease in NOx emissions. This trend aligned with the variations in the swirl ratio at the Top Dead Center (TDC). When the scavenging port height was augmented to 169 mm, the ISFC decreased by 0.9 g/kWh compared to the baseline, while the NOx emissions remained relatively unchanged. At this point, the mass flow rate was approximately 90% of the baseline. As for the upward movement of the scavenging port, the fuel consumption trend mirrored the changes in the residual burned gases, with the NOx emissions first increasing, then decreasing. When the scavenging port was shifted upward so that the SPC was at 235°CA ATDC, Pmax decreased by 6 bar and the ISFC decreased by 2.9 g/kWh relative to the baseline, with the NOx emissions equivalent to the baseline and a mass flow rate of about 90.7% of the baseline. Further studies are required, integrating the turbocharging system for 1D system simulations to further evaluate the feasibility of employing a single-stage turbocharging approach.
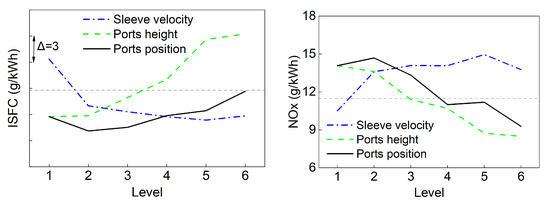
Figure 30.
Influence of sleeve velocity, ports’ height, and ports’ position on the ISFC and NOx emission.
4. Conclusions
This study presented the impact of the Variable Port Timing (VPT) strategy on the performance of a marine low-speed two-stroke engine with a 340 mm cylinder bore, based on 3D Computational Fluid Dynamics (CFD). All simulation calculations were conducted under consistent boundary condition settings. The following conclusions were made:
- Delaying the Exhaust Valve Opening (EVO) timing can enhance the effective expansion ratio and improve the indicated work. However, there was a diminishing return in the benefits with further delaying the EVO, as the rate of increase in the effective expansion ratio would taper off.
- The timing of the EVO and its interval with the Scavenging Port Opening (SPO) significantly affected the burned gas distribution of the intake region. The VPT strategy allows uniflow scavenging two-stroke engines to operate at extremely high effective expansion ratios without experiencing burned gas backflow to the scavenging box, which can reduce the fuel consumption of the low-speed engine and ensure its stable operation.
- Implementing the VPT strategy can improve the Indicated Specific Fuel Consumption (ISFC) and reduce the NOx emissions. Increasing the height of the scavenging port or raising the position of the ports can restore the mass flow rate and improve the ISFC, but there is a trade-off relationship between reducing the residual exhaust gas and maintaining a high swirl ratio for efficient combustion.
- After introducing the VPT strategy, the scavenging port was adjusted upwards, positioning the SPC at 235°CA ATDC, and there was a decrease in Pmax by 6 bar and a reduction in the ISFC by 2.9 g/kWh in comparison to the baseline. The NOx emissions remained consistent with the baseline, while the mass flow rate was approximately 90.7% of the baseline.
- The VPT strategy, combined with appropriate adjustments of the scavenging process, can enhance the engine performance and the fuel efficiency. Further optimization of the structural parameters of the scavenging port will be conducted, and a 1D system simulation will be utilized to match a single-stage supercharging system suitable for the VPT strategy.
Author Contributions
H.Z., formal analysis, methodology, writing—original draft, writing—review and editing; W.L., formal analysis, funding acquisition; G.X., data curation, funding acquisition, formal analysis; B.L., writing—review and editing; Y.Q., resources, data curation, project administration. All authors have read and agreed to the published version of the manuscript.
Funding
This research was supported by the National Key R&D Program of China (No. 2022YFB4300700).
Institutional Review Board Statement
Not applicable.
Informed Consent Statement
Not applicable.
Data Availability Statement
The data presented in this study are available upon request from the corresponding author.
Conflicts of Interest
The authors declare no conflict of interest.
Definitions, Acronyms and Abbreviations
| NOx | Nitrogen Oxides |
| HRR | Heat Release Rate |
| VVT | Variable Valve Timing |
| VPT | variable port timing |
| SPO | Scavenging Port Opening, °CA |
| SPC | Scavenging Port Closing, °CA |
| BSFC | Brake Specific Fuel Consumption, g/kWh |
| ISFC | Indicated Specific Fuel Consumption, g/kWh |
| CA | Crank Angle, °CA |
| EGR | Exhaust Gas Recirculation |
| EVC | Exhaust Valve Closing, °CA |
| EVO | Exhaust Valve Opening, °CA |
| LHV | Lower Heating Value, J/kg |
| SCR | Selective Catalytic Reduction |
| CFD | Computational Fluid Dynamics |
| IMEP | Indicated Mean Effective Pressure, MPa |
| BMEP | Brake Mean Effective Pressure, MPa |
| TDC | Top Dead Center, °CA |
| BDC | Bottom Dead Center, °CA |
| ATDC | After Top Dead Center, °CA |
References
- Sirimanne, S.N.; Hoffman, J.; Juan, W.; Asariotis, R.; Assaf, M.; Ayala, G.; Benamara, H.; Chantrel, D.; Hoffmann, J.; Premti, A. Review of Maritime Transport. In Proceedings of the United Nations Conference on Trade and Development, Geneva, Switzerland, 13–15 November 2019. [Google Scholar]
- Latha, H.; Prakash, K.; Veerangouda, M.; Maski, D.; Ramappa, K. A Review on SCR System for NOx Reduction in Diesel Engine. Int. J. Curr. Microbiol. Appl. Sci. 2019, 8, 1553–1559. [Google Scholar] [CrossRef]
- Ni, P.; Wang, X.; Li, H. A Review on Regulations, Current Status, Effects and Reduction Strategies of Emissions for Marine Diesel Engines. Fuel 2020, 279, 118477. [Google Scholar] [CrossRef]
- Wang, Z.; Zhou, S.; Feng, Y.; Zhu, Y. EGR Modeling and Fuzzy Evaluation of Low-Speed Two-Stroke Marine Diesel Engines. Sci. Total Environ. 2020, 706, 135444. [Google Scholar] [CrossRef] [PubMed]
- Wang, Z.; Zhou, S.; Feng, Y.; Zhu, Y. Research of NOx Reduction on a Low-Speed Two-Stroke Marine Diesel Engine by Using EGR (Exhaust Gas Recirculation)–CB (Cylinder Bypass) and EGB (Exhaust Gas Bypass). Int. J. Hydrogen Energy 2017, 42, 19337–19345. [Google Scholar] [CrossRef]
- Chybowski, L.; Laskowski, R.; Gawdzińska, K. An Overview of Systems Supplying Water into the Combustion Chamber of Diesel Engines to Decrease the Amount of Nitrogen Oxides in Exhaust Gas. J. Mar. Sci. Technol. 2015, 20, 393–405. [Google Scholar] [CrossRef]
- Mayer, S.; Sjöholm, J.; Ishibashi, R.; Fukushima, T.; Kondo, M.; Kjemtrump, N. NOx Reduction to Tier III Levels on MAN B&W LGI Low-Speed Engines by Water Addition to Either Methanol or Conventional Diesel Fuel Oil. In Proceedings of the CIMAC Congress, Vancouver, BC, Canada, 10–14 June 2019. [Google Scholar]
- Zhou, S.; Gao, R.; Feng, Y.; Zhu, Y. Evaluation of Miller Cycle and Fuel Injection Direction Strategies for Low NOx Emission in Marine Two-Stroke Engine. Int. J. Hydrogen Energy 2017, 42, 20351–20360. [Google Scholar] [CrossRef]
- Lu, T.; Lu, Z.; Shi, L.; Wang, T.; Liu, M.; Wang, H. Improving the Fuel/Air Mixing and Combustion Process in a Low-Speed Two-Stroke Engine by the IFA Strategy under EGR Atmosphere. Fuel 2021, 302, 121200. [Google Scholar] [CrossRef]
- Lu, Z.; Liu, M.; Shi, L.; Wang, T.; Lu, T.; Wang, H. Numerical Research of the Injected Exhaust Gas Recirculation Strategy on a Two-Stroke Low-Speed Marine Diesel Engine. Energy 2021, 244, 122731. [Google Scholar] [CrossRef]
- Lu, Z.; Lu, T.; Shi, L.; Wang, T.; Wang, H.; Liu, M. An Efficient Approach to Improve Thermal Efficiency on a Low-Speed Two-Stroke Marine Diesel Engine. Fuel 2022, 329, 125386. [Google Scholar] [CrossRef]
- Heywood, J.B. Internal Combustion Engine Fundamentals; McGraw-Hill Education: New York, NY, USA, 2018; ISBN 1-260-11610-7. [Google Scholar]
- Asad, U.; Zheng, M.; Han, X.; Reader, G.T.; Wang, M. Fuel Injection Strategies to Improve Emissions and Efficiency of High Compression Ratio Diesel Engines. SAE Int. J. Engines 2009, 1, 1220–1233. [Google Scholar] [CrossRef]
- Zhao, J. Research and Application of Over-Expansion Cycle (Atkinson and Miller) Engines—A Review. Appl. Energy 2017, 185, 300–319. [Google Scholar] [CrossRef]
- Miller, R. Supercharging and Internal Cooling Cycle for High Output. Trans. Am. Soc. Mech. Eng. 1947, 69, 453–457. [Google Scholar] [CrossRef]
- Atkinson, J. Gas Engine. U.S. Patent 336505, 16 February 1886. [Google Scholar]
- Ji, W.; Li, A.; Lu, X.; Huang, Z.; Zhu, L. Numerical Study on NOx and ISFC Co-Optimization for a Low-Speed Two-Stroke Engine via Miller Cycle, EGR, Intake Air Humidification, and Injection Strategy Implementation. Appl. Therm. Eng. 2019, 153, 398–408. [Google Scholar] [CrossRef]
- Zehnder, H. Dieselmotor. Patent EP0965739A3, 22 December 1999. [Google Scholar]
- Head, R.; Turner, J. The Silent Path: The Development of the Single Sleeve Valve Two-Stroke Engine over the Last 110 Years. Energies 2021, 14, 616. [Google Scholar] [CrossRef]
- Turner, J.W.G.; Head, R.A.; Chang, J.; Engineer, N.; Wijetunge, R.; Blundell, D.W.; Burke, P. 2-Stroke Engine Options for Automotive Use: A Fundamental Comparison of Different Potential Scavenging Arrangements for Medium-Duty Truck Applications. In Proceedings of the International Powertrains, Fuels & Lubricants Meeting, San Antonio, TX, USA, 22–24 January 2019. [Google Scholar]
- Yang, W.; Li, X.-R.; Zhao, W.-H.; Kang, Y.-N.; Liu, F.-S. Effect of Layered-Port VVT on Performance of Opposed-Piston Two-Stroke Diesel Engine. J. Energy Eng. 2019, 145, 04019027. [Google Scholar] [CrossRef]
- Ryser, R.; Mathey, C.; Mutter, A. Power2-Is 2-Stage Turbocharging Interesting for 2-Stroke Engines. In Proceedings of the CIMAC Congress, Helsinki, Finland, 6–10 June 2016; pp. 1–13. [Google Scholar]
- Cao, E.; Zhu, J.; Li, L.; Liu, B.; Gui, Y.; Qian, Y. Simulation of Performance Optimization for Low-Speed Engine with Variable Scavenge Ports. Chin. Intenal Combust. Engine Eng. 2021, 42, 68–75. [Google Scholar] [CrossRef]
- Andersen, F.H.; Hult, J.; Nogenmyr, K.-J.; Mayer, S. Numerical Investigation of the Scavenging Process in Marine Two-Stroke Diesel Engines. In Proceedings of the SAE/KSAE 2013 International Powertrains, Fuels & Lubricants Meeting, Seoul, Republic of Korea, 21–23 October 2013. [Google Scholar]
- Nemati, A.; Ong, J.C.; Jensen, M.V.; Pang, K.M.; Mayer, S.; Walther, J.H. Numerical Study of the Scavenging Process in a Large Two-Stroke Marine Engine Using URANS and LES Turbulence Models. In Proceedings of the SAE Powertrains, Fuels & Lubricants Meeting, Kraków, Poland, 22–24 September 2020. [Google Scholar]
- Andersen, F.H.; Mayer, S. Parametric Study of the Scavenging Process in Marine Two-Stroke Diesel Engines. In Proceedings of the ASME 2015 Internal Combustion Engine Division Fall Technical Conference, Houston, TX, USA, 8–11 November 2015. [Google Scholar]
- Sigurdsson, E.; Ingvorsen, K.M.; Jensen, M.V.; Mayer, S.; Matlok, S.; Walther, J.H. Numerical Analysis of the Scavenge Flow and Convective Heat Transfer in Large Two-Stroke Marine Diesel Engines. Appl. Energy 2014, 123, 37–46. [Google Scholar] [CrossRef]
- Sun, X.; Ning, J.; Liang, X.; Jing, G.; Chen, Y.; Chen, G. Effect of Direct Water Injection on Combustion and Emissions Characteristics of Marine Diesel Engines. Fuel 2022, 309, 122213. [Google Scholar] [CrossRef]
- Nordin, N. Numerical Simulations of Non-Steady Spray Combustion Using a Detailed Chemistry Approach. Ph.D. Thesis, Department of Thermo and Fluid Dynamics, Chalmers University of Technology, Goteborg, Sweden, 1998. [Google Scholar]


Disclaimer/Publisher’s Note: The statements, opinions and data contained in all publications are solely those of the individual author(s) and contributor(s) and not of MDPI and/or the editor(s). MDPI and/or the editor(s) disclaim responsibility for any injury to people or property resulting from any ideas, methods, instructions or products referred to in the content. |
© 2023 by the authors. Licensee MDPI, Basel, Switzerland. This article is an open access article distributed under the terms and conditions of the Creative Commons Attribution (CC BY) license (https://creativecommons.org/licenses/by/4.0/).