Abstract
In order to solve the problem of the uneven distribution of the flow and ammonia concentration field in the selective catalytic reduction (SCR) denitrification system of a 660 MW coal-fired power plant, a three-dimensional computational fluid dynamics (CFD) model was established at a scale of 1:1. The existing flow guide and ammonia fume mixing device were then calibrated and optimized. The relative standard deviation of the velocity field distribution upstream of the ammonia injection grid (AIG) was optimized from 15.4% to 9.9%, with a reasonable radius of the deflector at the inlet flue elbows, and the relative standard deviation of the velocity field distribution above the inlet surface of the first catalyst layer in the reactor was optimized from 25.4% to 10.2% by adjusting the angle between the deflector and the wall plate of the inlet hood. Additionally, with the use of a double-layer spoiler ammonia fume mixing device, the relative standard deviation of the ammonia mass concentration distribution above the inlet surface of the first catalyst layer in the reactor was optimized from 12.9% to 5.3%. This paper can provide a valuable reference with practical implications for subsequent research.
1. Introduction
Nitrogen oxides (NOx) not only cause environmental problems such as photochemical smog and acid rain but are also harmful to human health. Several emerging technologies could be adopted for NOx emission control, such as electron beam processes EBP [1], low-temperature adsorption (LTA) [2], or wet oxidative scrubbing (WOS) [3], which is also capable of simultaneously controlling NOx/SOx emissions [4], but currently, selective catalytic reduction (SCR) technology is one of the most dominant technical means to remove NOx from flue gases in coal-fired power plants [5,6]. However, in actual operation, it is found that the flow field and NH3 concentration field distribution in the inlet flue of the denitrification reactor and on the upper surface of the catalyst inlet play a crucial role in determining the performance of the SCR-DeNOx system. The uneven distribution of the flow field or ammonia concentration field seriously affects the denitrification effect, which causes a low denitrification efficiency and a high flue outlet NOx concentration exceeding the standard or ammonia escape standard [7]. In addition, the outlet NO concentration will be uneven due to the nonuniformity of the temperature and velocity above the catalyst layer [8]. The essential reason for this situation is that the flue cross-section has many changes and turns, and the amount of reductant injection is very small compared to the flue gas volume, which makes it difficult to achieve sufficient mixing. It is also easy to cause insufficient ammonia supply in some areas of the reactor and excessive ammonia in some areas, resulting in substandard overall efficiency and ammonia escape and causing problems such as high differential pressure in the air preheater and clogging of ammonium bisulfate. For peaking units with frequent load fluctuations, the above problems will be more prominent when the ammonia injection cannot adapt to the change of the flue gas incoming flow [9]. Therefore, the optimization of the flow field and ammonia concentration field of the de-NOx system is very necessary when performing ammonia injection optimization modification. Due to its low cost, as well as its better reliability and flexibility, computational fluid dynamics (CFD) simulation has long been an important tool for researchers and engineers to optimize the flow field of SCR-DeNOx systems [10,11,12,13].
Xu et al. performed the evaluations of the gate leaf, hybrid grid, and straightener in terms of the distributions of the velocity and the concentration at the entrance of the catalyst layer [14]. Gate leaves could significantly improve the uniformity of the velocity distribution, and the hybrid grid improves the concentration distribution [15]. Moreover, Ye et al. optimized the fluid flow of an SCR-DeNOx system at a 600 MW power station using the numerical simulation method, and the results indicated that the proper installation of guide plates and straightening gratings could provide a relatively uniform velocity field. Additionally, the in-line arrangement of static mixers could strengthen the disturbance of the fluid and promote the mixing of reductant NH3 with the flue gas [16]. Sohn et al. also suggested placing the AIG and mixer away from the catalyst layer to enhance the NH3 mixing and flow uniformity together [17]. Moreover, Kim et al. used a computational analysis technique to improve the uniformity of the NH3/NO molar ratio by controlling the flow rate of the ammonia injection nozzle according to the flow distribution of the nitrogen oxides in the inlet exhaust gas of the denitrification facility [18]. Based on the response surface methodology (RSM), Ye et al. studied the effect of three factors on denitration efficiency, including catalyst inlet gas velocity, reaction temperature, and the NH3/NO molar ratio. In addition, they optimized the structure of the hot air duct and guiding plate based on the non-uniform inlet temperature [19]. Xu et al. carried out three-dimensional CFD simulations to analyze the breakage failure of an SCR-DeNOx system for a certain 350 MW coal-fired power plant [20]. Combining the species transport model and the porous medium model, Shang et al. carried out the large eddy simulation (LES) to simulate the transient multi-species flow in an SCR-DeNOx system at a 310 MW coal-fired station. The periodical fluctuation behavior of the ammonia mass fraction in the SCR reactor was identified, indicating that the ammonia mass fraction distributions depend on the velocity distributions. The LES model can capture more instantaneous details of the multi-species turbulent flow characteristics in the SCR-DeNOx system, including the multiscale vortex structures and fluctuation behaviors [21].
In this paper, to solve the problem of the uneven distribution of the flow field and ammonia concentration field in the SCR-DeNOx system of a 660 MW coal-fired power plant, a three-dimensional computational fluid dynamics model was established, with a ratio of 1:1 to the realistic system, and the current flow field and ammonia concentration field in the denitrification system were calibrated and then optimized for the existing flow guide and ammonia mixing device. Eventually, the uniformity of the flow field and ammonia concentration field distribution was greatly improved to ensure the efficiency of the SCR-DeNOx system in engineering practice.
2. Mathematical Model and Numerical Method
2.1. CFD Model
2.1.1. Model Simplification and Assumptions
In order to facilitate the simulation, according to the actual operating environment of the engineering project, the following assumptions and simplifications are made to the physical model of the SCR-DeNOx system under the engineering-required condition:
- Only one phase (the gas phase) flows in the system, ignoring the effect of fly ash and other flue gas components that account for a small percentage;
- Consider the flue gas as an ideal gas and replace it with air in the model;
- The gas flow in the system is a steady-state flow;
- Ignoring the chemical reaction in the catalyst layers;
- Assuming a uniform flue gas velocity distribution at the coal saver inlet;
- Model the entire SCR-DeNOx system in CFD and all the deflectors that change the flow field, including the selective reduction reactor, AIG, ammonia flue gas mixing device, deflector, rectification grilles, and catalyst layers, ignoring internal structures that have less influence on the flow field (such as small-sized internal support bars, steel beams, etc.);
- The thickness of the gate leaves is neglected, and they are treated as surfaces.
The CFD model is built according to the existing SCR-DeNOx system construction drawings, as shown in Figure 1. L1 = 11,500 mm, L2 = 14,100 mm, L3 = 14,100 mm, H1 = 3500 mm, H2 = 2900 mm, and H3 = 10,000 mm in this model. In addition, there are 2 critical cross-sections to focus on here: one is 500 mm upstream of the AIG and the other is 500 mm upstream of the first catalyst layer. In the subsequent analysis, we will mainly focus on these two cross-sections to discuss the velocity field and ammonia concentration field, etc.
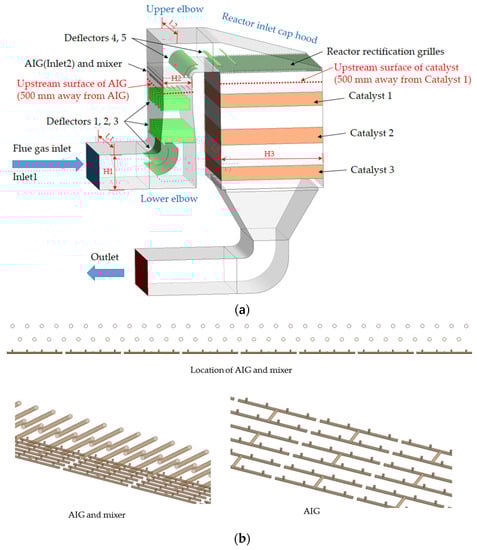
Figure 1.
Schematic of the current SCR-DeNOx system: (a) overall schematic; (b) details of the AIG and mixer.
2.1.2. Mesh Division
Mesh division is an important step in CFD simulation, which includes the determination of the mesh type and quantity, and the mesh quality has a direct and significant impact on the calculation accuracy and time. In this model, the overall mesh size is controlled within 0.2 m, and the mesh type includes both structured and unstructured meshes. Because of the complex structure of the AIG, mixer, deflector, and rectification grille regions and their small size compared to the whole SCR-DeNOx system, an unstructured grid system is used for these regions. In addition, local grid encryption is performed for these regions; these are the key components affecting the flow characteristics, and the control size is no larger than 0.1 m (0.15 m for the rectification grilles region). The remaining parts of the fluid flow are relatively simple and divided into regular hexahedral structured grids. The total number of meshes for the SCR-DeNOx system CFD model was determined to be about 16.6 million after verification of the mesh independence, as shown in Figure 2.
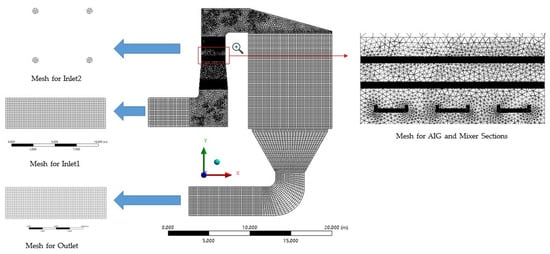
Figure 2.
Mesh division of the CFD model.
2.1.3. Solver Settings
The three-dimensional steady-state turbulent non-rotating flow is solved by using the commercially available software package FLUENT 15.0, which is based on the finite volume method. The semi-implicit method for pressure-linked equations (SIMPLE) algorithm is adopted to realize the coupling of pressure and velocity. Second-order difference schemes are chosen for the spatial discretization of the turbulence kinetic energy, the turbulent dissipation rate, and the energy equations, and the standard method is chosen as the pressure interpolation scheme. The standard wall function was applied as it is defaulted in the k-ε turbulence model. The simulation is regarded to be converged once the normalized residuals of all the governing equations are less than 10−5. Meanwhile, the catalyst layer pressure drop is simulated using porous media to produce a pressure loss comparable to the actual operating value. The governing equations were introduced in the references [14,15,17].
2.1.4. Boundary Conditions
The CFD geometric model has two inlets and one outlet. The two inlets are the flue inlet (Inlet 1) of the SCR-DeNOx system and the AIG nozzle (Inlet 2), and both are set as velocity inlets. The flue outlet is set as a pressure outlet, and the outlet pressure is the standard atmospheric pressure. Here, we use physical parameters such as density and the viscosity of air and ammonia as their values at 298.15 K and assume that this value does not change with temperature. The specific boundary conditions corresponding to the maximum continuous rating (BMCR) load condition of the boiler in the power plant are shown in Table 1.

Table 1.
Boundary conditions of the CFD model.
2.1.5. Evaluation Indicators
In this paper, the relative standard deviation CV is used to describe the extent to which the parameters, e.g., velocity and concentration, deviate from their mean values for a given section of the SCR reactor. The relative standard deviation is defined as follows.
where Vi is the local value on the plane for the variable. is the average value on the plane for the variable. n is the number of grids on the plane. A higher CV value corresponds to a less uniform velocity or concentration, whereas a lower CV value is interpreted as an indication of greater uniformity. Engineering SCR-DeNOx systems are generally designed to keep the relative standard deviation of velocity upstream of the AIG and at the upper surface of the catalyst inlet within 15%. The relative standard deviation of the NH3 concentration on the upper surface of the catalyst inlet is preferably limited to 5%.
2.2. Research Steps and Schemes for the Simulation
Step 1: Firstly, the flow field condition in the SCR-DeNOx system is simulated and calibrated for the current deflector arrangement (Scheme 1). Then, based on the calculation results, the deflectors at the lower elbow, upper elbow, and reactor inlet cap position are adjusted sequentially according to the flue gas flow direction so that the velocity field upstream of the AIG and in the cross-section above the catalyst inlet meets the requirements. There are four schemes involved here, as shown in Figure 3:
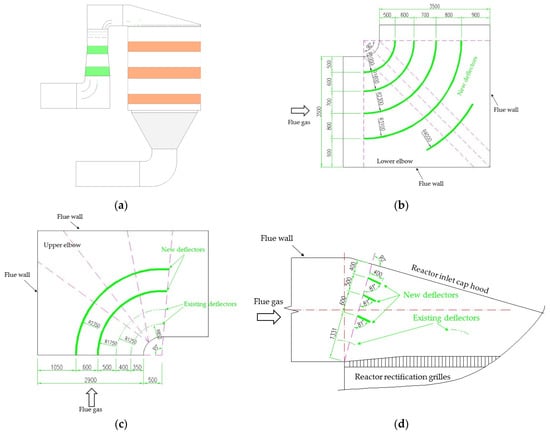
Figure 3.
Deflector arrangement of the 4 schemes. For Schemes 2 to 4, this diagram shows only the adjusted sections of the deflectors, i.e., the lower elbow section, the upper elbow section, and the reactor inlet cap section, respectively: (a) Scheme 1: the current arrangement, which is also detailed in Figure 1; (b) Scheme 2; (c) Scheme 3; (d) Scheme 4.
- Scheme 1: the current arrangement;
- Scheme 2: adjustment of the lower elbow deflectors based on Scheme 1;
- Scheme 3: adjustment of the upper elbow deflector based on Scheme 2;
- Scheme 4: adjustment of the reactor inlet cap deflector based on Scheme 3.
Step 2: As the adjustment of the ammonia concentration field is mainly achieved by adjusting the type and position of the ammonia flue gas mixer downstream of the AIG nozzle (positioned above the AIG), the adjustment of the ammonia concentration field is continued after the velocity field has been adjusted, i.e., based on Scheme 4. Two sets of mixing tubes have been installed downstream of the AIG to improve the uniformity of the ammonia concentration distribution, but the results are not satisfactory. Thus, further optimization is required. Various optimization schemes have been tried and only four of them are compared and analyzed herein, as shown in Figure 4:
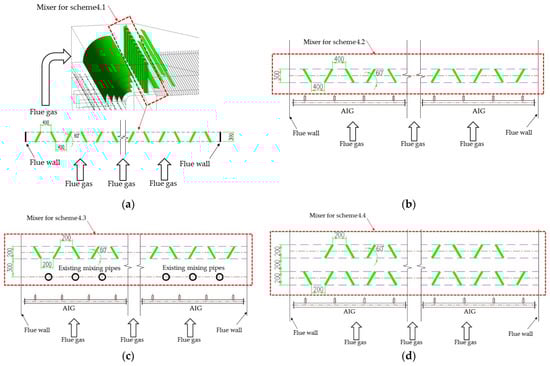
Figure 4.
Arrangement schemes for different ammonia flue gas mixers: (a) Scheme 4.1; (b) Scheme 4.2; (c) Scheme 4.3; (d) Scheme 4.4.
- Scheme 4.1: addition of spoilers in the horizontal flue between the upper elbow and the reactor inlet cap cover based on Scheme 4.
- Scheme 4.2: elimination of the original mixing pipe based on Scheme 4 and installation of a one-layer spoiler at the location of the original mixing pipe.
- Scheme 4.3: elimination of the original upper mixing tube only, based on Scheme 4, with a one-layer spoiler in the same position.
- Scheme 4.4: elimination of the original mixing tube based on Scheme 4, with a two-layer spoiler in the same position.
3. Results and Discussion
3.1. Distribution of Velocity Fields
3.1.1. AIG Upstream Velocity Field
In this project, the inlet flue of the SCR-DeNOx system changes its flow from the horizontal direction to the vertical direction after a short distance from the inlet. Then, the flue cross-section gradually increases in the width direction and decreases in the height direction. The change in direction of the flue gas flow and the change in the cross-section can easily lead to deflection and gyration of the flue gas. Therefore, to improve the flow situation, deflectors are usually installed at the point where the flue cross-section changes and the direction of the flue gas flow changes (i.e., at the elbow). In contrast, in the vertical section of the inlet flue where the flue cross-section dimensions remain constant, the flow is relatively stable; so, the AIG is set there. After calculation by numerical simulation, the corresponding velocity field distribution contours upstream of the AIG for the different schemes are shown in Figure 5. The corresponding CV values are summarized in Table 2.
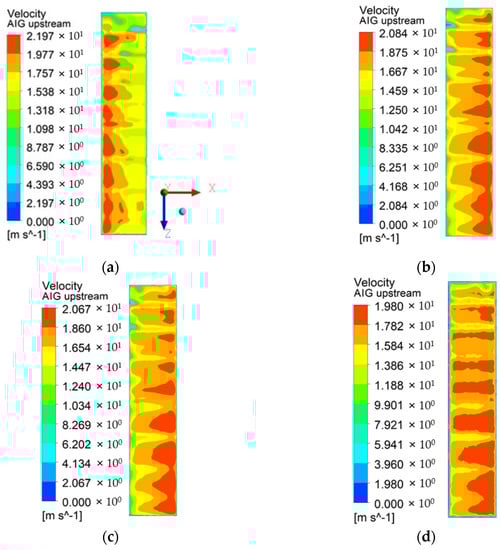
Figure 5.
Contours of the velocity field distribution upstream of the AIG corresponding to the different schemes: (a) Scheme 1; (b) Scheme 2; (c) Scheme 3; (d) Scheme 4.
Table 2.
Summary of CV values of the velocity field distribution upstream of the AIG corresponding to different schemes.
By comparing and analyzing the results, it can be found that the CV value is higher than 15% with the existing deflector arrangement, which does not meet the engineering requirement. Based on engineering experience, the existing deflectors at the lower elbow were then first replaced, and the radius of the new deflectors was chosen in a series of equal differences, assuming that this would be more conducive to a better distribution of the flow field. The CV value for this scheme is calculated to be 14.7%, which is already less than 15% and meets the engineering requirement, validating the assumptions we mentioned earlier. Subsequently, the optimization of the deflectors at the elbow was continued, following the direction of flue gas flow. To save investment costs, the existing deflectors should be fully utilized. Therefore, instead of removing the existing deflectors at the upper elbow and the reactor inlet cap, two and three new deflectors were added at these two locations, respectively. The radius of the two new deflectors at the upper elbow was also set in a series of equal differences. After reasonable adjustment, the calculation result of Scheme 4 shows that the CV value of the velocity field of the upstream section of the AIG is 10.3%, which is 33.0% lower than that of Scheme 1, and it is the best one among the four schemes.
3.1.2. Catalyst Inlet Upstream Velocity Field
After passing through the AIG and static mixer, the fluid in the flue has to undergo two more 90° turns before it can be reversed into the reactor. During this process, the cross-section dimensions of the flue gas flow also change considerably. Again, to achieve a homogeneous distribution of the flow field, a set of deflectors has been installed at each of the two 90° turns (upper elbow and reactor inlet cap hood). In addition, taking advantage of the sudden widening of the cross-section, a rectification grille has been set above the first catalyst inlet to enable the flue gas to enter the catalyst more uniformly, allowing the ammonia and NOx to react evenly on the catalyst surface, improving denitrification efficiency and reducing the ammonia escape rate. Figure 6 shows the corresponding velocity field distribution contours for the upstream cross-section of the catalyst inlet for the different schemes. The corresponding CV values are summarized in Table 3.
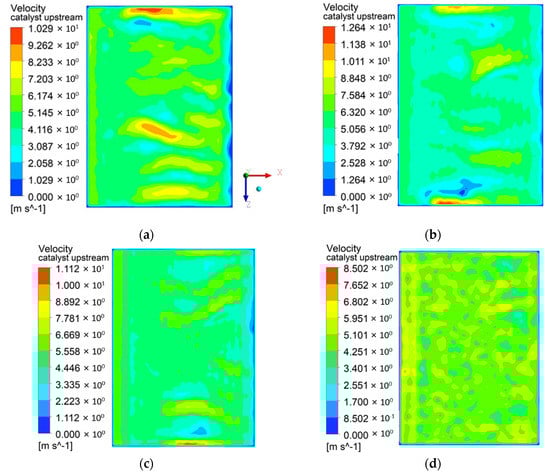
Figure 6.
Contours of the velocity field distribution for the upstream cross-section of the catalyst inlet for the different schemes: (a) Scheme 1; (b) Scheme 2; (c) Scheme 3; (d) Scheme 4.
Table 3.
Summary of CV values of the velocity field distribution for the upstream cross-section of the catalyst inlet corresponding to different schemes.
By comparing the results, it can be seen that the velocity field upstream of the catalyst inlet is mainly influenced by the flow deflectors in the upstream flue and especially by the flow deflectors at the upper elbow and the reactor inlet cap position. Therefore, after optimizing the deflectors at the lower elbow, the deflectors at the upper elbow and reactor inlet cap were optimized. The radius of the upper elbow deflector is also set in a series of equal differences. It is speculated that the deflectors at the reactor inlet cap should be set at a small angle to the cap so that the flue gas flows downwards into the catalyst, assuming that this would result in a better flow field. After the adjustment, Scheme 4 produced the best results, confirming the previous hypothesis. This is followed by Scheme 3, Scheme 1, and Scheme 2, with Schemes 1 and 2 producing closer results. Scheme 4 corresponds to a velocity field CV of 13.9% at the upstream cross-section of the catalyst inlet, a reduction of 45.3% compared to Scheme 1.
3.2. Distribution of Ammonia Mass Fraction
After calculation by the numerical simulation, the contours of the ammonia mass concentration field distribution in the upstream section of the catalyst inlet corresponding to the different schemes are shown in Figure 7. The corresponding CV values are summarized in Table 4. In addition, Figure 8 and Figure 9 provide a comparative view of the flow distribution between Scheme 1 and Scheme 4.4 for the cross-sections X = 3 and Z = −5; Figure 10 provides a view of the streamlines and vortices for Scheme 4.4.
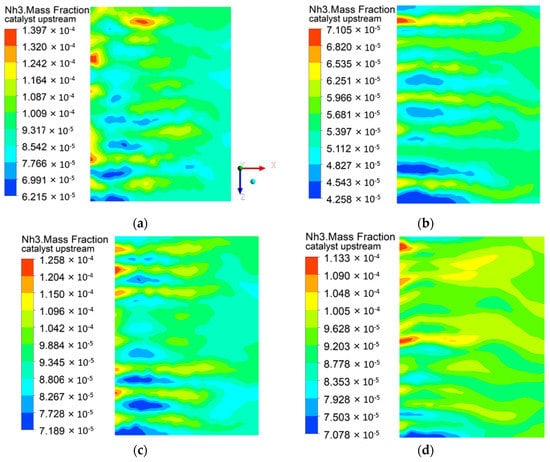
Figure 7.
Contours of the ammonia mass concentration field distribution in the upstream section of the catalyst inlet corresponding to the different schemes: (a) Scheme 4.1; (b) Scheme 4.2; (c) Scheme 4.3; (d) Scheme 4.4.
Table 4.
Summary of CV values of the ammonia mass concentration field distribution in the upstream section of the catalyst inlet corresponding to the different schemes.
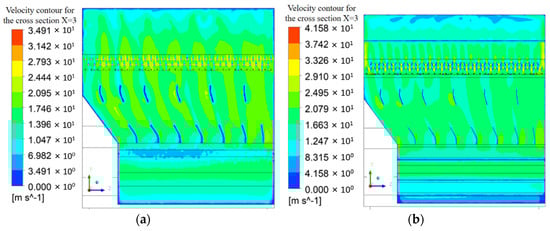
Figure 8.
Contours of the flow distribution of Scheme 1 and Scheme 4.4 for the cross-section X = 3: (a) Scheme 1; (b) Scheme 4.4.
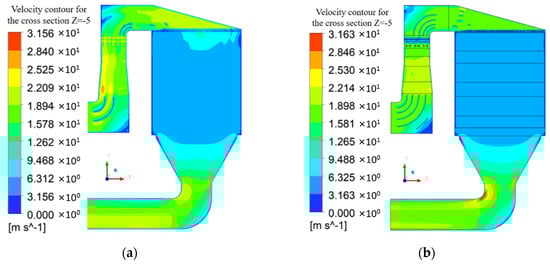
Figure 9.
Contours of the flow distribution of Scheme 1 and Scheme 4.4 for the cross-section Z = −5: (a) Scheme 1; (b) Scheme 4.4.
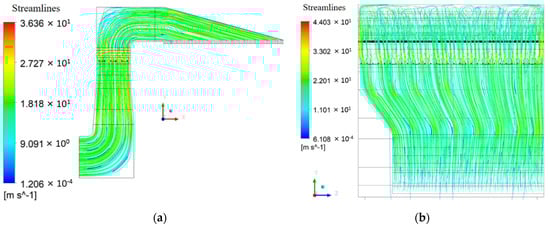
Figure 10.
Streamlines and vortices of SCR-DeNOx system for Scheme 4.4: (a) view from +Z direction; (b) view from −X direction.
By comparing the results of the first step, it can be seen that the ammonia mass concentration field distribution in the upstream section of the catalyst inlet is mainly influenced by the location and the type of ammonia flue gas mixing device downstream of the AIG nozzles. Therefore, to improve the homogeneity of the ammonia and flue gas mixing, an attempt was made to set up various types of static mixers at different locations downstream of the AIG. As can be seen from the comparative analysis of the results of the second step, the double-spoiler static mixer arranged above the AIG produces the best results, followed by the single-spoiler static mixer arranged above the AIG and the single-spoiler and mixing tube combination static mixer. The mixer placed in the horizontal flue between the upper elbow and the reactor inlet cap (scheme 4.1) produced the worst results, corresponding to a CV value more than twice that of scheme 4.4. The CV of the ammonia mass concentration distribution at the cross-section upstream of the catalyst inlet is 5.3% for scheme 4.4, which is 44.6% lower compared to that of Scheme 4 (CV = 9.6%) and 58.8% lower compared to that of Scheme 1 (CV = 12.9%). Therefore, the static mixer should be arranged close to the AIG nozzles. When the ammonia flue gas mixer is arranged close to the catalyst inlet, it does not improve the uniformity of the ammonia distribution and even worsens it.
The CV values of the velocity field upstream of the AIG and at the upper surface of the catalyst inlet for Scheme 4.4 are 9.9% (from 10.3% to 9.9%) and 10.2% (from 13.9% to 10.2%), respectively. This indicates that the optimized ammonia flue gas mixing device also contributes to a certain degree to the flow field distribution within the system, particularly the uniformity of the flow field at the catalyst inlet.
In summary, the optimized arrangement of the deflectors solves the problem of the non-uniform velocity field distribution caused by sudden changes in the flow direction and changes in the flue cross-section. Additionally, the optimized ammonia flue gas mixing device not only increases the intensity of the turbulence between the ammonia and the flue gas, so that the ammonia and the NOx in the flue gas are mixed as quickly and evenly as possible, but also has a further rectifying effect on the flue gas. The effect of locating the ammonia flue gas mixing device near the nozzle to increase the turbulence intensity is more obvious, and the ammonia gas is placed at the longest flow distance from the catalyst, which is more conducive to the mixing of ammonia and flue gas and further improves the flow uniformity.
4. Conclusions
The SCR-DeNOx system in this work has non-uniform flow field distribution due to the special flue structure with two right-angle elbows and large cross-sectional variations in front of the economizer outlet to the AIG, as well as the reactor inlet flue. Therefore, multiple deflectors are installed to improve the uniformity of the flow field. At the same time, an ammonia flue gas mixing device is installed downstream of the AIG to improve the uniformity of the NH3 mass concentration distribution. The flue gas is mixed with the ammonia–air mixture and then adjusted by two sets of deflectors and a rectification grille to reach the inlet of the catalyst layer uniformly. The relative standard deviation of the velocity field distribution upstream of the AIG in the existing SCR-deNOx system has been optimized from 15.4% to 9.9%, a reduction of 35.7%, through the rational arrangement of the deflectors. The relative standard deviation of the velocity field distribution on the upstream surface of the first catalyst inlet in the reactor was optimized from 25.4% to 10.2%, a reduction of 59.8%, and the relative standard deviation of the ammonia mass concentration distribution was optimized from 12.9% to 5.3%, a reduction of 58.9%. In summary, the flow field and the uniformity of the ammonia mass concentration distribution within the SCR-DeNOx system were significantly improved by several adjustments that optimized the deflectors and the ammonia flue gas mixing devices. Based on the present study, engineering guidance was obtained as a practical reference:
- A reasonable procedure for optimizing the flow field of SCR-DeNOx systems is proposed, i.e., the velocity field is optimized first, followed by the ammonia concentration field, which can significantly reduce the workload and improve the efficiency and better solve the problem resulting from the fact that CFD calculations take up too much of the computer resources and take too long;
- Installation of deflectors at elbows, reactor inlet caps, and other places where the flow of flue gas is altered has little effect on the mass concentration distribution of ammonia but is an important means of improving the uniformity of the flow field;
- Adjusting the deflectors downstream of the AIG is beneficial not only for the velocity field in the cross-section upstream of the catalyst inlet but also for the velocity field upstream of the AIG;
- Installation of an ammonia flue gas mixing device downstream of the AIG nozzles is the main means of improving the ammonia concentration distribution and is also beneficial to the overall flow field distribution within the system;
- The static mixer should be positioned close to the AIG nozzles; if it is positioned close to the catalyst inlet, not only does it not help to improve the uniformity of the mass concentration distribution by ammonia, it will worsen it;
- In general, the mixing effect of the spoiler type static mixer is better than the tube type static mixer;
- When installing deflectors at elbows with rounded corners, it is easier to achieve a better flow field by setting the radius of the deflectors in a series of equal differences (but if the size of the flue in which the elbow is located is large, the number of deflectors corresponding to this solution will also be large);
- When placing the deflectors at the inlet cap hood of the reactor, the deflectors should be at a small angle to the hood so that a better flow field can be achieved.
Author Contributions
Methodology, H.W. and J.S.; software, H.W. and J.S.; validation, H.W. and J.S.; formal analysis, H.W.; investigation, H.W.; resources, H.W.; data curation, H.W.; writing—original draft preparation, H.W.; writing—review and editing, H.W., Y.L. and Z.C.; visualization, H.W.; supervision, Y.L. All authors have read and agreed to the published version of the manuscript.
Funding
This research received no external funding.
Data Availability Statement
The data that support the findings of this study are available from the first author.
Conflicts of Interest
The authors declare no conflict of interest.
References
- Chmielewski, A.G.; Sun, Y.; Zimek, Z.; Bułka, S.; Licki, J. Mechanism of NOx removal by electron beam process in the presence of scavengers. Radiat. Phys. Chem. 2002, 65, 397–403. [Google Scholar] [CrossRef]
- Wang, S.; Xu, S.; Gao, S.; Xiao, P.; Jiang, M.; Zhao, H.; Huang, B.; Liu, L.; Niu, H.; Wang, J.; et al. Simultaneous removal of SO2 and NOx from flue gas by low-temperature adsorption over activated carbon. Sci. Rep. 2021, 11, 11003. [Google Scholar] [CrossRef] [PubMed]
- Flagiello, D.; Di Natale, F.; Erto, A.; Lancia, A. Oxidative Scrubber for NOx Emission Control Using NaClO2 Aqueous Solutions. Chem. Eng. Trans. 2021, 86, 397–402. [Google Scholar] [CrossRef]
- Flagiello, D.; Erto, A.; Lancia, A.; Di Natale, F. Advanced Flue-Gas cleaning by wet oxidative scrubbing (WOS) using NaClO2 aqueous solutions. Chem. Eng. J. 2022, 447, 137585. [Google Scholar] [CrossRef]
- Gholami, F.; Tomas, M.; Gholami, Z.; Vakili, M. Technologies for the nitrogen oxides reduction from flue gas: A review. Sci. Total Environ. 2020, 714, 136712. [Google Scholar] [CrossRef]
- Muzio, L.J.; Quartucy, G.C.; Cichanowiczy, J.E. Overview and status of post-combustion NOx control: SNCR, SCR and hybrid technologies. Int. J. Environ. Pollut. (IJEP) 2002, 17, 4–30. [Google Scholar] [CrossRef]
- Zhijian, Z.; Xin, W.; Jian, C.; Honggang, C.; Yuguang, N. CFD Simulation and Optimization of SCR DeNOx System in a 660 MW Coal-Fired Power Plant. Proc. CSEE 2021, 041, 6688–6698. [Google Scholar] [CrossRef]
- Sun, W.; Ye, M.; Gao, Y.; Sun, Y.; Qian, F.; Lu, J.; Wu, S.; Huang, N.; Xu, B. Effect of Catalyst Inlet Flow Field Distribution Characteristics on Outlet NO Concentration Distribution in SCR Denitration Reactor Based on Monte Carlo Method. Atmosphere 2022, 13, 931. [Google Scholar] [CrossRef]
- Zheng, Y.; Yao, X.; Wang, D.; Chen, X.; Li, X. Flowfield optimization of SCR system in large size coal-fired units NOx ultra-low emission modification. Clean Coal Technol. 2021, 27, 212–217. [Google Scholar] [CrossRef]
- Liu, H.; Guo, T.; Yang, Y.; Lu, G. Optimization and Numerical Simulation of the Flow Characteristics in SCR System. Energy Procedia 2012, 17, 801–812. [Google Scholar] [CrossRef][Green Version]
- Gao, Y.; Liu, Q.; Bian, L. Numerical Simulation and Optimization of Flow Field in the SCR Denitrification System on a 600 MW Capacity Units. Energy Procedia 2012, 14, 370–375. [Google Scholar] [CrossRef]
- Hong, W.P.; Jian, S.C. Numerical Simulation of Flue Gas Flow and NH3 Diffusion Properties in SCR System. Adv. Mater. Res. 2014, 881–883, 1819–1822. [Google Scholar] [CrossRef]
- Yang, D.; Su, Y.; Wen, Q.; Zheng, H.; Ye, X. Mixing Enhancement of Ammonia and Flue Gas in the SCR DeNOx System. Clean Coal Technol. Sustain. Dev. 2016, 567–574. [Google Scholar] [CrossRef]
- Xu, Y.; Zhang, Y.; Wang, J.; Yuan, J. Application of CFD in the optimal design of a SCR—DeNO system for a 300 MW coal-fired power plant. Comput. Chem. Eng. 2013, 49, 50–60. [Google Scholar] [CrossRef]
- Gao, X.; Wang, B.; Yuan, X.; Lei, S.; Qu, Q.; Ma, C.; Sun, L. Optimal design of selective catalyst reduction denitrification system using numerical simulation. J. Environ. Manag. 2019, 231, 909–918. [Google Scholar] [CrossRef]
- Ye, D.; Wang, X.; Wang, R.; Gao, S.; Liu, H.; Wang, H. Optimizing flow field in an SCR system of a 600 MW power plant: Effects of static mixer alignment style. Waste Dispos. Sustain. Energy 2021, 3, 339–346. [Google Scholar] [CrossRef]
- Sohn, J.; Hwang, I.S.; Hwang, J. Improvement of ammonia mixing in an industrial scale selective catalytic reduction De-NOx system of a coal-fired power plant: A numerical analysis. Process Saf. Environ. Prot. 2021, 147, 334–345. [Google Scholar] [CrossRef]
- Kim, M.-G.; Seo, D.-C.; Chung, H.-T. A CFD Study on Flow Control of Ammonia Injection for Denitrification Processes of SCR Systems in Coal-Fired Power Plants. Energies 2021, 14, 1352. [Google Scholar] [CrossRef]
- Ye, M.; Qian, F.; Gao, Y.; Lu, J.; Han, Y.; Huang, N.; Xu, B.; Wu, H. CFD analysis of influencing factors on SCR denitration efficiency of sintering flue gas based on response surface methodology. Atmos. Pollut. Res. 2021, 12, 101107. [Google Scholar] [CrossRef]
- Xu, Y.; Zhang, Y.; Liu, F.; Shi, W.; Yuan, J. CFD analysis on the catalyst layer breakage failure of an SCR-DeNOx system for a 350MW coal-fired power plant. Comput. Chem. Eng. 2014, 69, 119–127. [Google Scholar] [CrossRef]
- Shang, D.; Li, B.; Liu, Z. Large eddy simulation of transient turbulent flow and mixing process in an SCR denitration system. Chem. Eng. Res. Des. 2019, 141, 279–289. [Google Scholar] [CrossRef]
Disclaimer/Publisher’s Note: The statements, opinions and data contained in all publications are solely those of the individual author(s) and contributor(s) and not of MDPI and/or the editor(s). MDPI and/or the editor(s) disclaim responsibility for any injury to people or property resulting from any ideas, methods, instructions or products referred to in the content. |
© 2022 by the authors. Licensee MDPI, Basel, Switzerland. This article is an open access article distributed under the terms and conditions of the Creative Commons Attribution (CC BY) license (https://creativecommons.org/licenses/by/4.0/).