Abstract
Unifying research data collection methods and capturing data streams in an organized and standardized manner are becoming increasingly important in laboratories as digital processes and automation progressively shape the laboratory workflows. In this context, the Internet of Things (IoT) not only offers the opportunity to minimize time-consuming and repetitive tasks by delegating them to machines, but it also supports scientists in curating data. As a contribution to the establishment of IoT tools in academic research laboratories, a microscale reaction calorimeter is exemplarily connected to a modular open-source IoT-platform. The microcalorimeter’s process data is streamed to the data platform for data repository and analysis. Advantages of the platform from academia’s point of view are presented. Finally, the application of the platform was successfully tested with the hydrolysis of acetic anhydride. The data were accessed and analyzed exclusively via the IoT-platform, which provided important advantages for the operator in terms of standardized evaluation in just a few steps.
1. Introduction
The Internet of Things (IoT) enables a technical world in which every device is connected to the internet and provides real-time data to both other devices and central control systems [1]. Thus, processes and workflows can be automated for many applications; however, here the focus is on chemical laboratories. These systems allow chemists, for example, to monitor their reactions in real-time and view the data as needed. In this context, automated, continuously operated, small-scale apparatuses in research laboratories in particular represent data factories whose data must be managed accordingly [2]. With such apparatuses, input parameters such as flow rate, temperature and stirrer speed can be changed quickly. The system also adapts quickly to changing conditions due to the small size. This allows sequential experiments to be performed in rapid succession, often in a semi-automated way, minimizing time-consuming and repetitive tasks for researchers and enabling them to focus more on interpreting results. In addition, data, and thus also research data, must be stored, processed and interpreted in a meaningful way. In 2016, Wilkinson et al. [3] published the “FAIR Data Principles”, which formulate principles that sustainable and reusable research data must fulfil and that data infrastructures should implement accordingly as part of the services they offer. According to the principles, data should be “Findable, Accessible, Interoperable and Re-usable”.
Many different platforms have been presented to realize automated processes in academic research laboratories and to monitor them. Since we perform research in the field of chemical engineering, the following overview of platforms presented in literature is limited to research groups in the same field. In the past, most autonomous platforms made use of LabVIEW [4] and Matlab® [5] for automation of equipment control and data management. For example, Cherkasov et al. [6] have developed OpenFlowChem on the basis of LabVIEW. Currently, open-source alternatives and cloud-based systems that enable remote control and monitoring are trending at university level [7,8]. The advantage of open-source software lies in reduced costs, since no licenses are required, the low entry barrier to programming through support from other researchers, the community and forums, as well as simple access to tutorials on the internet. Moreover, rapid transfer and adaptation is possible. Here, the developments of O’Brien et al. [9], Ingham et al. [10], and Steiner et al. [11] can be mentioned. Recently, van der Westhuizen et al. [12] presented an approach to monitor and control flow chemistry reactors using open-source software. They used the Node-RED platform [13] to develop dashboards, which is similar to LabVIEW. All the mentioned platforms still require different applications to be installed individually by the user and lack the possibility of accessing the various applications centrally at different locations by different users with individual rights, which supports the operator and data scientists in data processing and evaluation.
To standardize data management within our laboratory, we have teamed up with d-fine (Frankfurt a.M., Germany), a European consulting firm providing innovative and future-proof solutions through sustainable technological implementation to establish “d-fine’s smart containerized versatile analytics toolbox” (d-scover@) [14] for our experimental workflows. The open-source IoT-platform d-scover@ allows a quick setup of a sophisticated but robust data supply and analysis tool chain at the Laboratory of Equipment Design. Figure 1 shows how different smart devices can be connected to the d-scover@ platform.
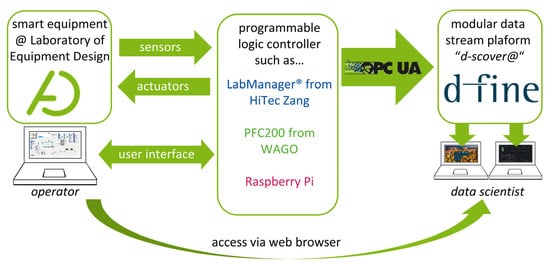
Figure 1.
Overview of the connection of the d-scover@ platform to existing smart equipment in laboratories.
Since our equipment is in most cases already connected to a programmable logic controller (PLC) such as LabManager® (HiTec Zang, Herzogenrath, Germany), Controller PFC200 (WAGO GmbH & Co., Minden, Germany) and single-board computers e.g., Raspberry Pi 4B (Raspberry Pi Foundation, Cambridge, England), existing interfaces can be used for data transfer. Within our research group, the interface of Open Platform Communications Unified Architecture (OPC UA) is established as the standard for data exchange.
By establishing the modular data stream platform, the following FAIR Guiding Principles according to Wilkinson et al. [3] are specifically addressed:
- data are assigned a globally unique and persistent identifier (F1),
- the protocol is open, free, and universally implementable (A1.1),
- the protocol allows for an authentication and authorization procedure where necessary (A1.2),
- data use vocabularies that follow FAIR principles (I2),
- data are released with a clear and accessible data usage license (R1.1),
- data meet domain-relevant community standards (R1.3).
The whole FAIR Guiding Principles are given in the work by Wilkinson et al. [3].
In this work, the d-scover@ platform from d-fine is used for data management of an automated microfluidic reaction calorimeter. For this, the IoT platform and its tools are presented first. Subsequently, the microcalorimeter and its measurement data are described. Finally, the benefits of using the IoT platform for the microcalorimeter are demonstrated and discussed with the investigation of the hydrolysis of acetic anhydride.
2. Materials and Methods
2.1. Open-Source IoT-Platform
Industrial corporates increasingly strive to automate as much of their value creation as possible to increase productivity, react faster to changing market conditions and disrupted supply chains, and to cope with a lack of qualified workforce. A digital representation of all inbound, in-house and outbound processes is mandatory for this.
Acquiring the necessary process data from machines and sensors, storing them in a consistent manner, and analyzing and sharing them—frequently not only across corporate divisions but also with suppliers and customers—requires a fully integrated end-to-end data platform. However, competing IT standards and protocols and the need to integrate external and “legacy” systems make this a daunting task. The same is true—albeit on a smaller scale—for scientific laboratory equipment, in particular if heterogeneous devices need to be managed. To facilitate quick operational wins and ensure a steep learning curve at virtually no cost, we use a modular open-source platform in our laboratory. d-fine’s IoT suite d-scover@ is available under a permissive open-source license and is used in industry and science to build reliable and secure data pipelines with minimal investment. It comprises open-source data storage backends and an Extract-Transform-Load (ETL) stack for extracting data from different sources, transforming them into the desired target format and loading the results into the storage systems. Modelling and data analysis capabilities are provided via a secure execution environment for Python notebooks. A reverse proxy, a web portal and tools for user management, logging, and network setup complement the system. In Figure 2, an overview of the underlying open-source tech-stack is provided.
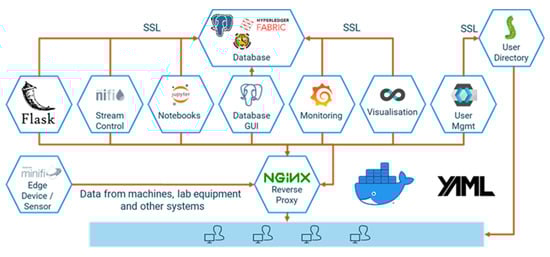
Figure 2.
d-scover@’s underlying open-source tech-stack.
d-scover@ provides for container-based deployment, ready-to-use network configuration, and CI-integration. It can be easily extended and allows for standalone user management or integration with active directory.
The suite was installed in the BCI department’s intranet and connected to the laboratory equipment described in Section 3.1 by members of the Laboratory of Equipment Design and the d-fine IIoT-division. Analyses discussed in Section 3.2 were performed with the python analytics backend of d-scover@. For details about the platform, installation support, and functional extensions please contact the corresponding author from d-fine.
2.2. Microscale Flow Reaction Calorimeter
2.2.1. Experimental Setup and Data Acquisition
The open-source IoT platform d-scover@ is used for the setup of a microcalorimeter employed in our laboratory. The continuously operated, microfluidic reaction calorimeter measures the temporal and spatial heat release of chemical processes using Seebeck elements (SEs), and thus enables the determination of thermokinetic data. The whole setup for calorimetric measurements is shown schematically in Figure 3.
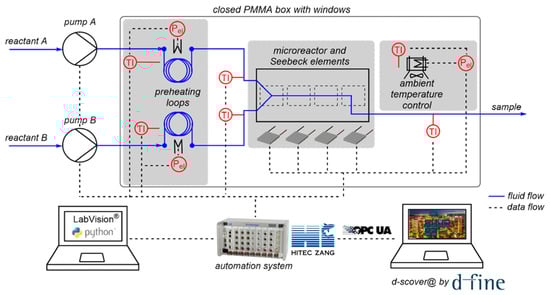
Figure 3.
Complete experimental setup used for calorimetric measurements including data flows.
As centerpiece of the setup, the microcalorimeter consists of a commercially available microreactor (LTF-MS, Little Things Factory, Elsoff, Germany) and twelve SEs (QC-31-1.0–3.0M, Quick-Ohm Küpper & Co., Wuppertal, Germany) to measure the heat flux along the reaction channel. The calorimeter is placed in a closed, temperature-controlled box made of aluminum profiles with transparent poly(methyl methacrylate) walls to minimize external influences on the measurements, in particular environmental temperature fluctuations. The reactants are fed into the reactor via syringe pumps (VIT-FIT, Lambda Instruments, Baar, Switzerland). The reactants’ inlet temperatures are controlled using preheating loops, which are also located in the closed box. The individual components such as pumps, SEs, and temperature sensors are connected to a laboratory automation system (LabManager®, HiTec Zang, Herzogenrath, Germany) enabling automated experimentation. A graphical user interface is generated using the proprietary visualization and automation software LabVision. Besides, the operator is assisted by a self-developed software-guided workflow. First, a sequence of experiments is determined by the operator, in which the flow rates and temperature can be varied. Next, the measured process data are imported by the LabManager® and the experiments are performed automatically in the specified order with the specified parameters.
2.2.2. Process and Calorimetric Data
During the performance of calorimetric measurements, measured process data are collected, which are subsequently used to determine calorimetric data such as the reaction enthalpy. The determination of the thermokinetic data is based on balancing of the energy of the entire system or the individual reactor sections above the SEs. Here, only a brief introduction of the energy balance is given. More details can be found in previous works [15,16]. The general energy balance equation that applies to both methods is given in Equation (1).
The heat fluxes that must be considered in the balance are the convective heat flux through the flow fluid , the measured heat flux of the SEs , the heat loss not measured by the SEs, and the energy brought into the system by the reaction . Since the experiments are evaluated in steady-state, Equation (1) can be solved for the reaction enthalpy , as shown in Equation (2).
Hence, the reaction enthalpy can be determined directly from measured process data once steady-state is reached. In Table 1, the process data measured by the calorimeter setup and the determined thermokinetic data using the calorimetric measurement method are listed.

Table 1.
Process data measured by microscale flow reaction calorimeter and thermokinetic data determined via calorimetric measurement methods.
2.3. Case Study: Hydrolysis of Acetic Anhydride
The acid-catalyzed hydrolysis of acetic anhydride (Ac2O) was chosen as a test reaction to establish the interaction between the calorimeter setup and d-scover@. The reaction often serves as a model reaction in calorimetry. In addition, the reaction was also recently studied in flow calorimeters, which allows a comparison [17,18,19]. Ac2O is split into two molecules of acetic acid (AcOH) under the consumption of water. The reaction scheme is shown in Equation (3).
Since Ac2O is partially miscible with water, the reaction can be carried out as single- or two-phase reaction. The reaction follows a pseudo first-order kinetics when a large excess of water is used. Literature values for its thermokinetic data are given in Table 2.
Table 2.
Thermokinetic parameter of the hydrolysis of acetic anhydride.
2.4. Experimental Procedure
In this study, the reaction enthalpy for the hydrolysis of acetic anhydride is determined. Two solutions are prepared for the experiments, an aqueous solution and a solution containing acetic anhydride. The aqueous solution consists of nitric acid, water, and acetic acid. Acetic acid is added to improve the mixing behavior, since acetic anhydride does not dissolve in water at the concentrations used. The concentrations of the solutions used are listed in Table 3.
Table 3.
Substances and concentrations used for hydrolysis of acetic anhydride.
The hydrolysis reaction was investigated at three temperature levels of 30, 40, and 50 °C. The total volumetric flow rates were set to 58, 147, 325, 504, 682, and 861 μL min−1. A flow rate ratio of aqueous solution to acetic anhydride of 1:1 was used.
For the experiments, all desired temperature and flow rates are automatically set by the PLC, with certain waiting times to allow for heating, cooling, and temperature adaption of the whole system. Steadystate measurements of the respective experimental settings are performed and every measurement point is recorded in triplets. Prior to the experiments, the SEs have been calibrated and baseline signal of the SEs have been recorded. The data streams from these two steps are currently not yet acquired via d-scover@, however this would be conceivable in the future. Further and more detailed information on the experimental procedure and the calorimetric measurement method itself can be found in [16].
3. Results
3.1. Acquisition and Monitoring of the Microcalorimeter’s Process Data Using d-scover@
As a first step in the d-scover@ application, we decided to stream only sensor and actuator data as raw data. This decision was triggered among others because the calculation of the heat fluxes measured via the SEs requires further calibration data, which change over time due to recalibration. Accordingly, the measured thermoelectric voltages of the SEs are transferred as raw data to enable a subsequent recalculation of heat fluxes with more up-to-date calibration data. The data flow to the d-scover@ platform is started only as soon as calorimetric measurements on the microcalorimeter are initiated, whereby a new value is sent every second. The frequency can be adjusted, but is sufficient for our application. Hence, unnecessary streaming and irrelevant data is avoided. In addition to the data listed in Table 1, other data are streamed that are set by the operator. The operator’s acronym, the name of the reaction being investigated, and the concentrations of the reactants used are provided by the operator. The last, but for continuously operated reactors crucial information, whether steady-state has already been reached, is also transmitted. Thus, a variable is set from 0 to 1 by the lab automation system when steady-state is reached.
All data to be streamed to the d-scover@ platform are generated as a node on the OPC UA server, which is provided by the LabManager®. The OPC UA server data are accessed via Apache Nifi, the software integrated in d-scover@ for defining data streams and interfaces. Once this data flow is generated, the data already stream into the PostgreSQL database. The database can be accessed via the integrated software pgAdmin. Finally, the data are visualized using Grafana. To prevent data streams from being edited or deleted by another user, different users with different rights were assigned via Keycloak, which is also integrated in d-scover@.
Once the data streams were set up in NiFi, a dashboard was generated using Grafana. This shows the essential experimental data that are important for both the operator of the calorimeter and the supervisor, for example. The final dashboard is shown in Figure 4.
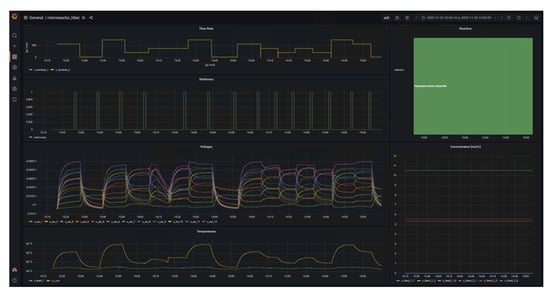
Figure 4.
Dashboard for visualization of experimental data during calorimetric measurements such as volumetric flow rates and temperatures.
The left side of the dashboard displays data from sensors and actuators and whether the system is in steady-state (1) or not (0) as time series, whereas the right side provides details of the reaction currently under investigation in form of the name and concentration in the respective feeds. A key benefit of d-scover@ for scientist working in labs is that the dashboard and all other tools can be accessed via the web browser on all workstations within our network. This allows the “supervisor in the office” not only to look up which reaction is currently being investigated, but also enables a much better and also more quantitative discussion of the results with the operator during online meeting through screen sharing, for example. In addition, the editable dashboard enables the time series of the data to be arranged as desired and thus to be arranged in relation to each other. It was only through this feature that we realized we needed to adapt the steady-state criterion. Previously, the steady-state criterion referred only to the change in the measured thermoelectric voltage of the SEs and required a change of less than 0.5% in a time span of 10 s. Therefore, Figure 5 shows exemplarily an excerpt from the dashboard during the investigation of the oxidation of sodium thiosulfate with hydrogen peroxide. This reaction is described in more detail in a previous work [16].
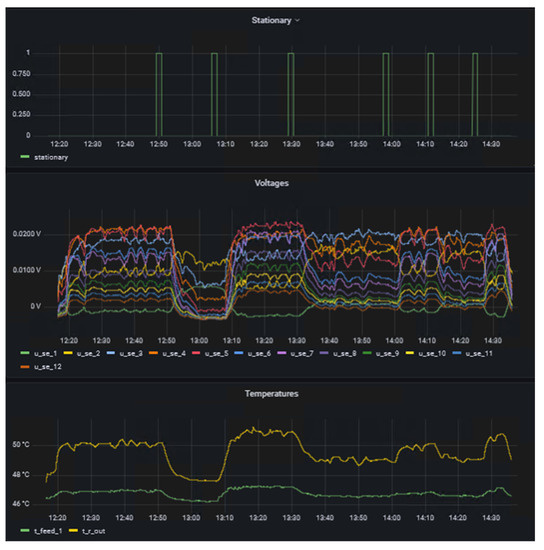
Figure 5.
Excerpt from the dashboard during the investigation of the oxidation of thiosulfate with hydrogen peroxide.
On one hand, it was observed that the measured thermoelectric voltages of the SEs fluctuate more at higher temperature level. This behavior was particularly evident for the oxidation of sodium thiosulfate, which was presented in a previous work [16]. On the other hand, it was observed that in some experiments the temperature at the reactor outlet was not yet completely in steady-state. Even though the temperature change was already minimal, some fluctuations could still be seen by comparing thermoelectric voltages and temperatures over time. The parametric sensitivity of this reaction and the influence of pH fluctuation on the reaction explain the dynamic reaction behavior even in steady-state. This was already observed by Gelhausen et al. [22] and is here well shown in the measured signals of the SEs. Hence, the steady-state criterion was adapted for the study of the hydrolysis of acetic anhydride. The following two conditions must be met for a measurement to be considered in steady-state:
- The voltage of the SEs must not fluctuate more than 0.25 mV for = 30, 40 °C, 0.50 mV for = 50 °C, and 0.75 mV for = 60 °C, in the last 30 s.
- The temperature at the reactor outlet must not fluctuate more than 0.5 °C in the last 180 s due to the delayed behavior.
Here, fluctuation refers to the difference of maximum and minimum value in the respective time span.
3.2. Calorimetric Data Management Using d-scover@
The application of d-scover@ to the microcalorimeter for data analysis was tested for the hydrolysis of acetic anhydride. The entire evaluation was performed using JupyterHub, which runs directly on the server where the data are also located. At first, we wrote a script that outputs which reactions were studied, and at what temperatures, concentrations, and volumetric flow rates each reaction was performed. There, the user gets to know which data can be selected in the next step for the evaluation of the reaction. As mentioned in the previous section, not all data needed for the determination of thermokinetics are streamed to the platform by measurements. For the evaluation of calorimetric measurements, the calibration factors of the SEs and the base line signals are loaded and stored via JupyterHub in the database. With this completed, the script for the evaluation can be executed with the respective input data from the user.
The determined heat of reaction is shown in Figure 6 for the different temperature level of the hydrolysis of acetic anhydride.
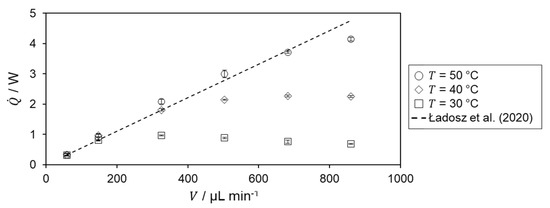
Figure 6.
Heat of reaction of hydrolysis of acetic anhydride at different temperature and volumetric flow rate. Literature value by Ładosz et al. [17] is indicated by dashed black line.
For = 30 °C, an increase is observed in the heat of reaction up to = 325 µL min−1. After that, the determined heat of reaction decreases. For the two lowest volumetric flow rates, the heat of reaction is in very good agreement with the literature value, from which the relative deviation is 0.47%. The decrease in heat of reaction for higher volumetric flow rates is probably due to incomplete conversion within the microreactor as the residence time decreases. According to Van’t Hoff rule [23], an increasing heat of reaction profile and better agreement with literature data are expected for higher temperatures.
For both = 40 and 50 °C, the determined heat of reaction increases with increasing flow rate matching the previously mentioned expectation. For further confirmation of incomplete conversion, the heat flux profiles are investigated. Therefore, the specific heat flux profile at a temperature level of 30 °C is shown in Figure 7.
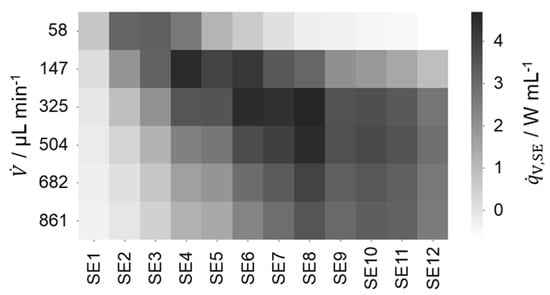
Figure 7.
Specific heat flux profile of the SEs for the hydrolysis of acetic anhydride for varying volumetric flow rate and
= = 30 °C.
For the lowest flow rate, the highest specific heat flux is present at SE 2. For the second-lowest flow rate, the highest specific heat flux is present at SE 4. This shift of the maximal specific heat flux to later reactor segments with increasing flow rates is consistent as residence time decreases and the reaction is kinetically and not mixing controlled. For the two lowest volumetric flow rates, a peak of the heat flux profile is observed within the first four SEs. Additionally, comparatively low heat fluxes are detected close to the reactor outlet. Hence, complete conversion is assumed for these flow rates supporting the agreement of the heat of reaction with the literature value, too. An analysis of the heat flux profiles at higher temperatures with these requirements for complete conversion shows that complete conversion can be assumed at the three lowest flow rates for = 40 and at all flow rates, except the highest one for = 50 °C.
The reaction enthalpy is calculated based on the respective calorimetric measurement and calculated heat fluxes, shown in Figure 8.
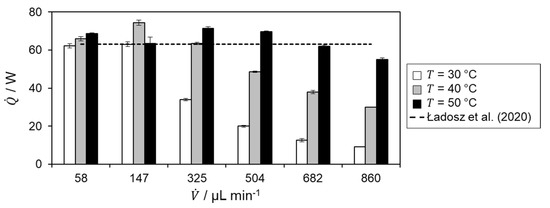
Figure 8.
Determined reaction enthalpy for hydrolysis of acetic anhydride from the experiments for the respective volumetric flow rates and temperatures in comparison with literature value by Ładosz et al. [17], which is indicated by a dashed black line.
Since the calculation of the reaction enthalpy is based on the determined heat of reaction, the same behavior is observed for the respective temperatures and volumetric flow rates in in Figure 6. In addition, it can be seen there that the heat of reaction and thus also the reaction enthalpy are overestimated in some cases. This is due to the determination of the heat loss as this is the only term in the energy balance that is not directly measured but determined numerically. Combining the determined reaction enthalpy of the flow rates, with complete conversion at the respective temperature level, yields in a reaction enthalpy of −65.9 ± 3.1 kJ mol−1. This is a relative deviation to the literature value of 4.6% [17]. Hence, good agreement with literature is obtained.
4. Conclusions and Outlook
In this study, a microscale flow calorimeter was connected to the modular open-source IoT-platform d-scover@ from d-fine. The existing OPC UA server was used to stream data into the platform allowing for data visualization, storage, and analysis. The platform was established successfully in a few days with the support of d-fine and a dedicated student assistant. By displaying the data in a dashboard, the need for an additional steady-state criterion became apparent, which was implemented directly. Additionally, the application and the benefit of the IoT-platform were evaluated with the hydrolysis of acetic anhydride and thiosulfate oxidation as test reactions, which allow for using standardized evaluation of the calorimetric measurements on different working stations within the local computer network. The facilitated data analysis led to a new consideration of stead-state status enabling fast and semi-automated experimentation. The reaction enthalpy of the test reaction obtained was in good agreement with literature data.
However, the low entry hurdle for operators with little to no programming experience should be emphasized as a key point here. All the essential tools that a researcher needs in the laboratory to store, visualize, and evaluate his measured values are provided without having to install them yourself. In addition, the use of open-source program allows a quick exchange of programs between researchers and the community or forums for help with issues.
As a current limitation, it should be mentioned here that only monitoring and no equipment control is possible with the current version of d-scover@. Remote control of equipment can be quite useful for some applications such as analytical equipment, but should be implemented sensibly with the appropriate security precautions as it associated with security risks such as intentional or accidental sabotage of experiments or equipment. In addition, we used a separate workstation for the IoT-platform, since docker requires at least 8 GB of RAM and we wanted to exclude a shutdown due to automated updates by our IT infrastructure.
The modular data platform complements the reaction calorimeter very well with additional functionalities. In future work, we want to connect further smart equipment of our laboratory such as a small-scale extraction column and a setup for optical detection of emulsions with the data platform. This approach will further harmonize data management within our laboratory and to apply FAIR Guiding Principles.
Author Contributions
Conceptualization, T.C., D.L. and T.A.F.; methodology, T.A.F., C.W. and N.K.; software, T.C., C.W. and T.B.; validation, C.W. and T.B.; formal analysis, T.A.F. and T.B.; investigation, T.B.; resources, T.C. and D.L.; data curation, C.W., T.B. and T.A.F.; writing—original draft preparation, T.A.F. and T.C.; writing—review and editing, N.K. and T.C.; visualization, T.B. and T.A.F.; supervision, T.A.F. and N.K.; project administration, N.K.; funding acquisition, N.K. All authors have read and agreed to the published version of the manuscript.
Funding
This research of the Forschungsvereinigung Forschungs-Gesellschaft Verfahrens-Technik e.V. (GVT) was funded by the German Federal Ministry of Economic Affairs and Climate Action via the Arbeitsgemeinschaft Industrieller Forschungsvereinigungen (AiF) within the framework of the program for the promotion of the Industrielle Gemeinschaftsforschung (IGF), grant number IGF no. 20819 N.
Data Availability Statement
Not applicable.
Acknowledgments
The laboratory of Equipment Design thanks d-fine GmbH for providing the IoT-platform dscover@ and especially Alexey Fofonov, Christoph Charlet and Tassilo Christ for their support in establishing it. T.A.F. thanks the networking program ‘Sustainable Chemical Synthesis 2.0′ (SusChemSys 2.0) for the support and fruitful discussions across disciplines.
Conflicts of Interest
The authors declare no conflict of interest.
Abbreviations and List of Symbols
| AcOH | acetic acid |
| Ac2O | acetic anhydride |
| BCI | Department of Biochemical and Chemical Engineering, TU Dortmund University |
| starting concentration of component i, mol L−1 | |
| concentration in feed 1, mol L−1 | |
| concentration in feed 2, mol L−1 | |
| activation energy, J mol−1 | |
| ETL | Extract-Transform-Load |
| FAIR | Findable, Accessible, Interoperable and Re-usable |
| mixing enthalpy, J mol−1 | |
| reaction enthalpy, J mol−1 | |
| IoT | Internet of Things |
| IIoT | Industrial Internet of Things |
| frequency factor, [(m3 mol−1)n−1 s−1] | |
| OPC UA | Open Platform Communications Unified Architecture |
| PLC | programmable logic controller |
| heat amount, J | |
| ingoing convective heat flux, W | |
| outgoing convective heat flux, W | |
| heat loss, W | |
| heat of reaction, W | |
| heat flux measured by SE, W | |
| SE | Seebeck element |
| time, s | |
| temperature, K | |
| ambient temperature, K | |
| inlet temperature of feed 1, K | |
| inlet temperature of feed 2, K | |
| outlet temperature of product stream, K | |
| thermoelectric voltage, V | |
| volumetric flow rate, m3 s−1 | |
| volumetric flow rate of feed 1, m3 s−1 | |
| volumetric flow rate of feed 2, m3 s−1 | |
| conversion, - |
References
- Rückert, T. The IoT Paves the Way for a Networked Economy. In The Internet of Things: Industrie 4.0 Unleashed; Sendler, U., Ed.; Springer: Berlin/Heidelberg, Germany, 2017; pp. 221–232. ISBN 9783662549049. [Google Scholar]
- Knoll, S.; Jusner, C.E.; Sagmeister, P.; Williams, J.D.; Hone, C.A.; Horn, M.; Kappe, C.O. Autonomous Model-Based Experimental Design for Rapid Reaction Development. React. Chem. Eng. 2022, 7, 2375–2384. [Google Scholar] [CrossRef]
- Wilkinson, M.D.; Dumontier, M.; Aalbersberg, I.J.; Appleton, G.; Axton, M.; Baak, A.; Blomberg, N.; Boiten, J.W.; da Silva Santos, L.B.; Bourne, P.E.; et al. Comment: The FAIR Guiding Principles for Scientific Data Management and Stewardship. Sci. Data 2016, 3, 160018. [Google Scholar] [CrossRef] [PubMed]
- Elliott, C.; Vijayakumar, V.; Zink, W.; Hansen, R. National Instruments LabVIEW: A Programming Environment for Laboratory Automation and Measurement. J. Assoc. Lab. Autom. 2007, 12, 17–24. [Google Scholar] [CrossRef]
- The Mathworks Inc. Matlab®. Available online: https://www.mathworks.com/products/matlab.html (accessed on 1 December 2022).
- Cherkasov, N.; Bai, Y.; Expósito, A.J.; Rebrov, E. V OpenFlowChem—A Platform for Quick, Robust and Flexible Automation and Self-Optimisation of Flow Chemistry. React. Chem. Eng. 2018, 3, 769–780. [Google Scholar] [CrossRef]
- Mateos, C.; Nieves-Remacha, M.J.; Rincón, J.A. Automated Platforms for Reaction Self-Optimization in Flow. React. Chem. Eng. 2019, 4, 1536–1544. [Google Scholar] [CrossRef]
- Kockmann, N. Digital Methods and Tools for Chemical Equipment and Plants. React. Chem. Eng. 2019, 4, 1522–1529. [Google Scholar] [CrossRef]
- O’Brien, M.; Hall, A.; Schrauwen, J.; van der Made, J. An Open-Source Approach to Automation in Organic Synthesis: The Flow Chemical Formation of Benzamides Using an Inline Liquid-Liquid Extraction System and a Homemade 3-Axis Autosampling/Product-Collection Device. Tetrahedron 2018, 74, 3152–3157. [Google Scholar] [CrossRef]
- Ingham, R.J.; Battilocchio, C.; Hawkins, J.M.; Ley, S.V. Integration of Enabling Methods for the Automated Flow Preparation of Piperazine-2-Carboxamide. Beilstein J. Org. Chem. 2014, 10, 641–652. [Google Scholar] [CrossRef] [PubMed]
- Steiner, S.; Wolf, J.; Glatzel, S.; Andreou, A.; Granda, J.M.; Keenan, G.; Hinkley, T.; Aragon-Camarasa, G.; Kitson, P.J.; Angelone, D.; et al. Organic Synthesis in a Modular Robotic System Driven by a Chemical Programming Language. Science 2018, 363, eaav2211. [Google Scholar] [CrossRef] [PubMed]
- van der Westhuizen, C.J.; du Toit, J.; Neyt, N.; Riley, D.; Panayides, J.-L. Use of Open-Source Software Platform to Develop Dashboards for Control and Automation of Flow Chemistry Equipment. Digit. Discov. 2022, 1, 596–604. [Google Scholar] [CrossRef]
- OpenJS Foundation & Contributors Node-RED. Available online: https://openjsf.org/category/node-red/ (accessed on 3 January 2023).
- Charlet, C.; Christ, T. Open Source IoT Data Pipelines; White Paper; d-fine: Frankfurt, Germany; München, Germany, 2022. [Google Scholar]
- Reichmann, F.; Millhoff, S.; Jirmann, Y.; Kockmann, N. Reaction Calorimetry for Exothermic Reactions in Plate-Type Microreactors Using Seebeck Elements. Chem. Eng. Technol. 2017, 40, 2144–2154. [Google Scholar] [CrossRef]
- Frede, T.A.; Greive, M.; Kockmann, N. Measuring Kinetics in Flow Using Isoperibolic Flow Calorimetry. Reactions 2022, 3, 525–536. [Google Scholar] [CrossRef]
- Ładosz, A.; Kuhnle, C.; Jensen, K.F. Characterization of Reaction Enthalpy and Kinetics in a Microscale Flow Platform. React. Chem. Eng. 2020, 5, 2115–2122. [Google Scholar] [CrossRef]
- Steinemann, F.L.; Rütti, D.P.; Moser, M.; Georg, A.G.; Meier, D.M. Simultaneous Determination of Enthalpy of Mixing and Reaction Using Milli-Scale Continuous Flow Calorimetry. J. Flow Chem. 2022, 12, 389–396. [Google Scholar] [CrossRef]
- Glotz, G.; Knoechel, D.J.; Podmore, P.; Gruber-Woelfler, H.; Kappe, C.O. Reaction Calorimetry in Microreactor Environments—Measuring Heat of Reaction by Isothermal Heat Flux Calorimetry. Org. Process Res. Dev. 2017, 21, 763–770. [Google Scholar] [CrossRef]
- Martin, H. Wärmeflusskalorimetrie Unter Präparativen Bedingungen Und Ihre Anwendung Zur Verfolgung Der Isomerisierungskinetik von Trimethylphosphit; Universität Basel: Basel, Switzerland, 1975. [Google Scholar]
- Zogg, A.; Fischer, U.; Hungerbühler, K. A New Small-Scale Reaction Calorimeter That Combines the Principles of Power Compensation and Heat Balance. Ind. Eng. Chem. Res. 2003, 42, 767–776. [Google Scholar] [CrossRef]
- Gelhausen, M.G.; Kurt, S.K.; Kockmann, N. Parametrische Empfindlichkeit Einer Stark Exothermen Reaktion Im Kapillarwendelreaktor. Chem. Ing. Tech. 2015, 87, 781–790. [Google Scholar] [CrossRef]
- Baerns, M.; Behr, A.; Brehm, A.; Gmehling, J.; Hofmamm, H.; Onken, U.; Renken, A.; Hinrichsen, K.-O.; Palkovits, R. Technische Chemie, 2nd ed; Wiley-VCH: Weinheim, Germany, 2013. [Google Scholar]
Disclaimer/Publisher’s Note: The statements, opinions and data contained in all publications are solely those of the individual author(s) and contributor(s) and not of MDPI and/or the editor(s). MDPI and/or the editor(s) disclaim responsibility for any injury to people or property resulting from any ideas, methods, instructions or products referred to in the content. |
© 2023 by the authors. Licensee MDPI, Basel, Switzerland. This article is an open access article distributed under the terms and conditions of the Creative Commons Attribution (CC BY) license (https://creativecommons.org/licenses/by/4.0/).