Article

Workers’ Opinions on Using the Internet of Things to Enhance the Performance of the Olive Oil Industry: A Machine Learning Approach

1
Department of Computer Science, College of Computer and Information Sciences, Jouf University, Sakaka 72341, Saudi Arabia
2
Centre for Health Technology, Faculty of Health, University of Plymouth, Plymouth PL4 8AA, UK
*
Author to whom correspondence should be addressed.
Processes 2023, 11(1), 271; https://doi.org/10.3390/pr11010271
Submission received: 20 September 2022 / Revised: 2 January 2023 / Accepted: 6 January 2023 / Published: 14 January 2023

Abstract

:
Today’s global food supply chains are highly dispersed and complex. The adoption and effective utilization of information technology are likely to increase the efficiency of companies. Because of the broad variety of sensors that are currently accessible, the possibilities for Internet of Things (IoT) applications in the olive oil industry are almost limitless. Although previous studies have investigated the impact of the IoT on the performance of industries, this issue has yet to be explored in the olive oil industry. In this study we aimed to develop a new model to investigate the factors influencing supply chain improvement in olive oil companies. The model was used to evaluate the relationship between supply chain improvement and olive oil companies’ performance. Demand planning, manufacturing, transportation, customer service, warehousing, and inventory management were the main factors incorporated into the proposed model. Self-organizing map (SOM) clustering and decision trees were employed in the development of the method. The data were collected from respondents with knowledge related to integrating new technologies into the industry. The results demonstrated that IoT implementation in olive oil companies significantly improved their performance. Moreover, it was found that there was a positive relationship between supply chain improvements via IoT implementation in olive oil companies and their performance.

1. Introduction

Digital transformation is the application of digital innovations to enable a company to make large advancements and to influence all aspects of clients’ and customers’ lives [1,2]. The ability of businesses to participate in the so-called industrial revolution 4.0, defined by the convergence of digital, physical, and biological technology, may determine their chances of surviving and competing in the global market in the medium term [3]. At the organizational level, digital transformation focuses on innovative tactics that leverage digital technology to improve and boost corporate operations [4].
Using digital tools for business and process management, the manufacturing industry has experienced a digital revolution in the last few decades [5,6,7]. The Internet of the future will be based on heterogeneous devices that will further expand the boundaries of the world’s physical and virtual entities [8]. As a result, human intervention is not required to transmit these data via computers through a network. They can form an interface with other operators or machines to make the operation more efficient and easier. Technology has evolved as the backbone of the industrial sector in today’s technologically advanced and diverse globe. The IoT or Internet of Things is widely recognized as a new information technology revolution, producing a paradigm shift in various industries, including the entire production of supply chain management [9,10]. The IoT refers to networked computing devices, both digital and mechanical, that use sensors linked to people and machines to generate unprecedented volumes of valuable and precise data about processes in order to improve them [11].
According to previous research, today’s global food supply chains are highly dispersed and complex, spanning a large geographical range, involving complex operational processes and involving many stakeholders [12,13]. Researchers claim that this complexity leads to numerous issues with operational efficiency, quality management, and public food safety. In the food supply chain, the IoT, which collects data through sensors, has significantly affected the normal operations of supply chains [12,14].
Utilizing IoT in the food industry’s supply chain has enabled the measurement and monitoring of numerous sustainability indicators such as water efficiency, crop productivity, and the amount of fertilizer used [15,16]. The IoT has been utilized extensively to facilitate the interconnection of objects regardless of their location to share data throughout the supply chain [17,18]. Perishable food items can be tracked using radio frequency identification or RFID in the food supply chain, including temperature monitoring during storage and shipping and the determination of shelf life. Livestock, quality control, cold-chain monitoring management, supply chain management, and food traceability are other RFID applications.
Adopting and effectively utilizing IT is likely to increase a company’s efficiency. Workers must change their abilities to more analytical and computational abilities in an organization. Artificial Intelligence (AI), machine learning, and the IoT all work together to support a company’s overall growth strategy. Market organization has benefited from technological advancements because they have made it more convenient.
As a result, rather than changing a single component, the entire process must be updated to achieve the result desired from the technology. The organization must concentrate on a competitive strategy to avoid disruptions to the current business model. As a result of technical improvements, business organizations have grown tremendously, and these improvements help to improve existing company processes and work practices. Technological innovation has led to the discovery of a new and more efficient manner of conducting business, enabling companies to function more efficiently, rapidly, and easily. According to Ford, humans must also learn about the talents of automation in order to benefit from its cheaper costs and faster performance.
Because of the wide variety of sensors that are currently accessible, as well as the even greater availability of tools based on AI solutions to analyze the large number of data collected, the possibilities for IoT applications in the olive oil industry are almost limitless. It is possible to improve supply chain processes and control at all levels, from raw materials within a plant to the distribution of products to businesses, by using IoT technologies in agri-food industries [15,16], such as the olive oil industry. It also streamlines the data-collecting process, assisting the olive oil sector in maintaining greater levels of safety and traceability throughout the whole supply chain, as well as reducing costs, waste, and even risks.
It is widely accepted that the IoT can significantly affect industry performance from different perspectives, such as supply chain performance, financial performance, and environmental performance [19]. However, although previous studies have investigated the impact of the IoT on the performance of industries [20,21], this issue has yet to be explored in the olive oil industry. In addition, most previous studies have used old-style mythologies to assess the IoT’s contributions to industries’ performance. Machine learning techniques have rarely been explored and implemented to find the relationship between supply chain improvement and olive oil companies’ performance. This problem was investigated in relation to olive oil companies in this study. To understand the role of the IoT in olive oil company performance, in this study, we aimed to develop a new model to investigate the factors influencing supply chain improvement in olive oil companies. In addition, through the use of a model, we aimed to evaluate the relationship between supply chain improvement and olive oil companies’ performance. Demand planning, manufacturing, transportation, customer service, warehousing, and inventory management were the main factors incorporated into the proposed model. Accordingly, a new method of data analysis using machine-learning techniques was developed. Clustering and decision trees were employed in the development of the method. The proposed model used several factors discovered through a literature review. The data for this study were collected from respondents with knowledge of the integration of new technologies into the industry. Self-organizing map (SOM) clustering and decision trees were employed in the development of the method. SOM has been an effective technique for data clustering. In addition, the decision tree technique is robust for output prediction from a set of input variables. The hybrid combination of these techniques was believed to accurately predict the relationship between supply chain improvement and olive oil companies’ performance. We present the abbreviations used in this study in Table 1.
The remainder of this paper is organized as follows. In Section 2, the role of the IoT in agriculture is presented. In Section 3, we summarize the related studies to the olive oil production. In Section 4, the proposed model is presented. In Section 5, we present the method of data analysis. In Section 6, data collection and analysis are presented. The discussion is presented in Section 7. Finally, the conclusions are presented in Section 8.

2. IoT Application in Agriculture and the Olive Oil Industry

The Internet of Things (IoT) in agriculture, or IoT-based smart agriculture, refers to a network in which the physical components of the system (plants and animals, production tools, environmental elements, and various virtual objects) are connected to the Internet through the use of equipment for agricultural information management under certain protocols to exchange information within different components [22,23]. Sensors made using new technologies based on the IoT are constantly being developed in the agricultural sector for different purposes, driven by the development of the Internet, digital technology, and sensing technology [24]. These sensors are moving in the direction of being embedded, integrated, intelligent, and miniaturized. The United States, Japan, and Germany currently hold leading positions in relation to sensor technology and manufacturing methods. The roles of agricultural sensors are becoming increasingly diverse and now include weather, water, soil, and plant sensors. These sensors, which can be used to identify a wide range of items, provide invaluable assistance in collecting agricultural production data [25]. Industrialized countries’ agricultural IoT applications are becoming more efficient as information technology progresses. Monitoring and intelligent management can be used with artificial intelligence technologies to maximize sensor data utilization. When utilized in conjunction with expert systems, the Internet of Things in agriculture helps planters improve their planting experience while conducting accurate crop management. The IoT has been widely applied to many elements of agricultural production, including environmental monitoring in agricultural product production, farmland irrigation, and product safety traceability. It has also been utilized in veterinary medicine, aquaculture, and agricultural planting.
The applications of the IoT in agri-food can be divided into three categories depending on their functions: tracing, tracking, and monitoring for precision agriculture, agricultural machinery, and greenhouse applications [25,26]. Growing plants in a controlled environment is known as greenhouse growing or greenhouse gardening. Wireless sensor networks (WSNs) are used to monitor the conditions that allow for increased efficiency, energy savings, and the need for minimal human interaction [27]. Precision agriculture involves the control of farm variables such as uniform equipment and labor availability, cost, crop maturity, weather, and air and soil quality. Precision agriculture refers to the control of agricultural variables. Precision agriculture is made possible using Internet of Things sensor nodes in conjunction with BDA [28,29]. Machines connected to the Internet of Things can be operated on autopilot, decreasing losses and increasing production. Tracking agri-food goods allows the client to understand the product’s history better. RFID provides a data capture process that is visible to all parties involved in the process. Internet-of-Things-based solutions can be implemented to properly monitor animal farming, crop farming, forestry, and aquaponics operations [30,31].
The IoT makes it feasible to monitor and measure several sustainability indicators in the agri-food supply chain, such as fertilizer use, crop yield, and water efficiency. IoT-based devices enable items to be interconnected regardless of their location, allowing for information sharing throughout the supply chain [26]. Both RFID and WSN enable the collection of data, as well as the dissemination of data and information. RFID is frequently used in the food industry’s supply chain to monitor temperature during storage and transit and to estimate and calculate shelf life [32]. Other RFID uses include quality control, supply chain management, cold-chain monitoring, livestock management, and food product traceability. For example, devices measuring pressure, acceleration, humidity, temperature, and light are frequently used in monitoring, transportation, and food storage applications. It is vital to detect and measure sustainability indicators to develop a sustainable agriculture and food supply chain [33]. The fact that agricultural sustainability indicators are always changing makes measuring and monitoring them difficult. In order to evaluate and monitor overall sustainability in agriculture, high levels of skills are required, in addition to the ability to adapt to change. IoT technology is justified in its application to the construction of a sustainable agriculture and food supply chain when combined with the ability to gather and send data, scalability, and flexibility. One of the most important components is the data collected by smart agriculture sensors. This information can be used to monitor the state of the company, as well as the performance of the workforce and the efficiency of the equipment. When it comes to planning for better product distribution, having the ability to predict the output of production is essential.
The owners of farms can collect data regarding their livestock’s location, well-being, and health by utilizing wireless applications for the IoT. This information not only helps to stop the spread of disease but also reduces the amount of money spent on labor. A climate-controlled smart greenhouse built with the assistance of the Internet of Things eliminates the need for human involvement by intelligently monitoring and controlling the environment. Predicting crops is extremely important since it enables farmers to better plan for the future in terms of the production of the crop, as well as its storage, various marketing strategies, and risk management. The artificial network uses the information gathered by sensors on the farm to make production rate predictions for the crop. The characteristics of soil, temperature, pressure, rainfall, and humidity are all included in this report. The dashboard or mobile application that the farmers have specifically designed can provide them with reliable data related to the soil.

3. Related Works

There have been several studies on the use of IoT in the olive oil industry. In one study [34], the authors examined the use of an IoT blockchain-based framework to certify the extra virgin olive oil supply chain. The authors developed a blockchain-based system for the traceability and certification of the extra virgin olive oil supply chain. In another study [35], the authors developed a tool to reveal the efficiency of an open-source visible and near infra-red spectrophotometer for the assessment of the geographical origin of olive oil. They used an artificial neural network (ANN) to classify extra virgin olive oil. In another study [36], the authors studied the relationship between competitive advantage and the use of a blockchain in the olive oil industry. They found that the use of a blockchain combined with IoT devices could significantly improve visibility and avoid fraud in the olive oil quality, which led to a competitive advantage in the industry. In [37], the authors presented a multi-sensor traceability system using the IoT. The authors aimed to enable the implementation of a supply chain system in the industry that would allow for tracking the route of olive oil from the producer to the customer via the oil factory. In [38], the authors focused on traceability in the olive oil production chain and indicators of its quality, as well as environmental and social sustainability indicators. They used smart contracts and blockchain technology to solve this issue.

4. Proposed Model

In this study, we aimed to develop a model to measure the performance of olive oil companies by improving their supply chains using the IoT. The proposed model is illustrated in Figure 1. Demand planning, manufacturing, transportation, customer service, warehousing, and inventory management were the main factors incorporated into the proposed model. The model was based on the factors used in previous studies [39,40,41,42,43]. The relationship between these factors and the supply chain was investigated in the first stage, and the relationship between the supply chain and olive oil companies’ performance was investigated in the second stage.
  • Demand planning: Demand planning is the linchpin of an effective supply chain and is a component of supply chain management that involves forecasting future demand and tailoring company output to meet those projections [44,45]. An effective supply equilibrium is one in which store inventories contain only the number of products required by the demand and no more or less than that number [46]. The delicate balance between having enough and too much can be difficult to achieve. The primary concern in demand planning, aside from the ongoing effort to help shape demand through the effective use of promotions, is to maintain this delicate balance at all times [47]. For effective demand planning, it is typically necessary to employ demand forecasting techniques that accurately predict demand trends. This has additional benefits, including increased company efficiency and customer satisfaction. Thus, in this study, we assumed that demand planning would significantly influence the company supply chain in the olive oil industry (H1).
  • Manufacturing: Manufacturing refers to the creation of products using equipment, tools, labor, and biological or chemical processing or preparation [48,49]. According to this definition, manufacturing can either refer to the large-scale development and transformation of raw materials into completed goods or the development of more intricate objects through the selling of basic goods to manufacturers to produce items such as home appliances, vehicles, and airplanes [50,51]. The manufacturing process, often known as manufacturing engineering, is the process through which raw materials are turned into completed goods. This operation is carried out by starting with the design of the product and the selection of materials [52,53]. The raw materials are turned into the finished product throughout the manufacturing process. Fabrication is a word used by some manufacturers to describe the several intermediate techniques utilized to construct the components of a final object in today’s highly sophisticated manufacturing environments [54]. Manufacturing is strongly associated with engineering and the design of industrial processes [55]. Thus, in this study, we assumed that the manufacturing would significantly influence the company supply chain in the olive oil industry (H2).
  • Transportation: The movement of people and goods is the focus of the transportation industry, which is a significant part of the economy and an important industry sector [56]. Companies that fall within this category include airlines, trucking enterprises, railroads, and shipping and logistics businesses, as well as companies that supply the infrastructure for various modes of transportation. The availability of transport eases the burden of the immobile components of production, and the transport industry’s growth encourages increased labor and capital mobility. The movement of people from one location to another can be facilitated when there is an effective network of transport services [57]. The transportation and logistics sector is experiencing significant disruption, including digital transformation, new market entrants, and shifting customer expectations, and new business models are still developing. For the economy to generate products and services, transportation products must first be manufactured from a variety of services and must then be combined with other inputs. As an intermediate good, transportation has a “derived demand”, also known as a “derived market”. The theory of production can help direct our thinking about how to manufacture transportation products efficiently and how to use transportation to produce other things effectively [58]. Thus, in this study, we assumed that transportation would significantly influence the company supply chain in the olive oil industry (H3).
  • Customer Service: Customer service is the assistance and direction that a company provides to individuals before, during, and after purchasing a product or service from that company [59]. This assistance and direction can be offered before, during, or after the transaction. There is a direct correlation between satisfied customers, continued loyalty to a company’s brand, and increased sales of the company’s products or services [60]. When running a successful business, ensuring the pleasure of one’s clientele has always been an important factor, but in today’s world, this factor is more important than it has ever been in the past. The market is flooded with various options to meet the high expectations that consumers place on brands. Service needs to be an integral part of every stage of the customer’s journey, beginning with the very first interactions and continuing for a significant amount of time after the point of purchase. Customer service is essential to the customer lifecycle and loyalty in an economy that prioritizes digital transformation. In order to reduce customer churn, sales and customer service must be able to coordinate their efforts in real time, efficiently share information about individual customers in a protected environment, and use this information better to understand their needs and expectations [61]. Thus, in this study, we assumed that customer service would significantly influence the company supply chain in the olive oil industry (H4).
  • Warehousing: The process of storing physical inventory in preparation for sale or distribution is known as warehousing [62]. Warehouses are utilized by a wide variety of businesses, and their primary purpose is to temporarily store products in large quantities before either transporting them to other locations or selling them individually to final customers [63]. For instance, many e-commerce businesses buy products in bulk from their suppliers, who then ship the products to the business’s warehouse, where they are stored. After that, when an end customer places an order through the e-commerce site, the company—or its third-party fulfillment provider—selects, packs, and ships the product to the customer directly from the warehouse. The warehousing industry as a whole has been accelerated by the growth that has been driven by e-commerce. The market has more than doubled over the past decade due to substantial investments made by companies located worldwide in their respective supply chains [64]. These investments were made to deliver goods to customers and other businesses. This is not exclusive to businesses involved in online commerce. Most businesses that engage in physical retail have limited space in their stores to store their inventory, despite the fact that they still need to keep up with demand. Even if their suppliers are located in other countries, and it takes a long time to produce and ship new products, they will be able to restock their stores during high-volume times like the holidays if they have additional inventory available in nearby warehouses. This helps ensure that they will always be able to meet customer demand. Thus, in this study, we assumed that warehousing would significantly influence the company supply chain in the olive oil industry (H5).
  • Inventory management: The management of inventories enables businesses to determine which stocks to order, how much of each, and when to place their orders [65]. It involves keeping track of the inventory from the time of purchase until after the goods have been sold. This practice identifies trends and reacts to them so that there is always enough stock to fulfill customer orders and that they are given an adequate warning if there is a shortage. Inventory turnover is one metric that can be used to evaluate how well an organization manages its stock. Inventory turnover is a measurement used in accounting that indicates how frequently stock is sold during a given time [66]. It is not ideal for a company to have more inventory than it sells. A low inventory turnover rate can result in deadstock, another name for unsold stock [67]. Inventory management is essential to the success of a business because it helps to ensure that there is never an excessive amount or insufficient amount of stock on hand, thereby reducing the likelihood of stockouts and inaccurate records. Inventory management aims to gain a comprehensive understanding of stock levels and the location of stock within warehouses. The flow of products from the supplier through the production process and to the customer is monitored using software designed for inventory management. Inventory management keeps track of all activities that occur in the warehouse, including stock receipts, picking, packing, and shipping [68]. Thus, in this study, we assumed that the management of inventories would significantly influence the company supply chain in the olive oil industry (H6).
  • Supply chain: Businesses increasingly look to their supply chains or SCs for a competitive advantage. The goal of studying supply chain management is to increase a company’s value by using its resources in the best way. A company’s supply chain comprises all the processes that add value and connect the provider to the end-user. The fundamental SC activities are receiving input from the firm’s suppliers, adding value to that input, and then delivering the improved product or service to the firm’s customers. The supply chain refers to all of the organizations and individuals who play a role, however indirectly, in meeting a customer’s demand. The supply chain includes producers, distributors, shippers, warehousing facilities, retailers, and consumers. The SC refers to the entire sequence of steps taken within an enterprise, such as manufacturing, to fulfill a customer order. This category includes developing new products, promotion, financing, distribution, operation, and customer service. In order to create and maintain a competitive advantage in their products and services, businesses require efficient supply chain management. Thus, in this study, we assumed that the supply chain would significantly influence the company’s performance in the olive oil industry (H7).
The methods adopted for data analysis are provided in the following sections. Clustering and decision trees were employed in the method’s development. The data for this study were collected from business leaders with knowledge of the integration of new technologies into the business, as well as IoT experts. Data were clustered, and decision trees were implemented to forecast the performance of the olive oil companies based on several factors.

5. Materials and Methods

5.1. Background Work

5.1.1. SOM Clustering

There are 2 layers in an SOM: the input and output [69,70]. The output layer is also called the Kohonen layer. The SOM’s overall architecture is depicted in Figure 2. Many neurons in the output layer are completely connected to the input neurons. As shown in Figure 2, the output space is 2-dimensional. The learning algorithm utilized to train the SOM is based on unsupervised and competitive learning.
The following provides a brief overview of the SOM training process. The SOM’s input pattern can be represented by the following equation [71]:
x = [ x 1 ,   x 2 ,   x ] T
where x is the input pattern and represents the size of x .
Accordingly, synaptic weight vectors (SWVs) [72] of neurons in the output layer are indicated by:
w j = [ w j 1   ,   w j 2 ,   w j ] T
where the SWVs of neuron j are indicated by w j , j = 1 , 2,…, p , and p is the Kohonen layer’s total number of neurons.
At the start of the training process, the SWVs are initialized with small random numbers. This serves as a starting point for the training process in the self-organizing map. This is identified as competitive learning in self-organizing maps because the network’s neurons in the system compete with one another to find which neuron will be activated and therefore become the winning neuron in this competition. Neurons compete to see which one has the greatest degree of similarity between their SWVs and input patterns. These SWV similarities are utilized to decide which neuron will win the competition. As a result, the following equation can be used to find the winning neuron:
i ( x ) = a r g   m i n   x w j ,   j = 1 , 2 , , p
where represents the Euclidean distance and i ( x ) indicates the neuron closest to x . Thus, the Euclidean distance is calculated by:
x w j = i = 1 ( x i w j i ) 2 ,   j = 1 , 2 , , p
The Euclidean distance is considered a typical comparison metric to compare two items. A smaller x w j indicates greater proximity between the input pattern x and the SWV w j . As a result, the winning neuron is selected by calculating and comparing the distances from the current point x in the network to all output neurons. The winning neurons are those with the shortest distance from the current input pattern. Finally, the lateral interactions between a triumphant neuron and the others around it are investigated. The winning neuron’s impact on its neighbors is computed through the use of the topological neighborhood function. A topological representation of the area is a neighborhood function.
h j i ( x ) ( t ) =   exp   ( d j , i 2 2 σ 2 ( t ) )
In the above equation, t = 0 ,   1 ,   2 , , n , d j , i indicates the Euclidean distance between the neighboring neuron j and the winning neuron i and σ   ( t ) indicates the topological neighborhood’s width at time t . In this equation, h j i ( x ) ( t ) indicates the topological neighborhood at time t . This is accomplished by means of the following equation, which is used to alter the values of synaptic weights based on changes in input patterns [73]:
w j ( t + 1 ) = w j ( t ) + η ( t ) h j j ( χ ) ( t ) ( x w j ( t ) )
In the above equation,   w j ( t + 1 ) indicates the SWV of neuron j at time t + 1 and η ( t ) indicates the learning rate at time t . The learning rate in the learning process will decrease with time according to the following equation:
η ( t ) = η ( 0 )   exp   ( r 1000 )
in which the initial learning rate is indicated by η ( 0 ) . When the operation is repeated, the winning neuron and its neighboring neurons grow in a similar manner to the relevant input pattern. After the completion of network learning, a trained SOM is obtained.

5.1.2. Decision Trees (DTs)

DT is a predictive learning approach that combines observations of a phenomenon with judgments about the target value of the issue under investigation. Learning, in this technique, is performed to discover a DT from the dataset. This technique is widely utilized in spatial data mining applications [74]. Each internal node in the DT includes a variable from the data, and each edge corresponds to a child [75]. Each leaf in the DT indicates a target variable’s value, depending on the input variables’ values. A DT can be discovered by subdividing a source set and observing the results of an attribute value test. It is critical to repeat this method for each derived subset. Recursion is completed when splitting is no longer necessary or when a single categorization can be implemented for all samples in the resulting subset, whichever comes first. DTs provide human-readable rules that describe the relationships in a dataset and can be utilized for prediction and classification. This machine-learning technology is widely used in a variety of disciplines, including disease detection [76], security [77], business [78], and education [79]. It is important to note that the obtained DT structure must be as simple as possible. For DTs to be effective, they must be able to reliably discover the knowledge learned from the dataset to predict new data. By adding new training data, most DTs can be augmented, which means that the DT can be modified.
There are various kinds of DTs. Some DTs produce an output consisting of a set of values of a discrete nature. These types of trees are referred to as categorization trees. Classification and regression trees, or CARTs, produce both classification and regression results. In this study, we used the CART method to analyze the data to discover the decision rules. The first node (the root node) contained all the information in the CART model. The splitter variable from the data with the best purity and homogeneity in each branch was then employed in the final step of the process to construct a split in the root according to each branch’s splitter variable. At tree branches, the classification of variables was performed until the data in the corresponding node had become sufficiently homogeneous to fall into a specific classification. These were the result classes, which were represented by leaf or terminal nodes. The internal nodes were the nodes that lay between the terminal nodes and the root node of a network. In order to select the splitter variable, many different indices can be used. The Gini index (GI) [80] was used in this investigation. The greatest GI value, on the other hand, was obtained when all of the data in a node belonged to every category. When all of the data for a corresponding node belonged to a single category, the node was produced with the utmost purity possible, and the GI would be 0. When all variables of a corresponding node were determined, the GI was calculated for each variable, and the variable from the dataset with the lowest GI value was chosen as the splitter. The GI used in CART was defined according to the following equation:
G I N I ( P ) = i = 1 n p i ( 1 p i ) = 1 i = 1 n ( p i ) 2
in which p i represents the likelihood that a given object will be placed in a specific category.

6. Results

In this study, we collected the data using a questionnaire survey. The questionnaire survey included questions based on a five-point Likert scale for all constructs in the model. The data for this study were collected from respondents with knowledge regarding the integration of new technologies into the industry. The demographic information of the respondents is presented in Table 2, Table 3, Table 4 and Table 5.
In total, 552 respondents completed the questionnaire and provided feedback on the questions. Most respondents were male (78.3%: 432; see Table 2). The majority of the respondents also had Ph.D. degrees (48.4%: 267; see Table 3). The category related to respondents’ employment in the industry showed that most of them had full-time employment (see Table 4). The demographic information demonstrated that the respondents were greatly familiar with the use of IoT devices in the industry (see Table 5).
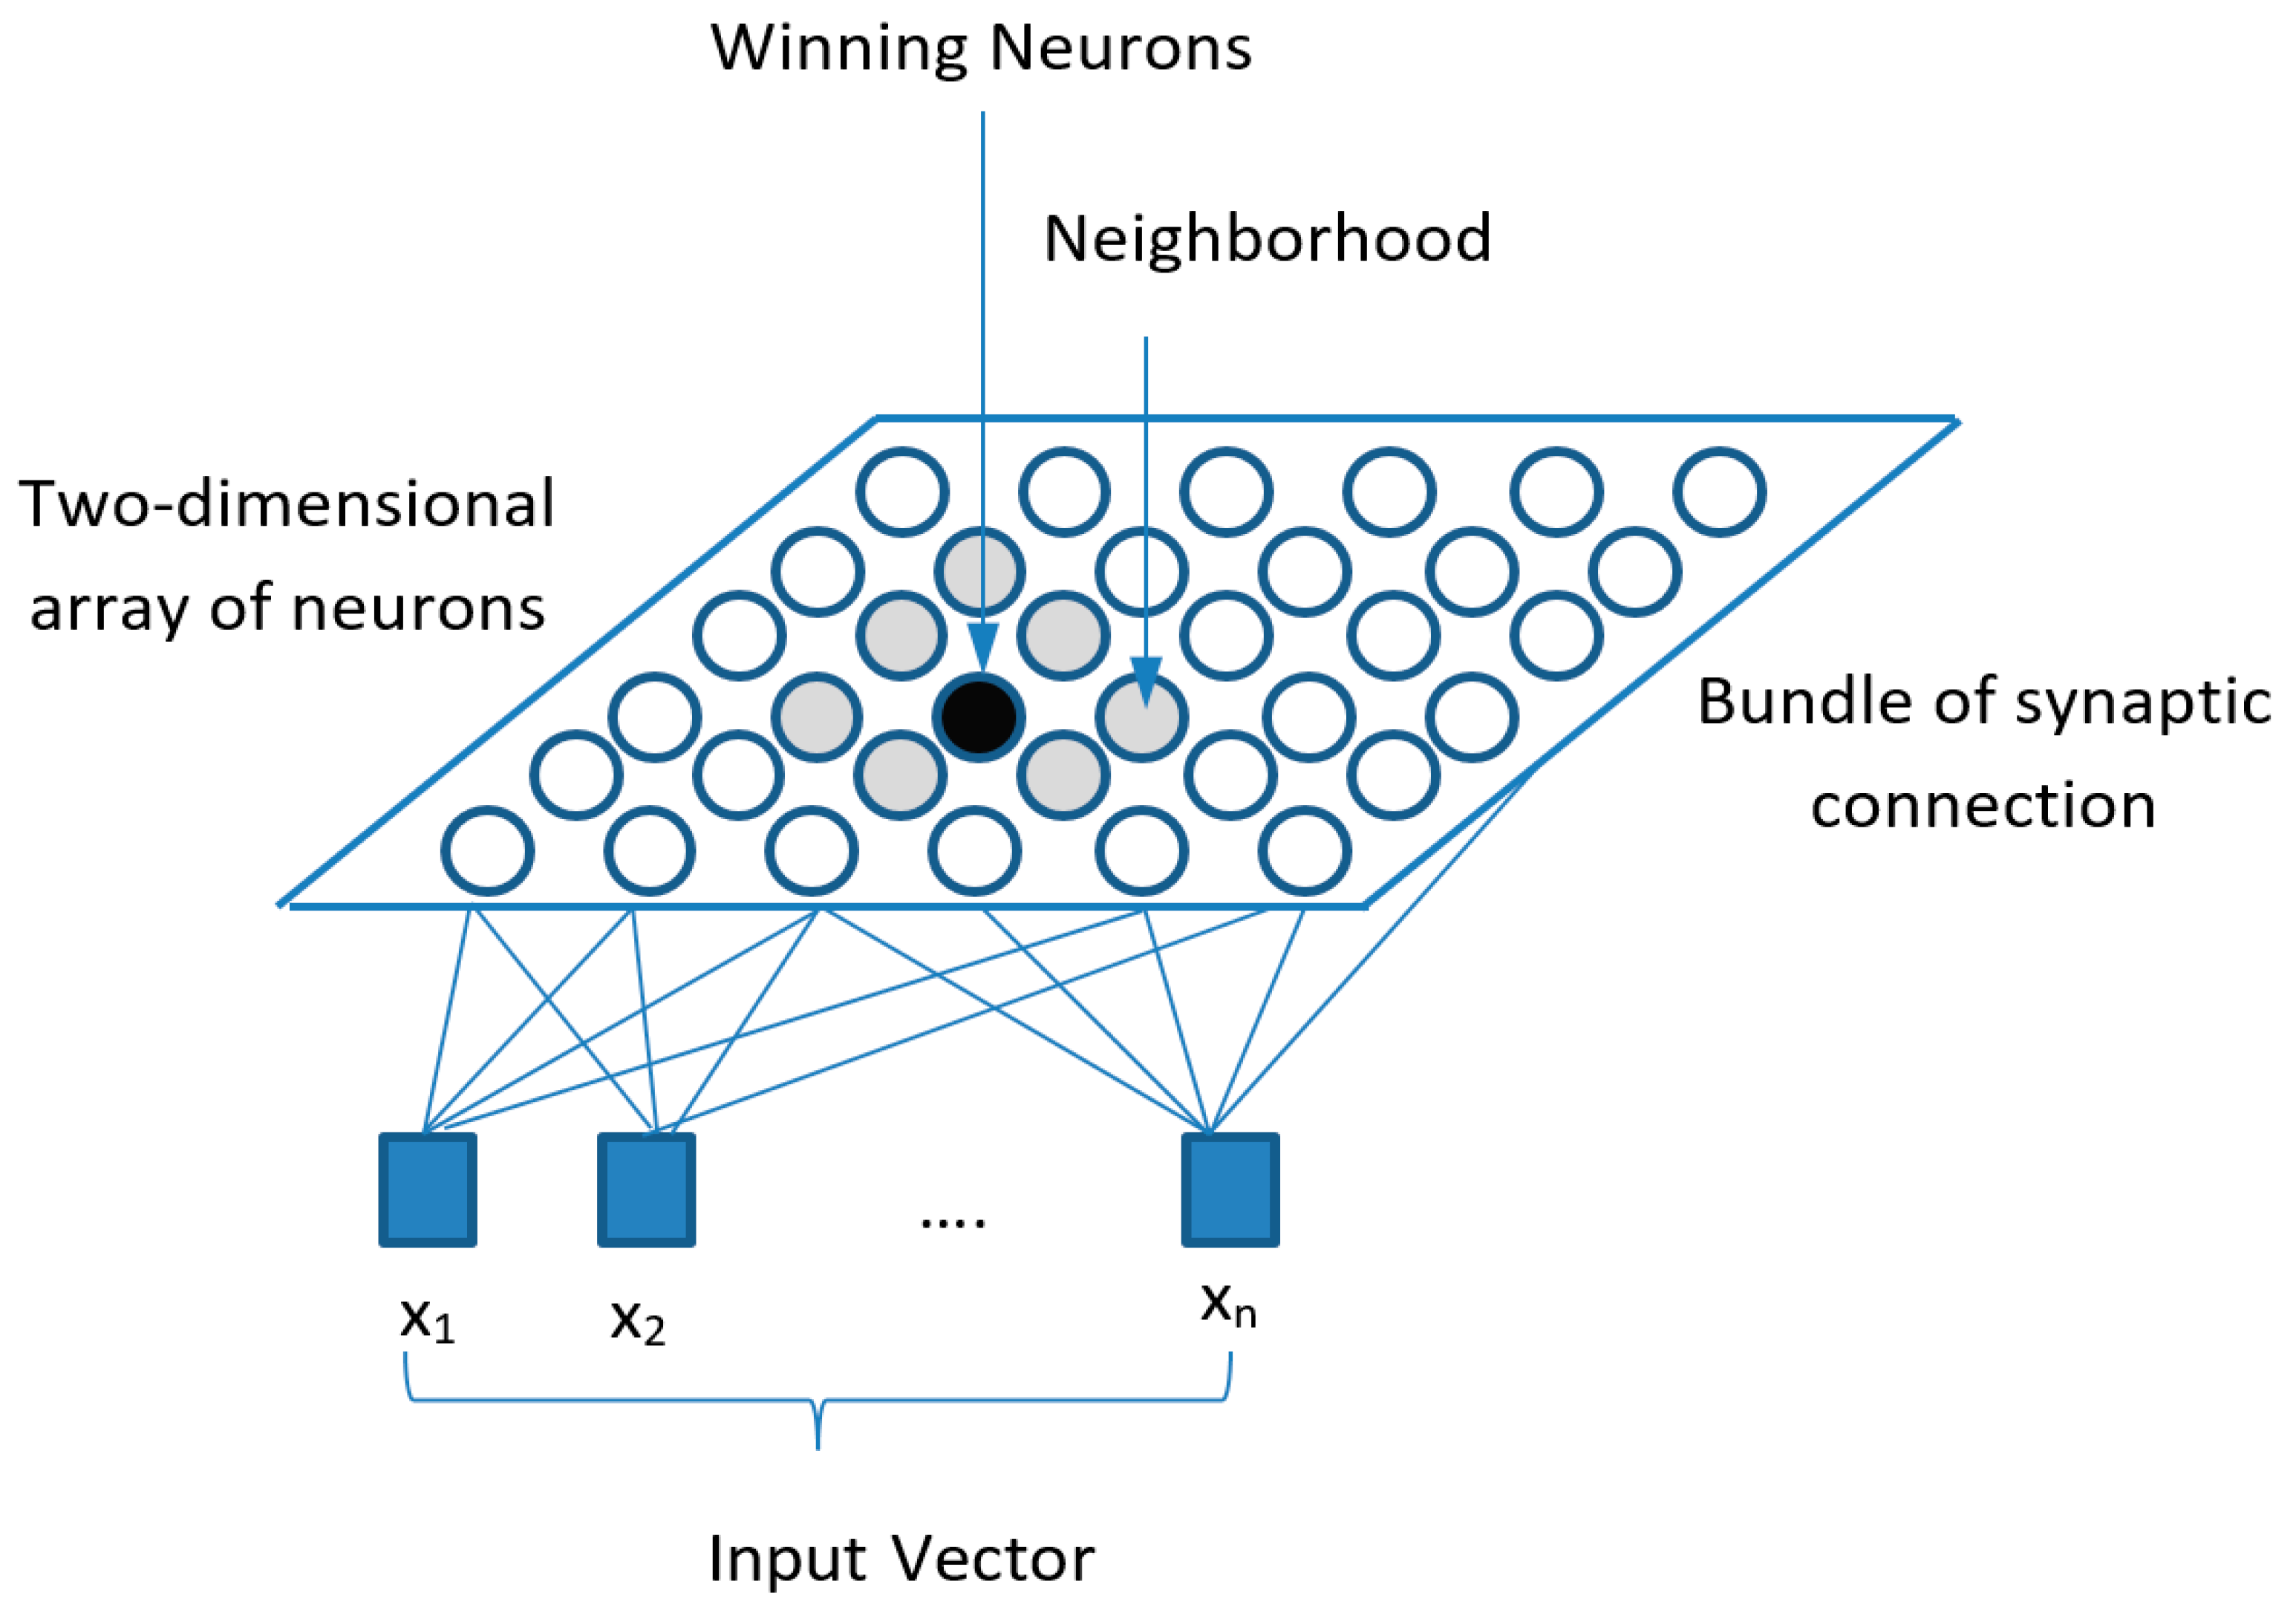
To implement the method, we used a personal laptop with an Intel(R) Core(TM) i7-6700HQ CPU @ 2.60GHz, 2592 MHz, four Core(s) and eight Logical Processor(s) with 8 GB of memory running the Windows 10 Pro 64-bit operating system. All experiments were performed using a 10-fold cross-validation. We used SOM for data clustering. η ( 0 ) = 0.01 was considered in the SOM. The SOM was performed to detect similar preferences in different groups. We used different map structure for SOM as: SOM 1 × 3 , SOM 2 × 2 , SOM 1 × 5 , SOM 1 × 3 , SOM 2 × 3 , SOM 1 × 7 , SOM 2 × 4 , SOM 3 × 3 , SOM 2 × 5 , SOM 1 × 11 , SOM 3 × 4 . Accordingly, a different number of clusters was generated by SOM, as shown in Table 6. In this study, we used the silhouette coefficient [81] to identify the optimal number of clusters. The results are presented in Table 6. We found that the optimal number of clusters was 5 (i.e., SOM 1 × 5 ).
The results of data clustering are presented in Table 7, Table 8, Table 9 and Table A1. In 
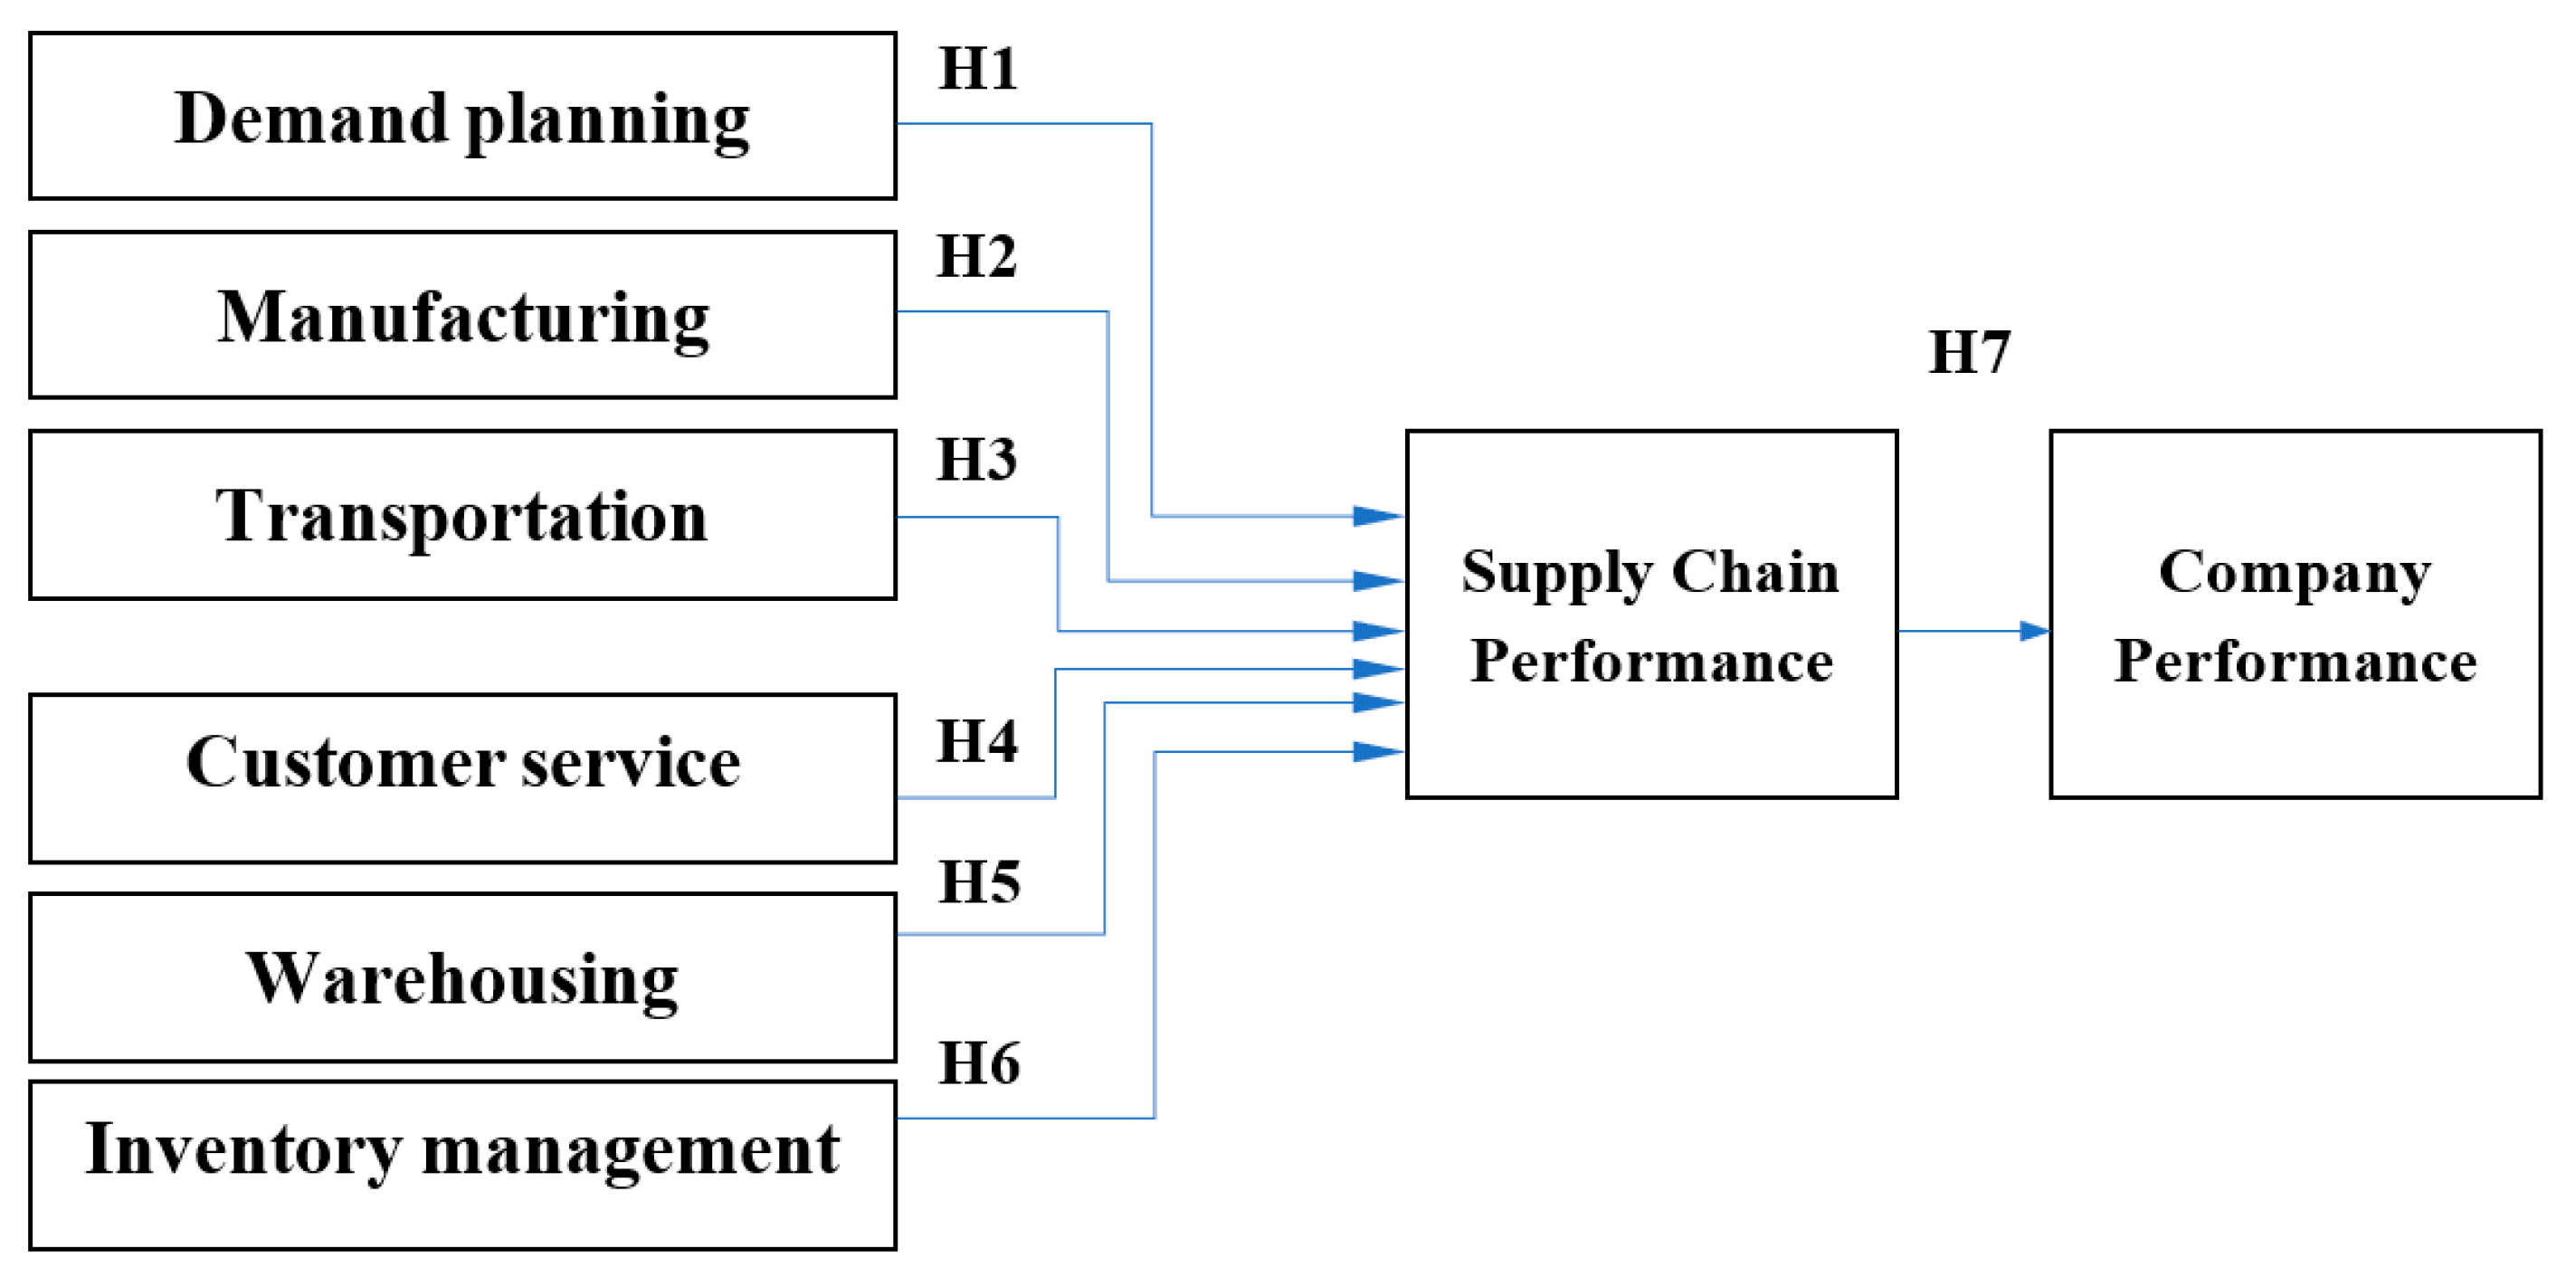
Table 7, we present the centroids of the discovered clusters. This table shows that there was a significant relationship between demand planning, manufacturing, transportation, customer service, warehousing and inventory management, and supply chain performance. In addition, the results show a direct relationship between supply chain performance and the performance of olive oil companies. Specifically, it can be observed that when the supply chain performance was at a low level, the company’s performance was also at a low level. Furthermore, with a high level of supply chain performance, a high level of company performance was obtained.
In 
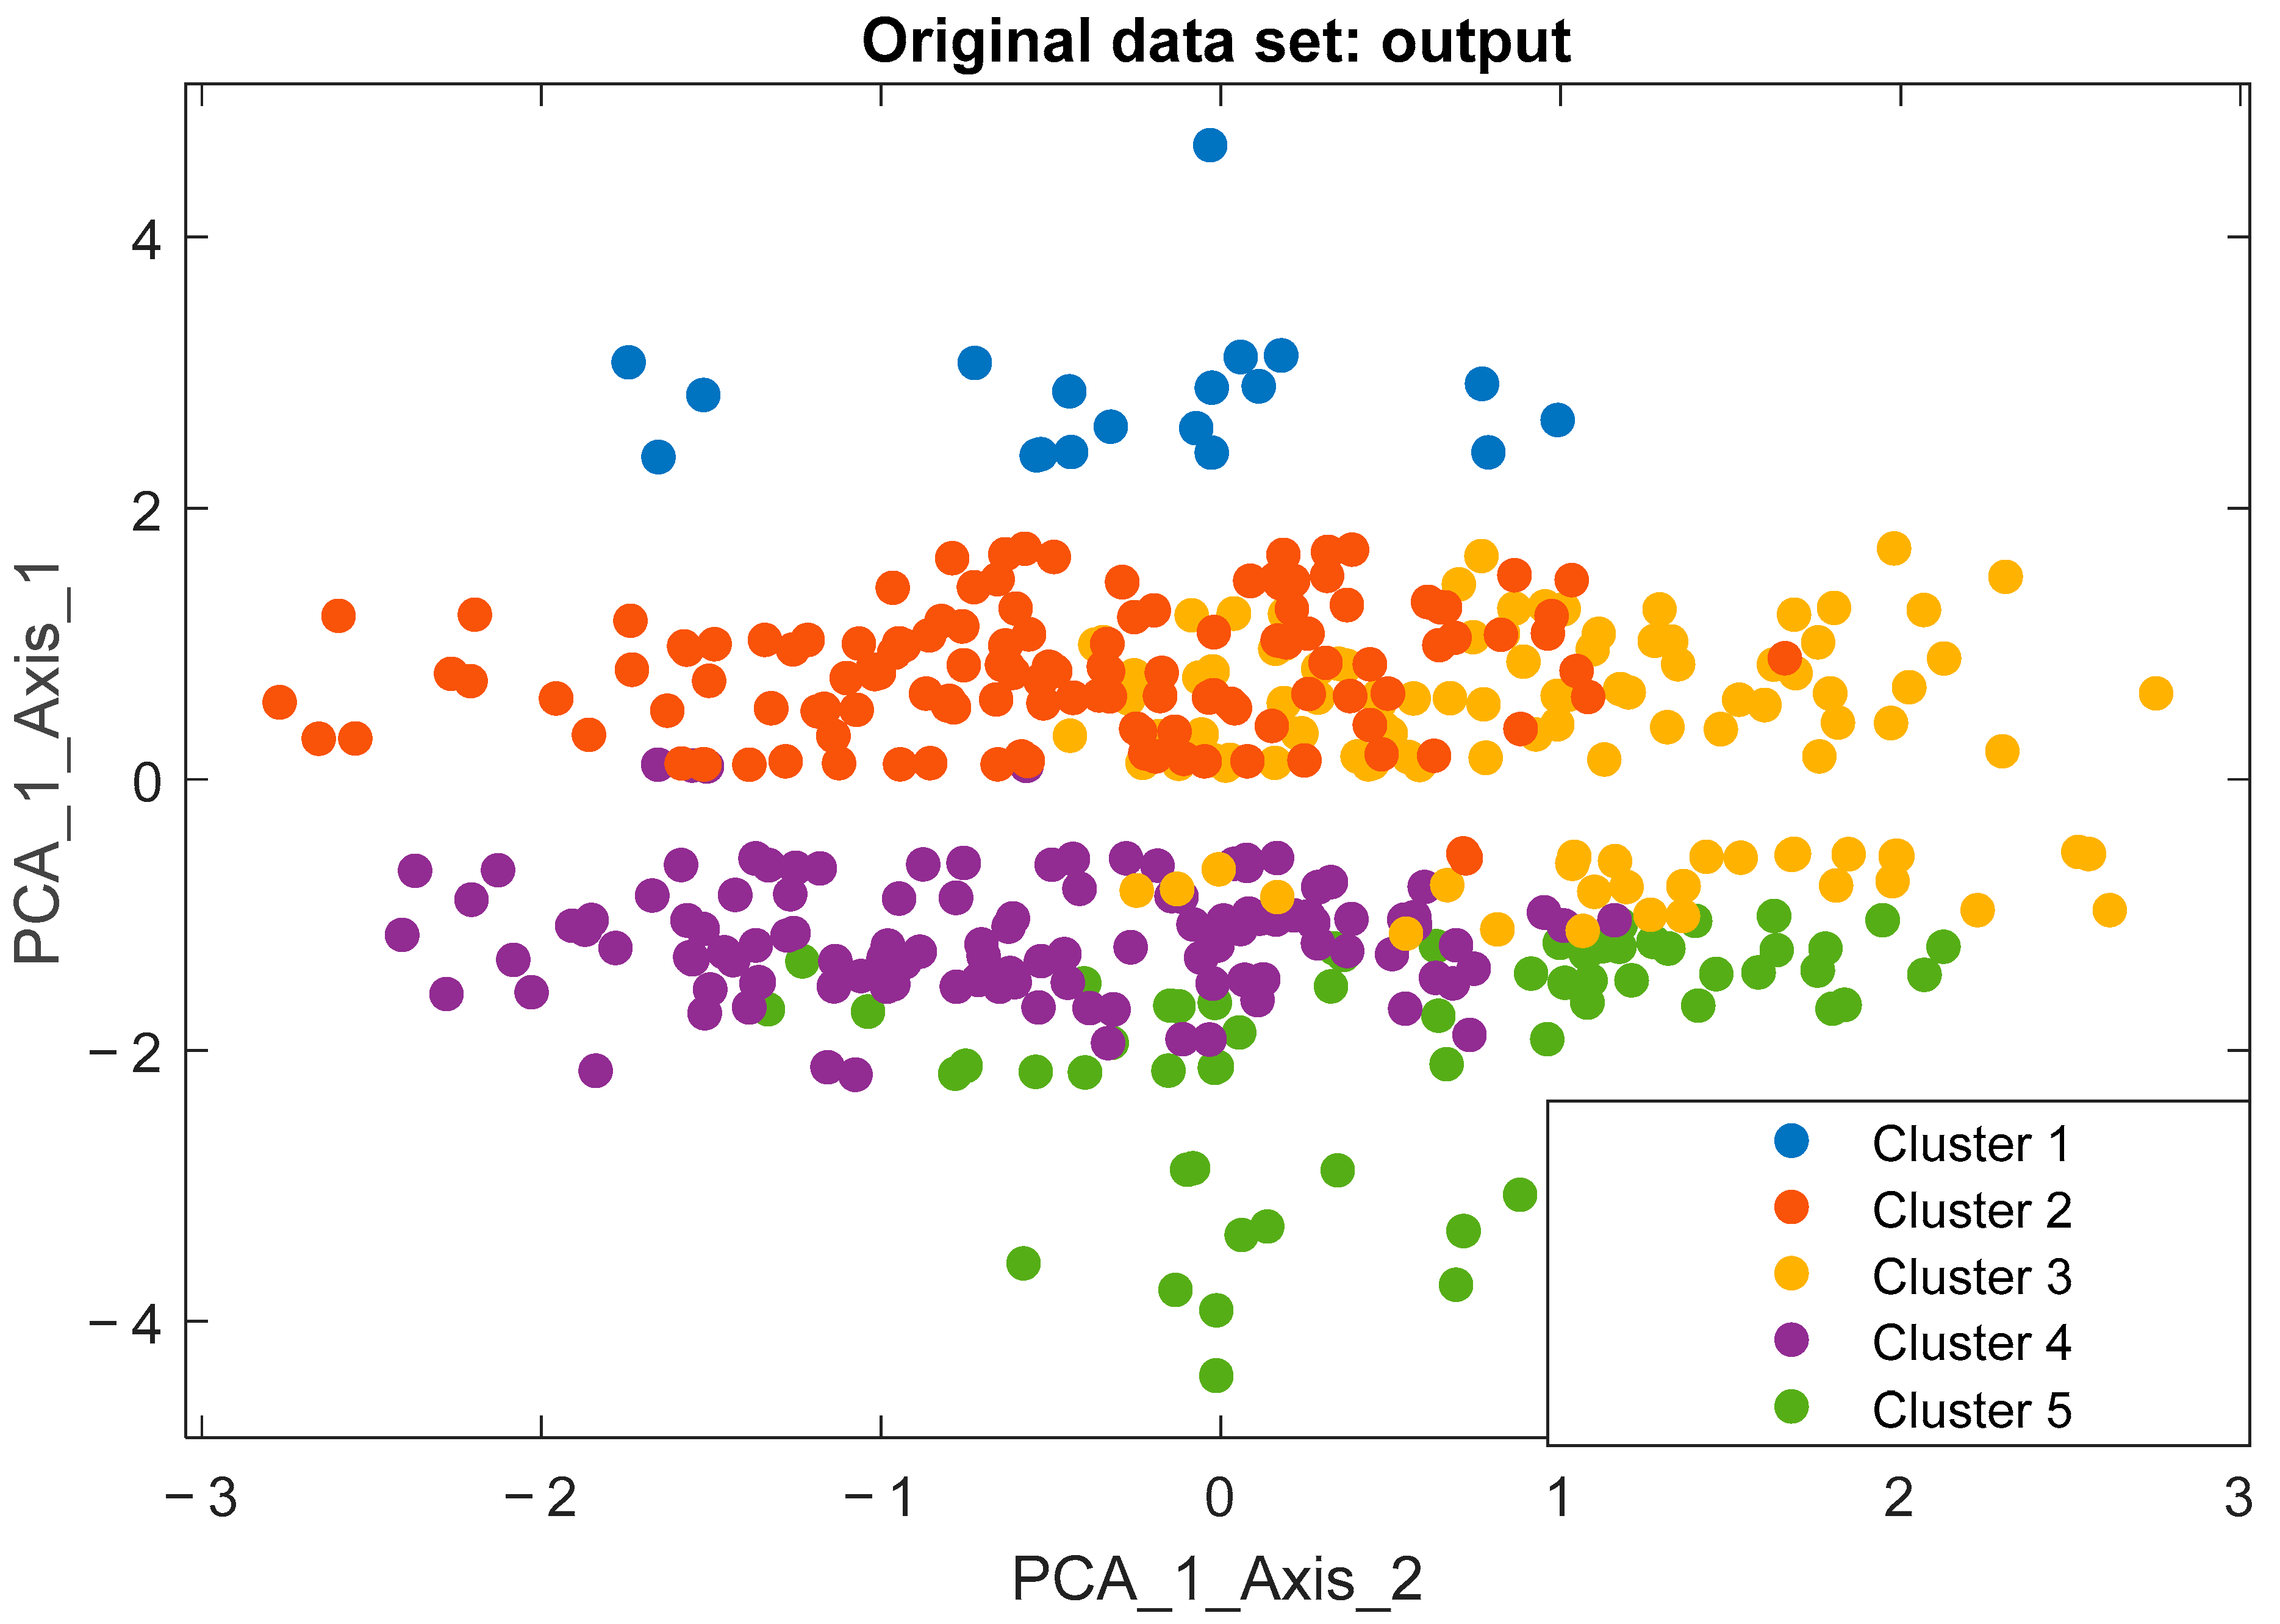
Table 8, the frequencies of the responses in each cluster are presented. Clusters 2 and 3 included the majority of respondents. In Table 9, we present the frequency of gender, education level, employment in the industry, experience with ICT in the industry, and familiarity with IoT devices observed in each cluster of the SOM. The results presented in Table 8 show that only some respondents were unfamiliar with the IoT in all clusters. Specifically, a relatively high number of respondents were familiar with IoT technologies. In Figure 3, we present a visualization of the SOM clusters generated through PCA.
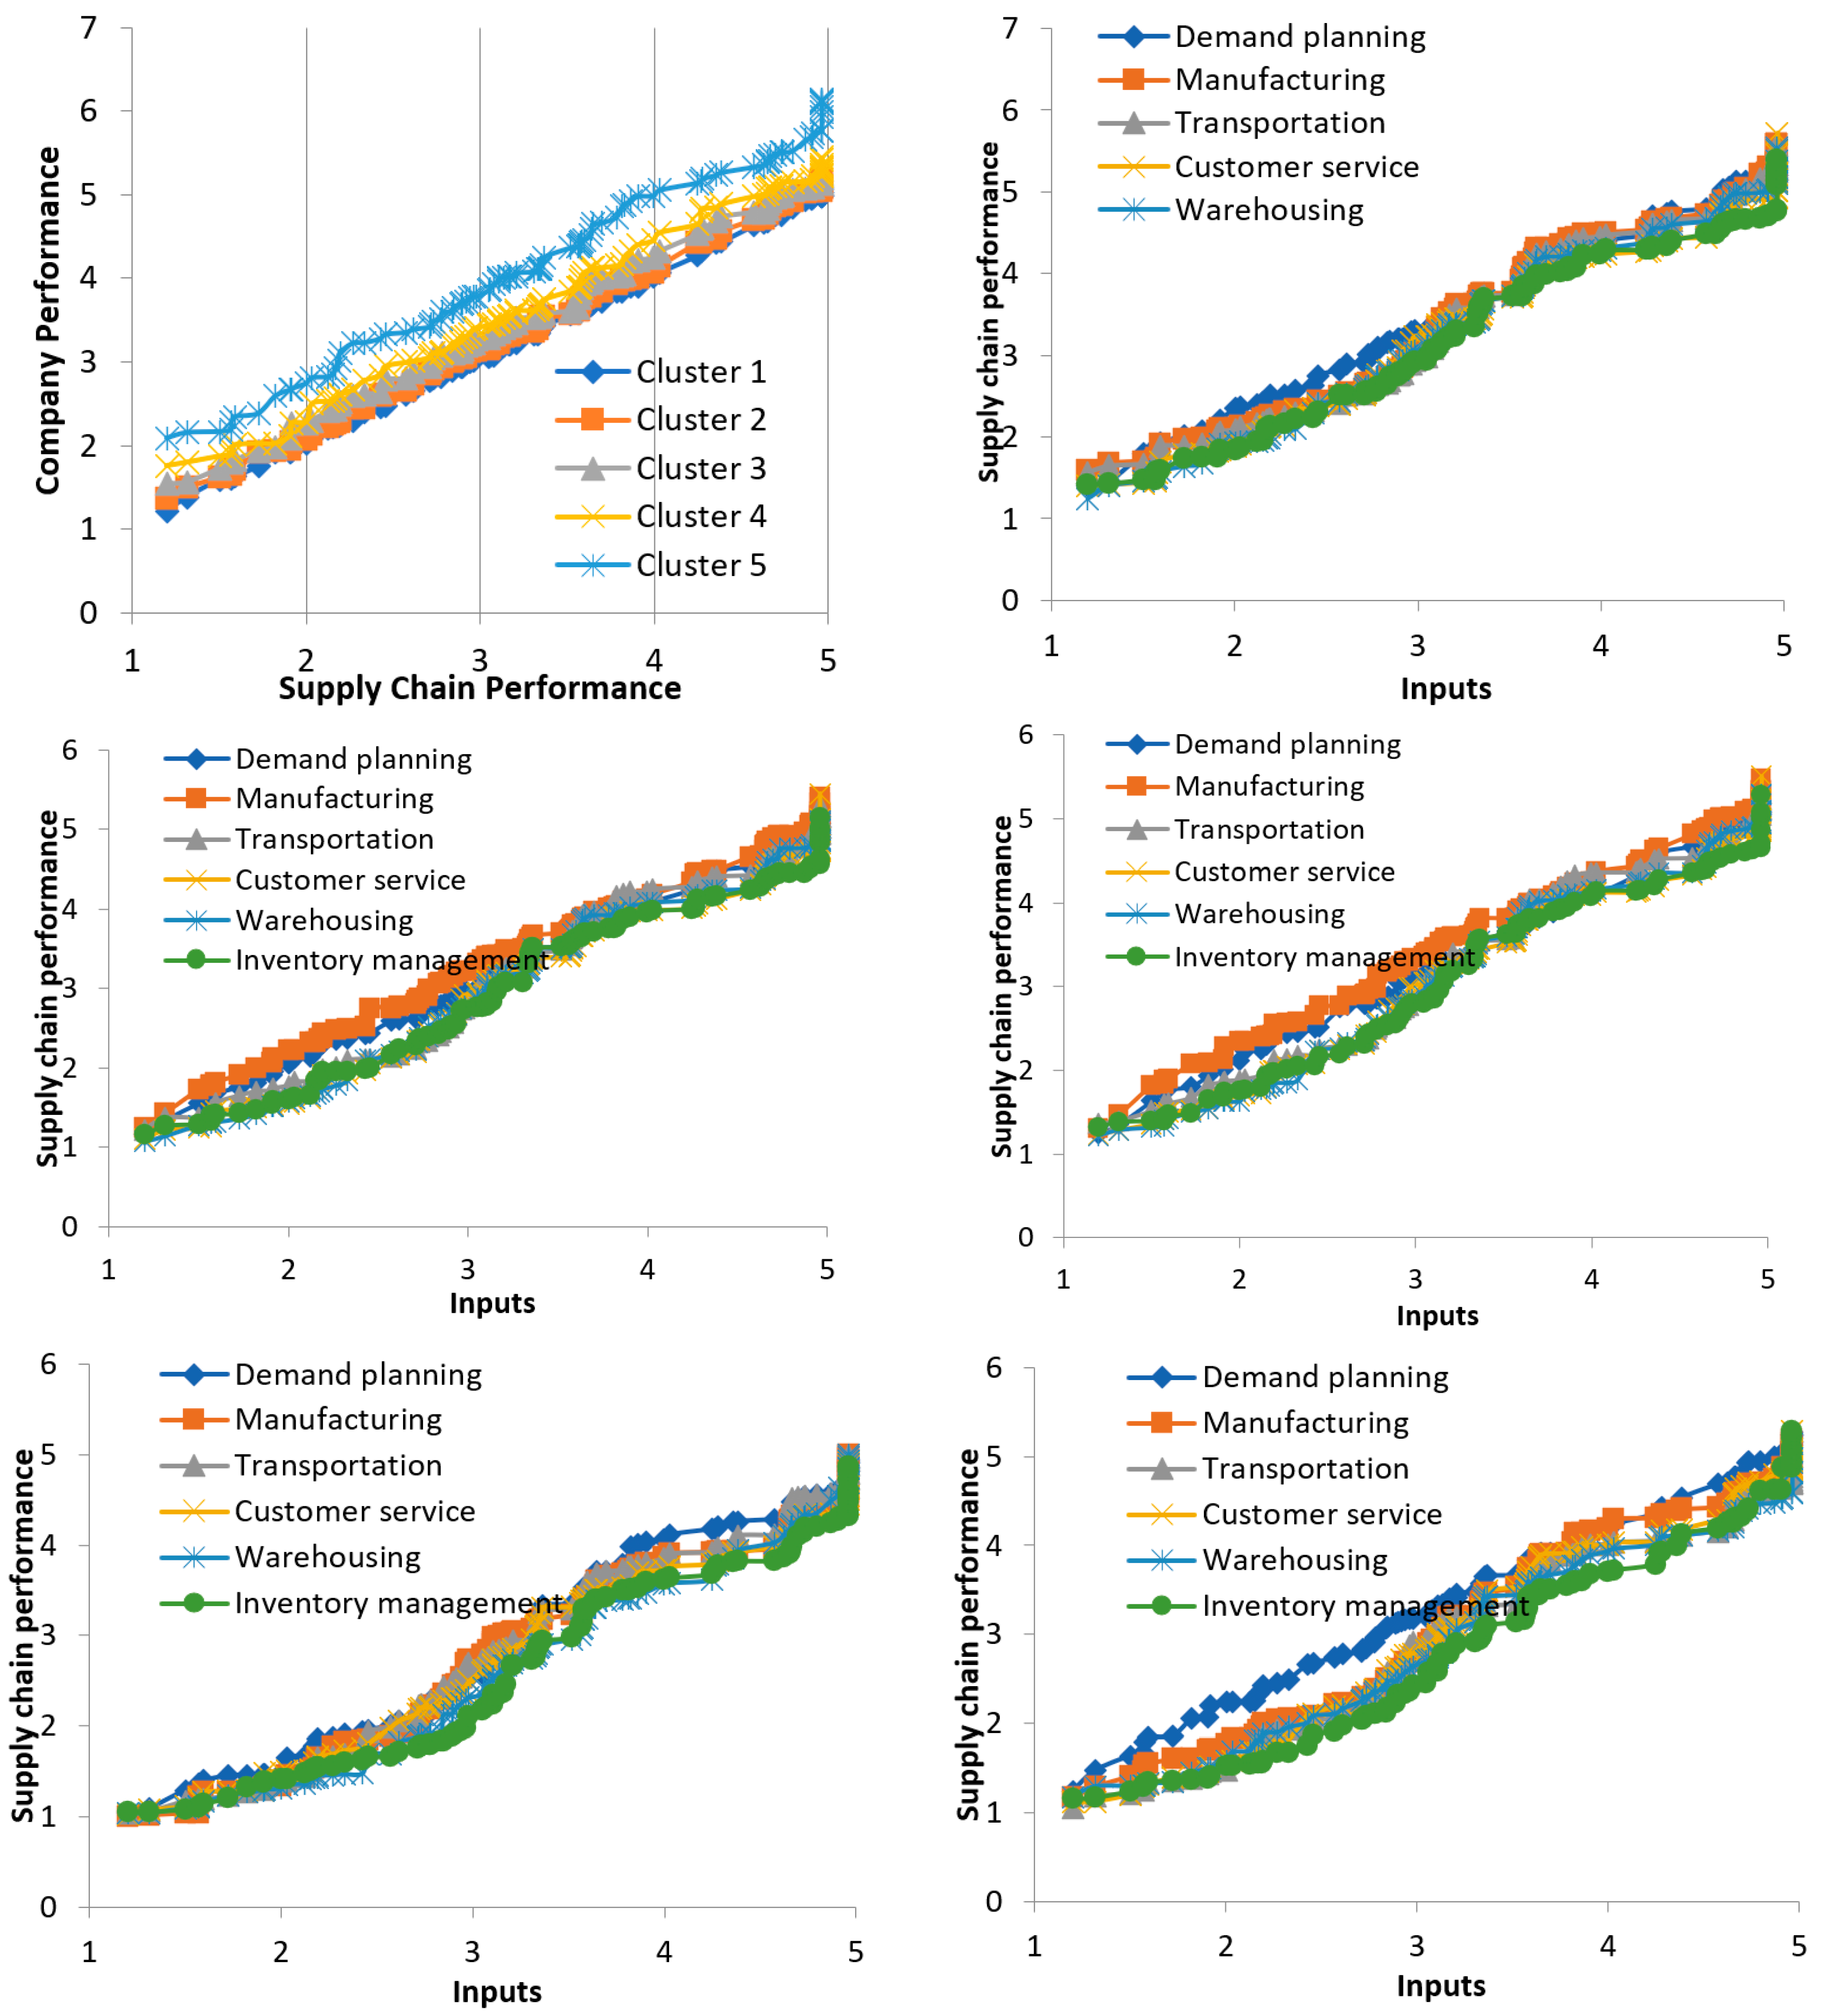
The data, in five clusters, were used in decision trees to construct the prediction models to find the relationships between the inputs and outputs. The decision trees were constructed through 10-fold cross-validation [82,83]. In the first stage, the models learned to find the relationships between demand planning, manufacturing, transportation, customer service, warehousing and inventory management, and supply chain performance. The relationship between supply chain performance and company performance was evaluated in the second stage. As we had five clusters of data, five models based on decision trees were constructed in each stage. Accordingly, ten models were constructed to evaluate their relationships. The results of this analysis are shown in Figure 4. The results demonstrated a direct relationship between the supply chain improvement caused by implementing IoT and company performance in the olive oil industry. In addition, the plots in Figure 4 show that when there was an increase in demand planning, manufacturing, transportation, customer service, warehousing, and inventory management, supply chain performance improved accordingly. Overall, this indicates that the IoT was important in improving supply chain performance through improvements in demand planning, manufacturing, transportation, customer service, warehousing, and inventory management in the olive oil industry.

Evaluation Metrics

In this study, we used three statistical performance metrics to determine the efficiency and accuracy of the prediction models using decision trees. These were the root mean square error (RMSE) [84], mean absolute error (MAE) [85] and the coefficient of determination (R2) [86].
R M S E = 1 n ( y i y ^ i ) 2
M A E = 1 n ( y i y ^ i )  
R 2 = 1 ( y i y ^ i )   ( y i y i ¯ )  
where y i indicates the actual outputs, y ^ i indicates the outputs predicted by decision trees, y i ¯ indicates the mean of the outputs, and n is the number of samples.
In Table 10, we provide the results of the evaluation and comparisons of methods. In these comparisons, the proposed method, SOM + decision trees, was compared with decision trees, an artificial neural network (ANN), and an adaptive neuro-fuzzy inference system (ANFIS). The ANN and ANFIS models were constructed for 200 epochs. In addition, in ANFIS, a hybrid learning approach and triangular membership functions were used. In decision trees, the tree growth was restricted with the stopping rules: maximum tree depth = 10, minimum size for split = 5, and maximum number of leaves = 100.
Furthermore, ANFIS was implemented with a hybrid learning approach. We found that the decision tree approach predicted the outputs accurately, with lower MSE and RMSE values compared with the other machine learning techniques. Specifically, the SOM + decision trees method outperformed other machine learning techniques in terms of RMSE, MAE, and the coefficient of determination.

7. Discussion

The tremendous increase in the population has increased the demand for additional food. Agricultural advancements are critical to the development of our sedentary human civilization. Consequently, the agri-food sector is still regarded as one of the most important sectors in the world today. Most agricultural businesses continue to rely on traditional farming practices despite their decreasing use. To meet this requirement, agricultural firms are changing their approaches to IoT applications to gain greater capabilities. Based on IoT technologies, smart farming enables farmers and growers to enhance productivity and reduce waste. This can be measured in various ways, from fertilizer use to the number of journeys made by farm vehicles. Smart farming also enables the efficient utilization of resources such as water, electricity, and other things. An IoT smart farming solution is a system built to monitor crop fields with the help of sensors (crop health, temperature, humidity, light, soil moisture, etc.) and an automated irrigation system. These sensors monitor light, humidity, temperature, and crop health. Farmers can monitor the fields’ conditions from any location. They can also choose between manual and automated processes to carry out the necessary actions in response to the data. Compared to traditional farming methods, precision agriculture is significantly more productive.
The IoT has played a critical role in increasing production and expanding agricultural product markets. Investigating the IoT’s impact on companies’ performance is a critical task. Because of the wide variety of sensors that are currently available, the possibilities for IoT applications in the olive oil industry are almost limitless. The IoT has played a critical role in increasing production and expanding agricultural product markets. In the olive oil industry, it is possible to improve the supply chain process from raw materials within a plant to product distribution to customers and businesses using IoT technologies. Previous studies have investigated the impact of the IoT on the performance of industries, but this issue has not been explored in the olive oil industry until now.
In this study, we proposed a model based on seven hypotheses. The results of the data analysis, conducted using the supervised learning technique, confirmed all of the hypotheses. A direct relationship between the input variables and the output variables was discovered. The results demonstrated a direct relationship between the supply chain improvement caused by the implementation of the IoT and company performance in the olive oil industry. Furthermore, increasing demand planning, manufacturing, transportation, customer service, warehousing, and inventory management improved supply chain performance. Thus, IoT implementation is critical for improving supply chain performance in the olive oil industry through improvements in demand planning, manufacturing, transportation, customer service, warehousing, and inventory management.
Moreover, in the olive oil industry, various processes can be employed by IoT technologies in the transformation of raw products into food products. The best results are obtained by taking into account both efficiency and the desired quality of the final food product. The production of high-quality extra virgin olive oil, for example, necessitates the optimization of various production steps such as olive handling and harvesting, milling, and the use of modern IoT technologies to control process conditions. To avoid process failures and maintain the highest possible quality in the final olive oil products, a high level of control by IoT technologies over standard operating conditions can be significant. In addition, the duration of malaxation and temperature can have an impact on olive oil quality [87]. Thus, IoT-based technologies can be used to enhance extra virgin olive oil production without having an adverse effect on the quality indicators.

8. Conclusions

In this study, we examined the enhancement of the olive oil industry. We developed a new method to investigate the IoT’s role in improving olive oil companies’ performance. The method was developed using clustering and decision trees. The data for this study were collected from respondents with knowledge regarding the integration of new technologies into the industry. The data were clustered, and decision trees were implemented to predict the olive oil companies’ performance according to the factors influencing the supply chain. The model was implemented in two stages. In the first stage, the models learned how to find the relationships between demand planning, manufacturing, transportation, customer service, warehousing and inventory management, and supply chain performance. The relationship between supply chain performance and company performance was evaluated in the second stage. The method was evaluated in these two stages and compared using decision trees, an ANN, and an ANFIS. The methods were compared using RMSE, MAE, and the coefficient of determination. The results showed that the SOM + decision trees method outperformed the other machine learning techniques in terms of the RMSE, MAE, and coefficient of determination.

Limitation and Future Work

This study has some limitations. First, the method was developed using SOM clustering and decision trees without an optimization technique. The SOM method can be developed with optimization techniques such as particle swarm optimization (PSO) [88] to discover the clusters in the data more effectively. In addition, ensemble-learning approaches can improve the efficiency of decision trees [89]. Second, in this study, we investigated the relationships between supply chains and olive oil companies’ performance. The model could be further improved by including other factors, such as competitive advantages and financial aspects of performance. Furthermore, the results could be further developed to account for the barriers to implementing IoT in olive oil companies, specifically, the barriers in the context of privacy and security related to the implementation of the IoT by olive oil companies.

Author Contributions

Conceptualization, A.A. and H.A.; Formal analysis, A.A. and H.A.; Funding acquisition, A.A.; Investigation, A.A.; Methodology, A.A.; Project administration, A.A.; Software development, A.A. and H.A.; Visualization, A.A. and H.A.; Writing—original draft A.A.; Writing—review & editing H.A. All authors have read and agreed to the published version of the manuscript.

Funding

The authors extend their appreciation to the Deanship of Scientific Research at Jouf University for funding this work through research grant no (DSR-2021-02-0101).

Institutional Review Board Statement

Not Applicable.

Informed Consent Statement

Not Applicable.

Data Availability Statement

The datasets generated and/or analyzed during the current study are available from the corresponding author on reasonable request.

Conflicts of Interest

The authors declare no conflict of interest.

Appendix A

Table A1. The frequency of responses for each factor in the clusters.
Clusters
Cluster n1Cluster n2Cluster n3Cluster n4Cluster n5
CountCountCountCountCount
Demand planning100481957
200443836
312826208
425530203
542630201
Manufacturing112725939
2023113327
3339332017
4243435510
5402137012
Transportation111793147
2219172934
3246352010
4253826229
5382431155
Customer service1022173549
2226252436
3242271614
4222125232
5423324194
Warehousing102084148
2325123334
3151292514
4262730156
538213933
Inventory management1018211157
2226282938
334429267
4222823233
5412817280
Supply chain performance1000037
2033011368
301418840
4350000
5330000
Company performance1000022
20035556
3062796227
421823600
5470000

References

  1. Li, J.; Dou, K.; Wen, S.; Li, Q. Monitoring Index System for Sectors’ Digital Transformation and Its Application in China. Electronics 2021, 10, 1301. [Google Scholar] [CrossRef]
  2. Van Meeteren, M.; Trincado-Munoz, F.; Rubin, T.H.; Vorley, T. Rethinking the Digital Transformation in Knowledge-Intensive Services: A Technology Space Analysis. Technol. Forecast. Soc. Chang. 2022, 179, 121631. [Google Scholar] [CrossRef]
  3. Lasi, H.; Fettke, P.; Feld, T.; Hoffmann, M. Industry 4.0. Bus. Inf. Syst. Eng. 2014, 6, 239–242. Available online: https://aisel.aisnet.org/bise/vol6/iss4/5 (accessed on 10 September 2022). [CrossRef]
  4. Hofmann, E.; Rüsch, M. Industry 4.0 and the Current Status as well as Future Prospects on Logistics. Comput. Ind. 2017, 89, 23–34. [Google Scholar] [CrossRef]
  5. Knell, M. The Digital Revolution and Digitalized Network Society. Rev. Evol. Polit. Econ. 2021, 2, 9–25. [Google Scholar] [CrossRef]
  6. Pencarelli, T. The Digital Revolution in the Travel and Tourism Industry. Inf. Technol. Tour. 2020, 22, 455–476. [Google Scholar] [CrossRef]
  7. Caputo, F.; Cillo, V.; Candelo, E.; Liu, Y. Innovating Through Digital Revolution: The Role of Soft Skills and Big Data in Increasing Firm Performance. Manag. Decis. 2019, 57, 2032–2051. [Google Scholar] [CrossRef]
  8. Munirathinam, S. Chapter Six—Industry 4.0: Industrial Internet of Things (IIOT). In Advances in Computers, 1st ed.; Pethuru, R., Preetha, E., Eds.; Elsevier: Amsterdam, The Netherlands, 2020; Volume 117, pp. 129–164. [Google Scholar] [CrossRef]
  9. Rejeb, A.; Keogh, J.G.; Treiblmaier, H. Leveraging the Internet of Things and Blockchain Technology in Supply Chain Management. Future Internet 2019, 11, 161. [Google Scholar] [CrossRef] [Green Version]
  10. Nagarajan, S.M.; Deverajan, G.G.; Chatterjee, P.; Alnumay, W.; Muthukumaran, V. Integration of IoT Based Routing Process for Food Supply Chain Management in Sustainable Smart Cities. Sustain. Cities Soc. 2022, 76, 103448. [Google Scholar] [CrossRef]
  11. Li, S.; Xu, L.D.; Zhao, S. The Internet of Things: A Survey. Inf. SysT. Front. 2015, 17, 243–259. [Google Scholar] [CrossRef]
  12. Pang, Z.; Chen, Q.; Han, W.; Zheng, L. Value-Centric Design of the Internet-of-Things Solution for Food Supply Chain: Value Creation Sensor Portfolio and Information Fusion. Inf. SysT. Front. 2015, 17, 289–319. [Google Scholar] [CrossRef]
  13. Surana, A.; Kumara, S.; Greaves, M.; Raghavan, U.N. Supply-Chain Networks: A Complex Adaptive Systems Perspective. Int. J. Prod. Res. 2005, 43, 4235–4265. [Google Scholar] [CrossRef]
  14. Zhong, R.; Xu, X.; Wang, L. Food Supply Chain Management: Systems, Implementations, and Future Research. Ind. Manag. Data Syst. 2017, 117, 2085–2114. [Google Scholar] [CrossRef]
  15. Dutta, P.K.; Mitra, S. Application of Agricultural Drones and IoT to Understand Food Supply Chain During Post Covid-19. In Agricultural Informatics; Choudhury, A., Biswas, A., Prateek, M., Chakrabarti, A., Eds.; Wiley Online Books: Hoboken, NJ, USA, 2021; pp. 67–87. [Google Scholar] [CrossRef]
  16. Sharma, R.; Kamble, S.S.; Gunasekaran, A.; Kumar, V.; Kumar, A. A Systematic Literature Review on Machine Learning Applications for Sustainable Agriculture Supply Chain Performance. Comput. Oper. Res. 2020, 119, 104926. [Google Scholar] [CrossRef]
  17. Manavalan, E.; Jayakrishna, K. A Review of Internet of Things (IoT) Embedded Sustainable Supply Chain for Industry 4.0 Requirements. Comput. Ind. Eng. 2019, 127, 925–953. [Google Scholar] [CrossRef]
  18. Tan, W.C.; Sidhu, M.S. Review of RFID and IoT Integration in Supply Chain Management. Oper. Res. Perspect. 2022, 9, 100229. [Google Scholar] [CrossRef]
  19. Li, Y.; Dai, J.; Cui, L. The Impact of Digital Technologies on Economic and Environmental Performance in the Context of Industry 4.0: A Moderated Mediation Model. Int. J. Prod. Econ. 2020, 229, 107777. [Google Scholar] [CrossRef]
  20. Al Sadawi, A.; Hassan, M.S.; Ndiaye, M. A Survey on the Integration of Blockchain with IoT to Enhance Performance and Eliminate Challenges. IEEE Access 2021, 9, 54478–54497. [Google Scholar] [CrossRef]
  21. Terrada, L.; Alloubane, A.; Bakkoury, J.; El Khaili, M. IoT Contribution in Supply Chain Management for Enhancing Performance Indicators. In Proceedings of the 2018 International Conference on Electronics, Control, Optimization and Computer Science (ICECOCS), Kenitra, Moroco, 5–6 December 2018. [Google Scholar] [CrossRef]
  22. Shi, X.; An, X.; Zhao, Q.; Liu, H.; Xia, L.; Sun, X.; Guo, Y. State-of-the-Art Internet of Things in Protected Agriculture. Sensors 2019, 19, 1833. [Google Scholar] [CrossRef] [Green Version]
  23. Stočes, M.; Vaněk, J.; Masner, J.; Pavlík, J. Internet of Things (IoT) in Agriculture-Selected Aspects. Agris-Line Pap. Econ. Inform. 2016, 8, 83–88. [Google Scholar] [CrossRef] [Green Version]
  24. Ferrández-Pastor, F.J.; García-Chamizo, J.M.; Nieto-Hidalgo, M.; Mora-Pascual, J.; Mora-Martínez, J. Developing Ubiquitous Sensor Network Platform Using Internet of Things: Application in Precision Agriculture. Sensors 2016, 16, 1141. [Google Scholar] [CrossRef] [PubMed] [Green Version]
  25. Weiss, M.; Jacob, F.; Duveiller, G. Remote Sensing for Agricultural Applications: A Meta-Review. Remote Sens. Environ. 2020, 236, 111402. [Google Scholar] [CrossRef]
  26. Visconti, P.; de Fazio, R.; Velázquez, R.; Del-Valle-Soto, C.; Giannoccaro, N.I. Development of Sensors-Based Agri-Food Traceability System Remotely Managed by a Software Platform for Optimized Farm Management. Sensors 2020, 20, 3632. [Google Scholar] [CrossRef] [PubMed]
  27. Haseeb, K.; Ud Din, I.; Almogren, A.; Islam, N. An Energy Efficient and Secure IoT-Based WSN Framework: An Application to Smart Agriculture. Sensors 2020, 20, 2081. [Google Scholar] [CrossRef] [PubMed]
  28. Boursianis, A.D.; Papadopoulou, M.S.; Diamantoulakis, P.; Liopa-Tsakalidi, A.; Barouchas, P.; Salahas, G.; Karagiannidis, G.; Wan, S.; Goudos, S.K. Internet of things (IoT) and Agricultural Unmanned Aerial Vehicles (UAVs) in Smart Farming: A Comprehensive Review. Internet Things 2020, 18, 100187. [Google Scholar] [CrossRef]
  29. Ronaghi, M.H.; Forouharfar, A. A Contextualized Study of the Usage of the Internet of things (IoTs) in Smart Farming in a Typical Middle Eastern Country Within the Context of Unified Theory of Acceptance and Use of Technology model (UTAUT). Technol. Soc. 2020, 63, 101415. [Google Scholar] [CrossRef]
  30. Sinha, B.B.; Dhanalakshmi, R. Recent Advancements and Challenges of Internet of Things in Smart Agriculture: A survey. Future Gener. Comput. Syst. 2022, 126, 169–184. [Google Scholar] [CrossRef]
  31. Ray, P.P. Internet of Things for Smart Agriculture: Technologies, Practices and Future Direction. J. Ambient Intell. Smart Environ. 2017, 9, 395–420. [Google Scholar] [CrossRef]
  32. Alfian, G.; Rhee, J.; Ahn, H.; Lee, J.; Farooq, U.; Ijaz, M.F.; Syaekhoni, M.A. Integration of RFID, Wireless Sensor Networks, and Data Mining in an E-pedigree Food Traceability System. J. Food Eng. 2017, 212, 65–75. [Google Scholar] [CrossRef]
  33. Astill, J.; Dara, R.A.; Campbell, M.; Farber, J.M.; Fraser, E.D.; Sharif, S.; Yada, R.Y. Transparency in Food Supply Chains: A Review of Enabling Technology Solutions. Trends Food Sci. Technol. 2019, 91, 240–247. [Google Scholar] [CrossRef]
  34. Arena, A.; Bianchini, A.; Perazzo, P.; Vallati, C.; Dini, G. BRUSCHETTA: An IoT Blockchain-Based Framework for Certifying Extra Virgin Olive Oil Supply Chain. In Proceedings of the 2019 IEEE International Conference on Smart Computing (SMARTCOMP), Washington, DC, USA, 12–15 June 2019. [Google Scholar] [CrossRef]
  35. Violino, S.; Ortenzi, L.; Antonucci, F.; Pallottino, F.; Benincasa, C.; Figorilli, S.; Costa, C. An Artificial Intelligence Approach for Italian EVOO Origin Traceability Through an Open Source IoT Spectrometer. Foods 2020, 9, 834. [Google Scholar] [CrossRef] [PubMed]
  36. Alkhudary, R.; Brusset, X.; Naseraldin, H.; Féniès, P. Enhancing the Competitive Advantage via Blockchain: An Olive Oil Case Study. IFAC-Pap. 2022, 55, 469–474. [Google Scholar] [CrossRef]
  37. Ktari, J.; Frikha, T.; Chaabane, F.; Hamdi, M.; Hamam, H. Agricultural Lightweight Embedded Blockchain System: A Case Study in Olive Oil. Electronics 2022, 11, 3394. [Google Scholar] [CrossRef]
  38. Fernandes, M.A.; Cruz, E.F.; Da Cruz, A.R. Smart Contract and Web DApp for Traceability in the Olive Oil Production Chain. In Proceedings of the 2022 17th Iberian Conference on Information Systems and Technologies (CISTI), Madrid, Spain, 22–25 June 2022. [Google Scholar] [CrossRef]
  39. Yerpude, S.; Singhal, T.K. Impact of Internet of Things (IoT) Data on Demand Forecasting. Indian J. Sci. Technol. 2017, 10, 1–5. [Google Scholar] [CrossRef]
  40. Anita, R.; Abhinav, B. Internet of Things (IoT)–Its Impact on Manufacturing Process. Int. J. Eng. Technol. Sci. Res. 2017, 4, 889–895. [Google Scholar]
  41. Qin, W.; Zhong, R.Y.; Dai, H.; Zhuang, Z. An Assessment Model for RFID Impacts on Prevention and Visibility of Inventory Inaccuracy Presence. Adv. Eng. Inform. 2017, 34, 70–79. [Google Scholar] [CrossRef]
  42. Schoen, Q.; Lauras, M.; Truptil, S.; Fontanili, F.; Anquetil, A.G. Towards a Hyperconnected Transportation Management System: Application to Blood Logistics. In Collaboration in a Hyperconnected World; Afsarmanesh, H., Camarinha-Matos, L., Lucas Soares, A., Eds.; Springer: Cham, Germany, 2016; Volume 480, pp. 3–12. [Google Scholar] [CrossRef] [Green Version]
  43. Sahai, S.; Goel, R.; Bajaj, P.; Singh, G. IoT and Its Role in Performance Enhancement in Business Organizations. In Integration of Cloud Computing with Internet of Things: Foundations, Analytics, and Applications; Mangla, M., Satpathy, S., Nayak, B., Mohanty, S.N., Eds.; Wiley Online Books: Hoboken, NJ, USA, 2021; pp. 183–196. [Google Scholar] [CrossRef]
  44. Quante, R.; Meyr, H.; Fleischmann, M. Revenue Management and Demand Fulfilment: Matching Applications, Models and Software. In Supply Chain Planning; Meyr, H., Günther, H.O., Eds.; Springer: Berlin/Heidelberg, Germany, 2009; pp. 57–88. [Google Scholar] [CrossRef] [Green Version]
  45. Wagner, M. Demand Planning. In Supply Chain Management and Advanced Planning; Stadtler, H., Kilger, C., Eds.; Springer: Berlin/Heidelberg, Germany, 2002; pp. 123–141. [Google Scholar] [CrossRef]
  46. Ashayeri, J.; Lemmes, L. Economic Value Added of Supply Chain Demand Planning: A System Dynamics Simulation. Robot. Comput.-Integr. Manuf. 2006, 22, 550–556. [Google Scholar] [CrossRef]
  47. Uzsoy, R.; Fowler, J.W.; Mönch, L. A Survey of Semiconductor Supply Chain Models Part II: Demand Planning, Inventory Management, and Capacity Planning. Int. J. Prod. Res. 2018, 56, 4546–4564. [Google Scholar] [CrossRef]
  48. Efendi, A.; Nugraha, A.; Baharta, R. Manufacturing of Electrical Dryer Machine for Food and Fruit Products. IOP Conf. Ser. Mater. Sci. Eng. 2019, 692, 012006. [Google Scholar] [CrossRef]
  49. Sadiku, M.N.; Ashaolu, T.J.; Ajayi-Majebi, A.; Musa, S.M. Emerging Technologies in Manufacturing. Int. J. Sci. Adv. 2020, 1, 105–108. [Google Scholar] [CrossRef]
  50. Tao, F.; Cheng, J.; Qi, Q.; Zhang, M.; Zhang, H.; Sui, F. Digital Twin-Driven Product Design, Manufacturing and Service with Big Data. Int. J. Adv. Manuf. Technol. 2018, 94, 3563–3576. [Google Scholar] [CrossRef]
  51. Akamatsu, K. A Historical Pattern of Economic Growth in Developing Countries. Dev. Econ. 1962, 1, 3–25. [Google Scholar] [CrossRef]
  52. Rahani, A.; Al-Ashraf, M. Production Flow Analysis Through Value Stream Mapping: A Lean Manufacturing Process Case Study. Procedia Eng. 2012, 41, 1727–1734. [Google Scholar] [CrossRef] [Green Version]
  53. Teng, S.H.G.; Ho, S.Y.M. Failure Mode and Effects Analysis: An Integrated Approach for Product Design and Process Control. Int. J. Qual. Reliab. Manag. 1996, 13, 8–26. [Google Scholar] [CrossRef]
  54. Safa, M.; Shahi, A.; Haas, C.T.; Hipel, K.W. Supplier Selection Process in an Integrated Construction Materials Management Model. Autom. Constr. 2014, 48, 64–73. [Google Scholar] [CrossRef]
  55. Hitzler, L.; Merkel, M.; Hall, W.; Öchsner, A. A Review of Metal Fabricated with Laser- and Powder-Bed Based Additive Manufacturing Techniques: Process, Nomenclature, Materials, Achievable Properties, and its Utilization in the Medical Sector. Adv. Eng. Mater. 2018, 20, 1700658. [Google Scholar] [CrossRef] [Green Version]
  56. Zhao, C.; Wang, K.; Dong, X.; Dong, K. Is Smart Transportation Associated with Reduced Carbon Emissions? The Case of China. Energy Econ. 2022, 105, 105715. [Google Scholar] [CrossRef]
  57. Iqbal, S.; Khan, U.A.; Wahid, A. Transportation Systems. In Intelligent Cyber-Physical Systems for Autonomous Transportation; Garg, S., Aujla, G.S., Kaur, K., Hassan Ahmed Shah, S., Eds.; Springer: Cham, Switzerland, 2022; pp. 3–19. [Google Scholar] [CrossRef]
  58. Moreno, J.O.; Caamal-Olvera, C.G.; Luna, E.M. Mobility and Sustainable Transportation in Higher Education: Evidence from Monterrey Metropolitan Area in Mexico. Int. J. Sustain. High. Educ. 2022. [Google Scholar] [CrossRef]
  59. Chauhan, S.; Akhtar, A.; Gupta, A. Customer Experience in Digital Banking: A Review and Future Research Directions. Int. J. Qual. Serv. Sci. 2022, 14, 311–348. [Google Scholar] [CrossRef]
  60. Peppers, D.; Rogers, M. Evolution of Relationships with Customer and Strategic Customer Experience and Relationships. In Managing Customer Relationships, 3rd ed.; Peppers, D., Rogers, M., Eds.; Wiley Online Books: Hoboken, NJ, USA, 2016; pp. 3–42. [Google Scholar] [CrossRef]
  61. Koay, K.Y.; Cheah, C.W.; Chang, Y.X. A Model of Online Food Delivery Service Quality, Customer Satisfaction and Customer Loyalty: A Combination of PLS-SEM and NCA Approaches. Br. Food J. 2022, 124, 4516–4532. [Google Scholar] [CrossRef]
  62. Zhao, L.; Xu, Y. Artificial Intelligence Monitoring System Using ZigBee Wireless Network Technology in Warehousing and Logistics Innovation and Economic Cost Management. Wirel. Commun. Mob. Comput. 2022, 2022, 4793654. [Google Scholar] [CrossRef]
  63. Ali, I.; Phan, H.M. Industry 4.0 Technologies and Sustainable Warehousing: A Systematic Literature Review and Future Research Agenda. Int. J. Logist. Manag. 2022, 33, 644–662. [Google Scholar] [CrossRef]
  64. Surahman, S.; Mardhanie, A.B.; Hutauruk, T.R.; Harits, D.; Salmani, M. Utilization of Supply Chain and Benefit-Cost Analysis to Determining Warehousing Area in Penajam Paser Utara Regency. In Proceedings of the International Conference on Applied Science and Technology on Social Science 2021 (iCAST-SS 2021), Samarinda, East Kalimantan, 23–24 October 2021. [Google Scholar] [CrossRef]
  65. Namir, K.; Labriji, H. Decision Support Tool for Dynamic Inventory Management using Machine Learning, Time Series and Combinatorial Optimization. Procedia Comput. Sci. 2022, 198, 423–428. [Google Scholar] [CrossRef]
  66. Fisher Ke, J.; Han, C. Customer-Country Diversification and Inventory Efficiency: Comparative Evidence from the Manufacturing Sector during the pre-Pandemic and the COVID-19 Pandemic Periods. J. Bus. Res. 2022, 148, 292–303. [Google Scholar] [CrossRef]
  67. Mechmech, R.; Harbi, S.; Hadj-Alouane, A.B.; Sboui, S. Clearance Chain Design: Strategies Selection and Unsold Inventory Allocation. Int. J. Logist. Syst. Manag. 2022, 41, 145–170. [Google Scholar] [CrossRef]
  68. van der Walt, a.; Bean, W.L. Inventory Management for the in-Flight Catering Industry: A Case of Uncertain Demand and Product Substitutability. Comput. Ind. Eng. 2022, 165, 107914. [Google Scholar] [CrossRef]
  69. Kohonen, T. The Self-Organizing Map. Proc. IEEE 1990, 78, 1464–1480. [Google Scholar] [CrossRef]
  70. Kohonen, T. Essentials of the Self-Organizing Map. Neural Netw. 2013, 37, 52–65. [Google Scholar] [CrossRef] [PubMed]
  71. Wang, S. Application of Self-Organising Maps for Data Mining with Incomplete Data Sets. Neural Comput. Appl. 2003, 12, 42–48. [Google Scholar] [CrossRef]
  72. Lin, G.F.; Wu, M.C. An RBF Network with a Two-Step Learning Algorithm for Developing a Reservoir Inflow Forecasting Model. J. Hydrol. 2011, 405, 439–450. [Google Scholar] [CrossRef]
  73. Arribas-Bel, D.; Nijkamp, P.; Scholten, H. Multidimensional Urban Sprawl in Europe: A Self-Organizing Map Approach. Comput. Environ. Urban Syst. 2011, 35, 263–275. [Google Scholar] [CrossRef] [Green Version]
  74. Chelghoum, N.; Zeitouni, K.; Boulmakoul, A. A Decision Tree for Multi-Layered Spatial Data. In Advances in Spatial Data Handling; Richardson, D.E., van Oosterom, P., Eds.; Springer: Berlin/Heidelberg, Germany, 2002; pp. 1–10. [Google Scholar] [CrossRef] [Green Version]
  75. Jiang, Z.; Shekhar, S.; Mohan, P.; Knight, J.; Corcoran, J. Learning Spatial Decision Tree for Geographical Classification: A Summary of Results. In Proceedings of the 20th International Conference on Advances in Geographic Information Systems, Redondo Beach, CA, USA, 6–9 November 2012. [Google Scholar] [CrossRef]
  76. Ordonez, C. Comparing Association Rules and Decision Trees for Disease Prediction. In Proceedings of the International Workshop on Healthcare Information and Knowledge Management, Arlington, VA, USA, 11 November 2006. [Google Scholar] [CrossRef]
  77. Liu, C.; Sun, K.; Rather, Z.H.; Chen, Z.; Bak, C.L.; Thøgersen, P.; Lund, P. A Systematic Approach for Dynamic Security Assessment and the Corresponding Preventive Control Scheme Based on Decision Trees. IEEE Trans. Power Syst. 2013, 29, 717–730. [Google Scholar] [CrossRef]
  78. Gepp, A.; Kumar, K.; Bhattacharya, S. Business Failure Prediction Using Decision Trees. J. Forecast. 2021, 29, 536–555. [Google Scholar] [CrossRef]
  79. Al-Radaideh, Q.A.; Al-Shawakfa, E.M.; Al-Najjar, M.I. Mining Student Data Using Decision Trees. In Proceedings of the International Arab Conference on Information Technology (ACIT’2006), Irbid, Jordan, 19–21 December 2006. [Google Scholar]
  80. Huang, N.; Peng, H.; Cai, G.; Chen, J. Power Quality Disturbances Feature Selection and Recognition Using Optimal Multi-Resolution Fast S-transform and CART Algorithm. Energies 2016, 9, 927. [Google Scholar] [CrossRef] [Green Version]
  81. Dinh, D.T.; Fujinami, T.; Huynh, V.N. Estimating the Optimal Number of Clusters in Categorical Data Clustering by Silhouette Coefficient. In International Symposium on Knowledge and Systems Sciences; Chen, J., Huynh, V., Nguyen, G.N., Tang, X., Eds.; Springer: Singapore, 2019; pp. 1–17. [Google Scholar] [CrossRef]
  82. Vu, H.L.; Ng, K.T.W.; Richter, A.; An, C. Analysis of Input Set Characteristics and Variances on K-fold Cross Validation for a Recurrent Neural Network Model on Waste Disposal Rate Estimation. J. Environ. Manag. 2022, 311, 114869. [Google Scholar] [CrossRef]
  83. Lyu, Z.; Yu, Y.; Samali, B.; Rashidi, M.; Mohammadi, M.; Nguyen, T.N.; Nguyen, A. Back-Propagation Neural Network Optimized by K-fold Cross-Validation for Prediction of Torsional Strength of Reinforced Concrete Beam. Materials 2022, 15, 1477. [Google Scholar] [CrossRef]
  84. Feng, K.; Leemis, L.M.; Sasinowska, H. RMSE-Minimizing Confidence Intervals for the Binomial Parameter. Comput. Stat. 2022, 37, 1855–1885. [Google Scholar] [CrossRef]
  85. Zou, Y.; Zheng, C.; Alzahrani, A.M.; Ahmad, W.; Ahmad, A.; Mohamed, A.M.; Khallaf, R.; Elattar, S. Evaluation of Artificial Intelligence Methods to Estimate the Compressive Strength of Geopolymers. Gels 2022, 8, 271. [Google Scholar] [CrossRef] [PubMed]
  86. Rodríguez Sánchez, A.; Salmerón Gómez, R.; García, C. The Coefficient of Determination in the Ridge Regression. Commun. Stat.-Simul. Comput. 2022, 51, 201–219. [Google Scholar] [CrossRef] [Green Version]
  87. Angerosa, F.; Mostallino, R.; Basti, C.; Vito, R. Influence of malaxation temperature and time on the quality of virgin olive oils. Food Chem. 2001, 72, 19–28. [Google Scholar] [CrossRef]
  88. Marini, F.; Walczak, B. Particle Swarm Optimization (PSO). A Tutorial. Chemom. Intell. Lab. Syst. 2015, 149, 153–165. [Google Scholar] [CrossRef]
  89. Che, D.; Liu, Q.; Rasheed, K.; Tao, X. Decision Tree and Ensemble Learning Algorithms with Their Applications in Bioinformatics. In Software Tools and Algorithms for Biological Systems; Arabnia, H., Tran, Q.N., Eds.; Springer: New York, NY, USA, 2011; Volume 696, pp. 191–199. [Google Scholar] [CrossRef]
Figure 1. Proposed model.
Processes 11 00271 g001
Figure 2. SOM architecture.
Processes 11 00271 g002
Figure 3. Visualization of SOM clusters via PCA.
Processes 11 00271 g003
Figure 4. The relationships between demand planning, manufacturing, transportation, customer service, warehousing, inventory management, supply chain performance, and company performance.
Processes 11 00271 g004
Table 1. Abbreviations used in this study.
AbbreviationDescription
IoTInternet of Things
PSOParticle Swarm Optimization
ANNArtificial Neural Network
ANFISAdaptive Neuro-Fuzzy Inference System
SWVsSynaptic Weight Vectors
AIArtificial Intelligence
SOMSelf-Organizing Map
RMSERoot Mean Square Error
MAEMean Absolute Error
GIGini Index
DTsDecision Trees
CARTsClassification and Regression Trees
WSNsWireless Sensor Networks
Table 2. Demographic information of the respondents by gender.
Gender
ItemsFrequencyPercentageValid PercentageCumulative Percentage
Female12021.721.721.7
Male43278.378.3100.0
Total552100.0100.0
Table 3. Demographic information of the respondents by education level.
Education Level
ItemsFrequencyPercentageValid PercentageCumulative Percentage
Bachelor’s Degree6612.012.012.0
Master’s Degree17932.432.444.4
Other Certificate407.27.251.6
PhD26748.448.4100.0
Total552100.0100.0
Table 4. Demographic information of the respondents by employment in the industry.
Employment in Industry
ItemsFrequencyPercentageValid PercentageCumulative Percentage
Full-Time35464.164.164.1
Part-Time19034.434.498.6
Retired/Unemployed81.41.4100.0
Total552100.0100.0
Table 5. Demographic information of the respondents by familiarity with IoT devices.
Familiarity with IoT Devices
ItemsFrequencyPercentageValid PercentageCumulative Percentage
Familiar17431.531.531.5
Neutral22039.939.971.4
Unfamiliar274.94.976.3
Very Familiar13123.723.7100.0
Total552100.0100.0
Table 6. The results obtained for the silhouette coefficient.
Number of ClustersSilhouette Coefficient
30.6051
40.7256
50.9237
60.7187
70.8861
80.8846
90.7738
100.8486
110.8701
120.8827
Table 7. The centroids of SOM clustering.
AttributeCluster n1Cluster n2Cluster n3Cluster n4Cluster n5
Demand planning4.6029414.2430561.8135592.8632481.619048
Manufacturing4.5000002.9930563.7966101.7521372.323810
Transportation4.4264713.2291673.4491532.6666671.961905
Customer service4.5294123.1180563.1186442.7179491.819048
Warehousing4.4558823.0277783.6779662.1965811.876190
Inventory management4.5000003.1527782.8898313.2393161.580952
Supply chain performance4.4852942.9791672.7457632.0341881.647619
Company performance4.6911763.5694443.2796612.5299152.047619
Table 8. Frequency of responses in each cluster.
Cluster_SOM_1
FrequencyPercentValid PercentCumulative Percent
Cluster n16812.312.312.3
Cluster n214426.126.138.4
Cluster n311821.421.459.8
Cluster n411721.221.281.0
Cluster n510519.019.0100.0
Total552100.0100.0
Table 9. Gender, education level, employment in industry, experience with ICT in industry, and familiarity with IoT devices.
Clusters
Cluster n1Cluster n2Cluster n3Cluster n4Cluster n5
CountCountCountCountCount
GenderFemale639292620
Male62105899185
Education LevelBachelor613211511
Master2546433629
Other Certificate413896
PhD3372465759
Employment in IndustryFull Time4888747965
Part Time1855433539
Retired/Unemployed21131
Experience with ICT in Industry1 Year1413151313
2 Years516201416
3 Years618111511
4 Years1014171210
5 Years617151010
6 Years71710149
7 Years91691012
8 Years3159179
9 Years818121215
Familiarity with IoT DevicesFamiliar2353372833
Neutral2353524745
Unfamiliar56574
Very Familiar1732243523
Table 10. Comparison of methods.
MethodRMSEMAECoefficient of Determination
Supply Chain Performance
Decision Trees0.52330.43230.8963
SOM + Decision Trees0.13640.12630.9566
ANN0.64620.56320.8535
ANFIS0.34240.26850.9156
Company Performance
Decision Trees0.54340.45640.8853
SOM + Decision Trees0.14530.13430.9378
ANN0.64620.58560.8345
ANFIS0.41320.28530.9042
Disclaimer/Publisher’s Note: The statements, opinions and data contained in all publications are solely those of the individual author(s) and contributor(s) and not of MDPI and/or the editor(s). MDPI and/or the editor(s) disclaim responsibility for any injury to people or property resulting from any ideas, methods, instructions or products referred to in the content.

