Article

Prediction Model for the Chemical Futures Price Using Improved Genetic Algorithm Based Long Short-Term Memory

1
School of Economics and Management, China University of Petroleum, Beijing 102249, China
2
Department of Management, Taiyuan University, Taiyuan 030032, China
3
CNPC Economics and Technology Research Institute, Beijing 100724, China
*
Author to whom correspondence should be addressed.
Processes 2023, 11(1), 238; https://doi.org/10.3390/pr11010238
Submission received: 14 October 2022 / Revised: 9 December 2022 / Accepted: 23 December 2022 / Published: 11 January 2023
(This article belongs to the Special Issue Evolutionary Process for Engineering Optimization (II))

Abstract

:
In this paper, a new prediction model for accurately recognizing and appropriately evaluating the trends of domestic chemical products and for improving the forecasting accuracy of the chemical products’ prices is proposed. The proposed model uses the minimum forecasting error as the evaluation objective to forecast the settlement price. Active contracts for polyethylene and polypropylene futures on the Dalian Commodity Futures Exchange for the next five days were used, the data were divided into a training set and test set through normalization, and the time window, batch processing size, number of hidden layers, and rejection rate of a long short-term memory (LSTM) network were optimized by an improved genetic algorithm (IGA). In the experiments, with respect to the shortcomings of the genetic algorithm, the crossover location determination and some gene exchange methods in the crossover strategy were improved, and the predicted results of the IGA–LSTM model were compared with those of other models. The results showed that the IGA–LSTM model could effectively capture the characteristics and trends of time-series changes. The results showed that the proposed model obtained the minimum values (MSE = 0.00107, RMSE = 0.03268, and MAPE = 0.0691) in the forecasting of futures prices for two types of chemical products, showing excellent forecasting performance.

1. Introduction

Recently, the developmental environment of the chemical industry has been complex and changeable, the market scale is expanding, and the competition among the main bodies is increasingly fierce [1,2,3]. It is the key to winning sales initiatives, grasping the coordination of quantity and price, and realizing the optimal economic benefit to accurately understand and properly evaluate the price trends of domestic chemical products. Chemicals are located in the downstream links of oil, coal, and other industrial chains, and the price transmission mechanism is relatively complex. Affected by domestic and foreign macro-policies, supply and demand fundamentals, upstream and downstream product prices, and other factors, chemical prices are a comprehensive response to relevant information with high-noise, dynamic, and non-linear characteristics. Therefore, it is necessary to build a price forecasting model to explore the historical laws of various information on price changes and then predict the trends of future prices [2,4].
Early price forecasting models were mainly based on traditional time-series methods that used ARIMA [5], GARCH [6], Markov zone transfer [7], Kalman filter [8], and other methods to predict the prices of financial products and commodities. In recent years, artificial intelligence technology has been rapidly developing, and neural networks have been gradually applied to the field of price prediction and have continued to improve [9]. Compared with the traditional econometric model, the multi-layer network structure of neural networks can more accurately describe complex and variable non-linear relations, thus greatly improving forecasting performance. They have more advantages in dealing with non-linear problems with complex structures and multiple factors, such as price forecasts. Yu et al. demonstrated that a neural network method based on empirical mode decomposition was used to forecast international crude oil prices [10]. Ying and Gao optimized the key parameters of a BP neural network through the PSO algorithm as an adaptive learning strategy to improve the prediction accuracy for stock prices [
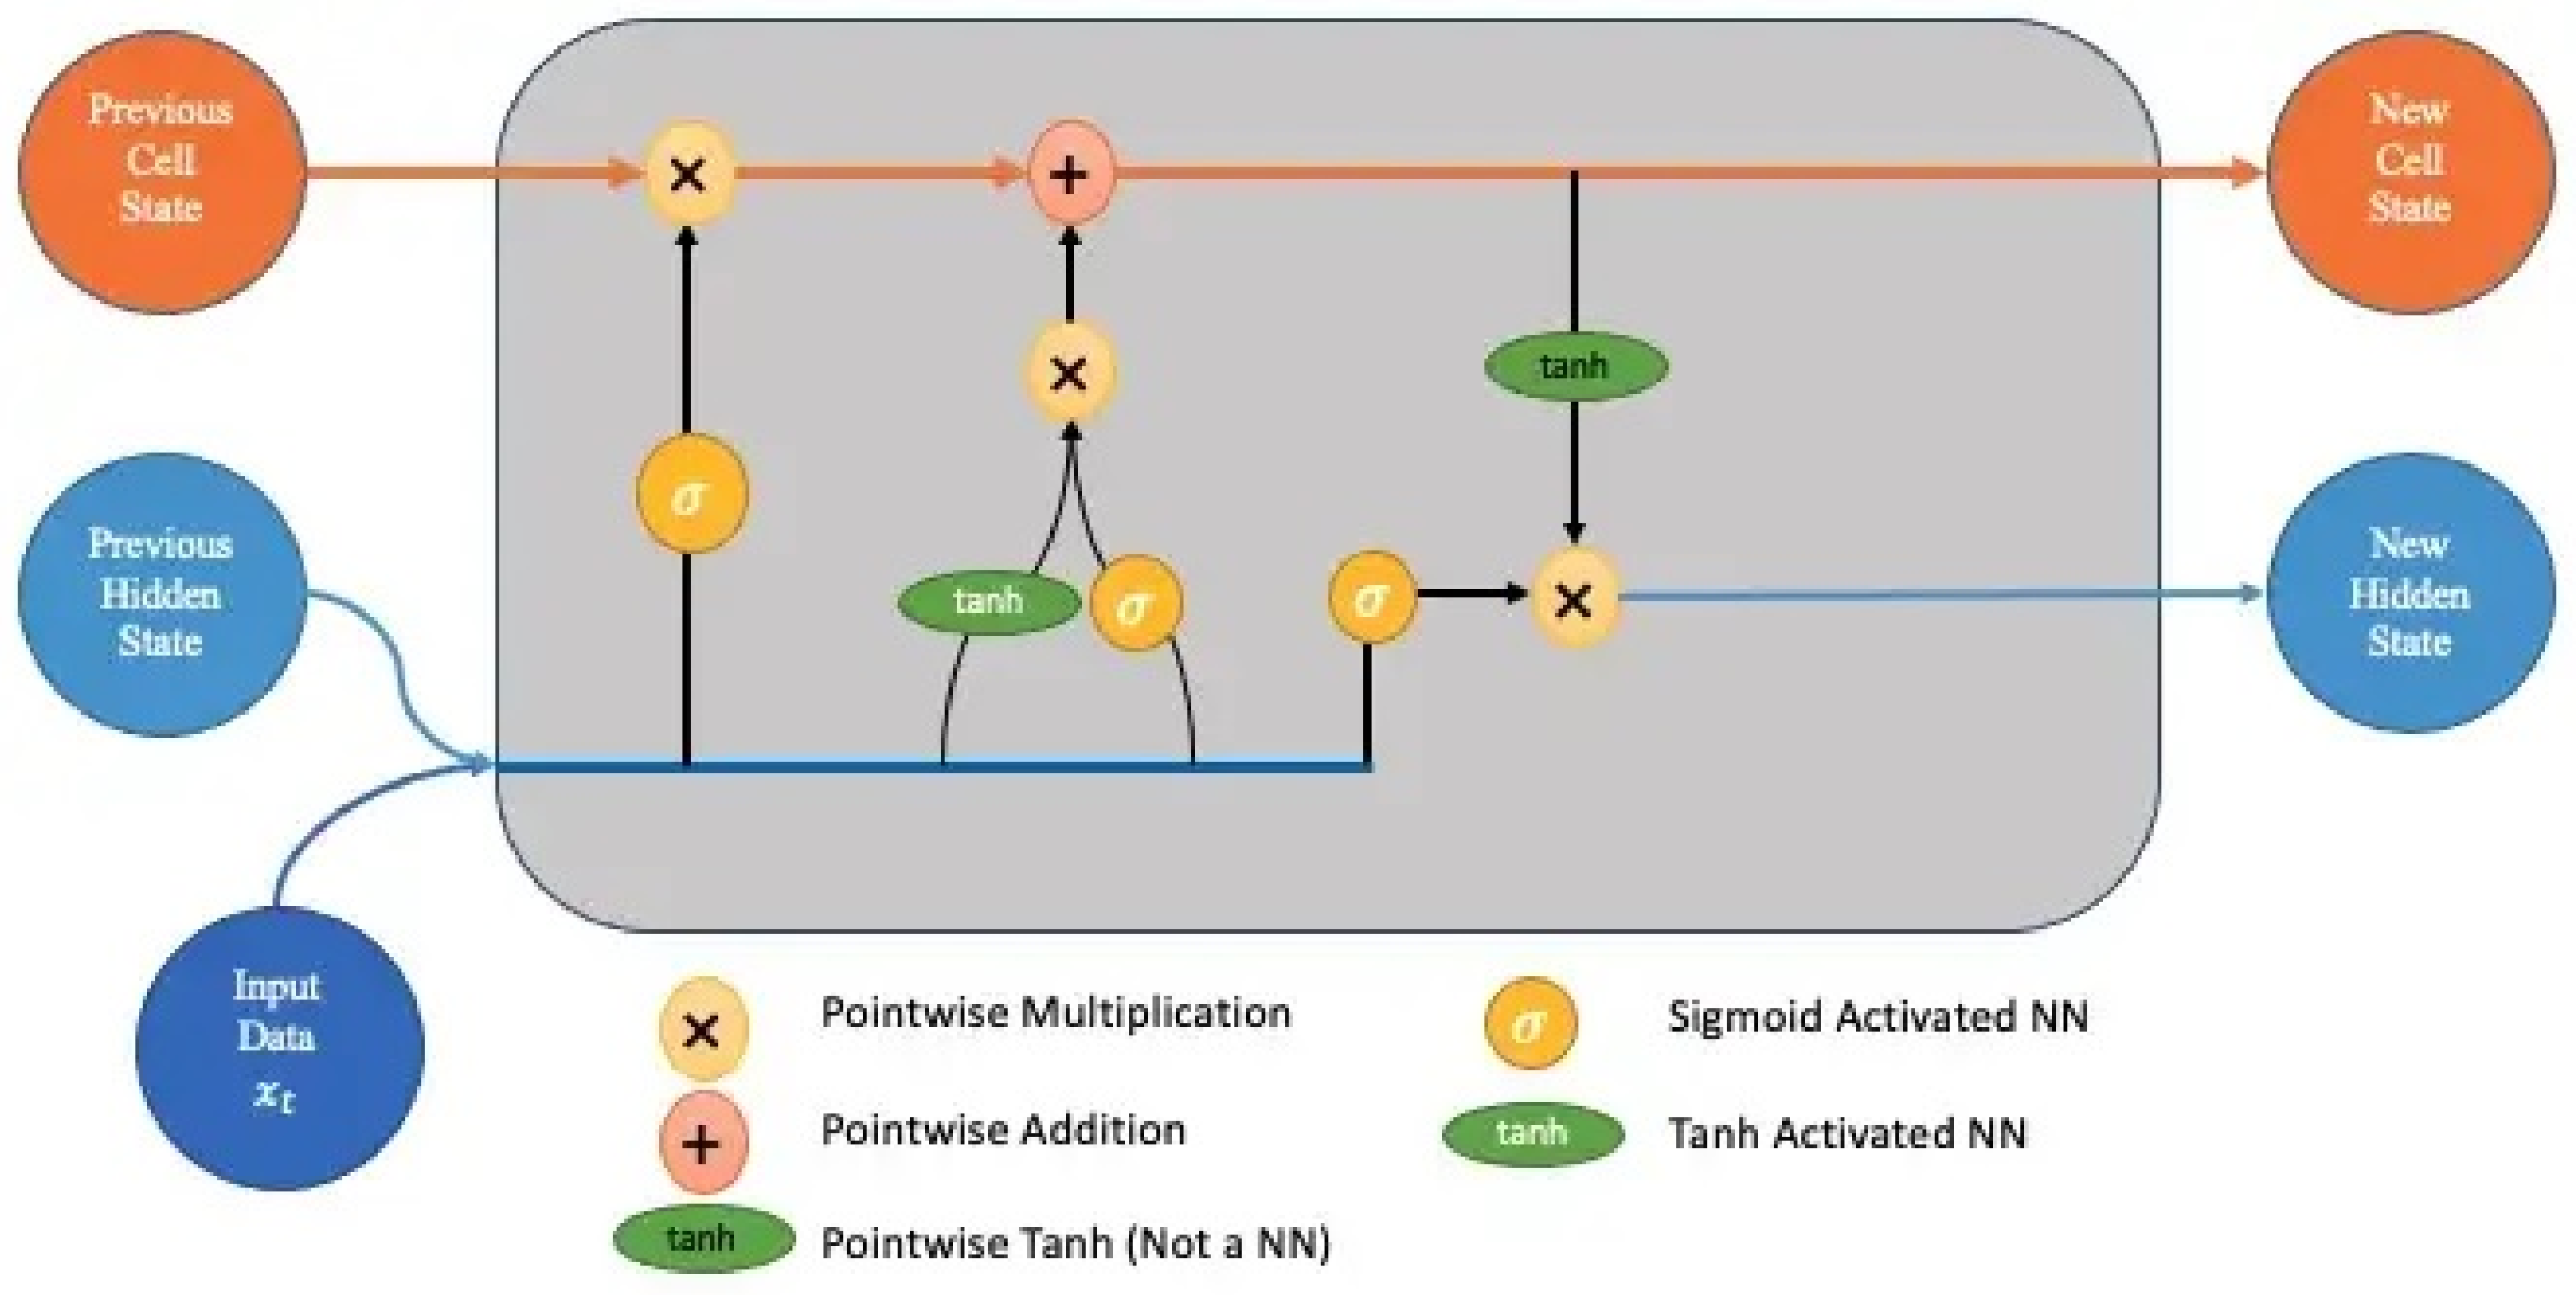
11]. Compared with other neural networks, recurrent neural networks introduce the concept of time series into the network structure, which makes them more adaptive in time-series analysis. Hochreiter and Schmidhuber proposed the LSTM model, which added a control gate structure to a recurrent neural network (RNN) unit to realize a memory function in time, and they also solved the problems of gradient disappearance and gradient explosion faced by a recurrent neural network model [12]. The LSTM network models are also widely used in the economic and financial fields. Liu et al. used an LSTM model to predict the closing price of China’s 50 Shanghai stocks [13]. Fischer and Krauss showed that an LSTM model had higher precision in predicting volatility in the S&P 500 Index than a random forest, deep neural network, or logical regression classifier [14]. Compared with other neural network methods, LSTM neural networks have a long-term memory function, which has certain advantages in time-series modeling and prediction. They also solve the problems of gradient disappearance and gradient explosion in long time-series training and have strong adaptability and high accuracy in solving financial time-series prediction problems [15].
In [16], the LSTM model was trained by using a Heap-based optimizer, which significantly improved the LSTM model’s prediction performance. To assess the newly developed HBO–LSTM, they examined four datasets from the well-known La Haute Borne wind turbines in France. For comparisons, they also took a number of LSTM models, which had been tuned using a variety of optimization strategies, as well as a number of existing models, into account. The comparison’s results supported the HBO’s ability to improve the LSTM model’s prediction performance.
Another study investigated how a new methodology could be used to forecast the adjusted closing price of a particular firm [17]. Instead of using the conventional four features, a new six-feature set (High, Low, Volume, Open, HiLo, OpSe) was created to increase the likelihood of providing more accurate findings with fewer losses (High, Low, Volume, Open). The study also examined the impact of the data scale by enhancing open innovation dynamics with datasets from Apple, ExxonMobil, Tesla, and Snapchat. The impact of the company’s sector on the loss outcome was also considered.
Another study identified the GCC stock market, which was most negatively impacted by COVID-19, and extracted the contributing aspects [18]. Analysis of the analytics data revealed recommendations that, when followed, could lessen adverse financial effects. The financial repercussions of COVID-19 are still unknown, despite international efforts to stop its spread. Recently, the spread of COVID-19 led to a decrease in stock market indices, as most industries experienced a recession. Bahrain was the most affected market in the GCC, with losses shortly increasing by 0.29, totaling 0.35 over the following two months.
A traffic burst-sensitive model (TBSM) was suggested for predicting near-term traffic [19]. We first established a new state unit containing the short-term trend and reported the state to capture both the burst and typical scenarios. Second, an increment-based forecasting model and state-and-trend unit similarity degree (SD) assessment technique were suggested. The outcomes showed that the suggested model substantially outperformed both deep learning and other conventional machine learning techniques.
The 2019 COVID-19 outbreak’s effects on the stock price collapse risk for Chinese energy corporations are examined in this essay. In this paper [20], the authors discovered that following COVID-19, the likelihood of stock market crashes for energy companies dramatically decreased. Additionally, they discovered that companies with higher levels of corporate social responsibility (CSR) activity were less susceptible to the risk of stock price crashes in the years after COVID-19 than companies with lower levels of CSR activity. Finally, they demonstrated that in the post-COVID-19 period, state-owned companies (SOEs) had less stock price crash risk than non-SOEs did. Our findings show that China’s economy recovered after COVID-19, which has policy ramifications for businesses looking to strengthen their resistance to exogenous shocks.
Generally, some parameters in a neural network model usually need to be set manually, and the prediction performance of the models trained with different parameters varies significantly. At present, the commonly used approaches for parameter selection include ergodic multi-grid search algorithm, fine parameter adjustment of control variables, and other methods that require high-end hardware and a slow parameter optimization process. The genetic algorithm, one of the optimization algorithms, has a good global search ability; therefore, it does not fall into the trap of a fast descent of local optimum. At the same time, it uses its inherent parallelism to carry out distributed computing to speed up the optimal solution. However, the genetic algorithm’s local search ability is comparatively weak, and the search efficiency is low at the later stages of evolution. It was easy to cause premature convergence in practical applications, resulting in low efficiency and low accuracy in the optimization process [21,
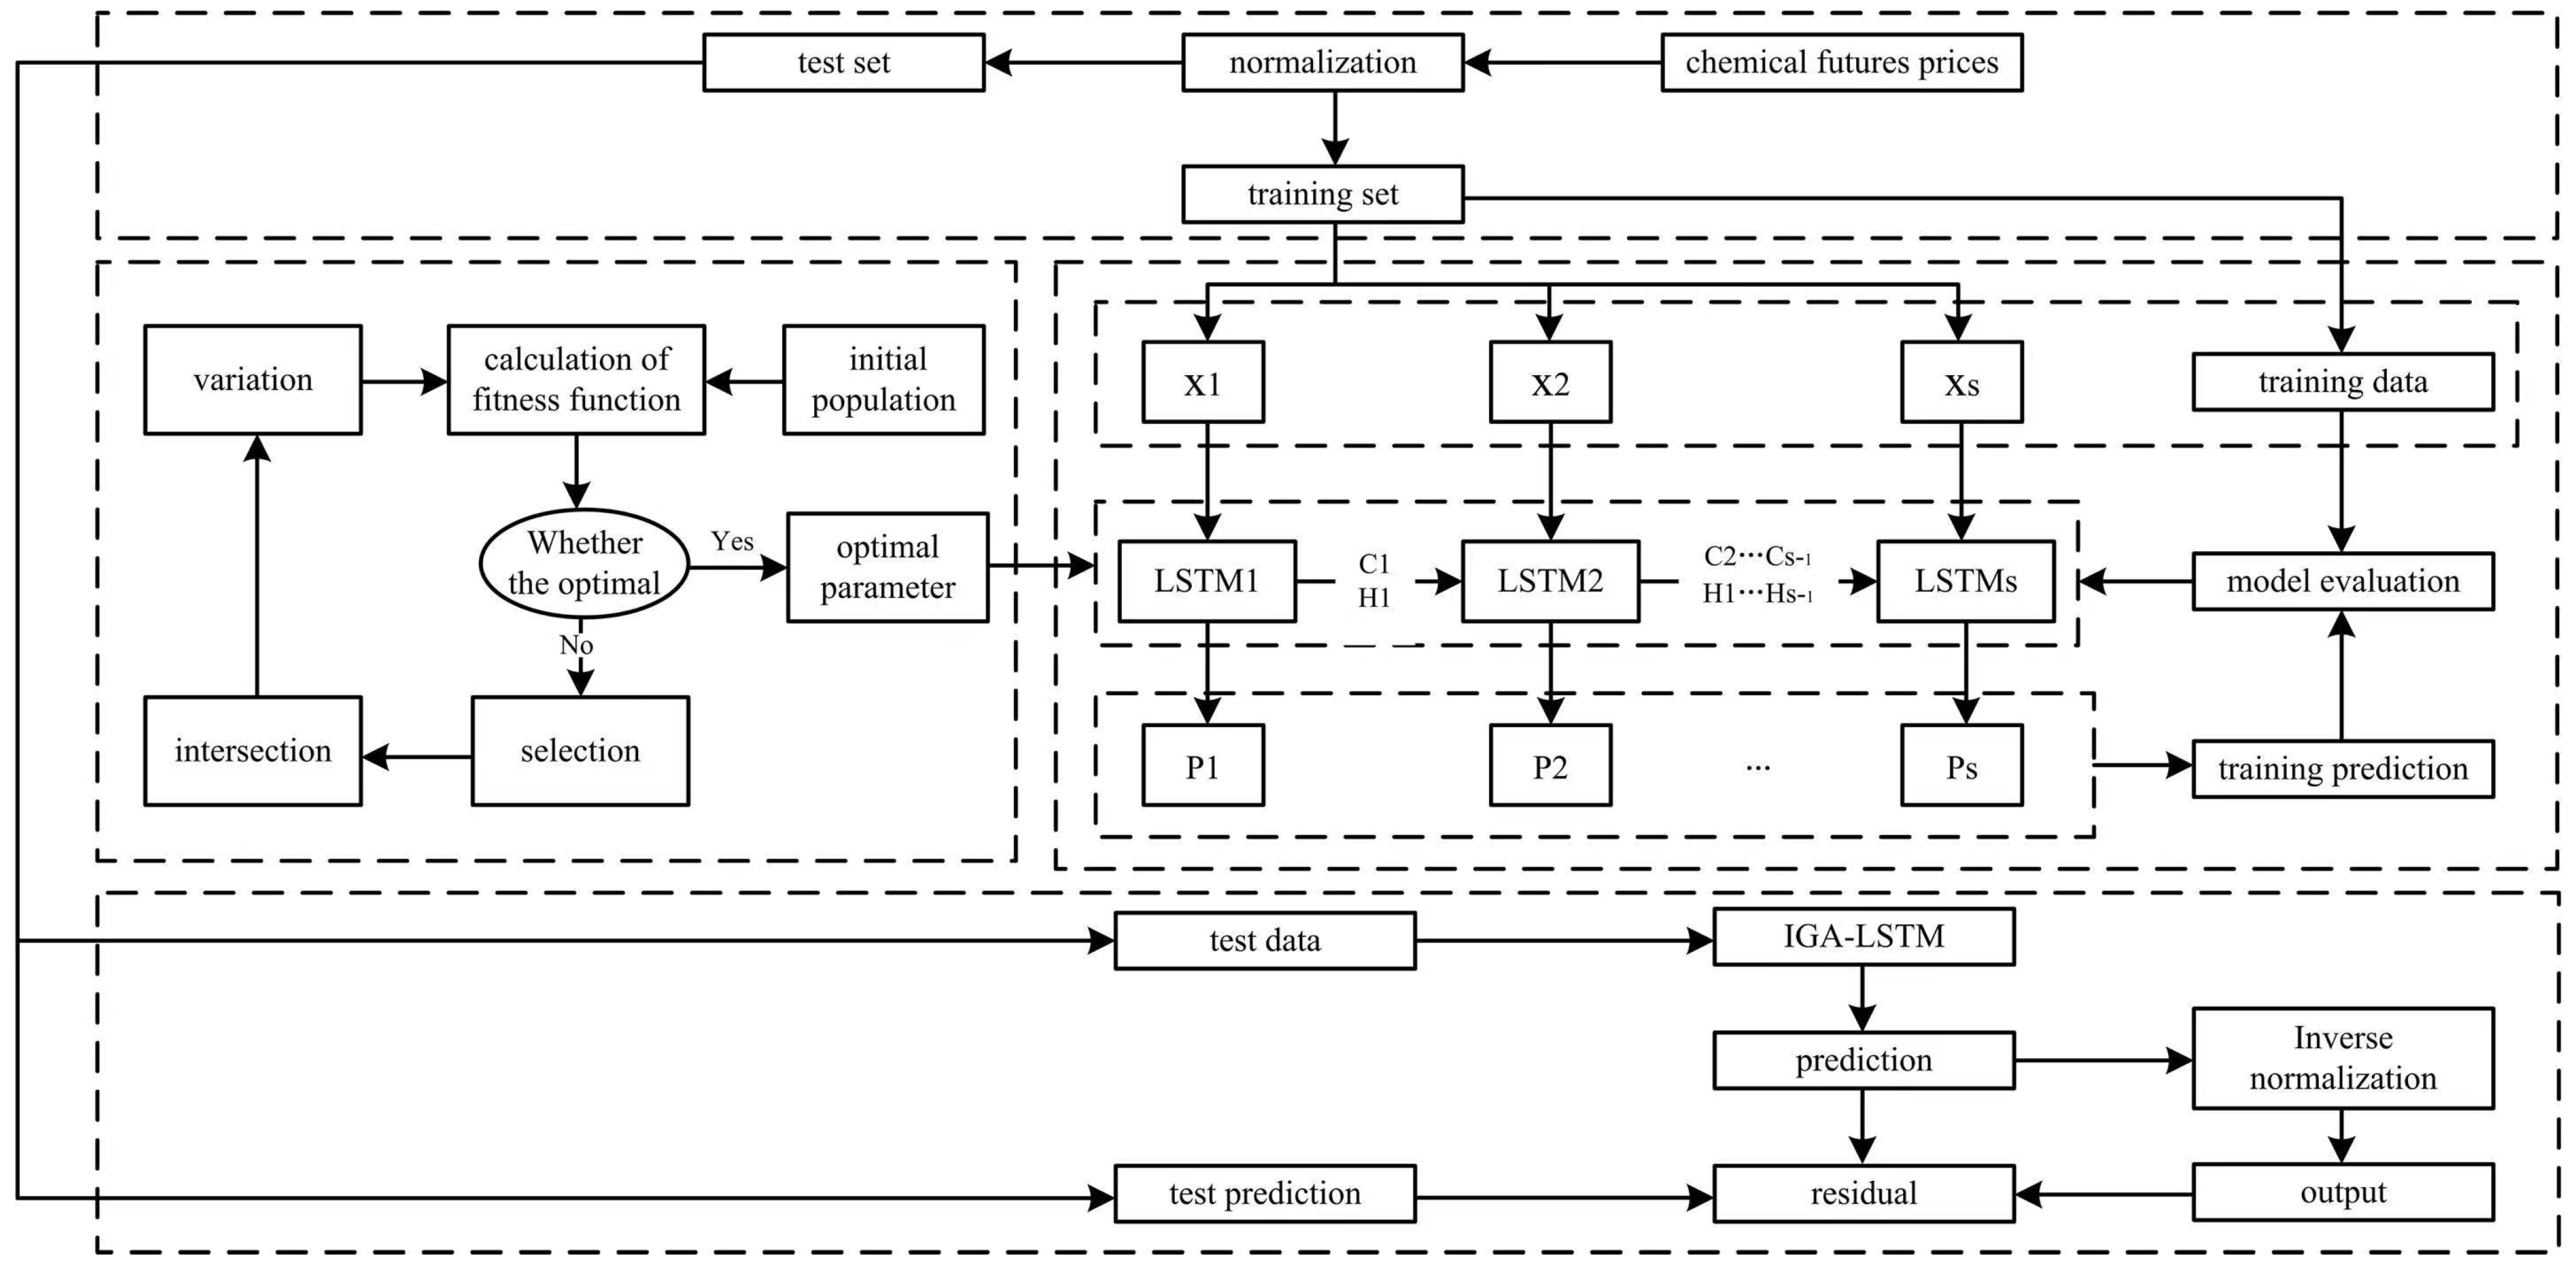
22]. Therefore, given the shortcomings of the genetic algorithm, this paper improved the crossover location determination and some gene exchange methods in the crossover strategy and used an LSTM model based on the improved genetic algorithm (IGA-LSTM) to forecast the settlement price of the active contracts for linear low-density polyethylene and polypropylene futures over 5 days in the Dalian Commodity Futures Exchange, with the goal of minimizing the prediction error.
The rest of this article is structured as follows: in Section 2, we introduce the research method, including the short-term memory network, the genetic algorithm, and the improved genetic algorithm. In Section 3, we detail the process of modeling. In Section 4, we applied an IGA-LSTM model to forecast chemical futures prices and to present the training procedure and outputs. Finally, Section 5 concludes the study.

2. Research Methodology

2.1. Long Short-Term Memory Network

RNN is a neural network model with a short-term memory function. It adds the feedback connection from the hidden layer to the hidden layer. Its final prediction result is the result of all historical data, which has the transitivity of characteristic information in time. LSTM is a variant of RNN, which realizes the memory function in time.
The LSTM model is composed of multiple homogeneous cyclic units, which can store information for a long time by updating the internal state. Each cyclic unit is composed of input-gate i t , forget-gate f t , output-gate o t , candidate state C t , and hidden state H t . The activation function and the point-by-point multiplication operation are used to form a threshold so that the LSTM unit can calculate the long-distance historical information. The calculation process is as follows:
Step 1. Use the hidden status information from the previous moment h t 1 and input at the current time x t to calculate the input-gate, forget-gate, output-gate, and candidate state.
f t = σ ( W f x t + U f h t 1 + b f ) ,
i t = σ ( W i x t + U i h t 1 + b i ) ,
c ˜ t = tanh ( W c x t + U o h t 1 + b c ) ,
o t = σ ( W o x t + U o h t 1 + b o ) ,
where σ is the sigmoid activation function, tanh is the tanh activation function, W, U are weight matrices, and b is the biases present at different layers.
Step 2. Combine forget-gate f t and input-gate i t to update memory cell
c t = f t c c 1 + i t c ˜ t ,
Step 3. Using Equation (4), pass the hidden layer internal state to output layer external state
h t = o t tanh ( c t ) ,

2.2. Genetic Algorithm

A genetic algorithm (GA) was proposed according to the important theoretical achievements in life science and engineering discipline [23]. GA transformed the optimization problem into a process similar to the hybridization and mutation of chromosome genes in biological evolution by mathematical means and computer simulation [24]. That is, the global search heuristic algorithm is used to solve the optimization problem, addressing the shortcomings that traditional algorithms possess regarding falling into the local optimum. GA encodes the potential solutions onto individuals, which are the chromosomes of a characterized entity. Chromosome is the main carrier of genetic material, composed of multiple genes whose intrinsic expression determines the outward expression of the individual form. Therefore, when using GA to optimize parameters, it is necessary to encode the parameters of the model at the beginning. It is a complex issue in replicating the genetic code, and some researchers tend to encode it as a binary string. Furthermore, genetic manipulation refers to the generation of new populations by acting on the existing populations, including selection, hybridization, and mutation. Hybridization refers to the process of exchanging the genes of two paired chromosomes by single-point hybridization or multi-point hybridization, thus forming two new individuals. Mutation refers to the process where a new gene is introduced to the existing chromosome and replaces the gene in the original position. It breaks the limitations of the current search ability and is more conducive to the algorithm for a global optimal solution. The final optimal chromosome is obtained by several rounds of selection, hybridization, and mutation. In GA, the fitness function is applied to measure the environmental adaptability of each individual, which is fundamental for the genetic algorithm to achieve the fittest survival. The larger the fitness value of an individual, the larger the area of its corresponding sector, and the higher its probability of being selected. It can be calculated as follows:
p = f i σ f ,
where f i is the ith chromosome fitness. GA is affected by three parameter settings: the number of chromosomes, hybridization probability, and mutation probability, which are represented by N, p d and p m respectively. GA, as the most commonly used swarm intelligent algorithm, is optimized in the solution space through the cross-mutation method between chromosomes, and it does not necessarily use the gradient descent. Many empirical studies have shown that when using genetic algorithms, it can converge to the global optimum in most cases. The genetic algorithm can search the space around chromosomes while maintaining good information through information interaction between chromosomes. Compared with other algorithms, GA has some difficulty when falling into the local optimum; however, its convergence speed is slow, the change of each chromosome is less in each iteration, and it often needs a large number of iterations to find better results in the optimization.

2.3. Improved Genetic Algorithm

In order to improve GA’s optimization efficiency, it is necessary to improve the optimization ability of the genetic algorithm, as GA’s optimization ability is determined by mutation. Therefore, in the process of improving GA, it is mainly to improve its local optimization ability. Compared with other optimization algorithms, the low local optimization efficiency of the genetic algorithm is mainly due to the lack of direction in the cross process; that is, not only the genes with poor performance but also the genes with good performance are changed in the process. The new chromosomes have the characteristics of two pairs of chromosomes. Compared with other optimization algorithms, GA’s local optimization ability is weak.
Therefore, when the genetic algorithm is improved in this paper, only the chromosomes with poor performance are changed during the hybridization operation, and their offspring will have part of the information of better-performing chromosomes. At the same time, the difference in chromosomes will be considered. The greater the difference, the lower the hybridization probability. At the same time, according to the value of the objective function, when the performance of the chromosome is poor, the mutation probability can be improved. With the increase in the number of iterations, the mutation probability will be reduced. It can be calculated as follows:
a ( t + 1 ) = ( e ( 1 + 1 t ) t ) f ( x ) M I N M A X M I N p m .
Finally, the implementation procedure of the proposed GA can be described by Algorithm 1.
Algorithm 1: Improver Genetic algorithm.
 Objective function f ( x ) , x = ( x 1 , , x N ) T
 Initialize the population of solutions x i , i = 1 , 2 , , N
 Define crossover probability p d , mutation probability p m and maximum number of iterations T
t T
 1 to N
 Evaluate operation substituting a new generation of chromosomes for an old one
end for
 1 to N
 Select operation according to Equation (7)
end for
i 1 to N
j 1 to N
f ( x i ) < f ( x j )
f ( x j ) Crossover operation
end if
end for
end for
 1 to N / 2
 Mutation operation according to Equation (8)
end for
t = t + 1
end while

3. Modelling

3.1. IGA-LSTM Prediction Model

Due to the non-stationary time series, the futures prices of chemicals have the characteristics of non−linearity and complexity. In order to accurately predict chemical futures prices, the IGA-LSTM model is constructed in this paper, and the time window, batch size, number of hidden layers, rejection rate, and other hyperparameters in the LSTM model are optimized by the IGA. Then, the best parameter combination is determined to realize the effective combination of LSTM model network structure and chemical futures price data. The overall framework is shown in Figure 1.
Step 1 Data processing. After importing the futures price data of chemical products, the data features are mapped to the interval ( 0 , 1 ) by normalization. Then, the data are divided into the training set and the test set and processed by the time-window step.
Step 2 Optimization of parameters. The IGA is used to optimize the time window, training times, the number of hidden layers, and rejection rate in LSTM and then to search space. According to the value range of parameters, the population is initialized and the objective functions are confirmed.
Step 3 Model specification. The optimal parameters obtained by IGA are used to construct the LSTM model, as given in Figure 2.
Step 4 Network training. Adam optimization algorithm is used to update the network iteratively, adjust the weight of the model, and reduce the prediction error.
Step 5 Use the trained IGA-LSTM model to predict.

3.2. Experimental Comparison Model

This paper compares the prediction results of the IGA-LSTM model with the ARIMA model, a support vector machine (SVM), traditional LSTM model, and GA-LSTM model. Among them, the ARIMA model is one of the most traditional time-series prediction and analysis methods, which requires stable data. The mean value and variance of the data should not change too much in theory and can continue along the existing form in the future in a short time. Support vector machine regression uses the Gaussian radial basis function (RBF) and other methods to map all sample points to high-dimensional space (Hilbert space) and then perform a linear regression operation to minimize the total deviation. The traditional LSTM model uses empirical parameters as follows: the time-window step of the LSTM model is 20, the number of network hidden layers is 100, the batch size is 128, and the rejection rate is 0.2. The GA-LSTM model uses a general genetic algorithm to optimize LSTM network parameters.

4. Experiments and Results

In this section, the GA-LSTM model is employed to forecast the chemical futures prices. In this paper, the settlement prices of active contracts for linear low-density polyethylene (LLDPE) futures in the Dalian Commodity Futures Exchange from 31 July 2007 to 5 August 2022 and active contracts for polypropylene (PP) futures from 28 February 2014 to 5 August 2022 are selected as sample data. The sample data sizes are 3654 and 2057, respectively. The training set accounts for 80 % of the total, and the rest of the data compose the testing set.

4.1. Parameter Selection

The improved genetic algorithm was applied to optimize the key parameters of the LSTM model. The number of individuals in the population was set as 50, the number of iterations was 50, the mutation probability was 0.01, the hybridization probability was 0.8, and the encoding method was binary. In order to reduce the influence of human factors, according to the specific conditions of the experimental samples, the parameter ranges of the LSTM are set as follows: the value range of the time-window step is [ 1 , 60 ] , the batch size is [ 10 , 500 ] , the number of hidden layers is [ 10 , 200 ] , and the rejection rate is [ 0.05 , 0.35 ] .
According to the IGA parameter optimization process, for the futures price in LLDPE, the optimal time-window step of LSTM network is 23, the number of hidden layers is 30, the batch size is 87, and the rejection rate is 0.17 . For the futures price in PP, the optimal time-window step of LSTM network is 20, the number of hidden layers is 52, the batch size is 100, and the rejection rate is 0.21 .

4.2. Model Evaluation Criteria

In this paper, the indicators, such as the mean squared error (MSE), root mean square error (RMSE), and average absolute percentage error (MAPE), are applied to quantitatively evaluate the prediction model. They are defined as follows:
M S E = 1 N n = 1 N ( y ^ n y n ) 2 ,
R M S E = 1 N n = 1 N ( y ^ n y n ) 2 ,
M A P E = 1 N n = 1 N | y ^ n y n | y n ,

4.3. Results and Discussion

In the experiment, the performance of IGA is evaluated by comparing six benchmark problems, as listed in Table 1.
Then, by comparing with standard FA, GA, PSO and artificial fish swarm algorithm (AFSA), the salp swarm algorithm (SSA), gravitational search algorithm (GSA), it is judged that the proposed IGA is effective.
We select the maximum, minimum, average and standard deviation (SD) of the optimal target (Range) as the evaluation indicators to measure the performance of the algorithm. After 20 independent operations, the indicator results are shown in Table 2, Table 3, Table 4 and Table 5. Table 2, Table 3, Table 4 and Table 5 show that, in most cases, the evaluation indicators of IGA are superior to the other six algorithms, which means IGA is excellent in accuracy, stability, and robustness.
We conduct a unit root test on the futures prices of the two chemicals, and the results show that the T-test values of LLDPE and PP were 1.63 and 1.93 , respectively, significantly larger than the critical value of 5 % , and the non-stability is significant. Due to the non-stationary time series, the futures prices of chemicals have the characteristics of nonlinearity and complexity, and the prediction accuracy of LSTM is easily affected by parameter setting. Therefore, improved genetic algorithm combined with LSTM is used in this paper to predict the price of chemical futures, the IGA-LSTM model is constructed in this paper, and the time window, batch size, number of hidden layers, rejection rate, and other hyperparameters in the LSTM model are optimized by GA to determine the best parameter combination, to realize the effective combination of LSTM model network structure and chemical futures price data.
Further, through the analysis of specific prediction error indicators, as listed in Table 6 and 
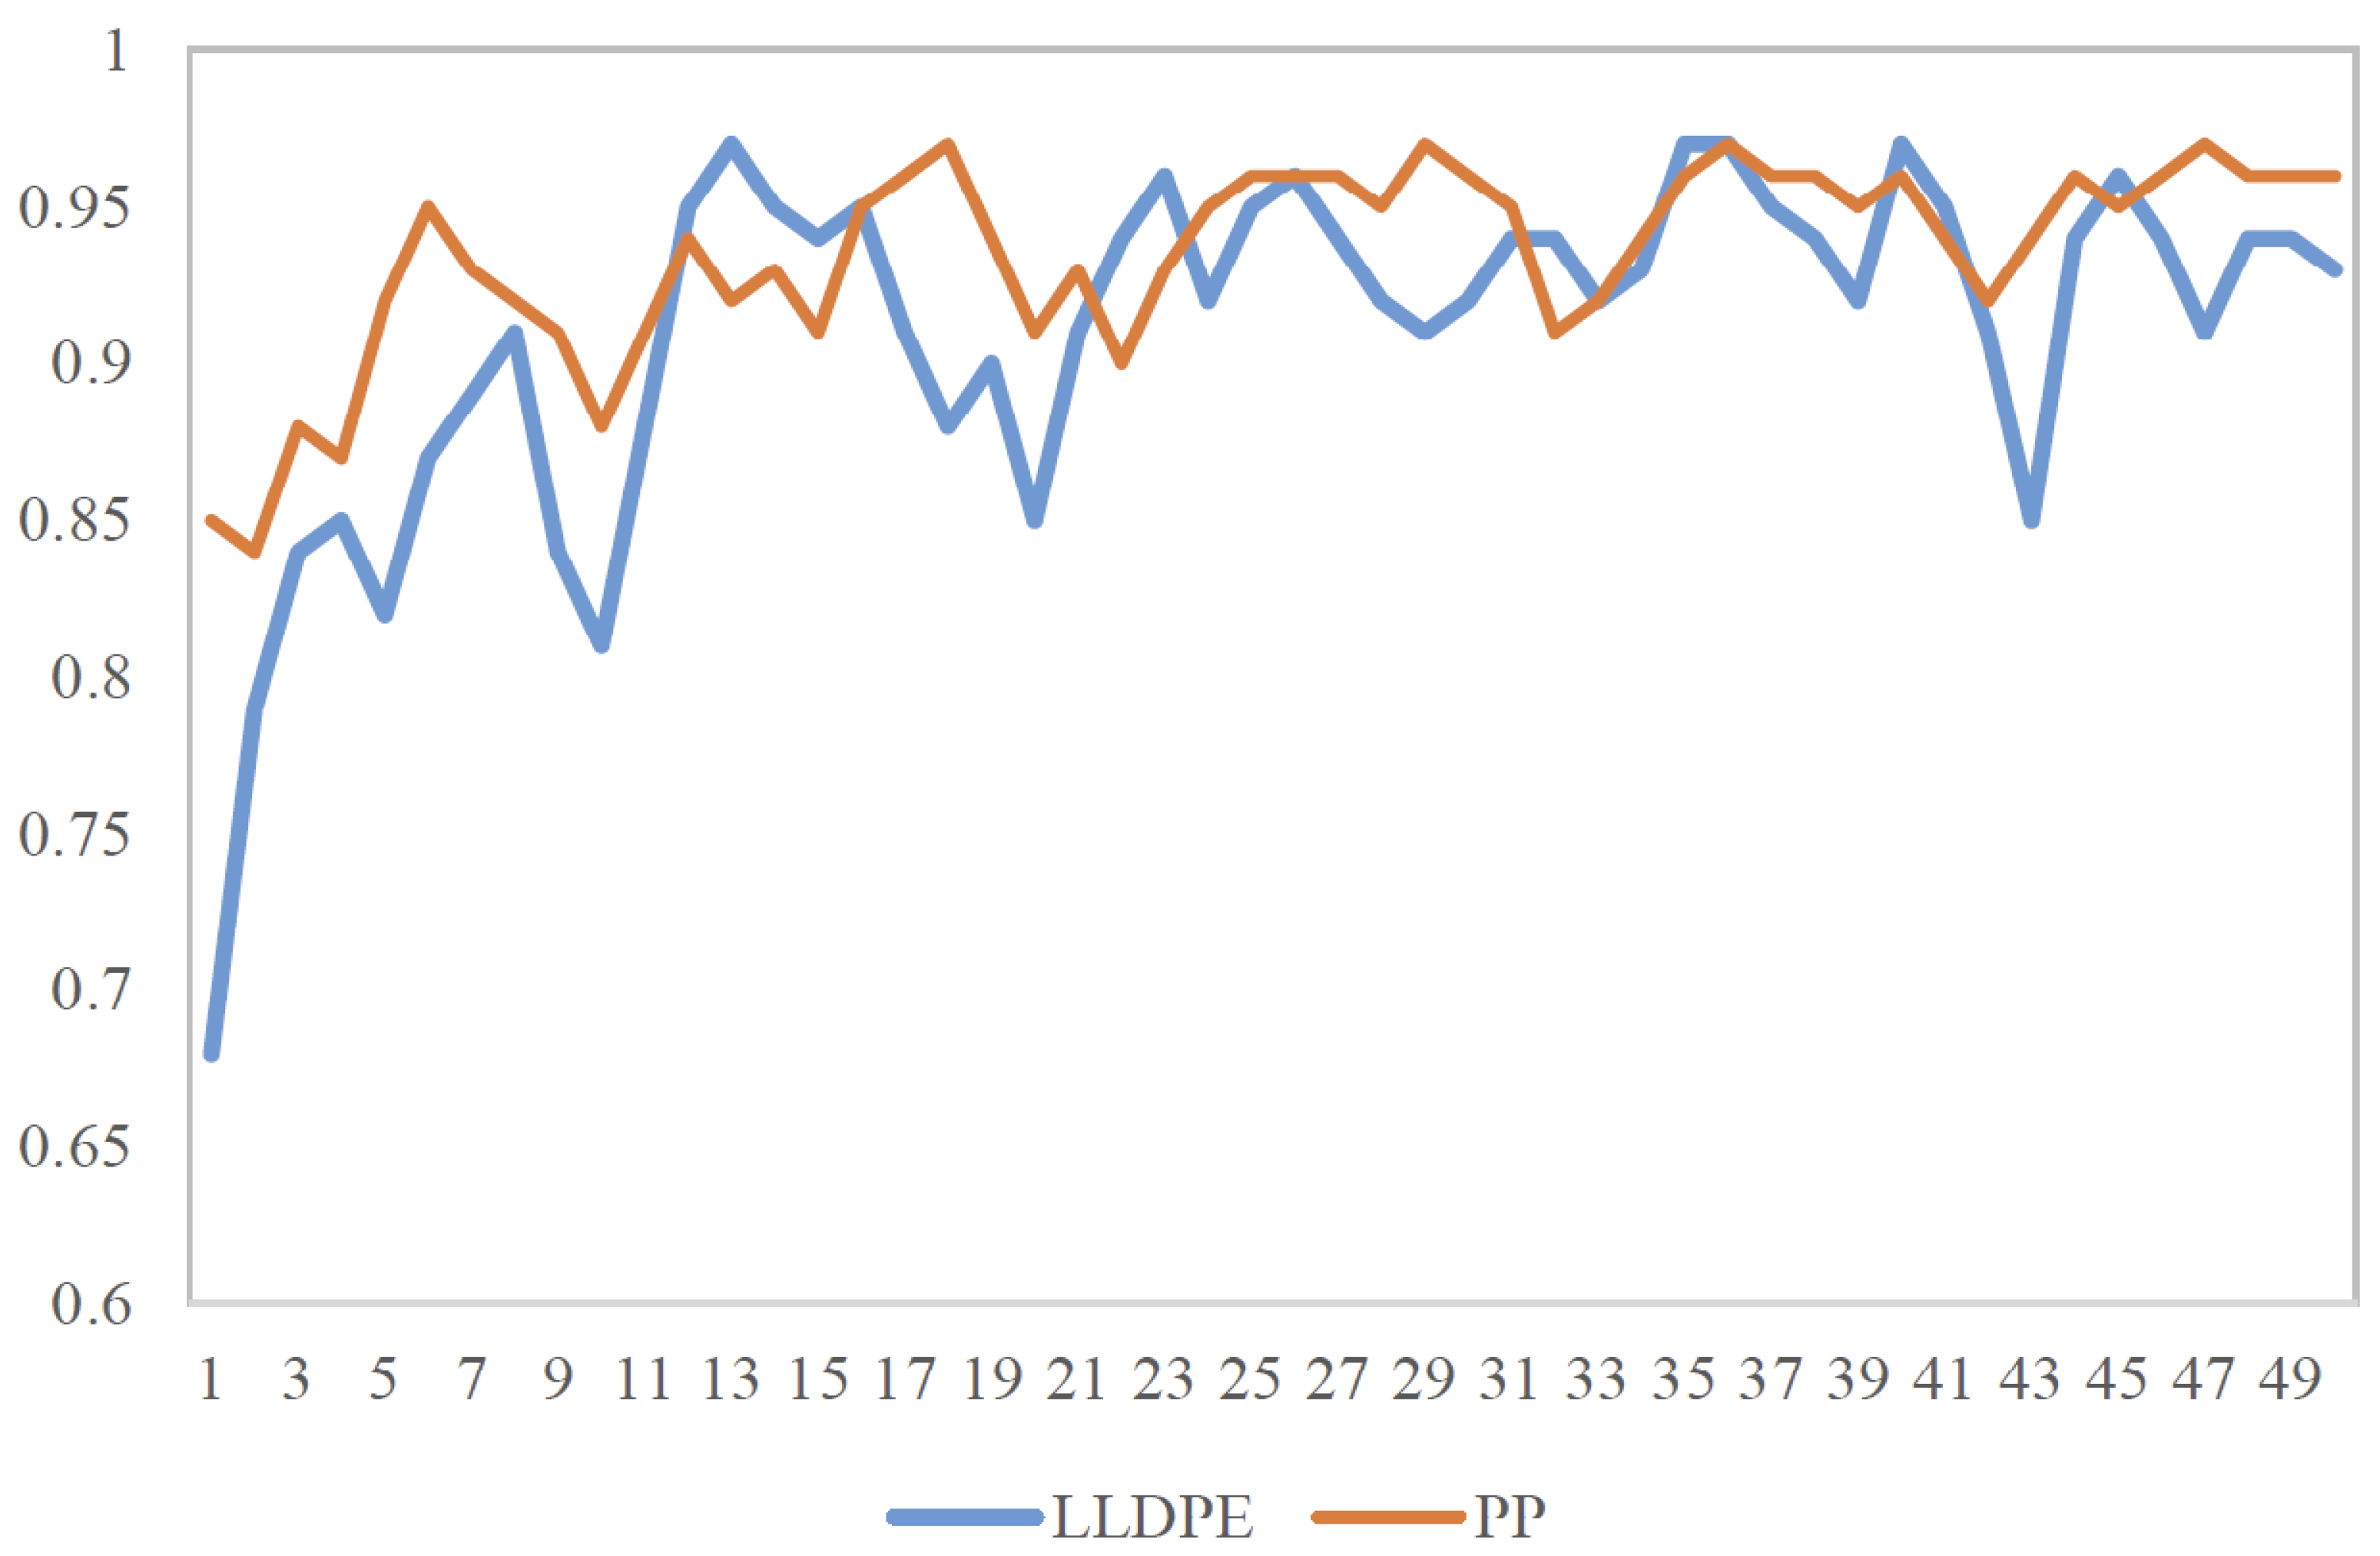
Table 7, under the three model evaluation indicators of MSE, RMSE and MAPE, IGA-LSTM model presented the best prediction results. Note that the calculation results of the evaluation indicators listed in this paper are based on the predicted values that have not been inverse-normalized, and the prices of different products are comparable. Meanwhile, the R square of all models in the training set is more than 0.965 , especially that of IGA-LSTM is more than 0.99 . Specifically, for the LLDPE price forecasting model, MSE, RMSE, and MAPE of IGA-LSTM model prediction results are 0.001, 0.032 and 0.096 respectively, which are 0.002, 0.025 and 0.046 lower than that of GA-LSTM model, 0.006, 0.053 and 0.075 lower than that of ARIMA model with the worst forecasting effect. The neural network performs better than the traditional time series model in the forecasting of long time series. And the parameter optimization effect of the LSTM neural network is significantly improved by genetic algorithm improvement. For the PP price forecasting model, the evaluation indicators of LSTM neural network forecasting results are significantly better than ARIMA and SVM models, and the increase of MAPE index is more than 0.15.
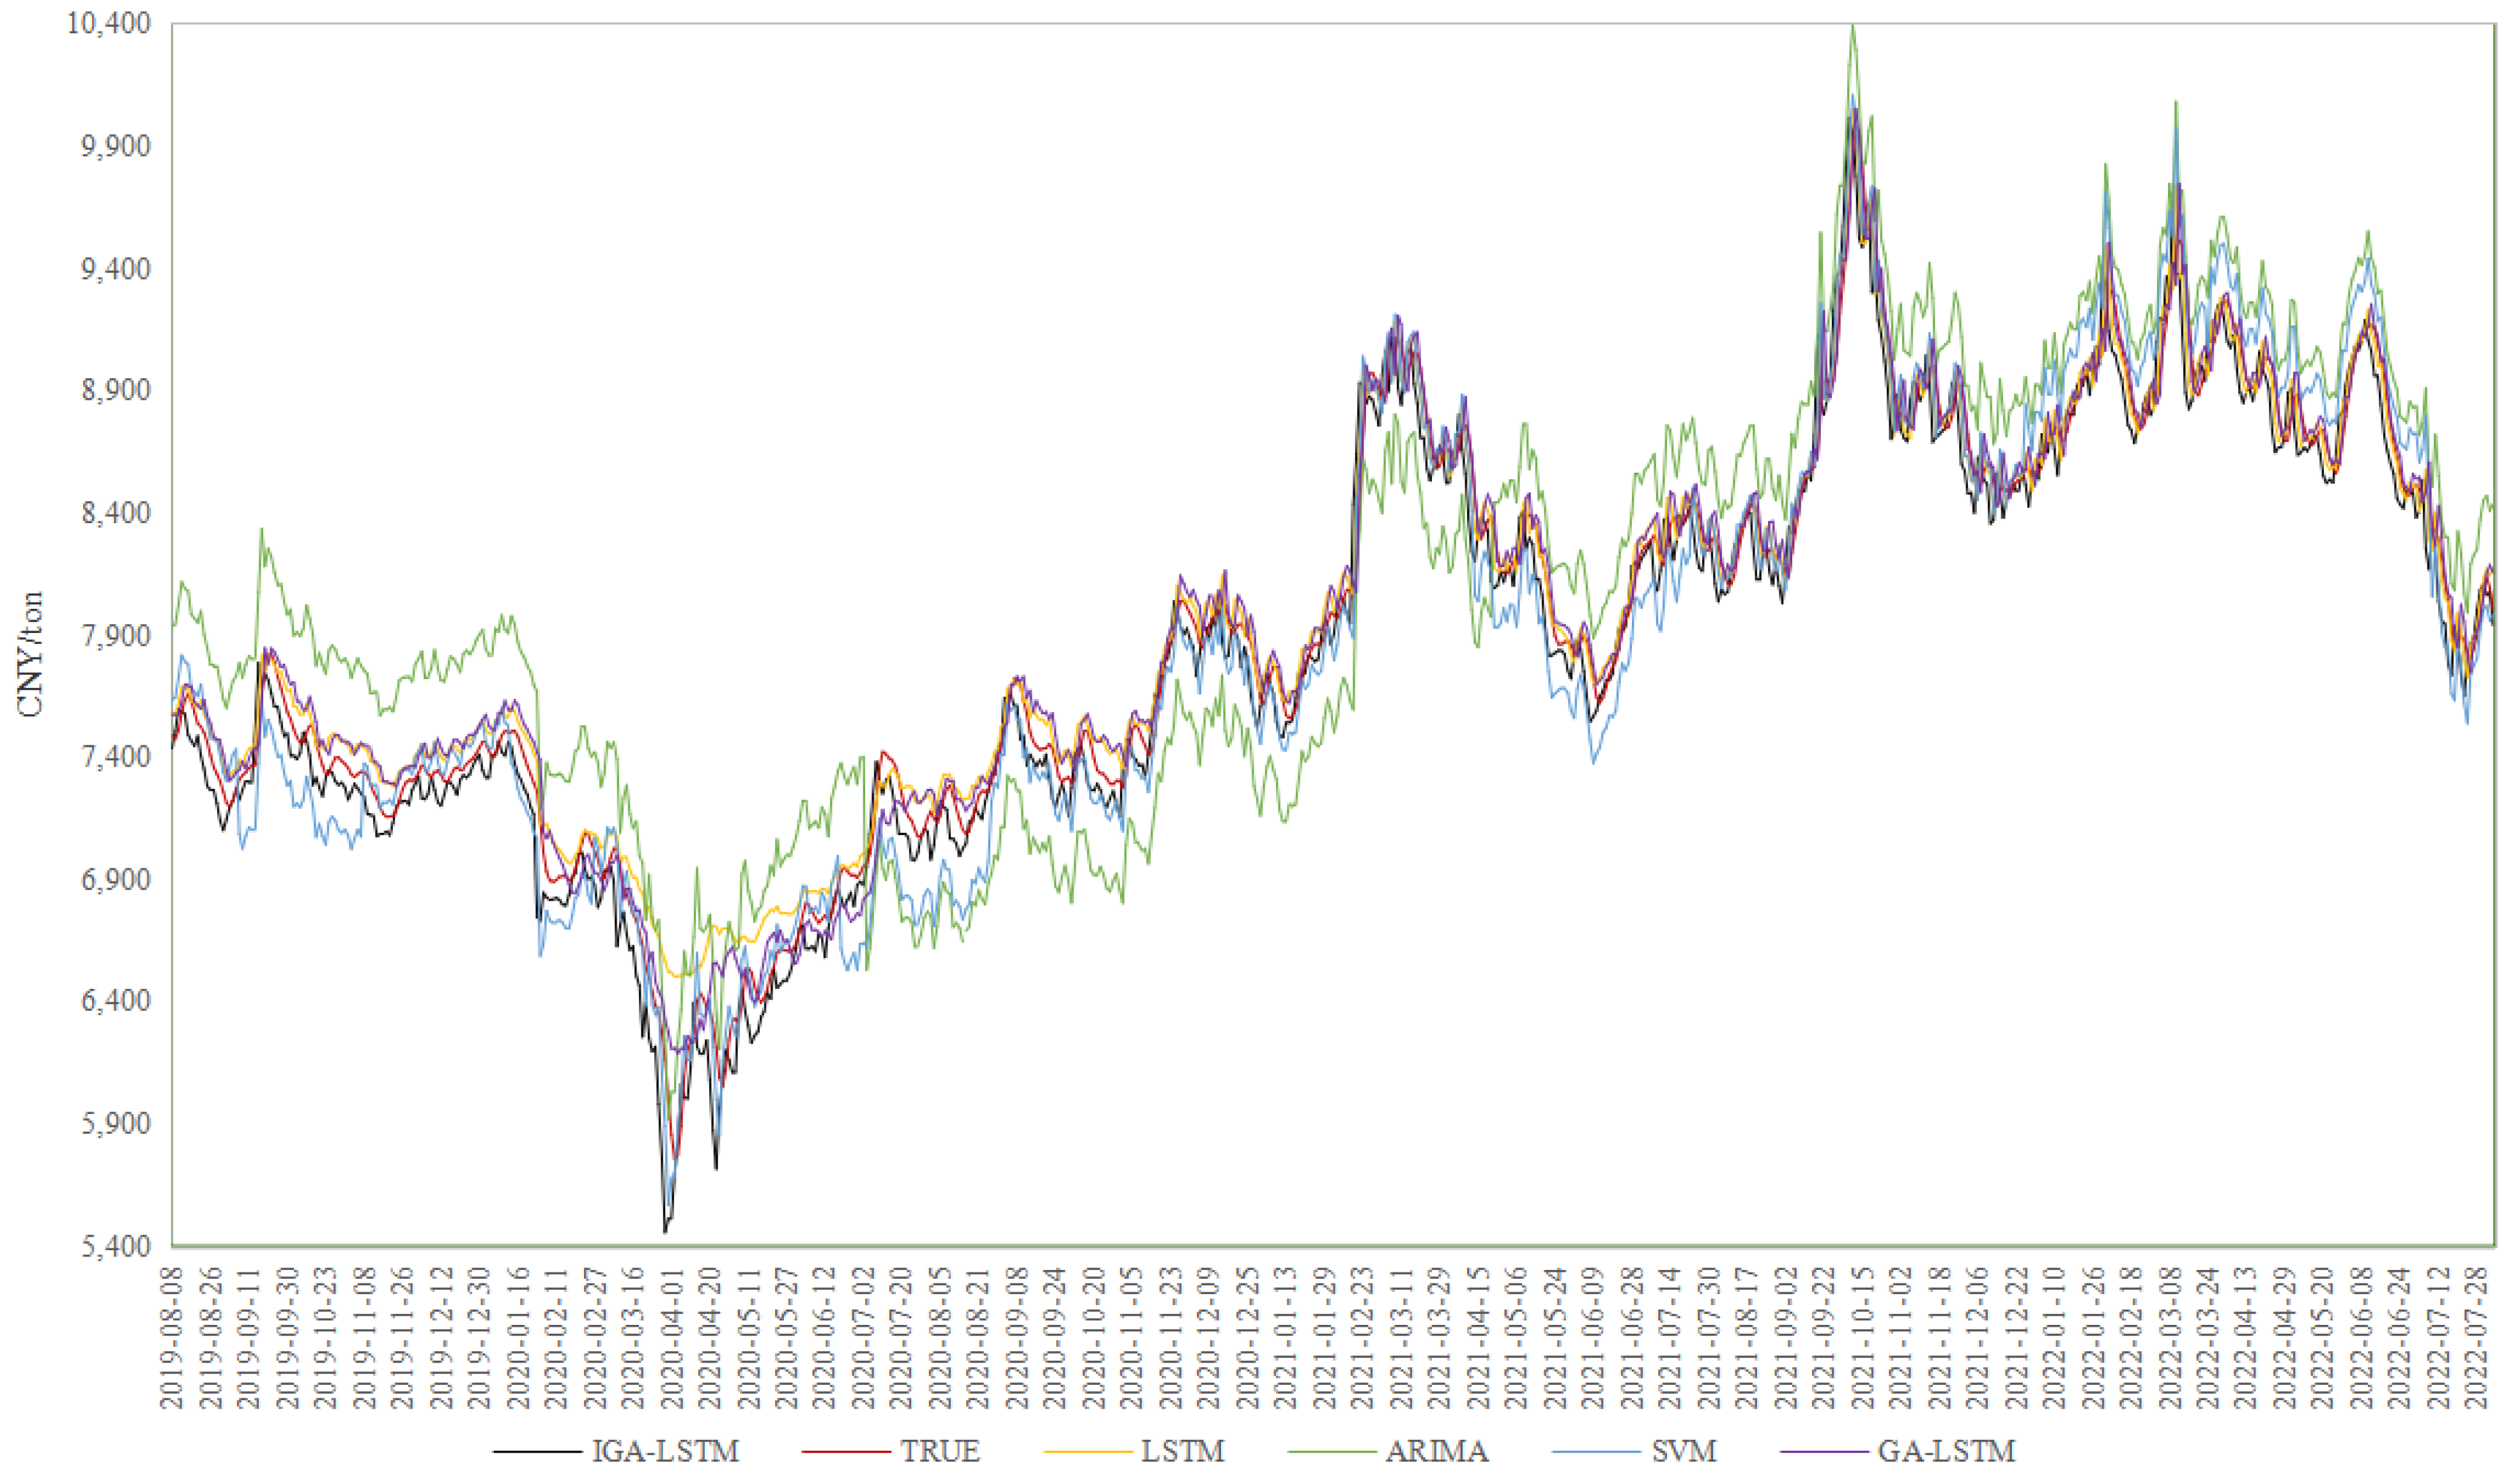
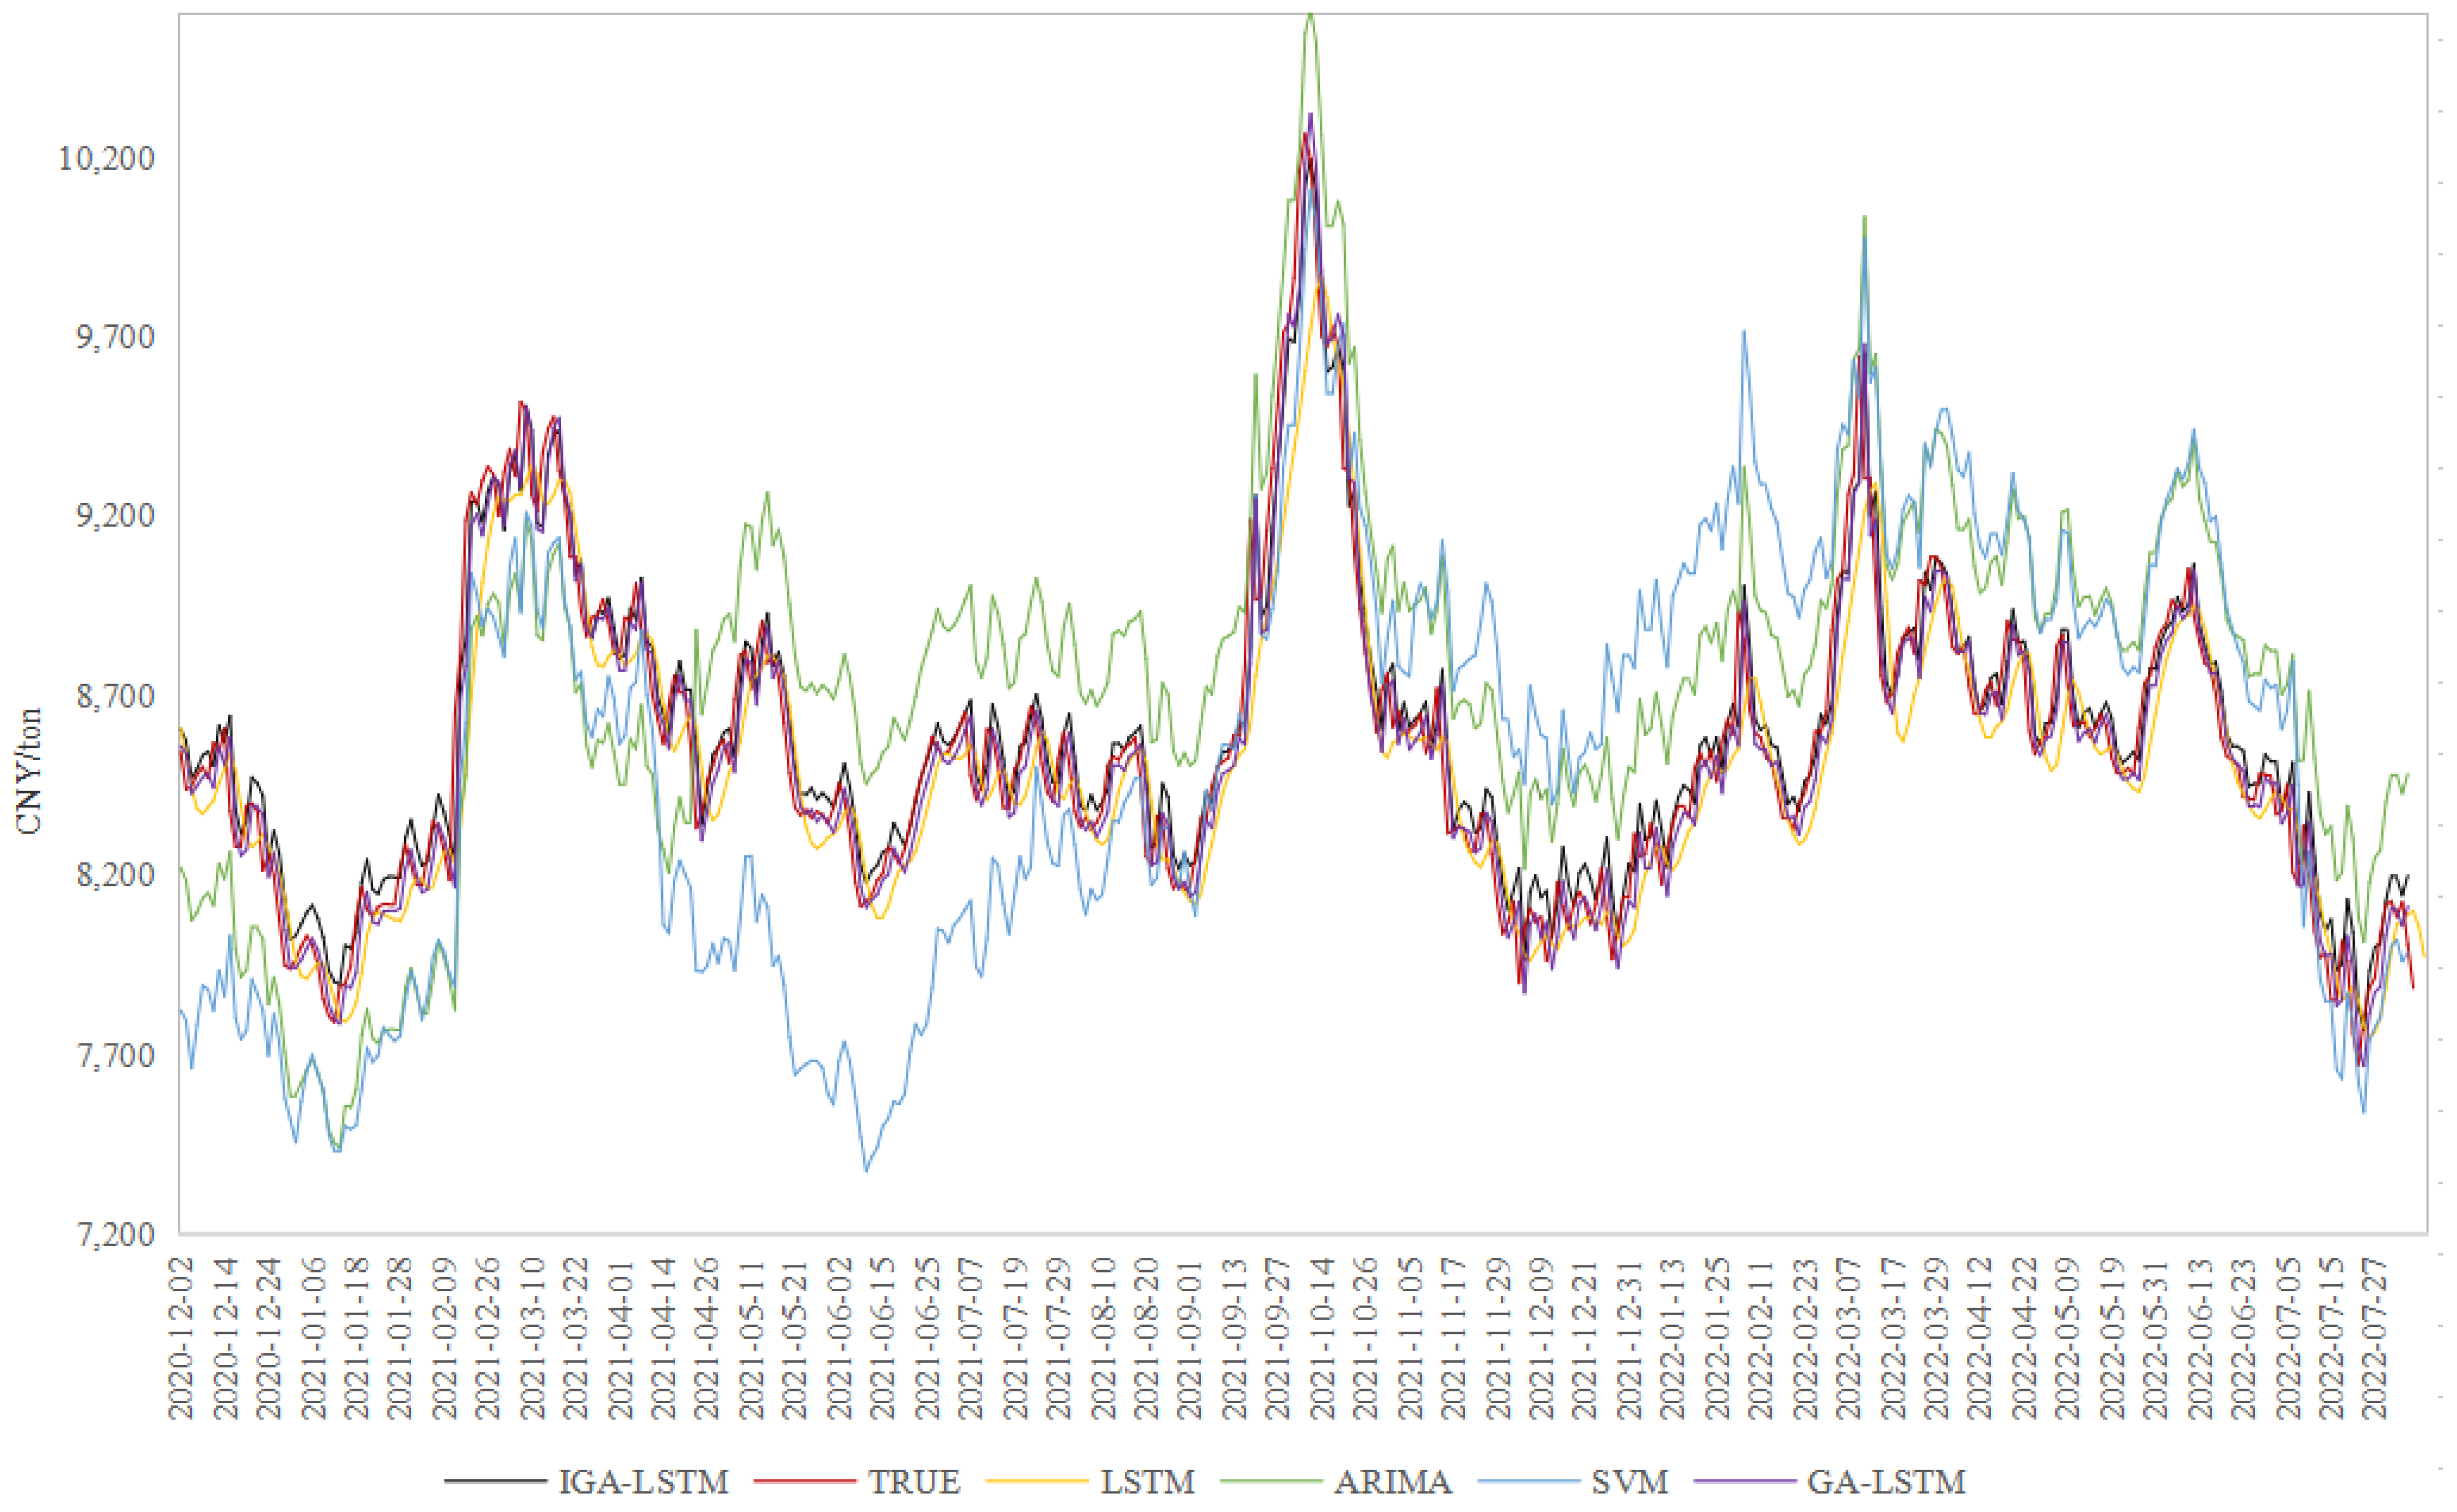
The experimental results are shown in Figure 3, Figure 4 and Figure 5. From the trend change and coincidence degree of the prediction line and real line of the five models, the trend of the prediction line of the five models is basically consistent with the real line. However, there are some differences in the fitting effect. For the LLDPE price prediction models, the ARIMA model has a poor fitting effect, while the other four models can better fit the real data. For the PP price prediction model, the prediction values of the ARIMA and SVM models have a large deviation from the real values, and the fitting effect is poor, while the prediction performances of the three LSTM neural network models are significantly better. In general, LSTM neural network performs better at sudden changes in the chemical futures price, with rapid trend change capability, strong model adaptability, and higher prediction accuracy. Especially, compared with GA-LSTM, the MSE, RMSE, and MAPE results of IGA-LSTM decrease by 0.0001, 0.002, and 0.002, respectively, indicating that the prediction results of the IGA-LSTM model are closer to the true value. The prediction performance of the IGA-LSTM model is enhanced slightly after improving the genetic algorithm.

5. Conclusions

To enhance the research and judgment on the price trends of domestic chemical products and improve the accuracy of forecasting the chemical product price, the LSTM neural network is selected as the prediction model in this paper, and the key parameters of the neural network are optimized by the improved genetic algorithm. Through data processing and algorithm model experiments, our conclusions are obtained as follows:
(1) The genetic algorithm has a good global searching ability and can be applied to optimize the key parameters of the neural network. However, its local searching ability is relatively poor, with low searching efficiency at the later stage of evolution, while premature convergence easily occurs in practical applications. Therefore, for the premature problem, it is necessary to improve the algorithm to strengthen the efficiency and accuracy of the neural network parameter optimization process;
(2) The IGA-LSTM optimized by the improved genetic algorithm overcomes the training shortcomings of traditional gradient descent methods. Although the superiority of the algorithm proposed is sometimes limited, it still shows good performance in the futures price prediction of two chemical products. Furthermore, based on the error indicators of MSE, RMSE, and MAPE, the prediction results of the IGA-LSTM model are better than that of the LSTM model without optimization and the GA-LSTM model without improvement, showing higher prediction accuracy.
The experimental results show that the IGA-LSTM model has a certain application value in the futures price prediction of chemical products. For complex time-series forecasting with high noise, dynamics, non-linearity, and other issues, the LSTM neural network shows higher forecasting accuracy. With the improved genetic algorithm, the important parameters of the LSTM model can be optimized and the influence of human factors can be reduced. Then, the ability of the model to capture the characteristics and trends of time-series changes can be effectively improved. Although this paper only forecasts the short-term prices of chemical futures, the algorithm can also be applied to other research on financial time-series forecasting. Based on the current work, further research can be carried out: First, to improve the algorithm performance, the number of hidden layers can be increased to check the application effect of a multi-hidden-layer LSTM network structure or to seek a more effective parameter optimization algorithm. Second, data-driven technology can be employed to build the model on historical data. If the market changes dramatically in the future, the prediction accuracy may decrease. In this circumstance, the extracted key features and elements can be applied to the price prediction method.

Author Contributions

Y.L. performed the data analyses and wrote the manuscript. Y.T. participated in literature search and conceived and designed the manuscript. Q.Z. contributed to the conception of the study. J.D. helped perform the analysis with constructive discussions. All authors have read and agreed to the published version of the manuscript.

Funding

This research received no external funding.

Institutional Review Board Statement

Not applicable.

Informed Consent Statement

Not applicable.

Data Availability Statement

Corresponding authors may be contacted if necessary.

Conflicts of Interest

The authors declare no conflict of interest.

Abbreviations

GAGenetic Algorithm
LSTMLong Short-Term Memory
IGAImproved genetic algorithm
MAPEMean absolute percentage error
RMSERoot-mean-square deviation
MSEMean squared error
PPPolyethylene and polypropylene
RNNRecurrent Neural Network
TBSMTraffic burst-sensitive model
CSRCorporate social responsibility
SOEsState-owned companies

References

  1. Abualigah, L.; Almotairi, K.H. Dynamic evolutionary data and text document clustering approach using improved Aquila optimizer based arithmetic optimization algorithm and differential evolution. Neural Comput. Appl. 2022, 34, 20939–20971. [Google Scholar] [CrossRef]
  2. El Bakrawy, L.M.; Bailek, N.; Abualigah, L.; Urooj, S.; Desuky, A.S. Feature Selection Based on Mud Ring Algorithm for Improving Survival Prediction of Children Undergoing Hematopoietic Stem-Cell Transplantation. Mathematics 2022, 10, 4197. [Google Scholar] [CrossRef]
  3. Zhang, X.; Zhong, C.; Abualigah, L. Foreign exchange forecasting and portfolio optimization strategy based on hybrid-molecular differential evolution algorithms. Soft Computing. 2022, 1–19. [Google Scholar] [CrossRef] [PubMed]
  4. Agushaka, J.O.; Ezugwu, A.E.; Abualigah, L. Gazelle Optimization Algorithm: A novel nature-inspired metaheuristic optimizer. Neural Comput. Appl. 2022, 1–33. [Google Scholar] [CrossRef]
  5. Hassan, M.; Su, L. International evidence on crude oil price dynamics: Applications of ARIMA-GARCH models. Energy Econ. 2010, 32, 1001–1008. [Google Scholar]
  6. Zhang, Y.-J.; Yao, T.; He, L.Y.; Ripple, R. Volatility forecasting of crude oil market: Can the regime switching GARCH model beat the single-regime GARCH models? Int. Rev. Econ. Financ. 2019, 59, 302–317. [Google Scholar] [CrossRef]
  7. Peter, J.K.; Mosler, K. Can Markov regime-switching models improve power-price forecasts? Evidence from German daily power prices. Appl. Energy 2005, 83, 943–958. [Google Scholar]
  8. Yanhui, C.; Zou, Y. Examination on the relationship between OVX and crude oil price with Kalman filter. Procedia Comput. Sci. 2015, 55, 1359–1365. [Google Scholar]
  9. Zheng, W.; Tian, X.; Yang, B.; Liu, S.; Ding, Y.; Tian, J.; Yin, L. A few shot classification methods based on multiscale relational networks. Appl. Sci. 2022, 12, 4059. [Google Scholar] [CrossRef]
  10. Lean, Y.; Wang, S.; Lai, K.K. Forecasting crude oil price with an EMD-based neural network ensemble learning paradigm. Energy Econ. 2008, 30, 2623–2635. [Google Scholar]
  11. Ying, S.; Gao, Y. An improved hybrid algorithm based on PSO and BP for stock price forecasting. Open Cybern. Syst. J. 2015, 9, 2565–2568. [Google Scholar]
  12. Sepp, H.; Schmidhuber, J. Long short-term memory. Neural Comput. 1997, 9, 1735–1780. [Google Scholar]
  13. Liu, K.; Zhou, J.; Dong, D. Improving stock price prediction using the long short-term memory model combined with online social networks. J. Behav. Exp. Financ. 2021, 30, 100507. [Google Scholar] [CrossRef]
  14. Thomas, F.; Krauss, C. Deep learning with long short-term memory networks for financial market predictions. Eur. J. Oper. Res. 2018, 270, 654–669. [Google Scholar]
  15. Katoch, S.; Chauhan, S.S.; Kumar, V. A review on genetic algorithm: Past, present, and future. Multimed. Tools Appl. 2020, 80, 8091–8126. [Google Scholar] [CrossRef]
  16. Ewees, A.A.; Al-qaness, M.A.; Abualigah, L.; Abd Elaziz, M. HBO-LSTM: Optimized long short term memory with heap-based optimizer for wind power forecasting. Energy Convers. Manag. 2022, 268, 116022. [Google Scholar] [CrossRef]
  17. Alkhatib, K.; Khazaleh, H.; Alkhazaleh, H.A.; Alsoud, A.R.; Abualigah, L. A New Stock Price Forecasting Method Using Active Deep Learning Approach. J. Open Innov. Technol. Mark. Complex. 2022, 8, 96. [Google Scholar] [CrossRef]
  18. Alkhatib, K.; Almahmood, M.; Elayan, O.; Abualigah, L. Regional analytics and forecasting for most affected stock markets: The case of GCC stock markets during COVID-19 pandemic. Int. J. Syst. Assur. Eng. Manag. 2022, 13, 1298–1308. [Google Scholar] [CrossRef]
  19. Ren, Y.; Jiang, H.; Ji, N.; Yu, H. TBSM: A traffic burst-sensitive model for short-term prediction under special events. Knowl.-Based Syst. 2022, 240, 108120. [Google Scholar] [CrossRef]
  20. Huang, S.; Liu, H. Impact of COVID-19 on stock price crash risk: Evidence from Chinese energy firms. Energy Econ. 2021, 101, 105431. [Google Scholar] [CrossRef]
  21. Giuliano, A.; Marchesi, M.; Murru, A. A hybrid genetic-neural architecture for stock indexes forecasting. Inf. Sci. 2005, 170, 3–33. [Google Scholar]
  22. Ivan, S.; Vesely, V. Robust output feedback controller design: Genetic algorithm approach. IMA J. Math. Control Inf. 2018, 3, 257–265. [Google Scholar]
  23. Mirjalili, S. Genetic algorithm. In Evolutionary Algorithms and Neural Networks; Springer: Cham, Switzerland, 2019; pp. 43–55. [Google Scholar]
  24. Forrest, S. Genetic algorithms. Acm Comput. Surv. (CSUR) 1996, 28, 77–80. [Google Scholar] [CrossRef]
Figure 1. IGA−LSTM Model Prediction Framework.
Processes 11 00238 g001
Figure 2. LSTM Model.
Processes 11 00238 g002
Figure 3. Change trend of fitness under different progeny.
Processes 11 00238 g003
Figure 4. LLDPE futures price forecast results.
Processes 11 00238 g004
Figure 5. PP futures price forecast results.
Processes 11 00238 g005
Table 1. Benchmark functions.
NameFunctionSeachGlodal Optimum
f 1 f ( x ) = i = 1 D i x i 4 + r a n d ( 0 , 1 ) [ 100 , 100 ] 0
f 2 f ( x ) = i = 1 D ( x i 1 ) 2 [ 100 , 100 ] 0
f 3 f ( x ) = i = 1 D x i 2 + ( i = 1 D 0.5 i x i ) 2 + ( i = 1 D 0.5 i x i ) 4 [ 5 , 10 ] 0
f 4 f ( x ) = s i n 2 ( π x 1 ) + i = 1 D ( x i 1 ) [ 1 + 10 s i n 2 ( π x i 1 ) ] +
( x D 1 ) 2 [ 1 + s i n 2 ( 2 π x N ) ] [ 10 , 10 ] 0
f 5 f ( x ) = 20 e x p ( 0.2 1 D i = 1 D x i 2 )
e x p ( 0.2 1 D i = 1 D cos 2 π x i ) + 20 e [ 32 , 32 ] 0
f 6 f ( x ) = i = 1 D ( x i 2 10 cos 2 π x i + 10 ) [ 5.12 , 5.12 ] 0
Table 2. Best value different of test functions about six algorithms.
Best Value
FunctionIGAGAPSOSSAFA
f1 5.06 × 10 5 1.16 × 10 5 6.08 × 10 4 5.15 × 10 4 8.76 × 10 4
f2 6.78 × 10 5 7.42 × 10 5 3.21 × 10 4 1.12 × 10 4 6.83 × 10 5
f3 5.61 × 10 5 7.13 × 10 4 5.0 × 10 3 5.08 × 10 4 1.34 × 10 4
f4 1.27 × 10 2 1.45 × 10 0 8.76 × 10 1 1.22 × 10 0 2.69 × 10 0
f5 8.63 × 10 2 1.24 × 10 1 2.79 × 10 1 7.35 × 10 0 1.44 × 10 1
f6 1.02 × 10 1 1.44 × 10 2 1.62 × 10 1 1.32 × 10 2 1.34 × 10 0
Table 3. Worst value different of test functions about six algorithms.
Mean
FunctionIGAGAPSOSSAFA
f1 2.26 × 10 4 6.07 × 10 4 3.28 × 10 4 3.00 × 10 3 5.02 × 10 4
f2 1.79 × 10 4 4.63 × 10 4 6.21 × 10 3 3.00 × 10 3 3.49 × 10 4
f3 2.98 × 10 4 1.62 × 10 3 8.92 × 10 3 4.61 × 10 3 7.05 × 10 4
f4 2.57 × 10 3 2.35 × 10 0 0 1.48 × 10 0 2.38 × 10 0 4.79 × 10 0
f5 1.48 × 10 1 1.43 × 10 1 3.4 × 10 0 9.24 × 10 0 1.72 × 10 1
f6 2.02 × 10 1 1.61 × 10 2 5.08 × 10 1 1.46 × 10 2 1.53 × 10 0
Table 4. Mean different of test functions about six algorithms.
Worst Value
FunctionIGAGAPSOSSAFA
f1 7.17 × 10 4 6.0 × 10 4 3.66 × 10 3 2.48 × 10 3 9.63 × 10 4
f2 3.0 × 10 4 7.7 × 10 4 8.71 × 10 3 6.91 × 10 3 9.53 × 10 4
f3 5.26 × 10 4 2.59 × 10 3 1.28 × 10 2 1.09 × 10 2 7.05 × 10 4
f4 3.67 × 10 0 5.99 × 10 0 1.04 × 10 1 6.79 × 10 0 7.68 × 10 0
f5 1.35 × 10 1 1.73 × 10 1 8.19 × 10 0 1.0 × 10 1 1.62 × 10 1
f6 1.18 × 10 1 2.31 × 10 2 1.72 × 10 2 2.31 × 10 2 2.03 × 10 0
Table 5. SD different of test functions about six algorithms.
SD
FunctionIGAGAPSOSSAFA
f1 1.39 × 10 4 3.79 × 10 4 2.44 × 10 4 6.13 × 10 3 8.75 × 10 4
f2 8.65 × 10 5 2.57 × 10 4 4.29 × 10 3 2.39 × 10 3 3.44 × 10 4
f3 1.74 × 10 4 7.50 × 10 4 4.77 × 10 3 3.67 × 10 3 2.08 × 10 4
f4 1.30 × 10 0 3.46 × 10 0 2.89 × 10 0 2.78 × 10 0 3.89 × 10 0
f5 8.12 × 10 3 1.12 × 10 0 2.13 × 10 0 7.20 × 10 1 1.14 × 10 0
f6 1.20 × 10 2 3.48 × 10 1 6.11 × 10 1 1.66 × 10 1 6.30 × 10 2
Table 6. Linear low-density polyethylene results.
ARIMASVMLSTMGA-LSTMIGA-LSTM
MSE0.007230.001750.010140.003310.00107
RMSE0.085020.041860.10070.057570.03268
MAPE0.171270.104510.245770.142120.0961
Table 7. Polyethylene and polypropylene results.
ARIMASVMLSTMGA-LSTMIGA-LSTM
MSE0.008850.01940.002550.000990.00088
RMSE0.094120.13930.05050.031580.02979
MAPE0.259630.313950.097740.061370.05969
Disclaimer/Publisher’s Note: The statements, opinions and data contained in all publications are solely those of the individual author(s) and contributor(s) and not of MDPI and/or the editor(s). MDPI and/or the editor(s) disclaim responsibility for any injury to people or property resulting from any ideas, methods, instructions or products referred to in the content.

