1. Introduction
According to the World Health Organization (WHO), more than 6.6 million cumulative confirmed deaths were registered due to COVID-19 by the end of December 2022, caused by the viral agent SARS-CoV-2, a new coronavirus discovered in China at the end of 2019 [
1]. Up to now, more than 12 billion vaccine doses have already been applied to the global population. However, individual and community contamination still requires monitoring, as the isolation of infected patients reduces the disease’s spread, along with restriction policies for public spaces [
2]. This is even more relevant when new variants are detected [
3]. Low-cost and easy-to-use tests are essential to monitoring the progress of contamination, especially deeming that about 25% of the infected patients are asymptomatic [
4]. Immunological assays, such as Enzyme-Linked Immunosorbent Assay (ELISA) tests, are commonly used to detect SARS-CoV-2 virus antigens, and the viral RNA is typically detected by Reverse Transcription Polymerase Chain Reaction (RT-PCR) tests [
1].
Kulkarni et al. [
2] discussed several papers focused on detecting both IgG and IgM (immunoglobulin isotypes) anti-SARS-CoV-2 using ELISA tests. Other studies commenting on the same work reinforced the IgG antibody detection relevance, as IgM antibodies are more difficult to detect in recent infections. ELISA tests typically present high performance, with over 80% sensitivity and over 99% specificity [
5]. Low-cost alternatives for ELISA tests were the focus of Alvim et al. [
6], targeting applications in remote locations and low-income countries. The tests were estimated to cost about USD 1 each, mainly due to simplifications in the sampling process. Alvim et al. [
7] also developed a methodology for cost reduction, but focusing on producing a SARS-COV-2 spike protein to be used in an ELISA test, achieving 98.6% specificity and 95% sensitivity for 11+ days after symptoms’ onset.
RT-PCR tests are one of the most-common approaches to performing COVID-19 diagnosis [
2], considered by the WHO to be the “golden standard” [
8]. However, they are highly dependent on the sampling technique and timing. The detection range of viral RNA is much smaller, as it depends on active infections [
4]. Despite high specificity and sensitivity, RT-PCR does not completely exclude false negatives due to a mismatch between primers, probes, and the target sequence. Incorrect sampling procedures may also lead to false negatives [
8]. Another application for ELISA tests is monitoring the immune response generated after vaccination [
9].
Another methodology being developed for low-cost testing is the Lateral Flow Immunoassay (LFIA) [
10]. Using data from the Brazilian public health system, de Assis et al. [
11] found that ELISA tests were more sensitive and cost-effective for high COVID-19 prevalence than LFIA, while LFIA had better specificity and was more cost-effective for low COVID-19 prevalence. There are works focusing on developing more sensitive and accurate LFIA tests, with Guo et al. [
12] giving a good review. Other common tests are the chemiluminescence immunoassay and immunofluorescence assay [
13], but since these are more expensive, they are not evaluated here.
A comparison between methodologies is hard because the results depend on the test’s brand, whether patients show symptoms or not, and the inclusion of a relevant control group from patients with non–SARS-CoV-2 respiratory infections, among other factors [
14]. Gong et al. [
13] and Mohit et al. [
14] found significant variance in performance in papers studying different tests. de Assis et al. [
11] compared several ELISA and LFIA tests simultaneously with similar study and control groups. Their results are summarized in
Table 1.
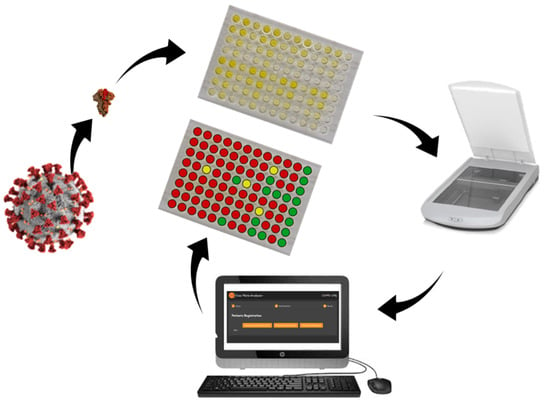
Therefore, this work focuses on developing less-expensive ways to apply the ELISA test to detect IgG anti-SARS-CoV-2 antibodies, using alternative methods of image capturing, which eliminate the need for a spectrophotometer. In addition, an open-source software was developed to analyze the images and print reports with the diagnosis of each sample.
2. Materials and Methods
Human plasma samples originally obtained from the Rio de Janeiro State Hematology Institute (HEMORIO) to carry out the studies described in Alvim et al. [
7] were used in the current work to perform the ELISA assays and to compare readouts obtained by an absorbance plate reader and by regular image scanners. Samples were collected at the HEMORIO following a protocol approved by the local ethics committee (CEP HEMORIO; Approval #4008095).
We collected images from several experiments carried out by the Cell Culture Engineering Laboratory (LECC/COPPE/UFRJ) and correlated them with the absorbance read by the spectrophotometer. The images of most ELISA plates were digitized by a Canon CanoScan LiDE 300 table scanner with 200 dpi resolution. They were preprocessed using Hue, Saturation, Value (HSV) transformation and analyzing which value better correlated with the absorbance.
HSV transformation translates the digital image from an Red, Green, Blue (RGB) space to an HSV space. Images are usually represented as three-dimensional matrices, with one dimension being the height of the picture, another being the width, and the third dimension being the intensity of the primary colors on each pixel. Since the color of a test is rarely a pure primary color, the analysis of the RGB space would be limited or overly complex. The transformation decomposes the images into more usable information. Hue is interpreted as which color an image is; value is how bright an image is. saturation is how colorful an image is [
15]. As in chemical tests, the color becomes stronger the higher the concentration of the compound of interest, using saturation makes sense.
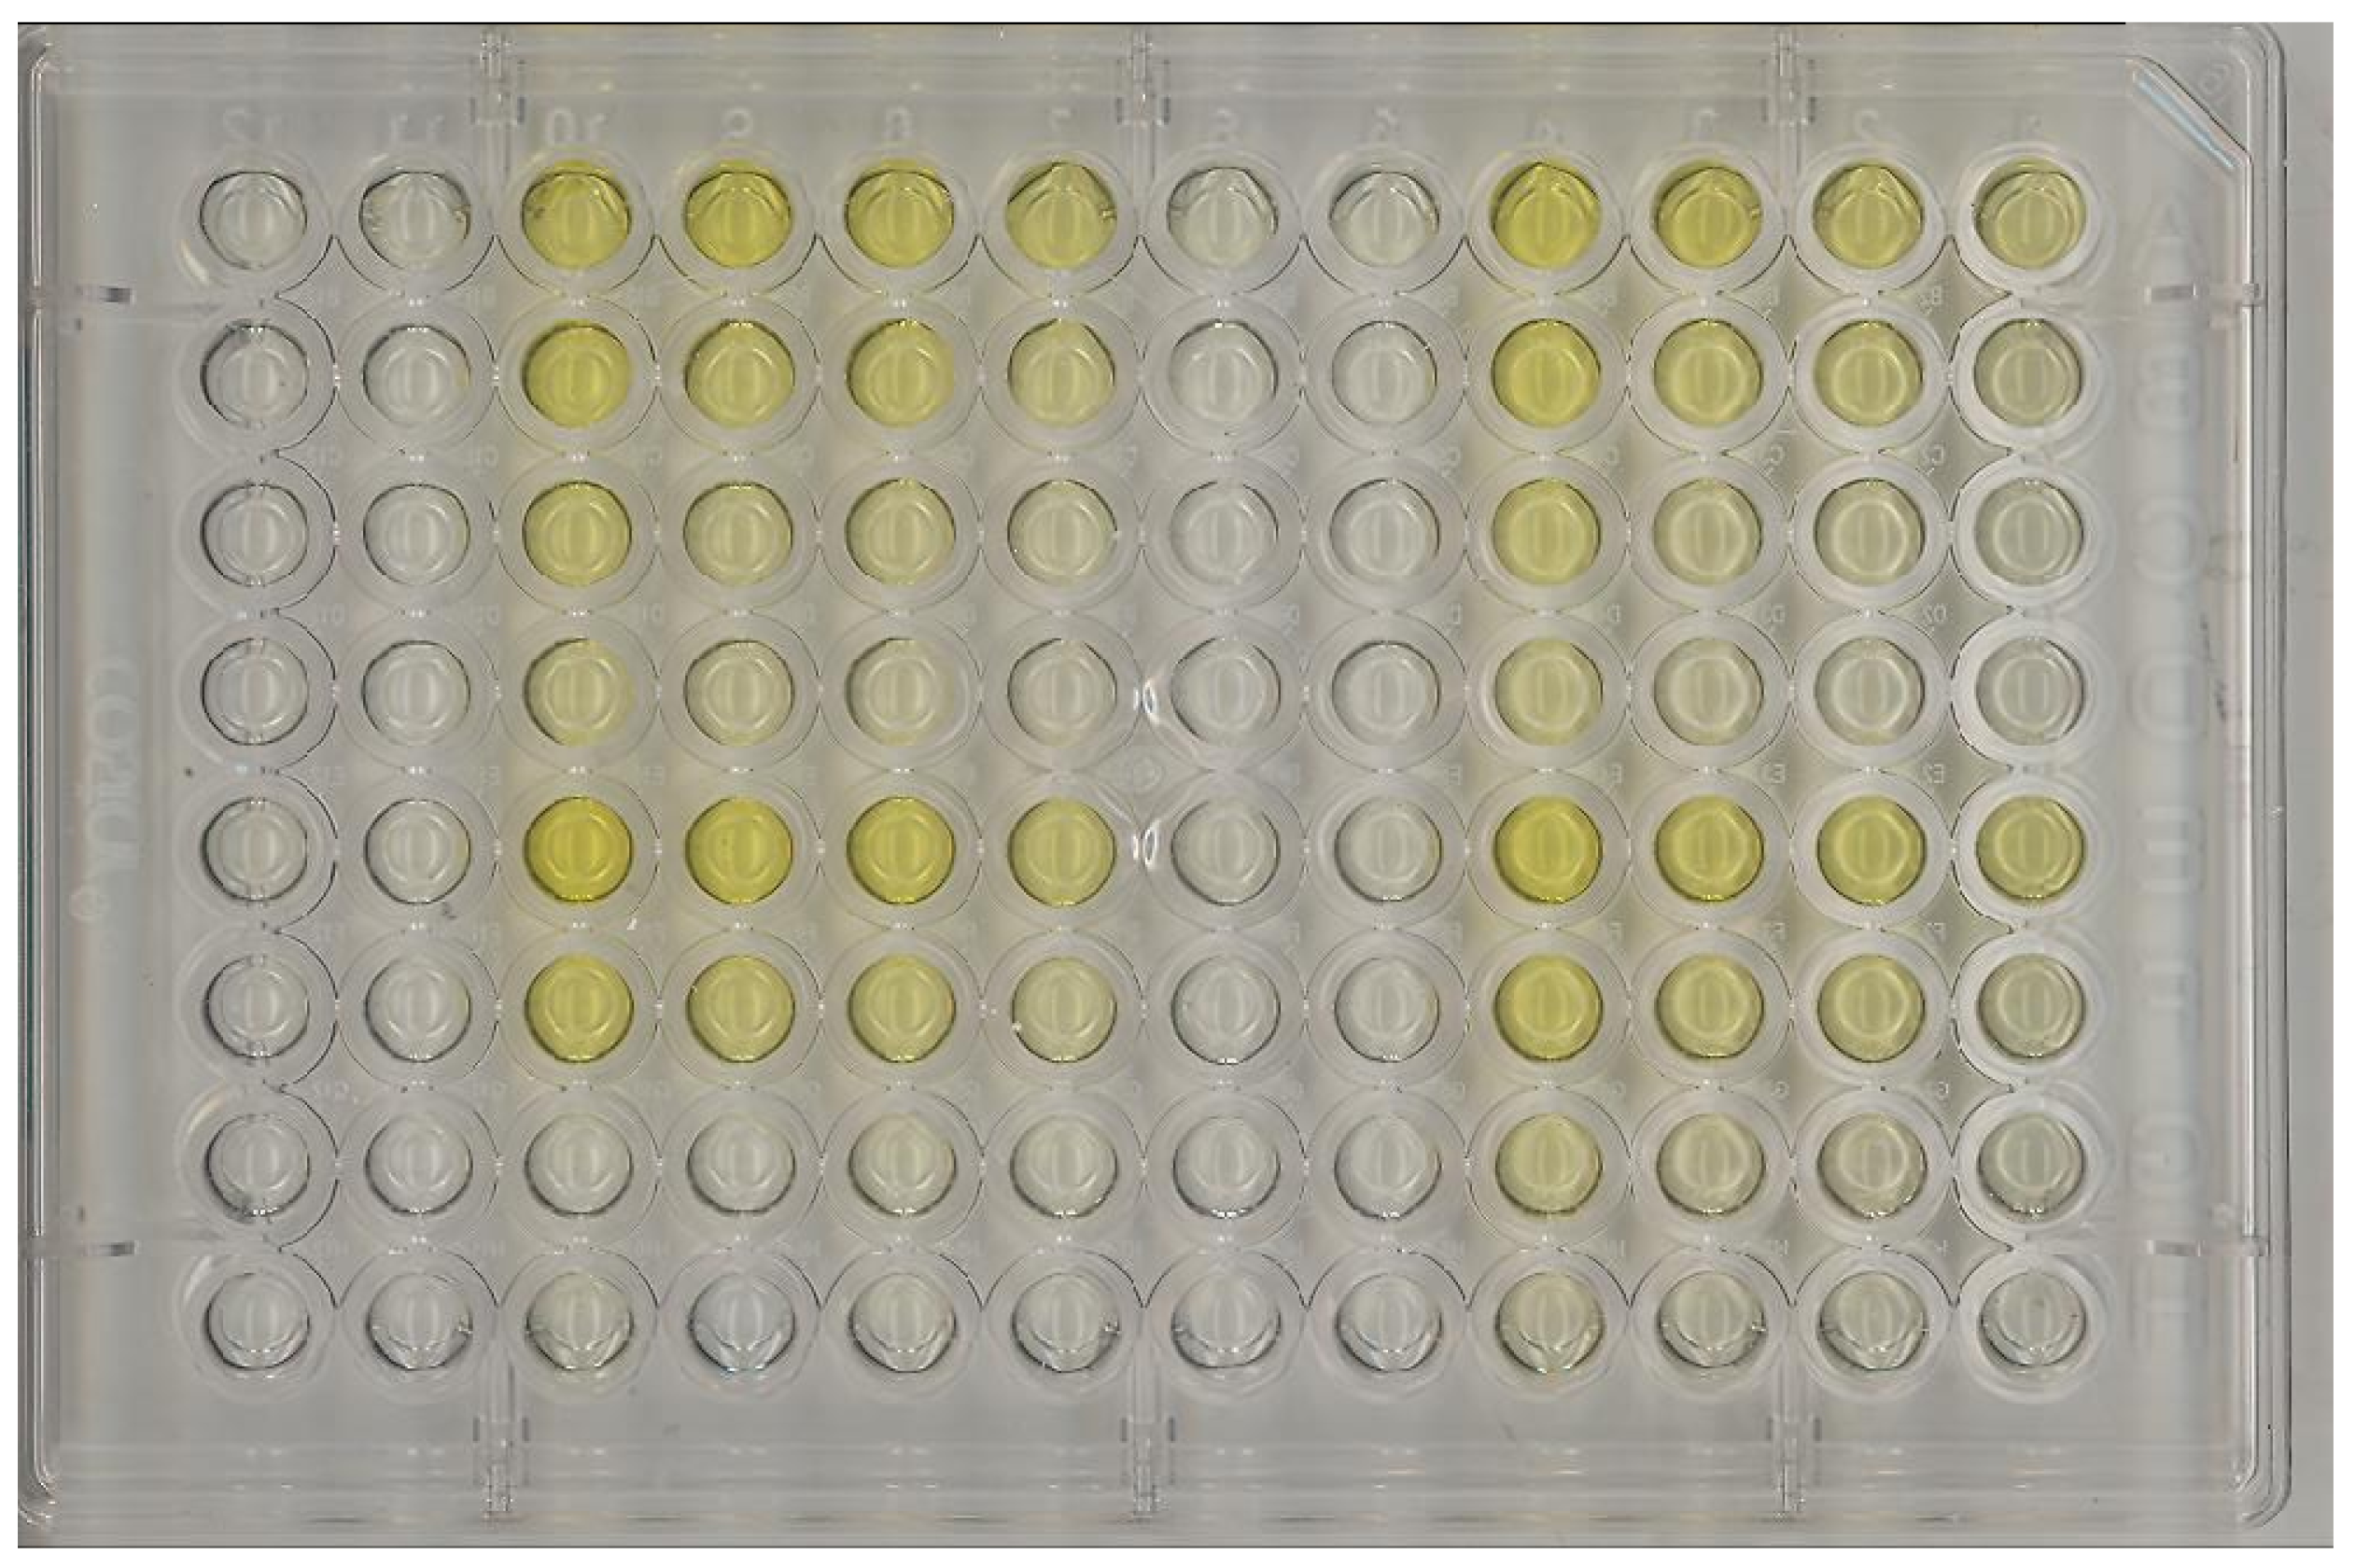
The ELISA test’s final stage applies 50 L of a 1N HCl solution to stop the reaction and turns the sample from a blue to a yellow color. There is no universal standard as to how much time it should taken before stopping the reaction. Some labs use a fixed time, such as 15 min, while others wait until the positive standard sample turns into a suitable color. This added variance to the system prevents calculating a fixed threshold value.
The plates used were high-binding ELISA Corning 96-well microplates. The spectrophotometer used for comparison with the developed methodology was a BioRad microplate reader, read at 450 nm with 655 nm background compensation. A total of three scanners were used, a Canon CanoScan LiDE 300, an HP Multifunctional Advantage 3776 printer, and an HP Scanjet G2410 scanner. The scanner used to collect most of the images was the Canon CanoScan LiDE 300. In order to verify the influence of the scanner device, the HP Multifunctional Advantage 3776 printer and the HP Scanjet G2410 scanner were used to collect the images of ELISA Plate Number 9, labeled as Images 9-1 and 9-2.
The ELISA test is threshold-based. The threshold is based on known negative samples of each plate, as it can vary depending on the steps taken during the test preparation. The mean and standard deviation of the absorbance of known negative samples were calculated, and with those, two thresholds were determined according to Equations (
1) and (
2).
where
and
are the first and second thresholds, respectively,
is the mean, and
is the standard deviation. If the sample’s absorbance is below the first threshold, the sample is classified as negative; above the first threshold and below the second one, the sample is classified as unknown. If above the second threshold, it is classified as positive.
There are two available plates to run the ELISA test, one with a white framing and one with a transparent framing. The white framing plate is more expensive, but it allows for easier detection of the samples and has less noise. Transparent framing plates suffer the effects of shadows and background noise. As this work focused on cost reduction, most analyses were performed on transparent plates. A total of 12 plates were used for evaluating the correlation between absorbance and saturation, resulting in 1152 samples. Of the 12 plates, 8 had samples with a known status of COVID-19 infection obtained by RT-PCR; therefore, 768 samples were used to compare the methodologies.
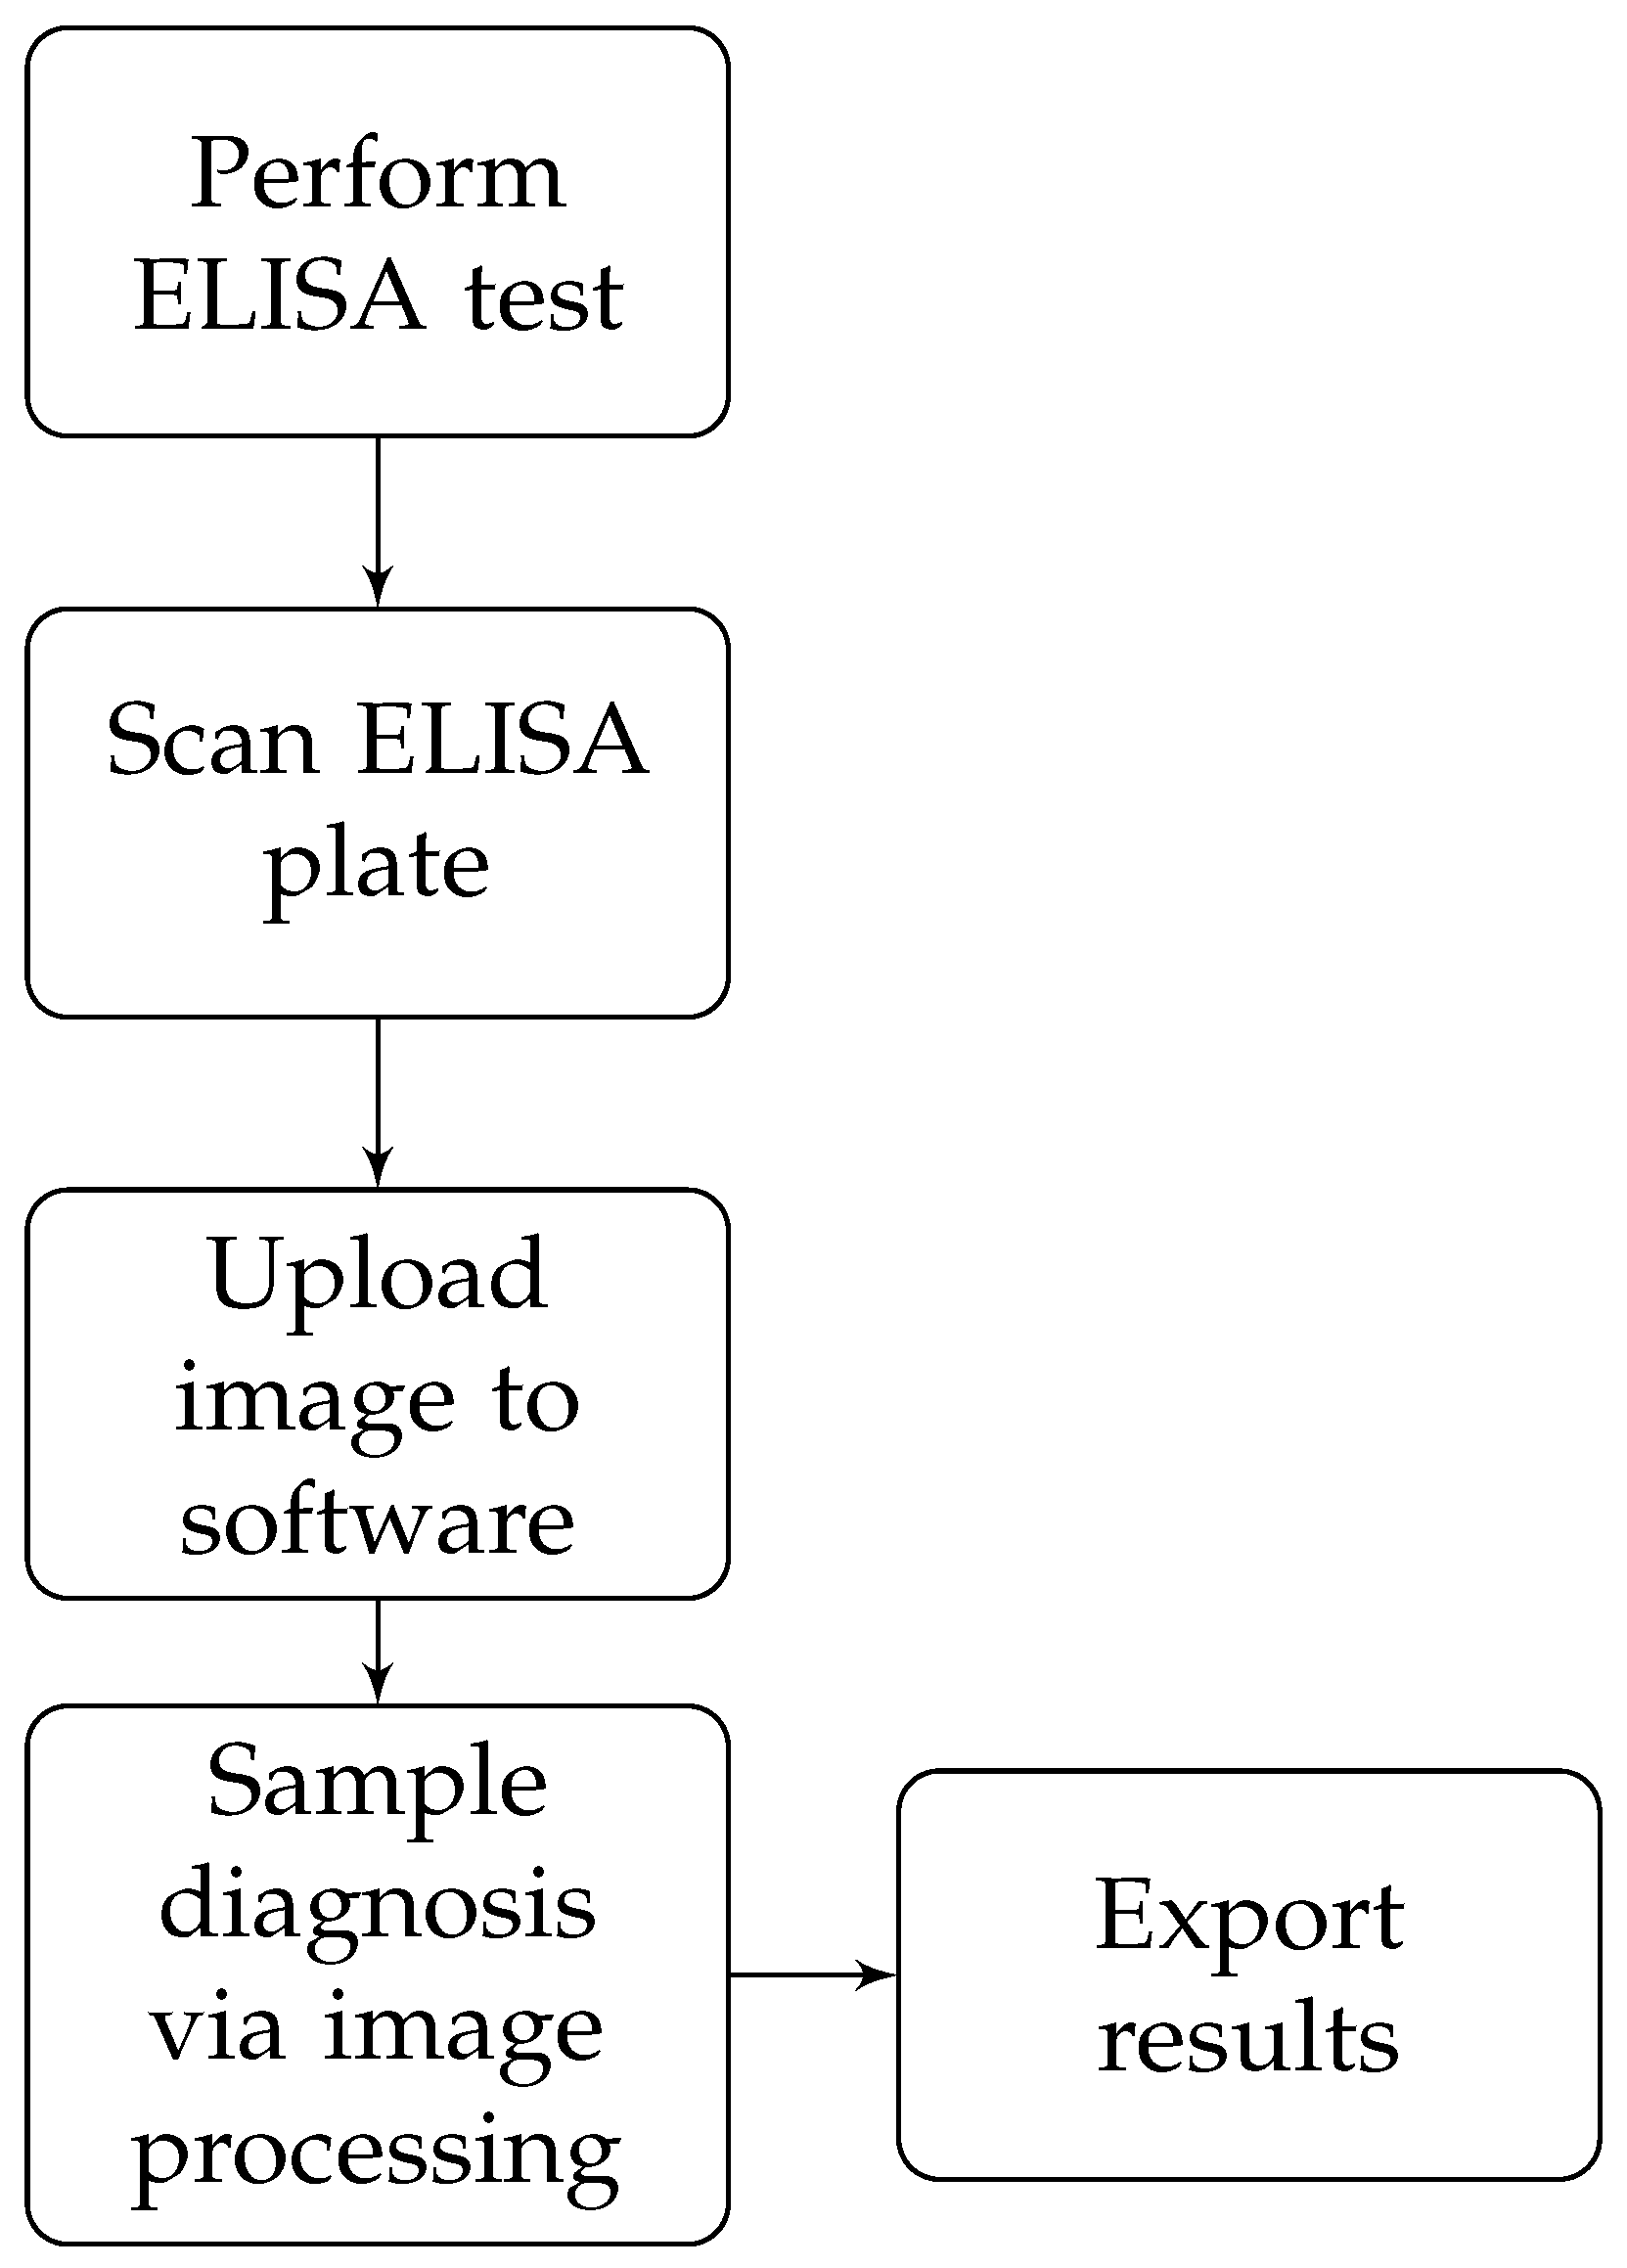
The proposed methodology is summarized in
Figure 1.
The new methodology was compared with the regular spectrophotometer methodology using accuracy, sensitivity, and specificity as the metrics. Accuracy is how many samples the method correctly predicts, divided by how many samples exist. Sensitivity is how many true positives are diagnosed, divided by how many samples are positive. It indicates the probability of a positive test given the individual has COVID-19. Specificity is the number of diagnosed as true negatives divided by the number of negatives in the dataset. It indicates the probability of a negative test given the individual does not have COVID-19.
3. Results and Discussion
By transforming the scanned image from an RGB space to an HSV space, we found a strong correlation of saturation with the absorbance, while the hue and value showed no correlation, as can be seen in
Figure 2 and
Figure 3.
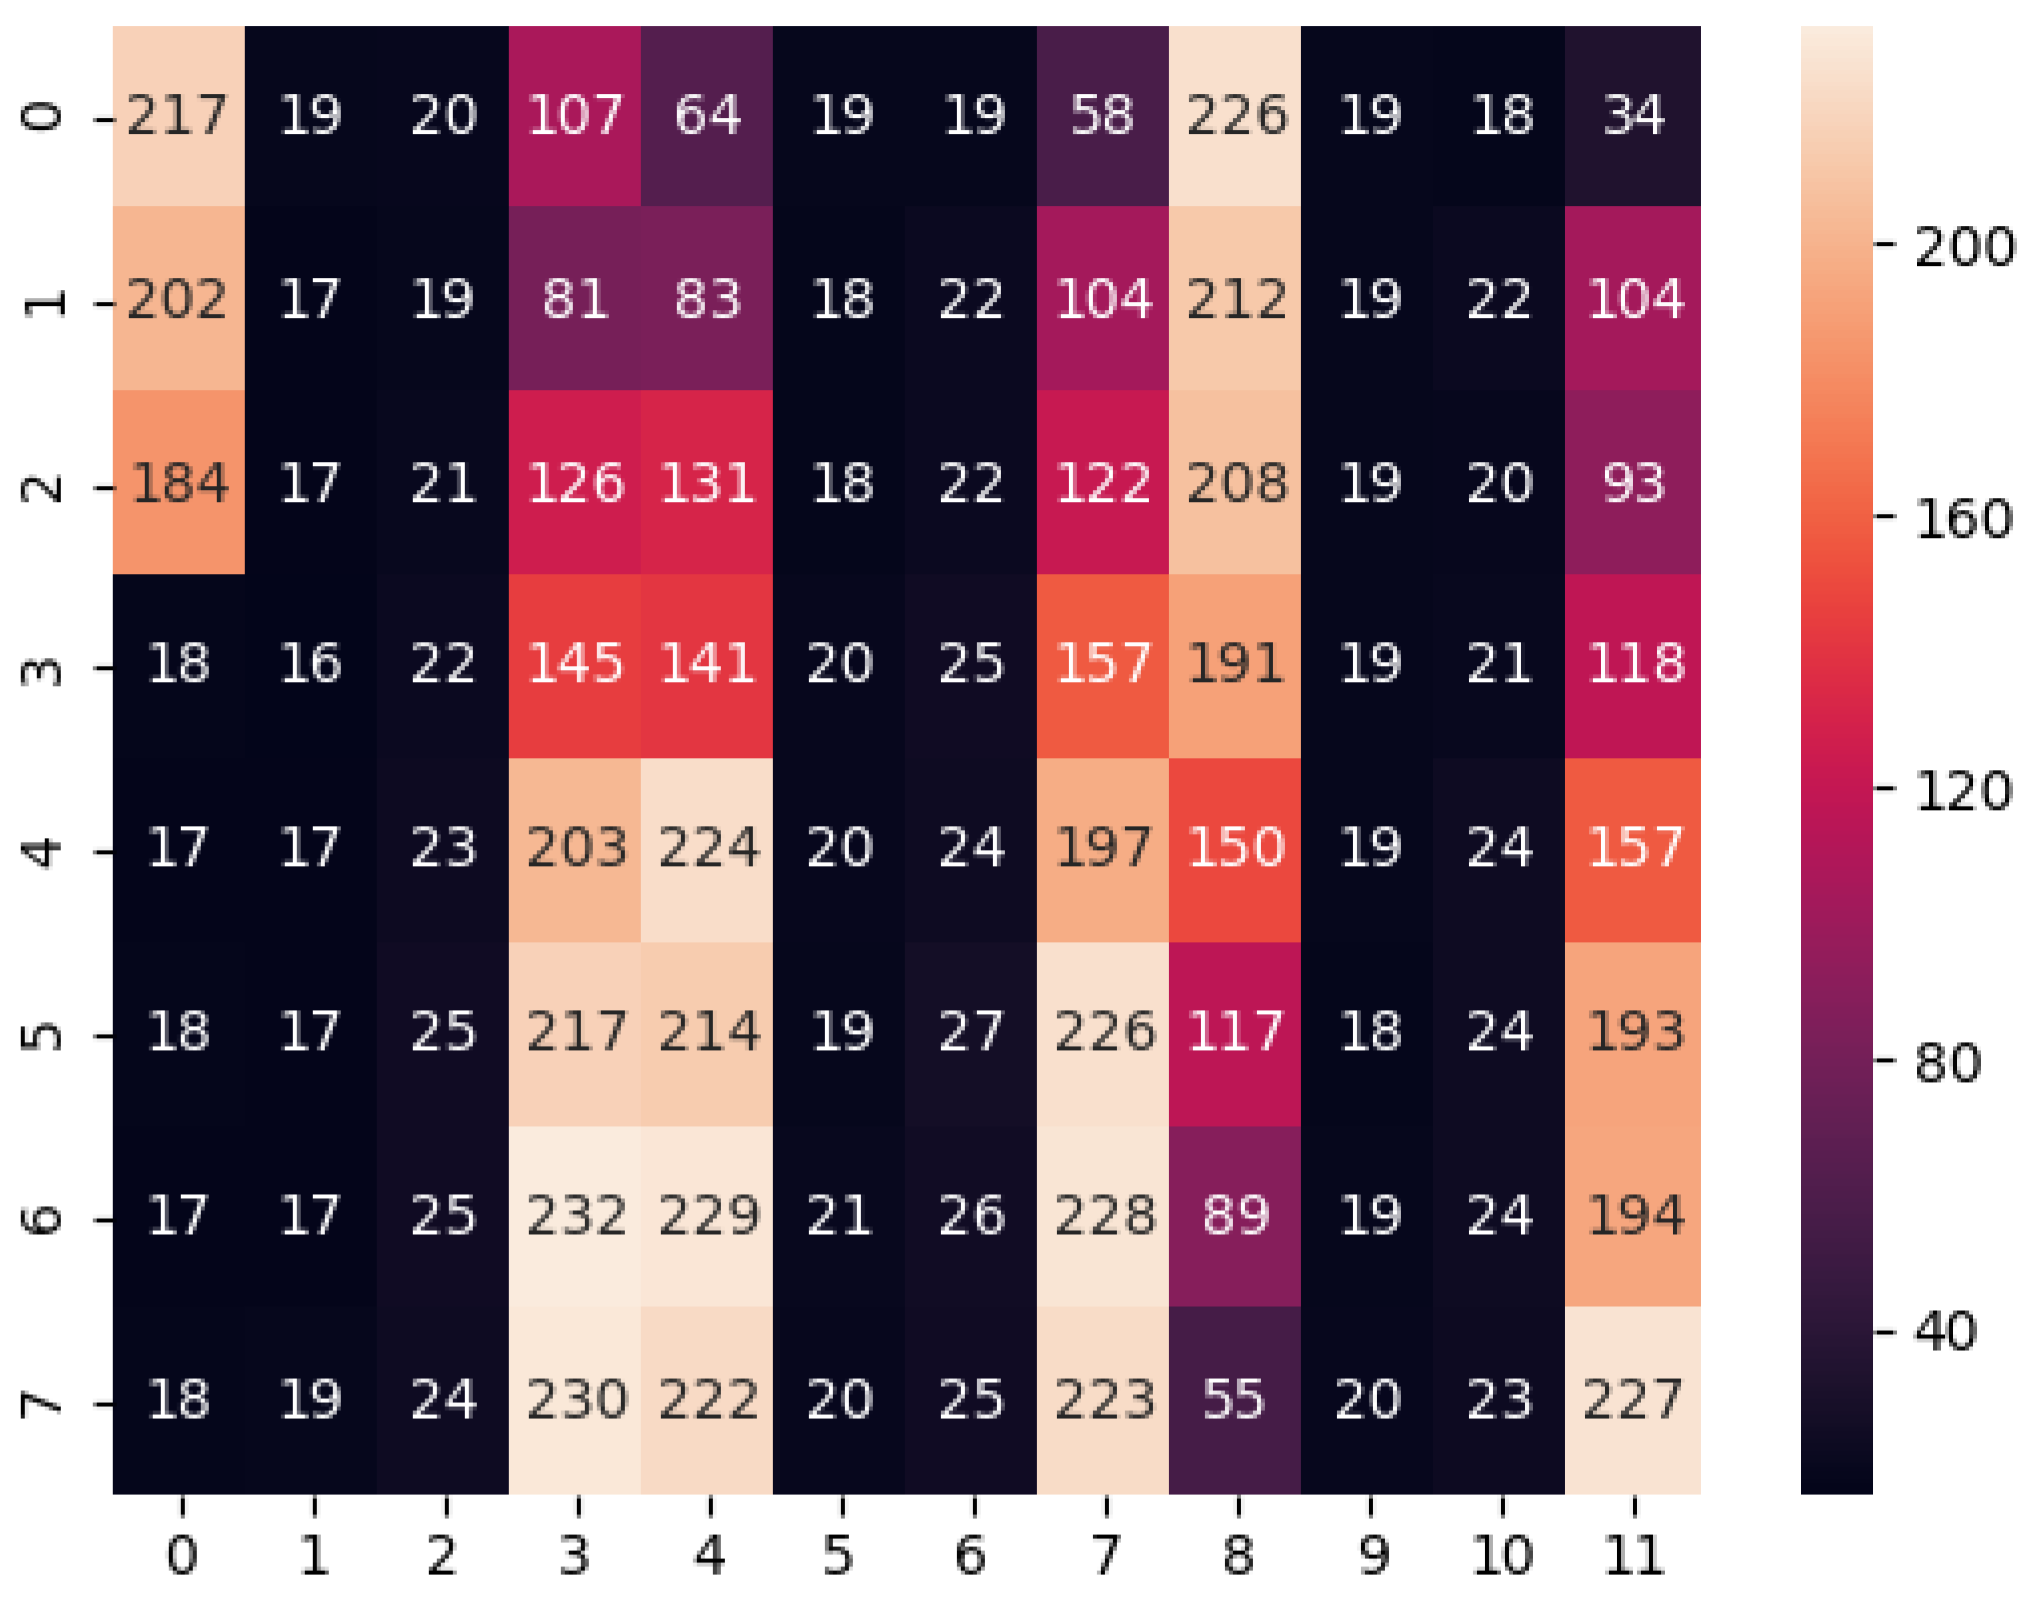
The absorbance of each sample was measured using a spectrophotometer. The saturation of each sample was calculated by taking the saturation of each pixel of the image of each sample and taking the median absorbance. The median was chosen because the distribution of the saturation is skewed and, if the image is not properly aligned, some pixels from the border may be counted as a sample, as can be seen in the histogram of
Figure 4. The median is robust to these kinds of outliers.
The yellow color saturation correlates quadratically with the absorbance, as can be seen in
Figure 5, while for the blue color, the absorbance correlates linearly, as shown in
Figure 6. The test can be performed with either color without significant loss of accuracy, but we suggest the yellow color to better align with existing procedures. As the HSV transformation separates the color from its colorfulness, the methodology applies to different test colors. The analysis was performed with 5 different plates showing that the
between absorbance and the square of saturation was consistently above 90%, as seen in
Table 2. It should be noted that Plates a and b are duplicates of each other and were run on different days.
As can be seen in
Figure 2, shadows and colors pass from one sample to its neighbors depending on the orientation of the light source, but this does not affect the image to the point of generating wrong results. As can be seen in
Figure 7, there is a small increase in the saturation of the negative samples on the left side of strongly saturated samples, but the increase is not enough to generate false positives.
Another experiment was performed by testing plates from different sources and using different equipment. Images and data from Plates 7 and 8 were offered by a fellow lab at CCS-UFRJ (Center of Health Sciences), while we took different images of Plate 9 with scanners from different brands, an HP Multifunctional Advantage 3776 printer and an HP Scanjet G2410 scanner, marked as 9-1 and 9-2, respectively. As we can see from
Figure 8, all results had a specific correlation between saturation and absorbance. Therefore, we recommend either running a test plate with known negative samples to determine a fixed threshold or using the negative samples in the plate to calculate the threshold.
Overall, the accuracy of the new method was similar to the ELISA test using the spectrophotometer. For these tests, we defined the threshold in terms of the negative samples, given Equations (
1) and (
2). The results in terms of the accuracy of the plates with samples whose status is known are given in
Table 3. As can be seen, the accuracy, sensitivity, and specificity were at the same level as the ELISA test performed with a spectrophotometer.
4. Software Development for Analyzing Images of ELISA Plates
The results of this work were organized as open-source software for easy usage. The proposed software aims to diagnose samples in ELISA plates, hence being a practical alternative to the more expensive method, based on the spectrophotometer.
A relevant requirement was to make the software highly portable, working on any operating system or device. Therefore, we chose to develop a client-side-only web application to reduce operating costs, increase portability, and allow offline execution. If necessary, more advanced features could be included in the inherent client–service communication. We used the programming language ECMAScript [
16] (Javascript), as it is the primary browser language, and its superset Typescript for the Angular web-app framework.
The software functionalities are schematized in
Figure 9, and in the following, the steps depicted in the scheme are further discussed.
The registration of samples in the plate wells could be processed in various ways and depends on the testing lab’s clinical procedures. Therefore, although the developed software could include a database of plates and patients with a user interface for the required forms, we decided to
keep it as simple as possible by receiving the patient registrations as a Comma-Separated Value (CSV) text file. This approach allows the sample registrations to be edited in standard spreadsheet software or supplied by a third-party registration system. Hence, the first step when using the developed software is to supply a CSV text file of sample wells for patient mapping.
Figure 10 shows the user interface for this setup stage. Besides uploading the CSV, one can download a template and a pre-filled CSV file example. The expected fields are sample id, the patient’s first and last name, email, gender, phone number, city, state/province, birth date, address, and the row and column of the sample in the plate. The only mandatory fields are the id, row, and column. The other fields are only used to generate the final diagnosis report.
In the next step, the user uploads the plate image to be analyzed. There is an option to flip the image horizontally, which may be necessary for scanned images. For enhanced well detection, digitally scanned images are preferred, but camera photos could also be used. A scanner is preferable because it reduces variability sources such as shadows or low manual steadiness. Preliminary tests with smartphone cameras resulted in images with heterogeneous quality, presenting shadows in the wells furthest from the center of the plate.
The following step is the well detection. The software allows three methods:
Direct detection: This approach uses the opencv.js Hough Circle detection function [
17], which uses the Hough transform to find circles in a grayscale image. This approach does not require user input on any circle location. However, this method is susceptible to failure because of the variability in the image conditions and plates. This method showed good performance for scanned images of white frame ELISA plates, but it was not accurate for the most frequently used transparent frame ELISA plates because the shadows formed during scanning confuse the detection algorithm.
Two bounding boxes: This method requires the user identification of two wells’ centers and diameters by dragging the circles in the image at the top left and bottom right. This approach makes use of the rectangular arrangement of the wells to locate them. The benefit of this method is its robustness for image quality. It requires the image to be horizontally aligned.
Bounding box rotation: This method is an extension of the above. The method rotates the image before the wells’ detection by including an additional user-defined well located at the bottom right.
Figure 11 and
Figure 12 show the user interface for image uploading with box positioning and the detected wells, respectively. There are advanced options for the direct method for tuning the Hough Circles algorithm of OpenCV [
18].
After the user triggers the wells’ detection, the next stages of sample diagnosis and result generation in
Figure 9 are also executed. Therefore, the calibration settings used in the diagnosis should be defined before the wells’ detection is activated. The diagnostic of each well is performed according to the methods discussed in the previous section. The code is modularized such that other users with different procedures can create different diagnosis methods.
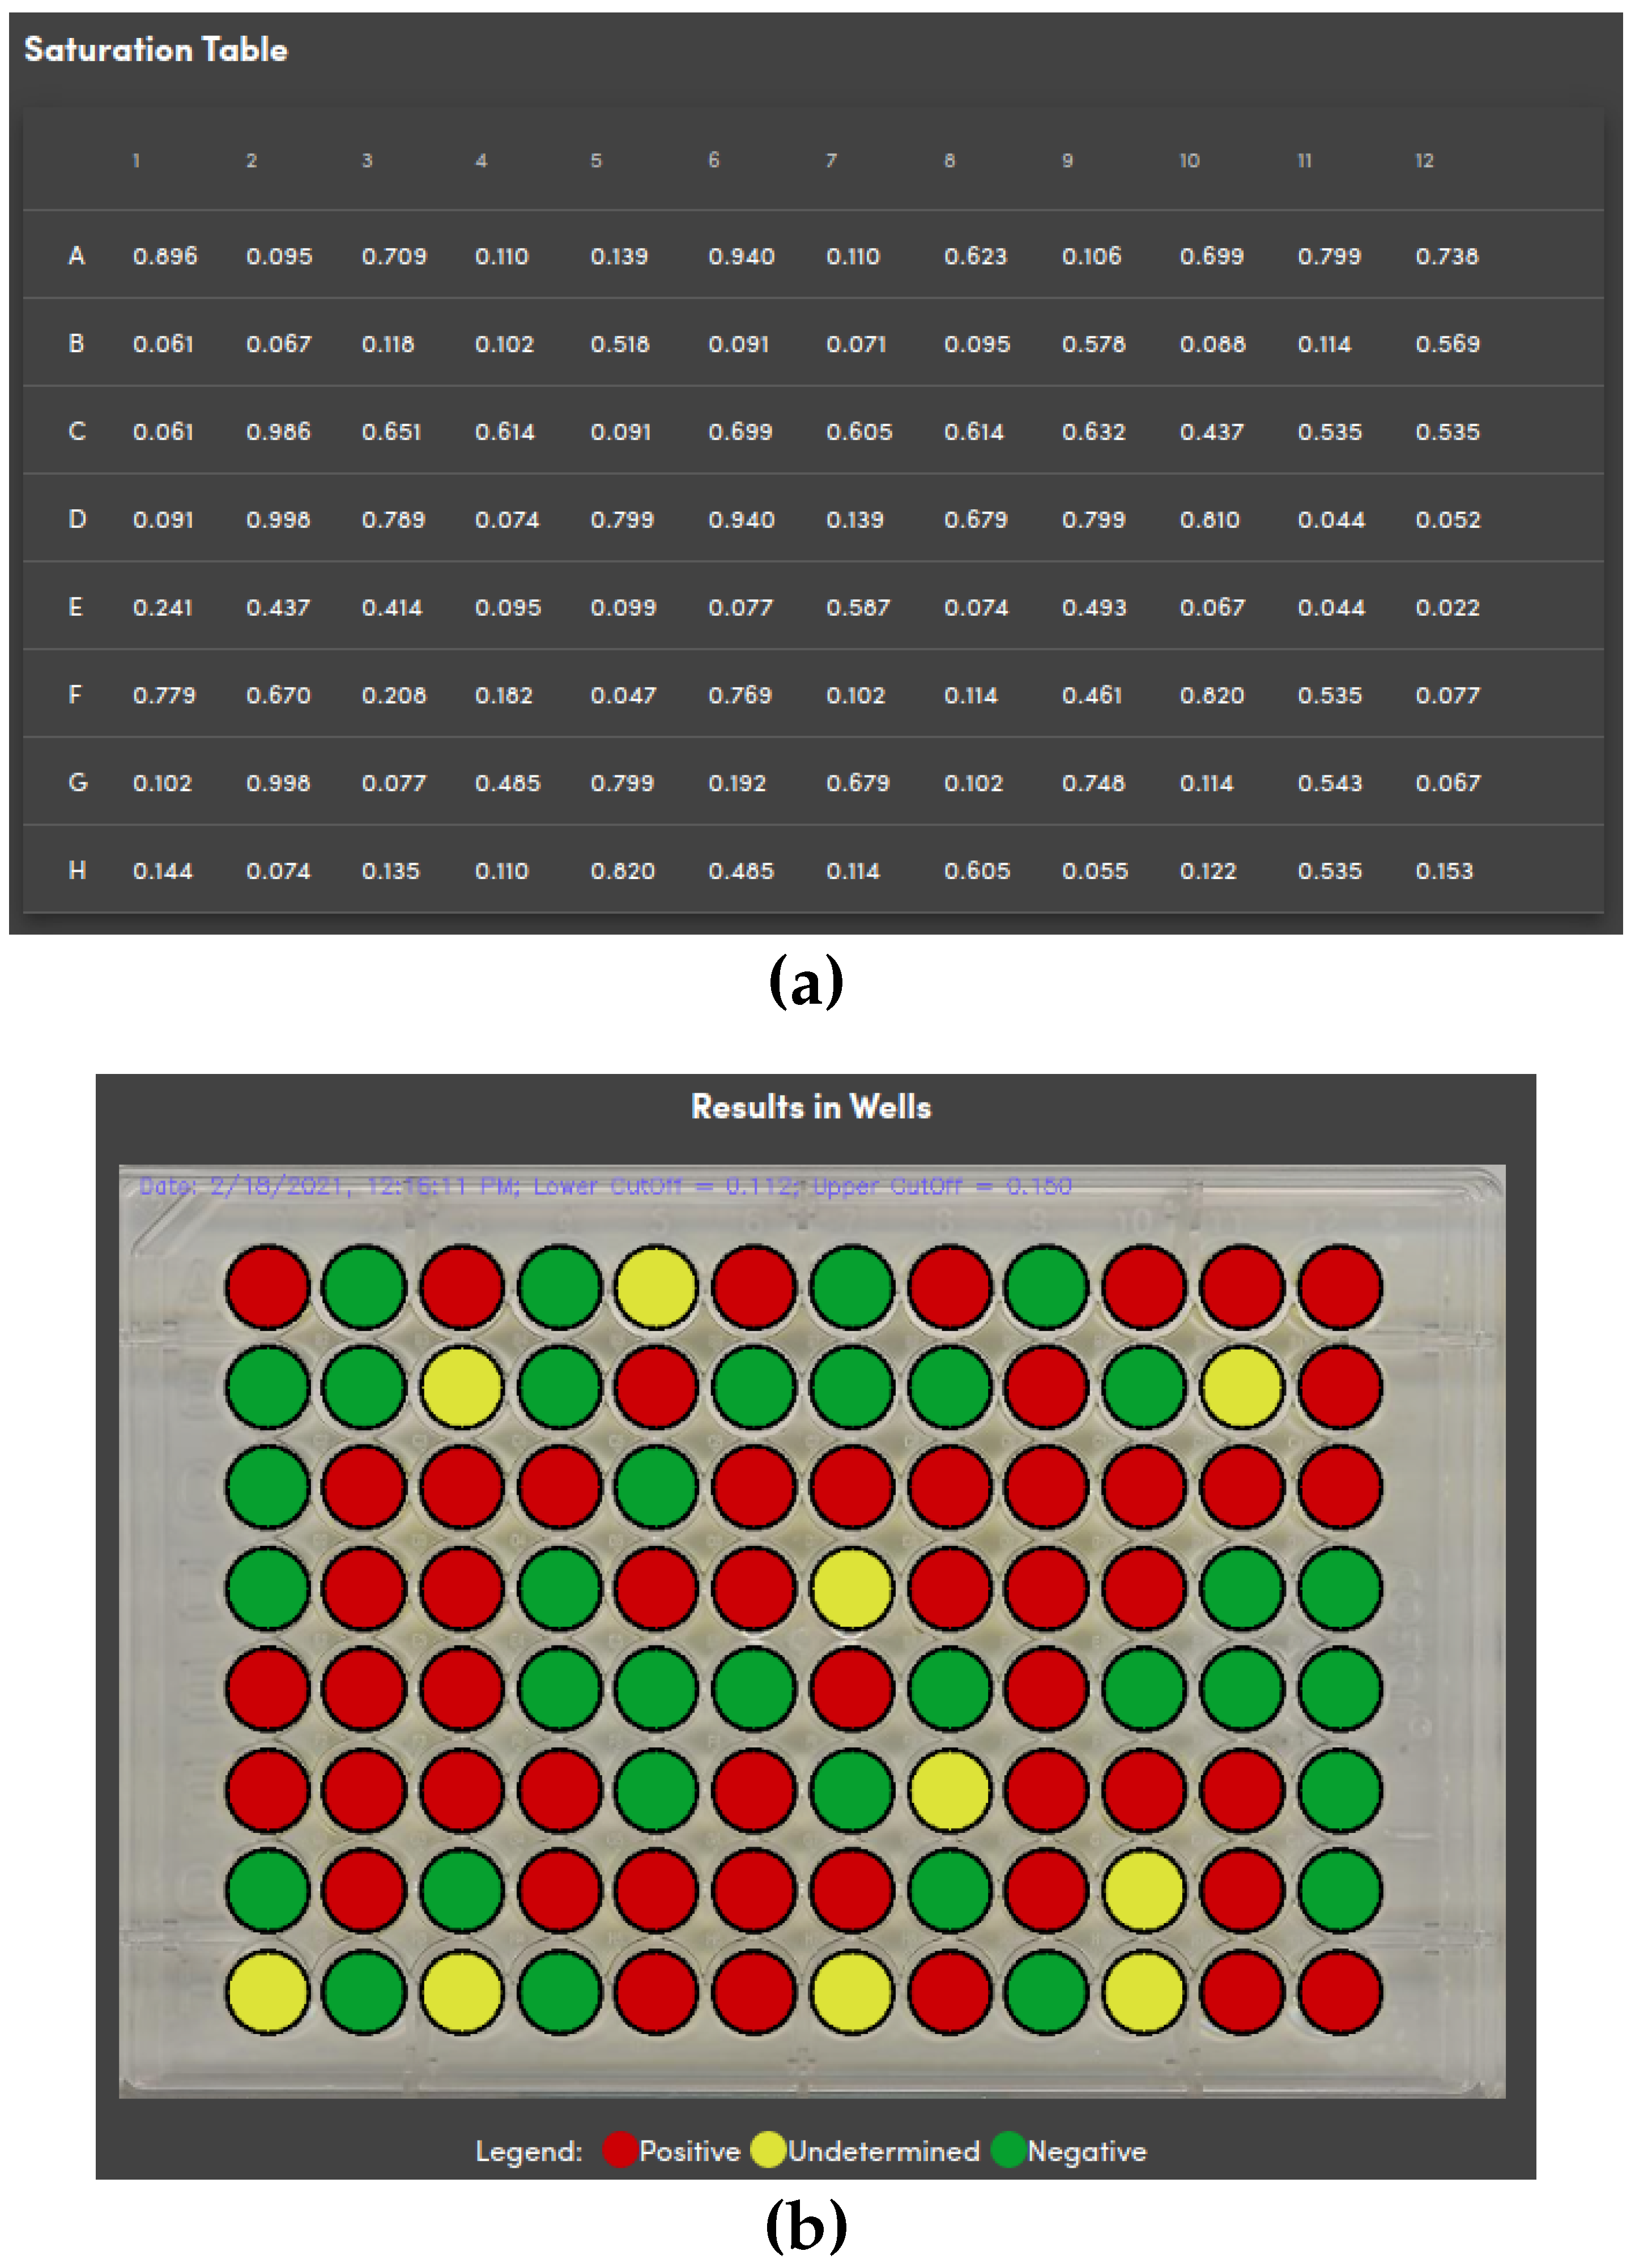
In the last step, the generated results of the sample’s detection and diagnosis are shown in the user interface.
Figure 13a depicts an example of a table containing the value of the metric used in the diagnosis.
Figure 13b shows the results embedded in the plate with information on the analyzed data and the lower and upper cut-offs. As shown in the legends, red is for positive, yellow for undetermined, and green for negative samples according to the diagnosis method. There is an option to download individualized PDF files for each analyzed sample containing the patient’s personal information with his/her diagnosis.
5. Conclusions
The proposed methodology in the present work uses scanned images to detect IgG anti-SARS-CoV-2 antibodies instead of the spectrophotometer analysis by ELISA tests. As a similar accuracy to the traditional approach was obtained, the created method was considered to be validated. An open-source software was developed to simplify and automate the diagnosis report. The low-cost and easy-to-use methodology to test the population can be broadly applied facilitating mass testing and improving COVID-19 monitoring. The new method is expected to be adaptable to perform other ELISA-based test diagnoses.
Author Contributions
Conceptualization, F.D.R.S., C.F.C.M., J.N.P.N., D.P.B.d.A., L.R.C., M.B.d.S.J. and A.R.S.; methodology, F.D.R.S., C.F.C.M., J.N.P.N., D.P.B.d.A., L.R.C., M.B.d.S.J. and A.R.S.; validation, F.D.R.S., C.F.C.M., J.N.P.N., D.P.B.d.A., L.R.C., M.B.d.S.J. and A.R.S.; formal analysis, F.D.R.S., C.F.C.M., J.N.P.N., D.P.B.d.A., M.B.d.S.J. and A.R.S.; investigation, F.D.R.S., C.F.C.M., J.N.P.N., D.P.B.d.A., M.B.d.S.J. and A.R.S.; resources, L.R.C., M.B.d.S.J. and A.R.S.; data curation, F.D.R.S., C.F.C.M., J.N.P.N., D.P.B.d.A., M.B.d.S.J. and A.R.S.; writing—original draft preparation, F.D.R.S., C.F.C.M., J.N.P.N., D.P.B.d.A., M.B.d.S.J. and A.R.S.; writing—review and editing, F.D.R.S., C.F.C.M., J.N.P.N., D.P.B.d.A., M.B.d.S.J. and A.R.S.; visualization, F.D.R.S., C.F.C.M., J.N.P.N., M.B.d.S.J. and A.R.S.; supervision, L.R.C., M.B.d.S.J. and A.R.S.; project administration, A.R.S.; funding acquisition, L.R.C., M.B.d.S.J. and A.R.S. All authors have read and agreed to the published version of the manuscript.
Funding
This work was supported by Fundação Carlos Chagas Filho de Amparo à Pesquisa do Estado do Rio de Janeiro (FAPERJ) (Grant No. E-26/201.148/2022); Coordenação de Aperfeicoamento de Pessoal de Nível Superior (CAPES): Finance Code: 001; National Council for Scientific and Technological Development (CNPq): Grant No. 303587/2020-2.
Institutional Review Board Statement
Samples were collected at the HEMORIO following a protocol approved by the local ethics committee (CEP HEMORIO; Approval #4008095).
Informed Consent Statement
Not applicable.
Data Availability Statement
Not applicable.
Conflicts of Interest
The authors declare no conflict of interest. The founders had no role in the design of the study; in the collection, analysis, or interpretation of the data; in the writing of the manuscript; nor in the decision to publish the results.
References
- Sheikhzadeh, E.; Eissa, S.; Ismail, A.; Zourob, M. Diagnostic techniques for COVID-19 and new developments. Talanta 2020, 220, 121392. [Google Scholar] [CrossRef] [PubMed]
- Kulkarni, R.; Patil, H.P.; Palkar, S.; Lalwani, S.; Mishra, A.C.; Arankalle, V. Anti-SARS-CoV-2 IgG Antibody Response Among Indian COVID-19 Patients Using β-Propiolactone-Inactivated, whole Virus-Based Indirect ELISA. J. Virol. Methods 2021, 287, 113996. [Google Scholar] [CrossRef] [PubMed]
- Silva, D.M.; Secchi, A.R. Recursive state and parameter estimation of COVID-19 circulating variants dynamics. Sci. Rep. 2022, 12, 15879–15895. [Google Scholar] [CrossRef] [PubMed]
- Thomas, S.N.; Altawallbeh, G.; Zaun, C.P.; Pape, K.A.; Peters, J.M.; Titcombe, P.J.; Dileepan, T.; Rapp, M.J.; Bold, T.D.; Schacker, T.W.; et al. Initial Determination of COVID-19 Seroprevalence Among Outpatients and Healthcare Workers in Minnesota Using a Novel SARS-CoV-2 total Antibody ELISA. Clin. Biochem. 2021, 90, 15–22. [Google Scholar] [CrossRef] [PubMed]
- Chen, L.; Zhang, G.; Liu, L.; Li, Z. Emerging biosensing technologies for improved diagnostics of COVID-19 and future pandemics. Talanta 2021, 225, 121986. [Google Scholar] [CrossRef]
- Alvim, R.G.F.; Lima, T.M.; Rodrigues, D.A.S.; Marsili, F.F.; Bozza, V.B.T.; Higa, L.M.; Monteiro, F.L.; Abreu, D.P.B.; Leitão, I.C.; Carvalho, R.S.; et al. Development and Large-Scale Validation of a Highly Accurate SARS-COV-2 Serological Test Using Regular Test Strips for Autonomous and Affordable Finger-Prick Sample Collection, Transportation, and Storage. medRxiv 2021. [Google Scholar] [CrossRef]
- Alvim, R.G.; Lima, T.M.; Rodrigues, D.A.; Marsili, F.F.; Bozza, V.B.; Higa, L.M.; Monteiro, F.L.; Abreu, D.P.; Leitão, I.C.; Carvalho, R.S.; et al. From a recombinant key antigen to an accurate, affordable serological test: Lessons learnt from COVID-19 for future pandemics. Biochem. Eng. J. 2022, 186, 108537. [Google Scholar] [CrossRef]
- Han, T.; Cong, H.; Shen, Y.; Yu, B. Recent advances in detection technologies for COVID-19. Talanta 2021, 233, 122609. [Google Scholar] [CrossRef] [PubMed]
- Wisnewski, A.V.; Luna, J.C.; Redlich, C.A. Human IgG and IgA Responses to COVID-19 mRNA Vaccines. PLoS ONE 2021, 16, e0249499. [Google Scholar] [CrossRef] [PubMed]
- Zhou, Y.; Wu, Y.; Ding, L.; Huang, X.; Xiong, Y. Point-of-care COVID-19 diagnostics powered by lateral flow assay. Trends Anal. Chem. 2021, 145, 116452. [Google Scholar] [CrossRef] [PubMed]
- de Assis, T.S.M.; Freire, M.L.; Carvalho, J.d.P.; Rabello, A.; Cota, G. Cost-effectiveness of anti-SARS-CoV-2 antibody diagnostic tests in Brazil. PLoS ONE 2022, 17, 1–13. [Google Scholar] [CrossRef] [PubMed]
- Guo, J.; Chen, S.; Guo, J.; Ma, X. Nanomaterial Labels in Lateral Flow Immunoassays for Point-of-Care-Testing. J. Mater. Sci. Technol. 2021, 60, 90–104. [Google Scholar] [CrossRef]
- Gong, F.; Wei, H.x.; Li, Q.; Liu, L.; Li, B. Evaluation and Comparison of Serological Methods for COVID-19 Diagnosis. Front. Mol. Biosci. 2021, 8. [Google Scholar] [CrossRef] [PubMed]
- Mohit, E.; Rostami, Z.; Vahidi, H. A comparative review of immunoassays for COVID-19 detection. Expert Rev. Clin. Immunol. 2021, 17, 573–599. [Google Scholar] [CrossRef]
- Joblove, G.H.; Greenberg, D. Color Spaces for Computer Graphics. SIGGRAPH Comput. Graph. 1978, 12, 20–25. [Google Scholar] [CrossRef]
- ECMA International. Standard ECMA-262-ECMAScript Language Specification, 5.1st ed.; ECMA International: Geneva, Switzerland, 2011. [Google Scholar]
- Taheri, S.; Vedienbaum, A.; Nicolau, A.; Hu, N.; Haghighat, M.R. OpenCV.js: Computer Vision processing for the open Web platform. In Proceedings of the 9th ACM Multimedia Systems Conference, Amsterdam, The Netherlands, 12–15 June 2018; pp. 478–483. [Google Scholar]
- OpenCV. Open Source Computer Vision Library. 2015. Available online: https://opencv.org/ (accessed on 3 November 2022).
| Disclaimer/Publisher’s Note: The statements, opinions and data contained in all publications are solely those of the individual author(s) and contributor(s) and not of MDPI and/or the editor(s). MDPI and/or the editor(s) disclaim responsibility for any injury to people or property resulting from any ideas, methods, instructions or products referred to in the content. |
© 2023 by the authors. Licensee MDPI, Basel, Switzerland. This article is an open access article distributed under the terms and conditions of the Creative Commons Attribution (CC BY) license (https://creativecommons.org/licenses/by/4.0/).


 ,
, 


