Abstract
The most common scale-up approach for gas–solids fluidized beds is based on matching the governing dimensionless parameters. In the literature, this approach has been validated only by means of measuring global parameters between different sizes of fluidized beds. However, such global measurements are not sufficient to depict all the interplaying hydrodynamic phenomena and hence verify the scale-up relationships. Therefore, to assess this approach, an advanced gas–solids optical probe and pressure transducer measurement techniques have been applied to quantify local hydrodynamic parameters in two different sized fluidized beds. Four different sets of experimental conditions were designed and conducted to examine the assessment of the scaling approach with matched and mismatched dimensionless groups between the two beds. The results indicated that the reported dimensionless groups are not adequate for achieving similarity between the two gas–solids fluidized beds in terms of solids holdup, gas holdup, particle velocity, mass flux, and pressure fluctuation. This finding demonstrates the importance of local measurements of the hydrodynamic parameters of fluidized beds in order to evaluate scale-up relationships. Finally, the results further advance the understanding of the gas–solids fluidized beds and present deeper insight into their solids dynamics.
1. Introduction
Gas–solid fluidized bed reactors have found various applications in different industries such as chemical, mineral, pharmaceutical, petrochemical, combustion, drying, gasification, calcination, catalytic cracking, calcination processes, and many others [1,2,3,4,5,6,7,8,9,10,11]. The gas–solid fluidized beds are characterized by having excellent heat and mass transfer, a simple construction, low operating and maintenance costs, and high catalyst durability. Such reactors enable excellent contact between the solid particles and the gas phase, as well as between the particles and the wall [12]. In their simplest form, fluidized beds are cylindrical vessels in which gas passes through a sparger and the distributor at enough velocity to suspend the particles. However, the design, scale-up, and hydrodynamics of gas–solids fluidized bed are challenging even though the construction of such beds is quite straightforward. In spite of the simplicity of the mechanical design of fluidized beds, their hydrodynamics, transports, and interaction between phases are complex; hence, a proper understanding of this system is required for a reliable and safe design and scale-up. There are numerous parameters that affect the fluidized bed performance, such as operating conditions (pressure, temperature, superficial gas velocity, etc.), design variables (geometry and its dimensions, internals, the gas distributor, etc.), physical and thermodynamic properties, and chemical kinetics. All of these parameters influence the flow pattern, velocity field, turbulent parameters, breakup and coalescence of bubbles, gas holdup, heat, and mass transfer; such effects have not yet been well quantified and characterized. Because of the complex hydrodynamic nature of gas–solid fluidized beds, the scale-up process of such reactors is not fully understood. Optimal scale-up process of fluidized beds from small scale to large scale is a vital issue when utilizing fluidized beds for operations in the petrochemical industry; therefore, this has been the topic of many studies in the literature [13,14,15,16,17,18,19,20,21,22,23,24,25]. The scale effect takes place when shifting from lab to industrial scale fluidized beds resulting in issues for the development of fluidized beds for industrial applications [26]. An example of that can found in the faster rise of bubbles in large fluidized beds, as a result of the decrease in wall effects and acquiring less exchange with the dense phase [23,26]. In cases where planning for the design and installation of a newly designed industrial fluidized beds, this usually demands carrying out preliminary experimentation and error and trails for the pilot plant unit to prevent unpredicted scale effects at the industrial scale. The reason being that direct scaling-up from lab scale to industrial scale can be quite costly.
In the literature different studies have been conducted about the scale-up of gas–solids fluidized beds [13,14,15,16,17,18,19,20,21,22,23,24,25]. Targeting the hydrodynamic similarity between small- and large-sized fluidized beds, numerous efforts had been conducted to formulate a scale-up methodology determined by matching governing dimensionless. Romero [27] analyzed the factors affecting the operation of fluidized beds to discover the scaling relationships of fluidized beds depending on the approach of matching dimensionless groups. It has been proposed that the hydrodynamics of fluidized beds could be characterized by matching four dimensionless groups which are Reynolds, Froude number, the ratio of bed height at minimum fluidization velocity to the bed diameter, and the ratio of solid-to-fluid density [27]. In this regard, it has been demonstrated that experimental validations were not sufficient to examine the aforementioned four-dimensionless groups. Broadhurst and Becker [28] applied the theory of dimensions to fluidized beds (i.e., the Buckingham Pi theorem) to determine a set of dimensionless groups as a function of one dependent variable, for example the minimum fluidized velocity (e.g., Umf).
Horio et al. [13] and Glicksman [16] proposed matching selected dimensionless groups using the governing equations when scaling up a fluidized bed to attain the hydrodynamics similarity. Further on, Glicksman et al. [20] refined and simplified the first scaling laws of [16] by including the Froude number based on column height, the solid to gas density ratio, the ratio of superficial to minimum fluidization velocity, bed geometric ratios, and particle sphericity and size distribution. However, Glicksman [16], Glicksman et al. [20], and Horio et al. [13], measured the global parameters to evaluate their proposed approach. Glicksman [16] reported that the diameter effect of the fluidized bed on conversion is caused by less efficient gas–solid contact. Frye et al. [24] studied the effect of three different sizes on apparent reaction rate, and they observed that the reaction rate decreased by a factor of three between the smaller and larger beds. Horio et al. [13] also observed that as the bed diameter increases, the yield of the reaction decreases. Horio et al. [13] also discussed the problem related to the size and distribution of bubbles in fluidized beds of different sizes. To resolve this issue, they proposed new scale-up rules along with the established rules of [16]. The proposed rules were developed by taking into consideration the bubble coalescence and bubble splitting when designing the fluidized beds. Knowlton et al. [21] introduced qualitative results of different parameters such as bubble size and solids hold-up as a result of the change in the fluidized beds size. Chen et al. [25] pointed out that in the gas–liquid fluidized beds, the bubble path on the small scale bed is different from that on the large scale beds. On the small scale, bubbles tend to be unidirectional, in contrast to the large scale, where the bubbles converge about the bed axis at the center. Mabrouk et al. [19] studied the key design and operating variables of the phenomena encountered in three scales of fluidized beds and how these affect the scale- up and operation of these beds. However, the assessment of local parameters in order to verify the dimensionless group-based scale-up methodology was absent. Furthermore, these sizes of the fluidized bed are small compared to pilot plant scale and industrial applications. Therefore, there is a need to assess the proposed matching dimensionless groups for scaling-up fluidized beds by measuring the local hydrodynamic parameters, and if necessary, to develop a mechanistic approach for scale-up to maintain hydrodynamics similarity that can be monitored on-line using sophisticated techniques.
Although scale-up rules based on dimensionless groups have been proposed by [16,20], different simplification and assumptions were made in the studies. The essential assumptions employed in deriving the parameters are that the fluid is incompressible, inter-particle forces apart from mechanical forces resulting from collisions are neglected. In addition, the influence of the particle restitution coefficient and the friction coefficient on inter-particle collisions were not included. Considering the aforementioned assumptions, the next list of dimensionless groups was derived [16]:
To examine the aforementioned set of dimensionless groups between large and small scales fluidized beds, both beds have to be geometrically similar. This condition is applicable to the distributor configuration design, the ratio of the bed height-to-width, and other geometrical ratios, which is stated in the term. The term, formulated with the drag coefficient of fluid-to-particle, is correlated to the Ergun equation or to the expression for single sphere drag. When the Ergun equation is nondimensionalized, it is demonstrated that this term () is determined by the Reynolds number and on the ration between bed height and particle density (). By substituting the Reynolds number and () and the dimensionless particle size distribution into Equation (1), the next set of dimensionless parameters comes out, which will be described as the full set:
In Equation (2), similarity should be attained in the two conditions of the sphericity of the particles () and the particle size distribution. In Equation (1), Glicksman [16] assumed that the group () may just be omitted when it comes to low gas velocities compared to the speed of sound. This kind of assumption offers a level of flexibility in the scale-up of simulated fluidized beds. This particular group () would help in adjusting the density of solids () in scaling fluidized bds. Through forgetting this group , values of solids density , , and gas density can be varied to keep the Reynolds numbers constant. Furthermore, Glicksman [16] neglected the tensor of each of the solids and gas phase, and the pressure gradient when deriving of the scale-up dimensionless groups. Foscolo et al. [29] nondimensionalized the equation of the last term to come out with the Froude number, which has been incorporated in the set of Equation (3). In practice, it is determined to turn out to be challenging to match all parameters stated in the full set of scaling parameters. As a way to match such parameters, it will eventually be required to utilize different solids and gases. As a way to overcome this issue, Glicksman et al. [20] introduced a simplified set where a smaller number of dimensionless groups than the full set (Equation (2)) are derived. The drag coefficient is expressed in a simplified form of the Ergun equation for different regimes. The drag coefficient is stated in a simplified form of the Ergun equation for various flow regimes. Additionally, it is to be mentioned that the simplified set was derived for low and high Reynolds numbers. The simplified set are given in Equation (3):
Additionally, for the simplified set, the geometrical condition should be met, which is that the fluidized beds to be scaled should be geometrically similar (i.e., all geometrical properties should be similar for both beds). Glicksman et al. [20] assumed that it is acceptable to anticipate that this particular set applies within the complete range of conditions by which the Ergun equation remains. It is also noteworthy Glicksman et al. [30] extracted the viscous limit at low gas velocities, by means of . Within this regime, the viscous forces tend to be dominating over the inertial forces. As a result of ignoring the inertial forces, the scaling relationships become less of a requirement. Additionally, it is pointed out the limitation of the first term in the Ergun equation, which includes the drag caused by the viscous forces. In this case, the term is proportional to and . This leads to a lower number of dimensionless parameters (Equation (4)) which have to be matched for proper scaling of fluidized beds, which is described as the viscous limit set:
Horio et al. [13] obtained the two scaling criteria, as shown in Equation (5). They counted on phenomenological models of bubbling beds on potential theory, such as the reported work of [31] on pairwise bubbles coalescence. To examine the scaling criteria in Equation (5), they utilized three different sizes bubbling fluidized beds; however, the beds are geometrically similar to each other. The sizes of the employed bubbling fluidized beds were in ascending order; 0.04, 0.1, and 0.24 m with respect to the inner diameter. Parameters such as the solid-to-gas density ratio even though it had not been included in the suggested scaling parameters as it had not been ranging in the experiments. Through video analysis, the bubble eruptions were measured at the beds’ surface. The measurements of the bubble eruptions through video analysis were used to determine the cross-sectional average bubble diameter, radial distribution of the superficial bubble velocity, and the bubble diameter distribution. It concluded that there were similarities in the aforementioned parameters when matching the groups in Equation (5) as well as the ratio of superficial to minimum fluidization velocities, and density of solid to gas ratio, and were matched.
Stein et al. [32] conducted an experimental verification of the scaling relationships proposed by [16]. Three different sizes bubbling fluidized beds were utilized in the study. The technique employed for the measurement was the positron emission particle tracking technique which enabled the non-invasive measurements of the particle cycle frequency. It concluded that matching the Froude numbers was sufficient to obtain similarity at the viscous limit. The experimental result also demonstrated little effect of the gas-to-particle density ratio; however, a small influence on particle-to-bed diameter ratio in case the alternation in the ratio was large. Efhaima and Aldahhan [14] also assessed the scaling relationships proposed by [16] using non-invasive measurement techniques; gamma-ray computed tomography (CT) and radioactive particle tracking (RPT) techniques. They concluded that matching the dimensionless groups between two different sized fluidized beds is not sufficient in acquiring all of the key phenomena for attaining similarity in the local hydrodynamic parameters. Additionally, it concluded that measurements of local hydrodynamic parameters are crucial for accurate examination of scale-up methodologies. However, the CT and RPT are complex measurement techniques and therefore further assessment is needed with simpler measurement techniques. Taofeeq and Aldahhan [33] assessed the chaotic scale-up approach by matching the Kolmogorov entropy between two different sizes fluidized beds. They concluded that the experimental conditions with similar or close radial profiles of the Kolmogorov entropy tend to achieve the similarity in local dimensionless hydrodynamic parameters.
Considering this state-of-the-art literature review, scale-up relationships of gas–solids fluidized beds found in the literature are rather validated by global parameters than local key hydrodynamics parameters. Horio et al. [13], Glicksman [16], Glicksman et al. [20] and others suggested matching selected dimensionless groups when scaling up a fluidized bed to maintain the hydrodynamics similarity. However, they measured the global parameters to evaluate their proposed approach. Detailed local measurements for their assessment are still lacking. Further studies and a detailed evaluation of these scale-up dimensionless groups are needed along with the use of advanced measurement techniques, in order to assess these groups by measuring and quantifying the local hydrodynamics and transport parameters which are lacking. Accordingly, in this work, the objective is to evaluate the scale up relationships of [20] (Equation (3)) using a sophisticated optical probe technique to measure simultaneously local solids velocity and holdup and their fluctuation, and the time series pressure signal. This can be achieved by identifying conditions that give matching of the related dimensionless groups and conditions that give mismatching of such dimensionless groups.
2. Experimental Set-Up and Measurement Techniques
2.1. Experimental Setup
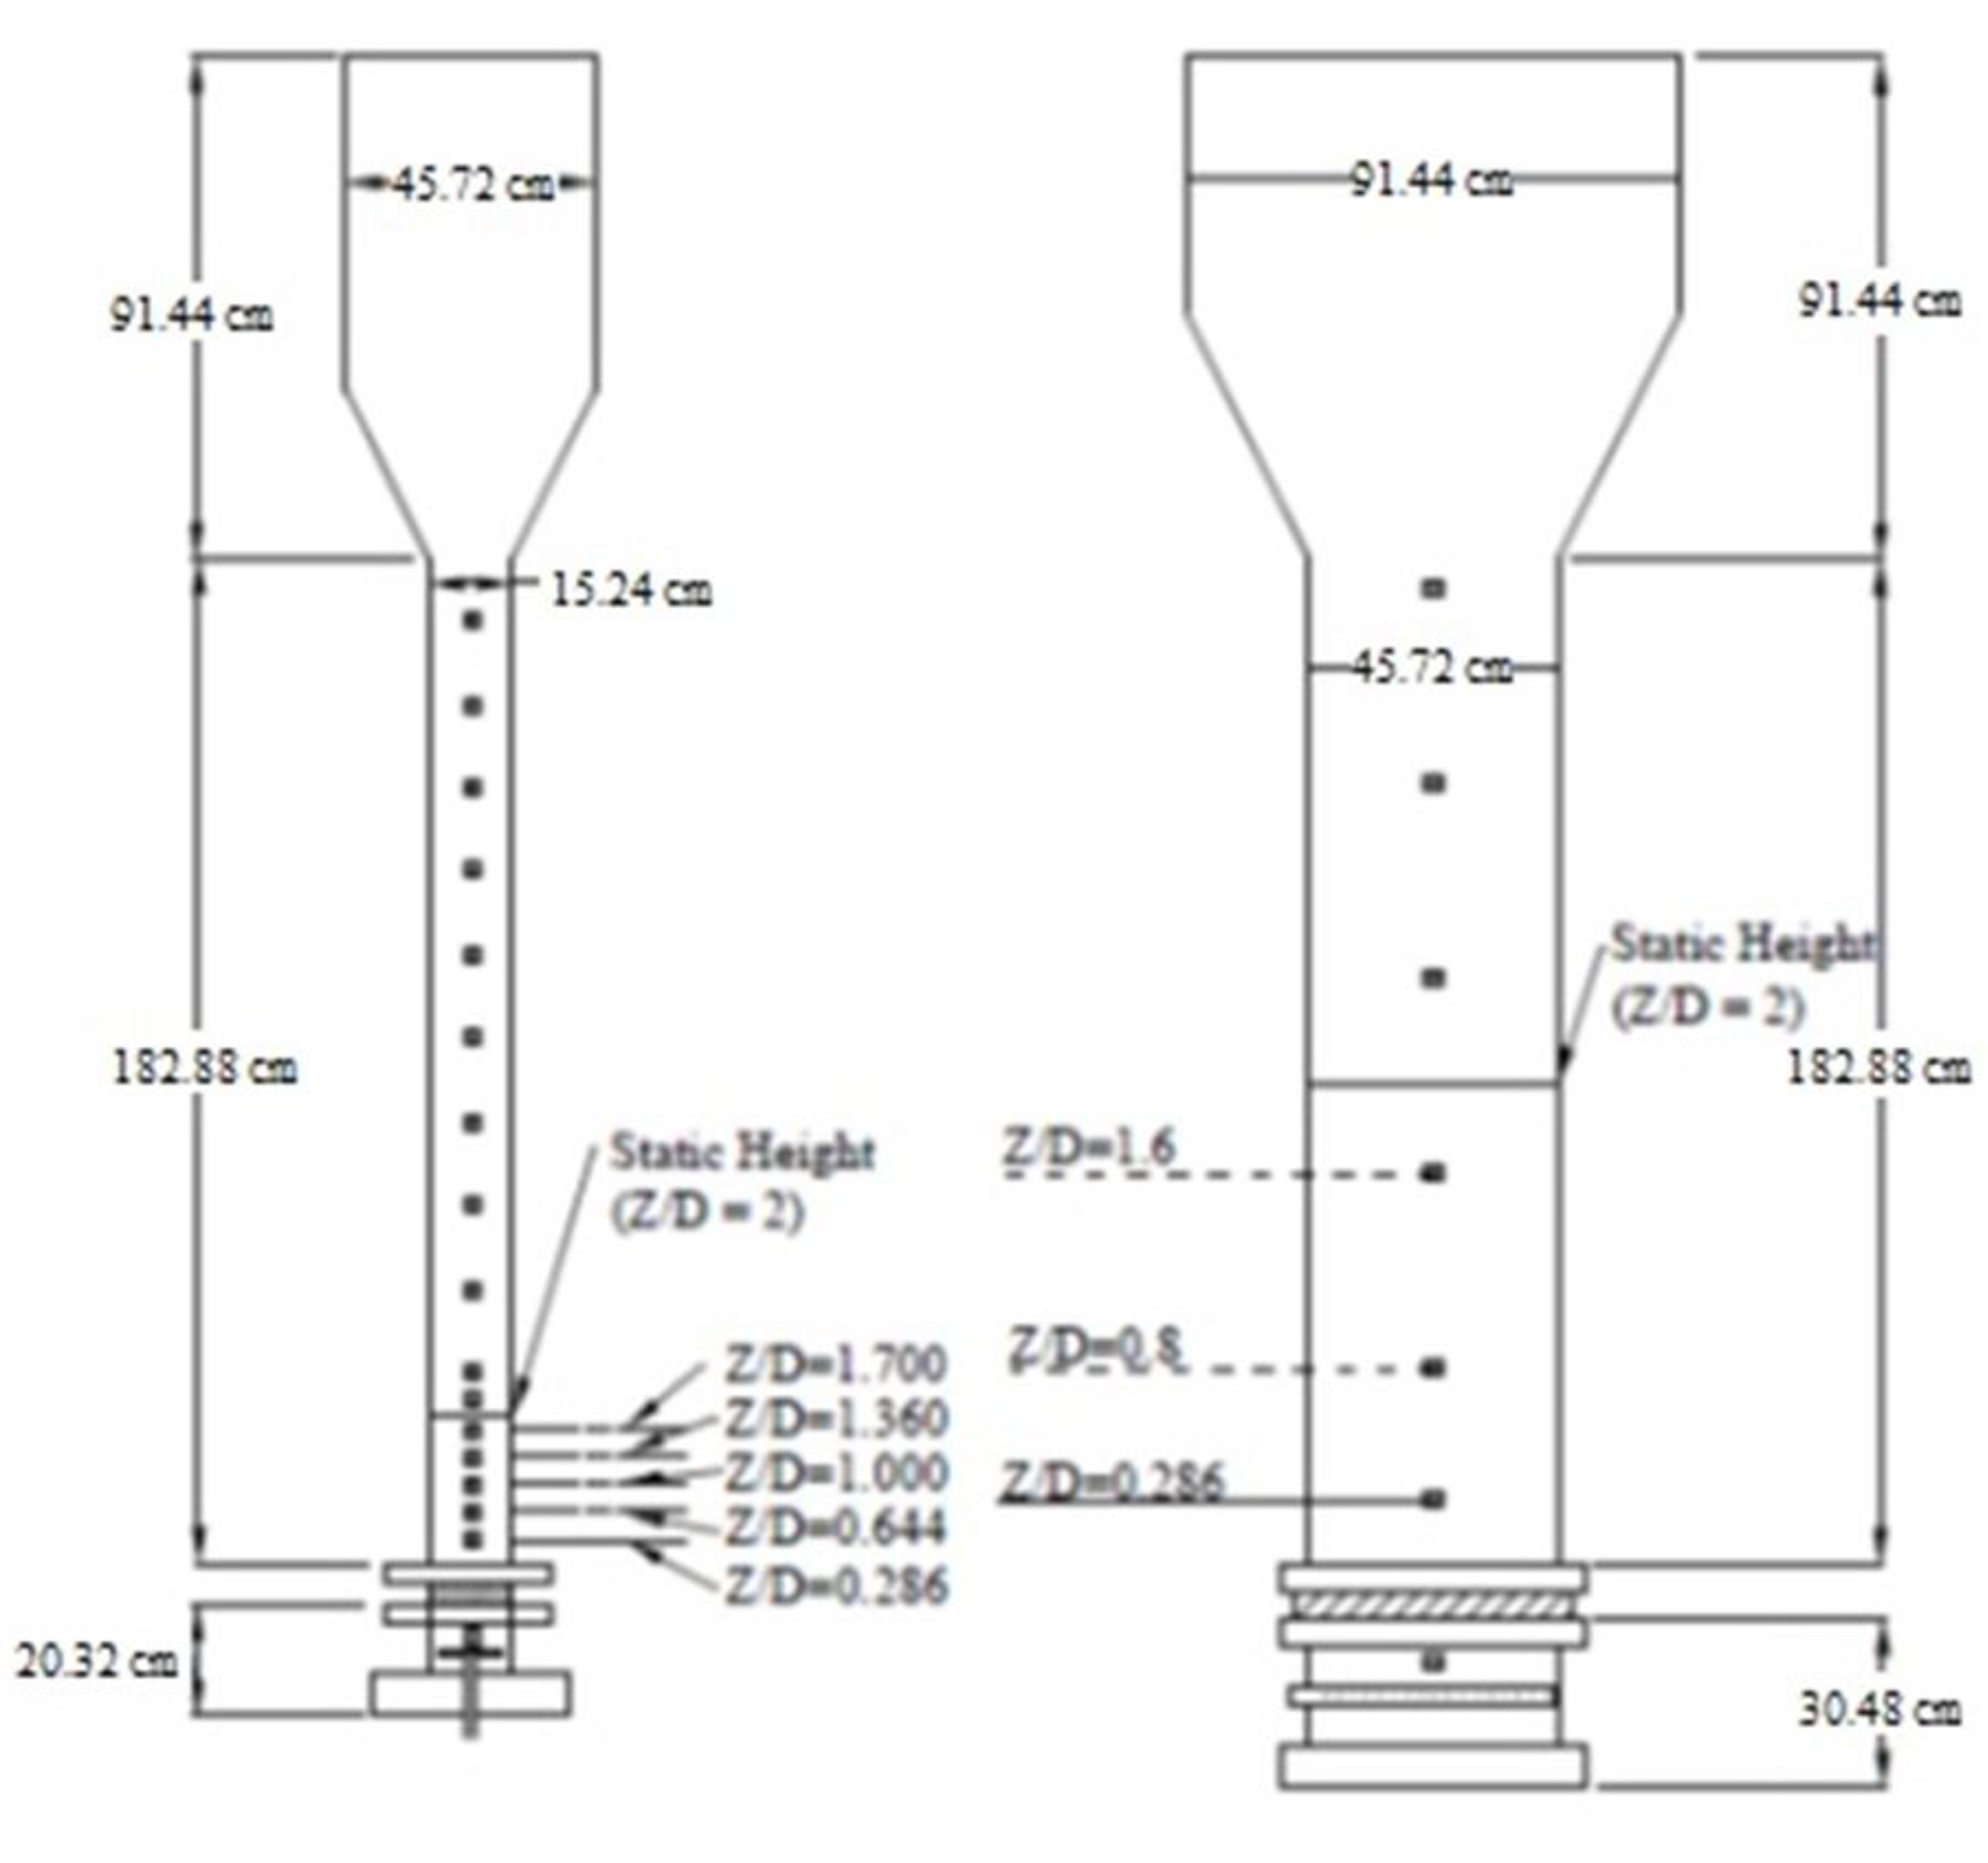
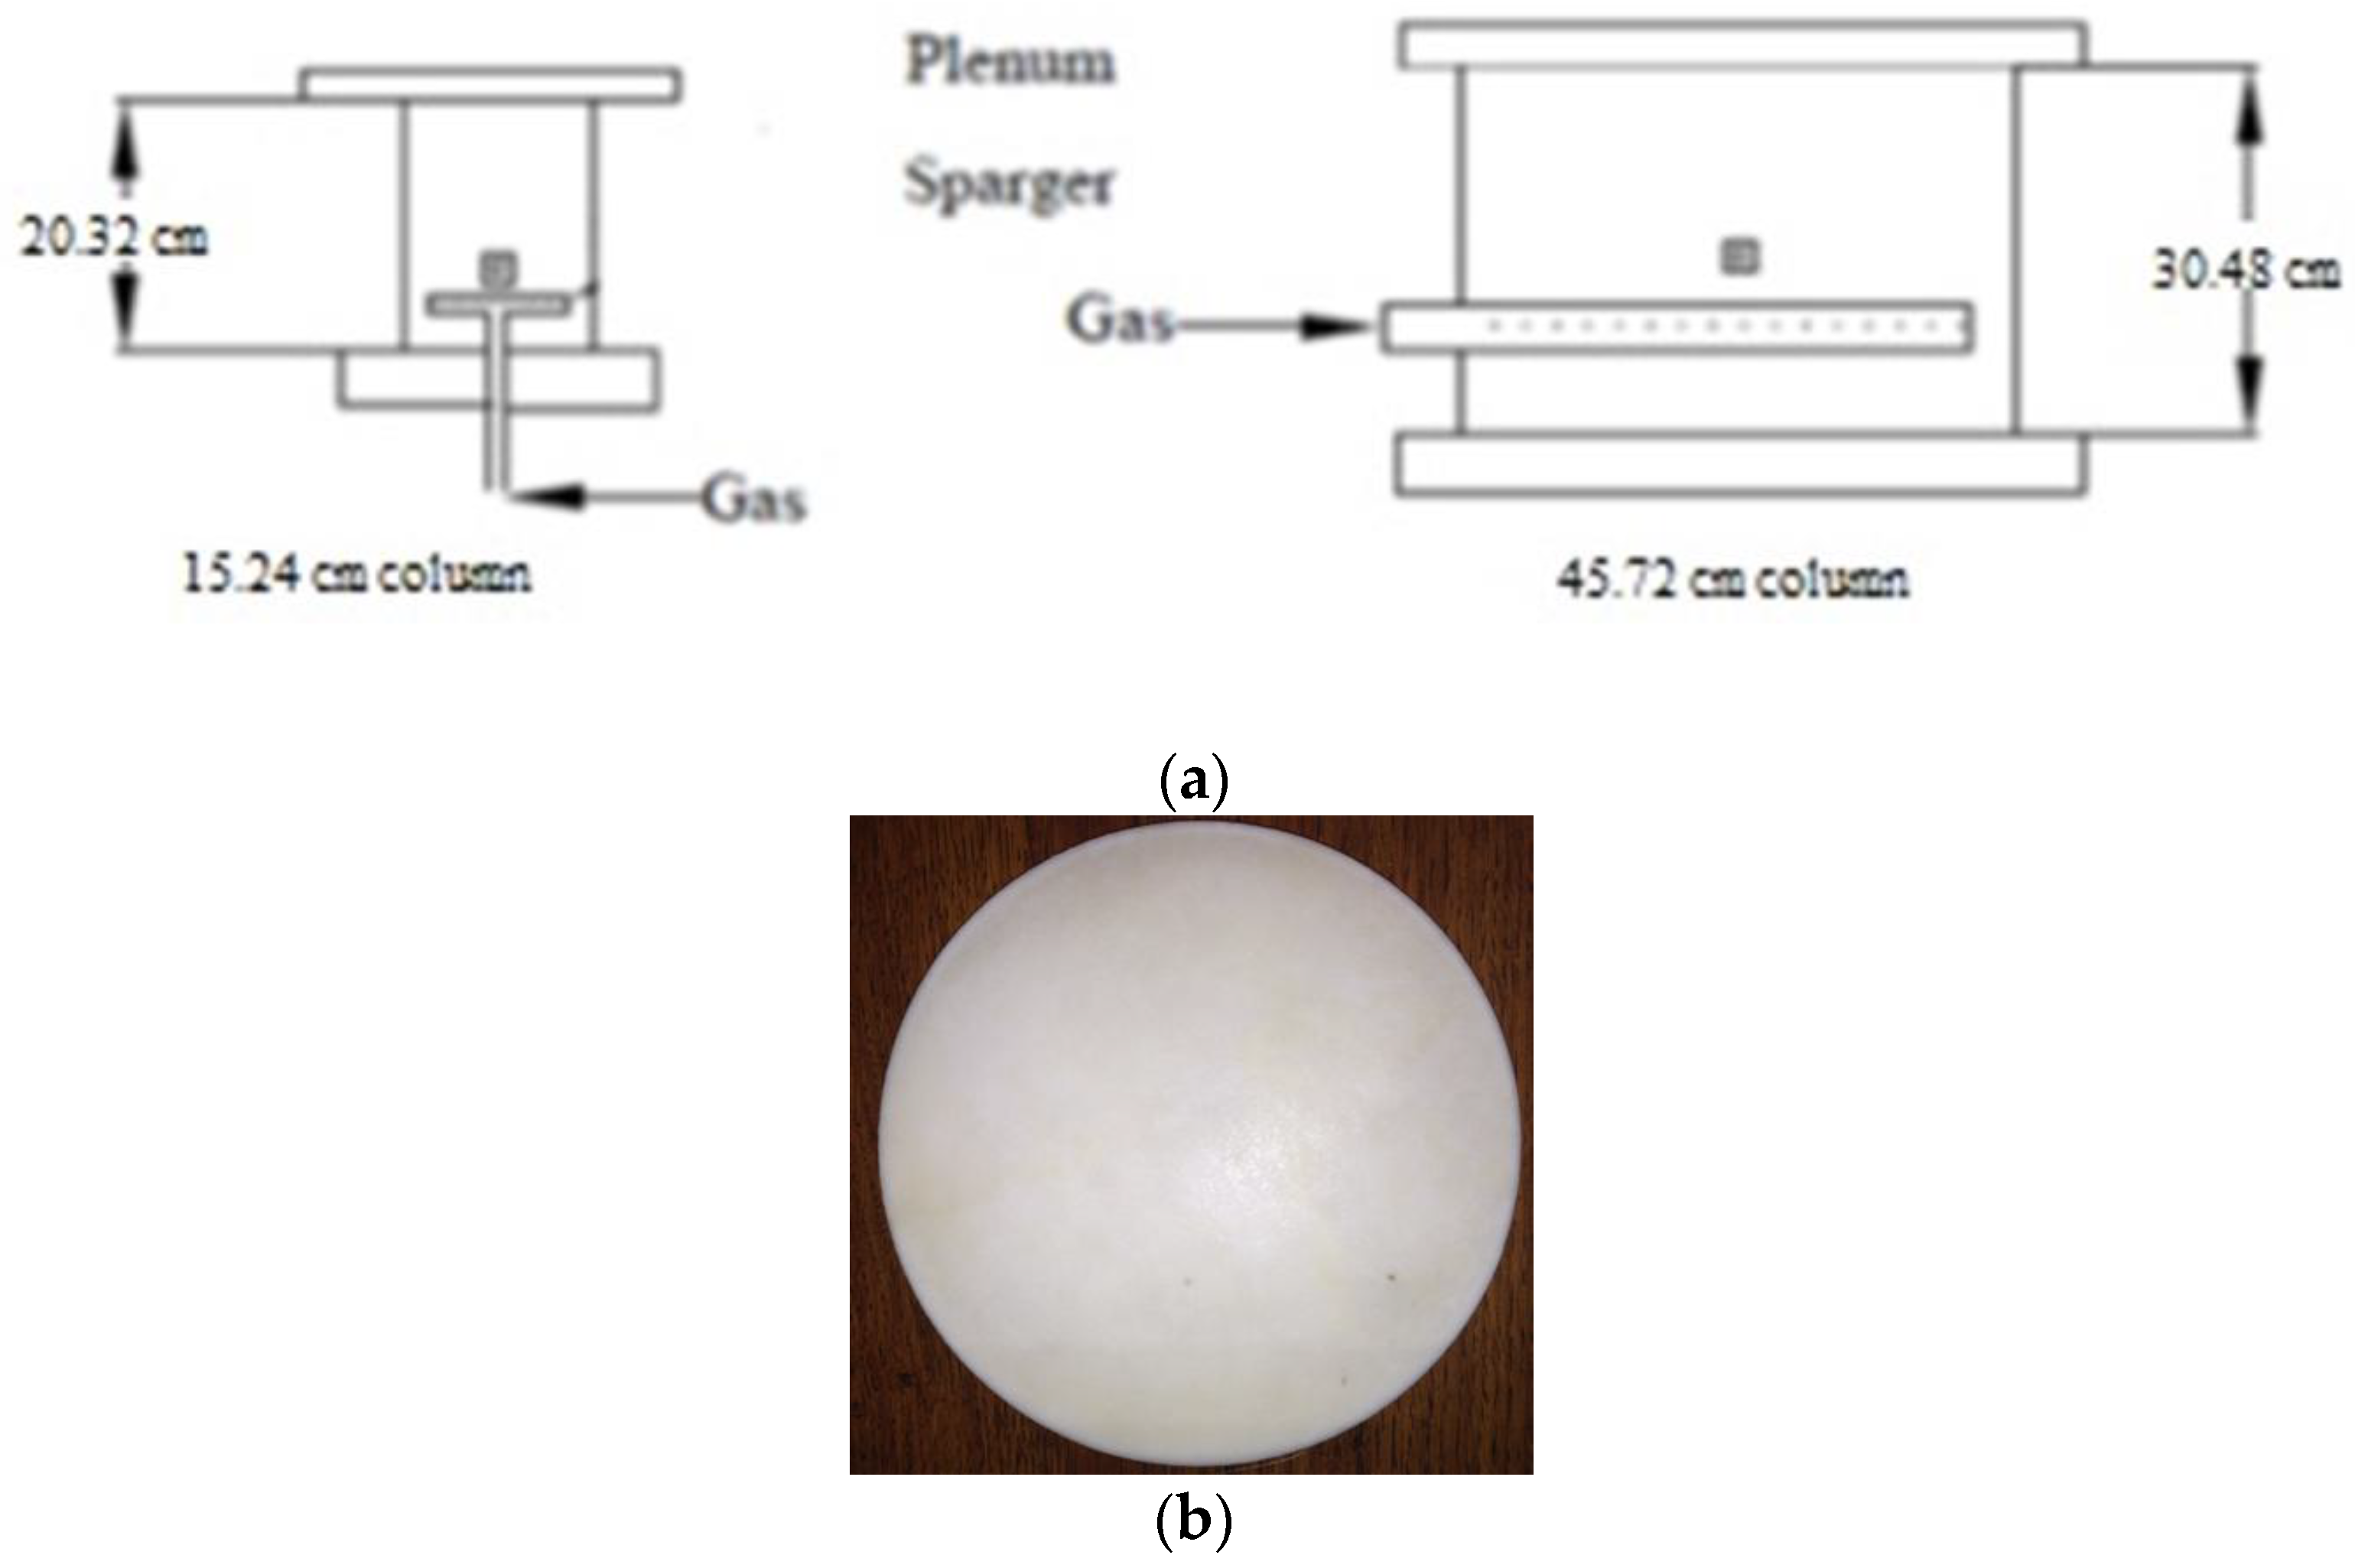
Two different sized fluidized beds of inside diameters equal to 0.14 m and 0.44 m were used in the present study. The schematic of the two fluidized beds with detailed dimensions is shown in Figure 1. The fluidized bed columns were constructed from Plexiglas and consisted of two pieces (column and cone) attached to a plenum base. The height of the 0.14 m column was about 1.83 m tall, it was connected from the top with an upper section of 0.44 m diameter and 0.9 m height. The indicated upper section of the fluidized bed (the disengagement zone) was designed to have a larger diameter in order to enhance the solids separation via reducing the superficial gas velocity of the gas phase. A total of sixteen measurement ports in the wall of the beds were located to enable the axial measurements (see Figure 1). This gave the ability of measurements along the entire fluidized bed dynamic. The column sat at the top of a stainless-steel base. The gas distributor was manufactured from of a porous polyethylene sheet of a pore size of 15–40 μm (Figure 2). The plenum (Figure 2) was located at the bottom, which consisted of a sparger tube. The latter was plugged at one end, and through this tube, air was introduced into the column, which consisted of fourteen holes, all facing downward with respect to the column. The 0.44 m diameter (Figure 1) fluidized bed very closely resembled the 0.14 m fluidized bed. The shape of the upper section was similar, but it was 1.22 m. The 0.44 m fluidized bed also had axial measurement ports on its sides in order to take axial measurements in increments along the whole column. The distributor’s design was similar to that of the 0.14 m diameter fluidized bed. The plenum was placed at the bottom of the column, which comprised a sparger tube. The sparger tube was connected on one side, and throughout this particular tube, air was introduced into the bed. The size of the sparger tube was about 3.81 mm in diameter and comprised seventeen holes, all facing downward with respect to the bed. In addition, both columns were electrically grounded to minimize electrostatic effects.
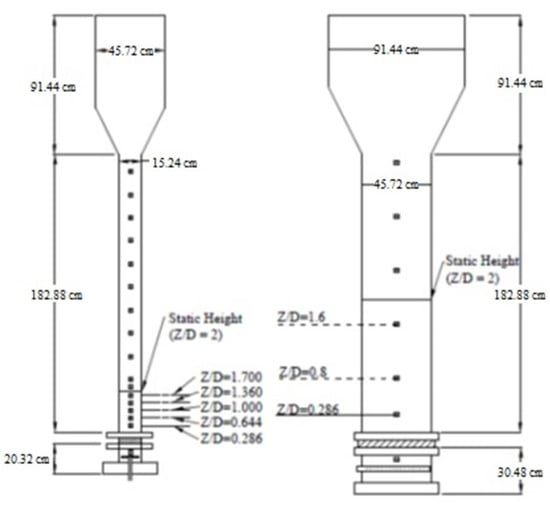
Figure 1.
Schematic of detailed dimensions of 0.14 m and o.44 m Fluidized Beds along with the dimensionless axial measurement levels.
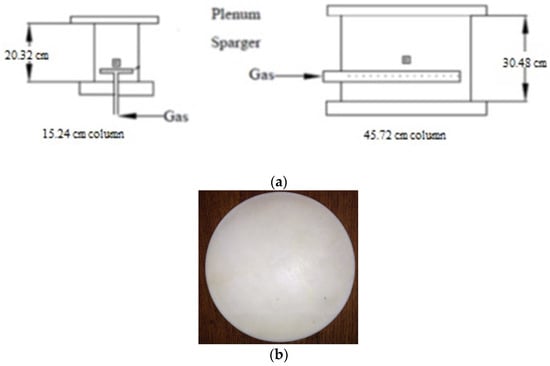
Figure 2.
(a) plenum design (b) Distributor for 0.14 m and 0.44 m fluidized bds made of a porous Polyethylene sheet with a pore Size of 15–40 μm.
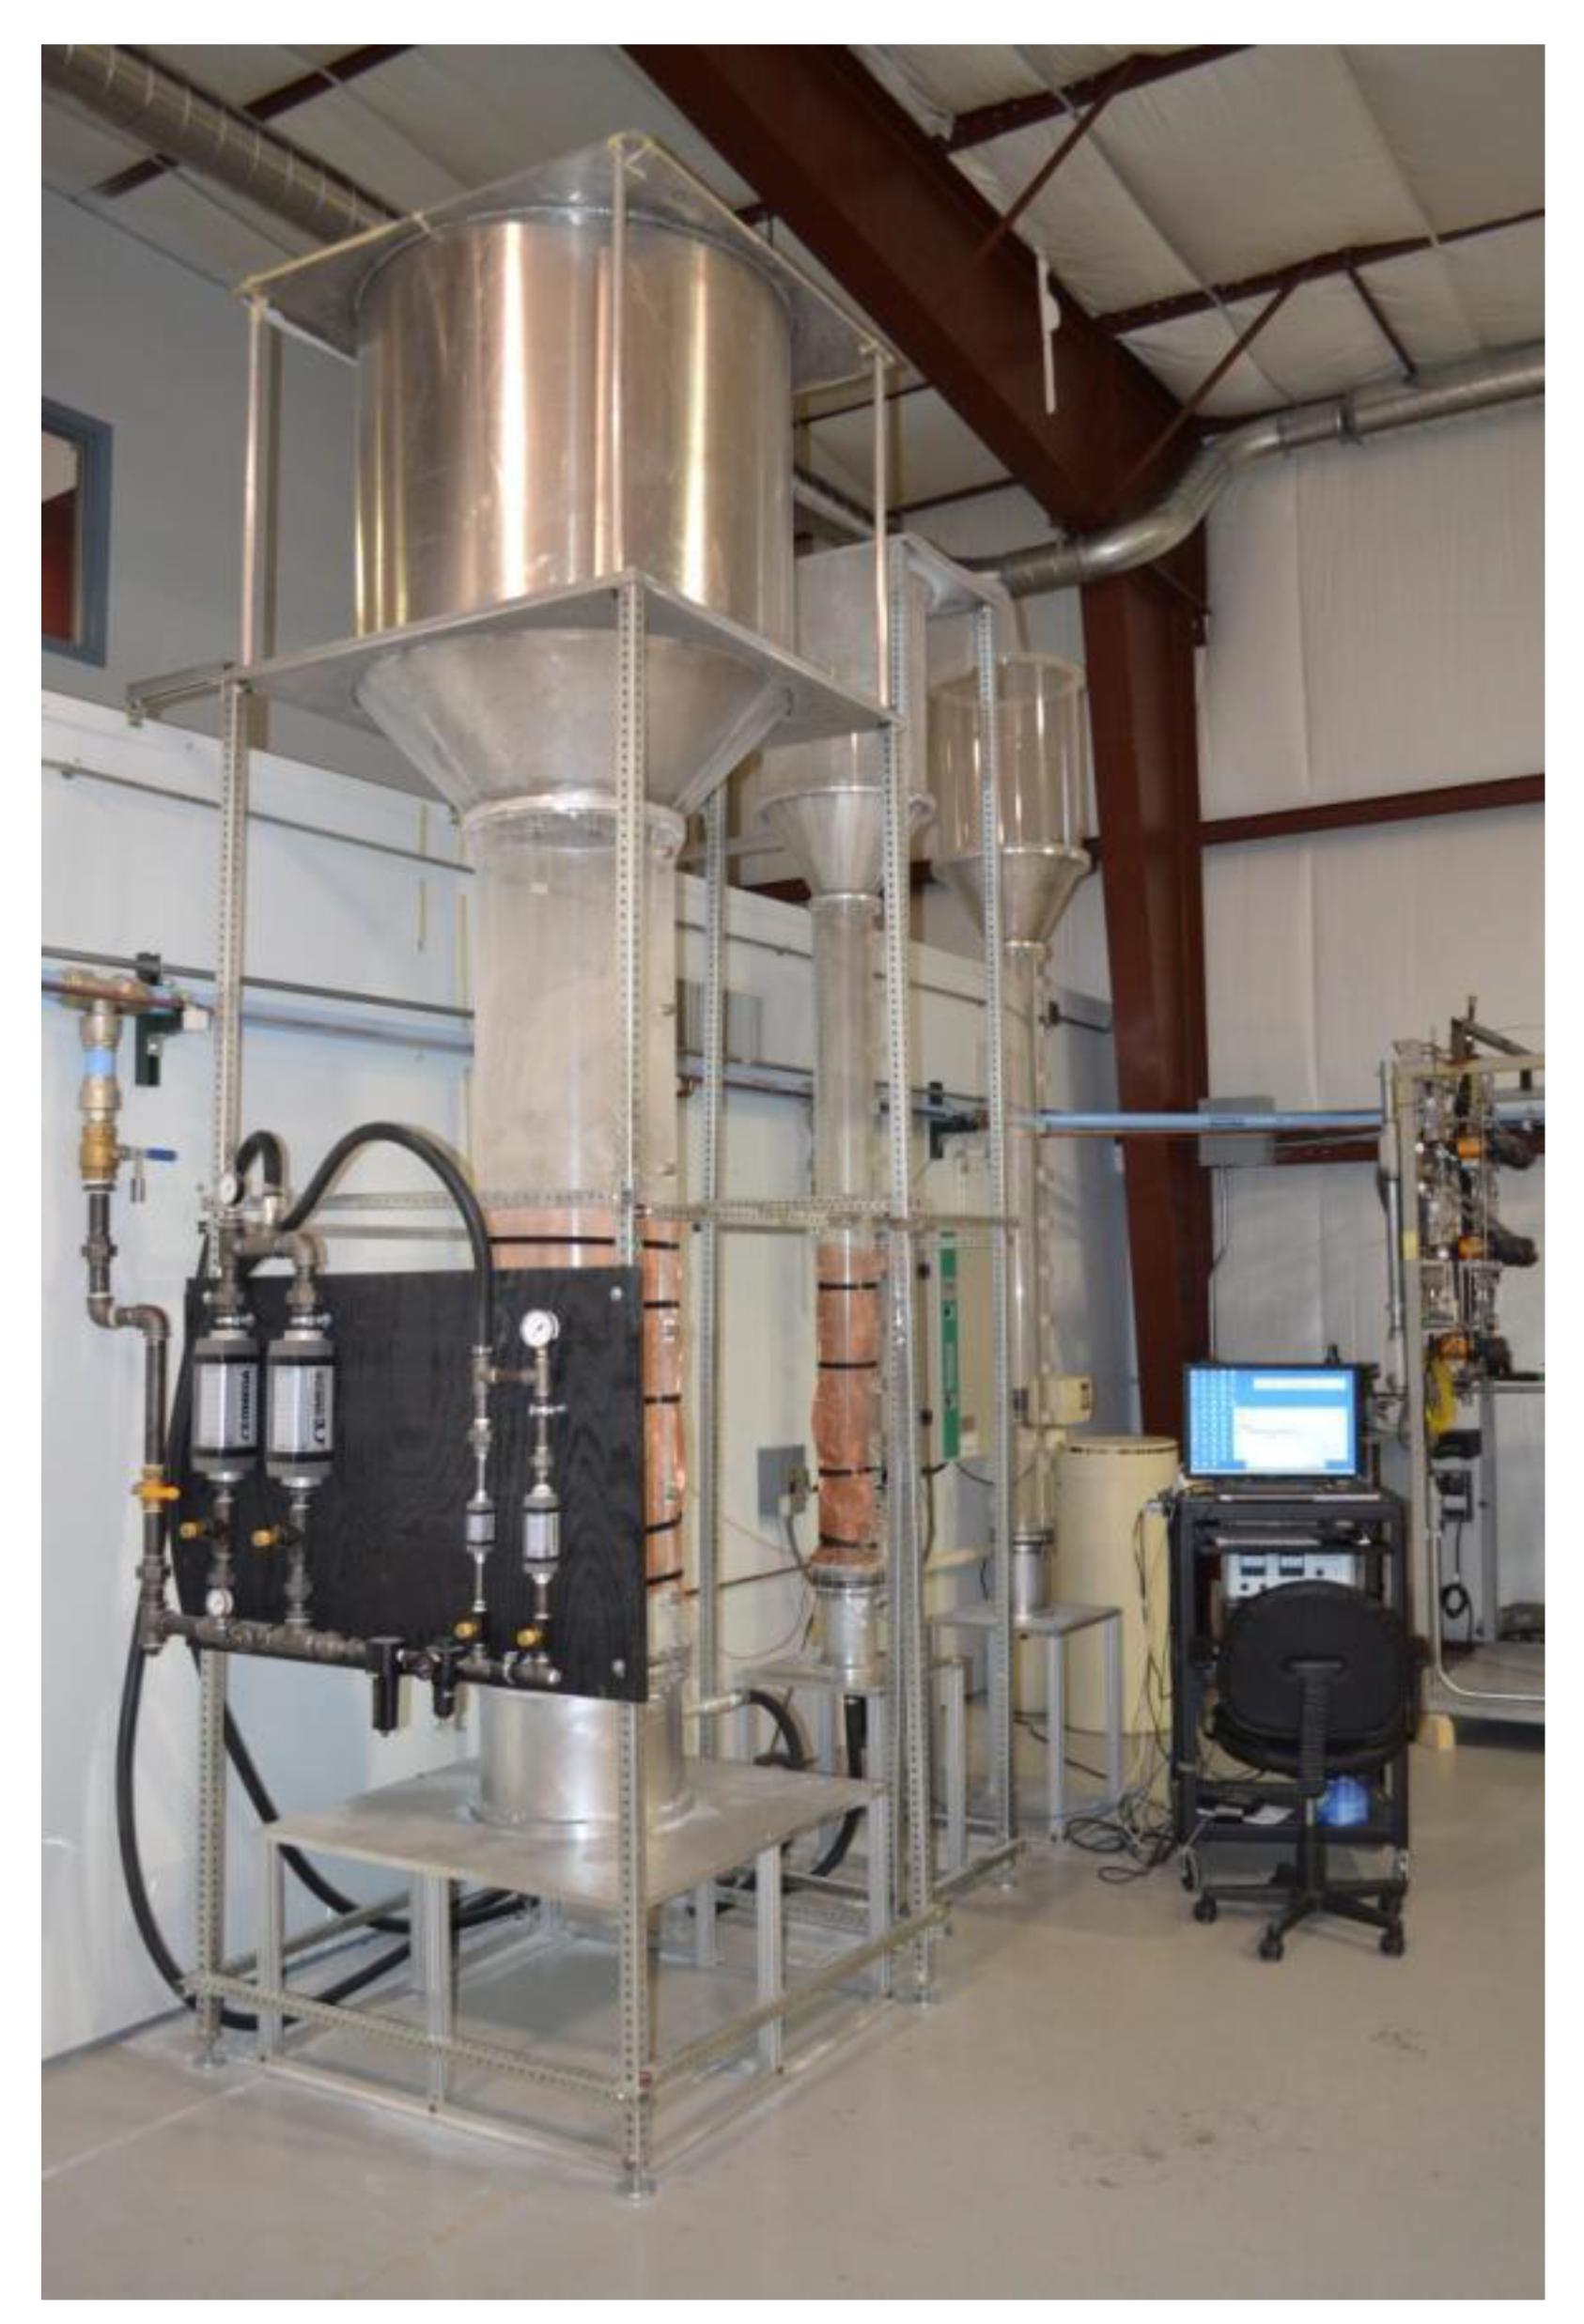
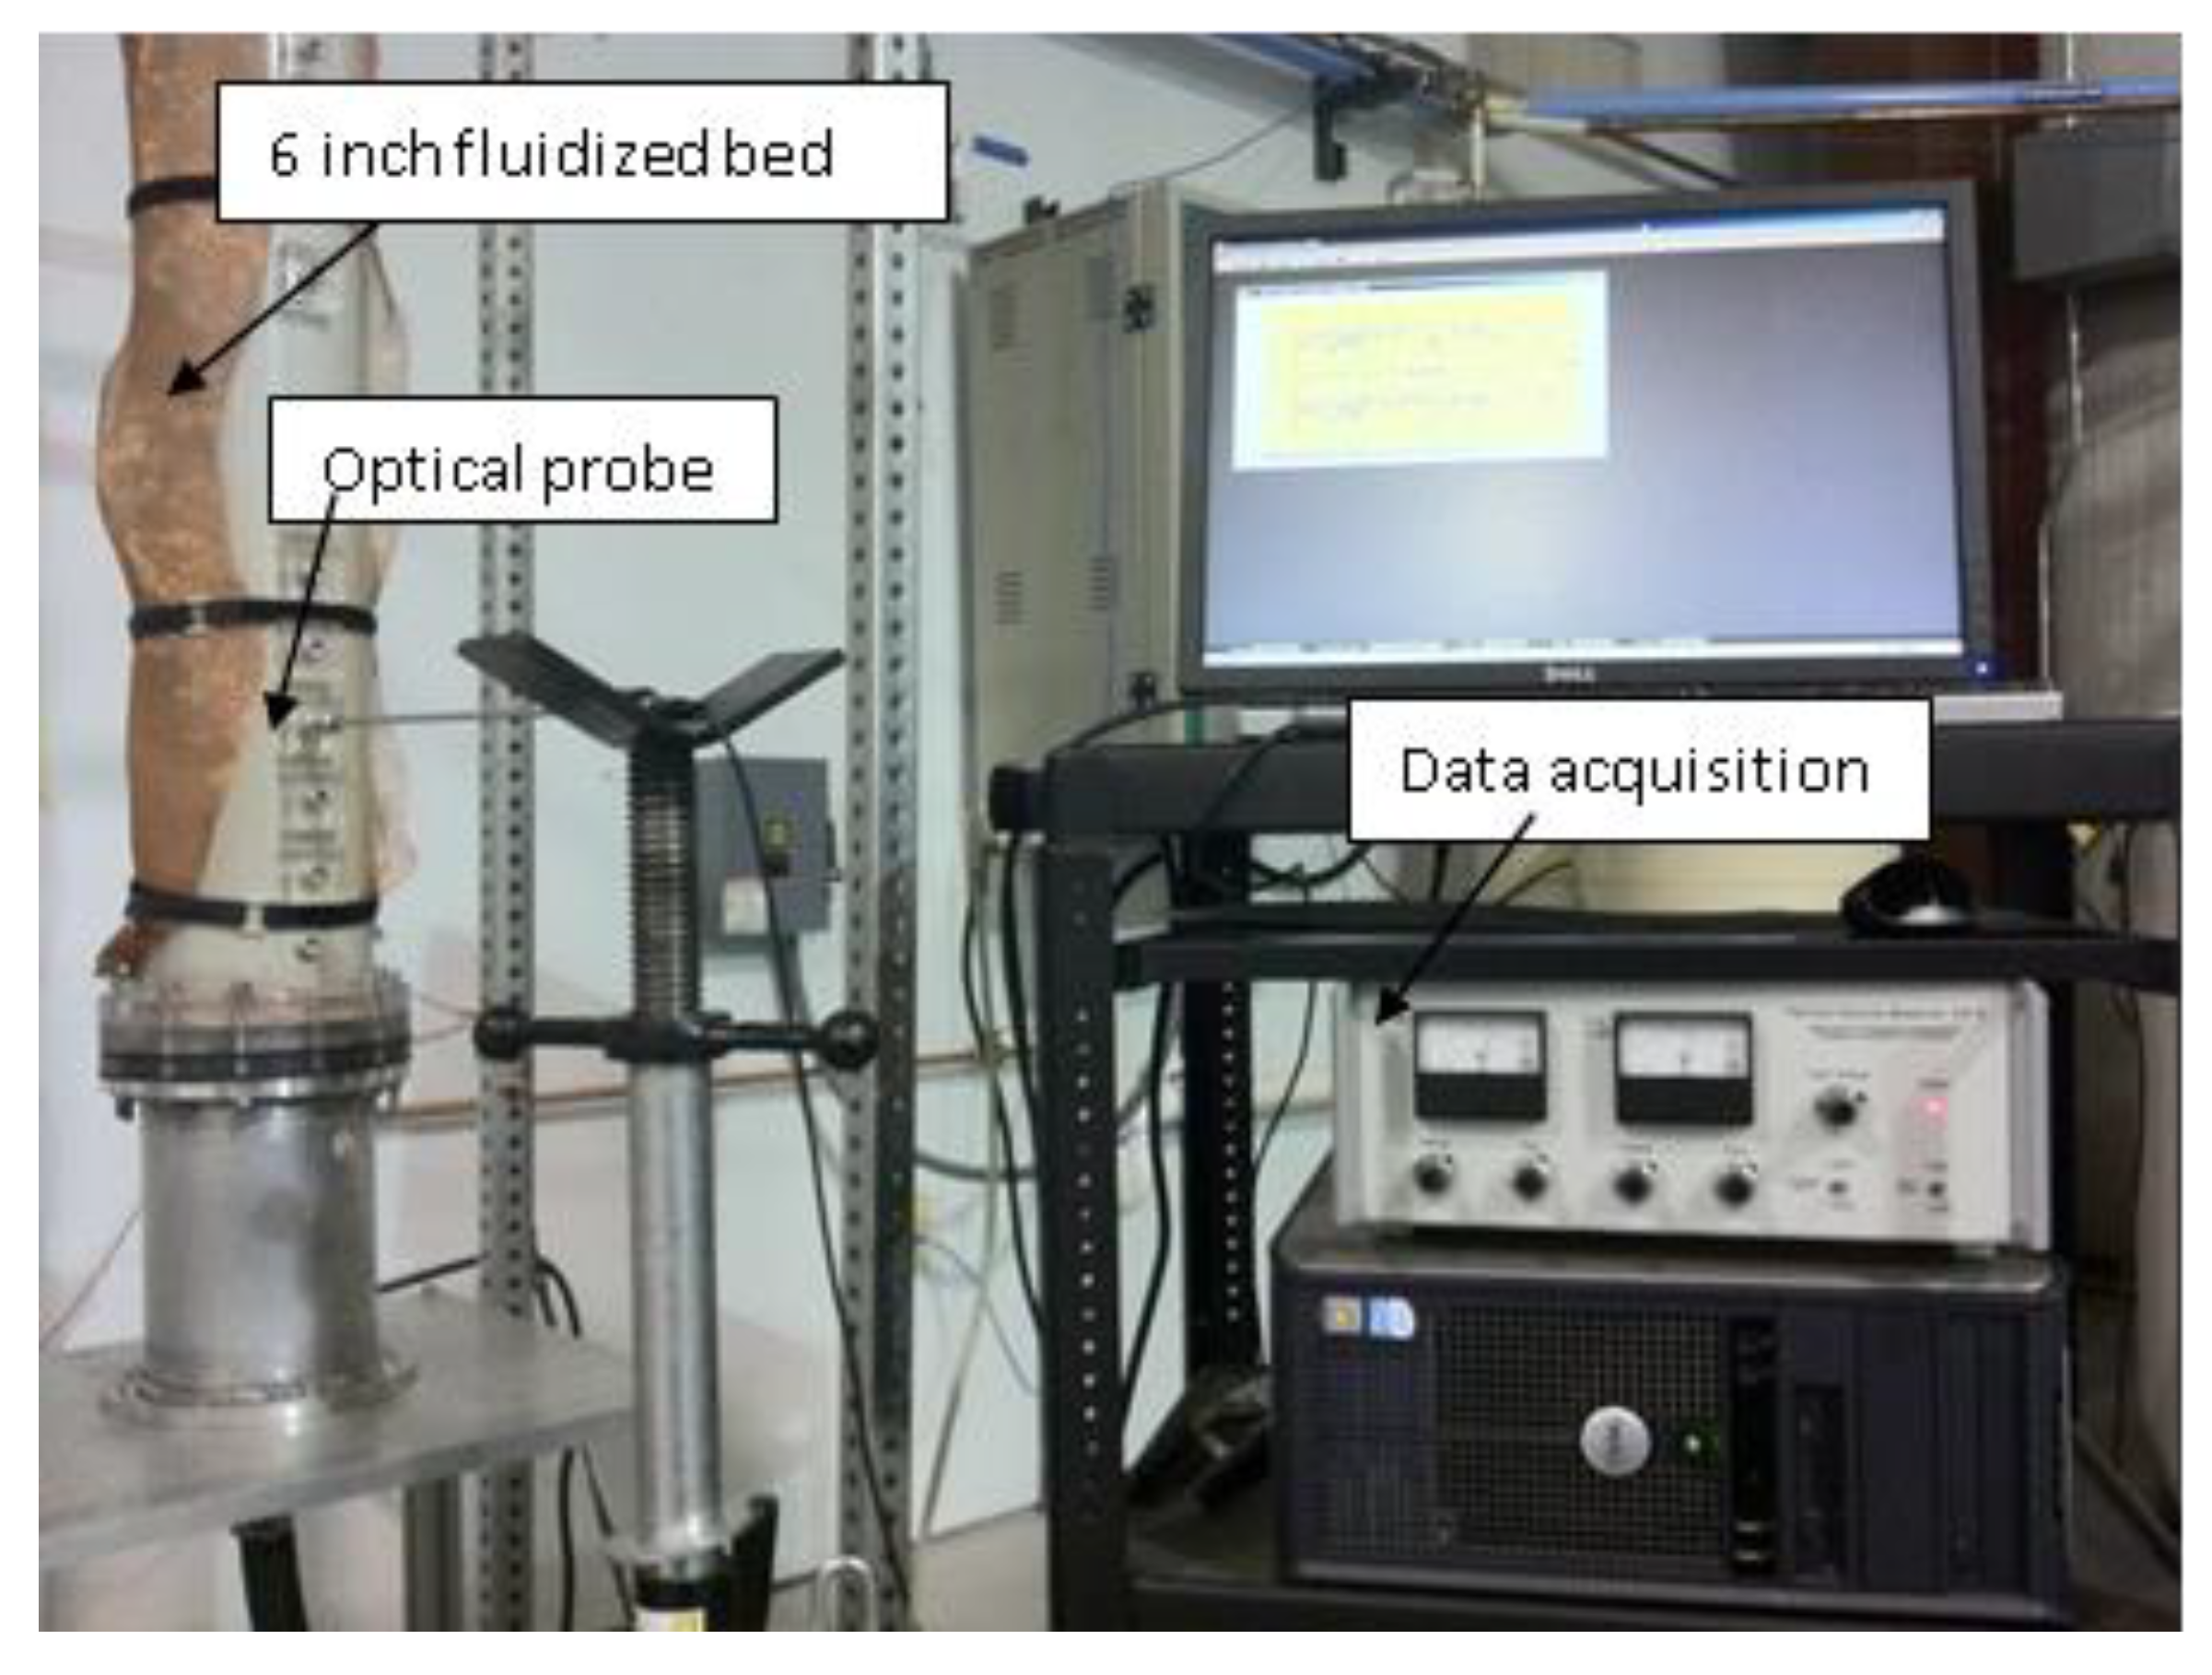
Figure 3 shows the photo of the set-up in the lab. Both fluidized bed columns contained ports at different axial heights (see Figure 1) to aid in axial measurements. Compressed air was used as the gas phase, and it was supplied by an industrial-scale, high-capacity air compressor (The compressor was a two-stage rotary screw type air compressor, which could deliver compressed air of 735 cfm capacity at a pressure up to 200 psig). The solids phase used glass beads of sizes 210 μm and 70μm (Geldart B), with a density of 2500 Kg/m3, and copper particles 200 μm (Geldart B) in size, with a density of 5300 Kg/m3. Copper was used to examine the influence of particle sphericity and also to mimic coal particles.
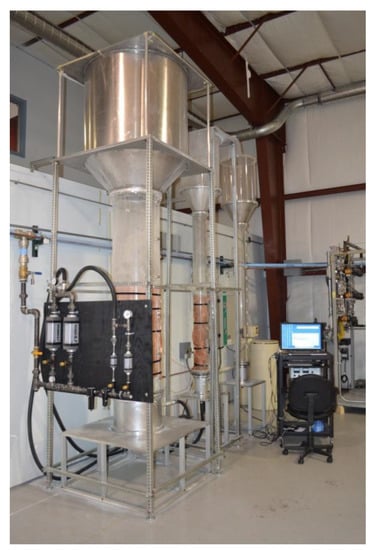
Figure 3.
Photo of the two fluidized beds set-up along with the air flow system used in this work.
2.2. Measurement Techniques
2.2.1. Optical Probe
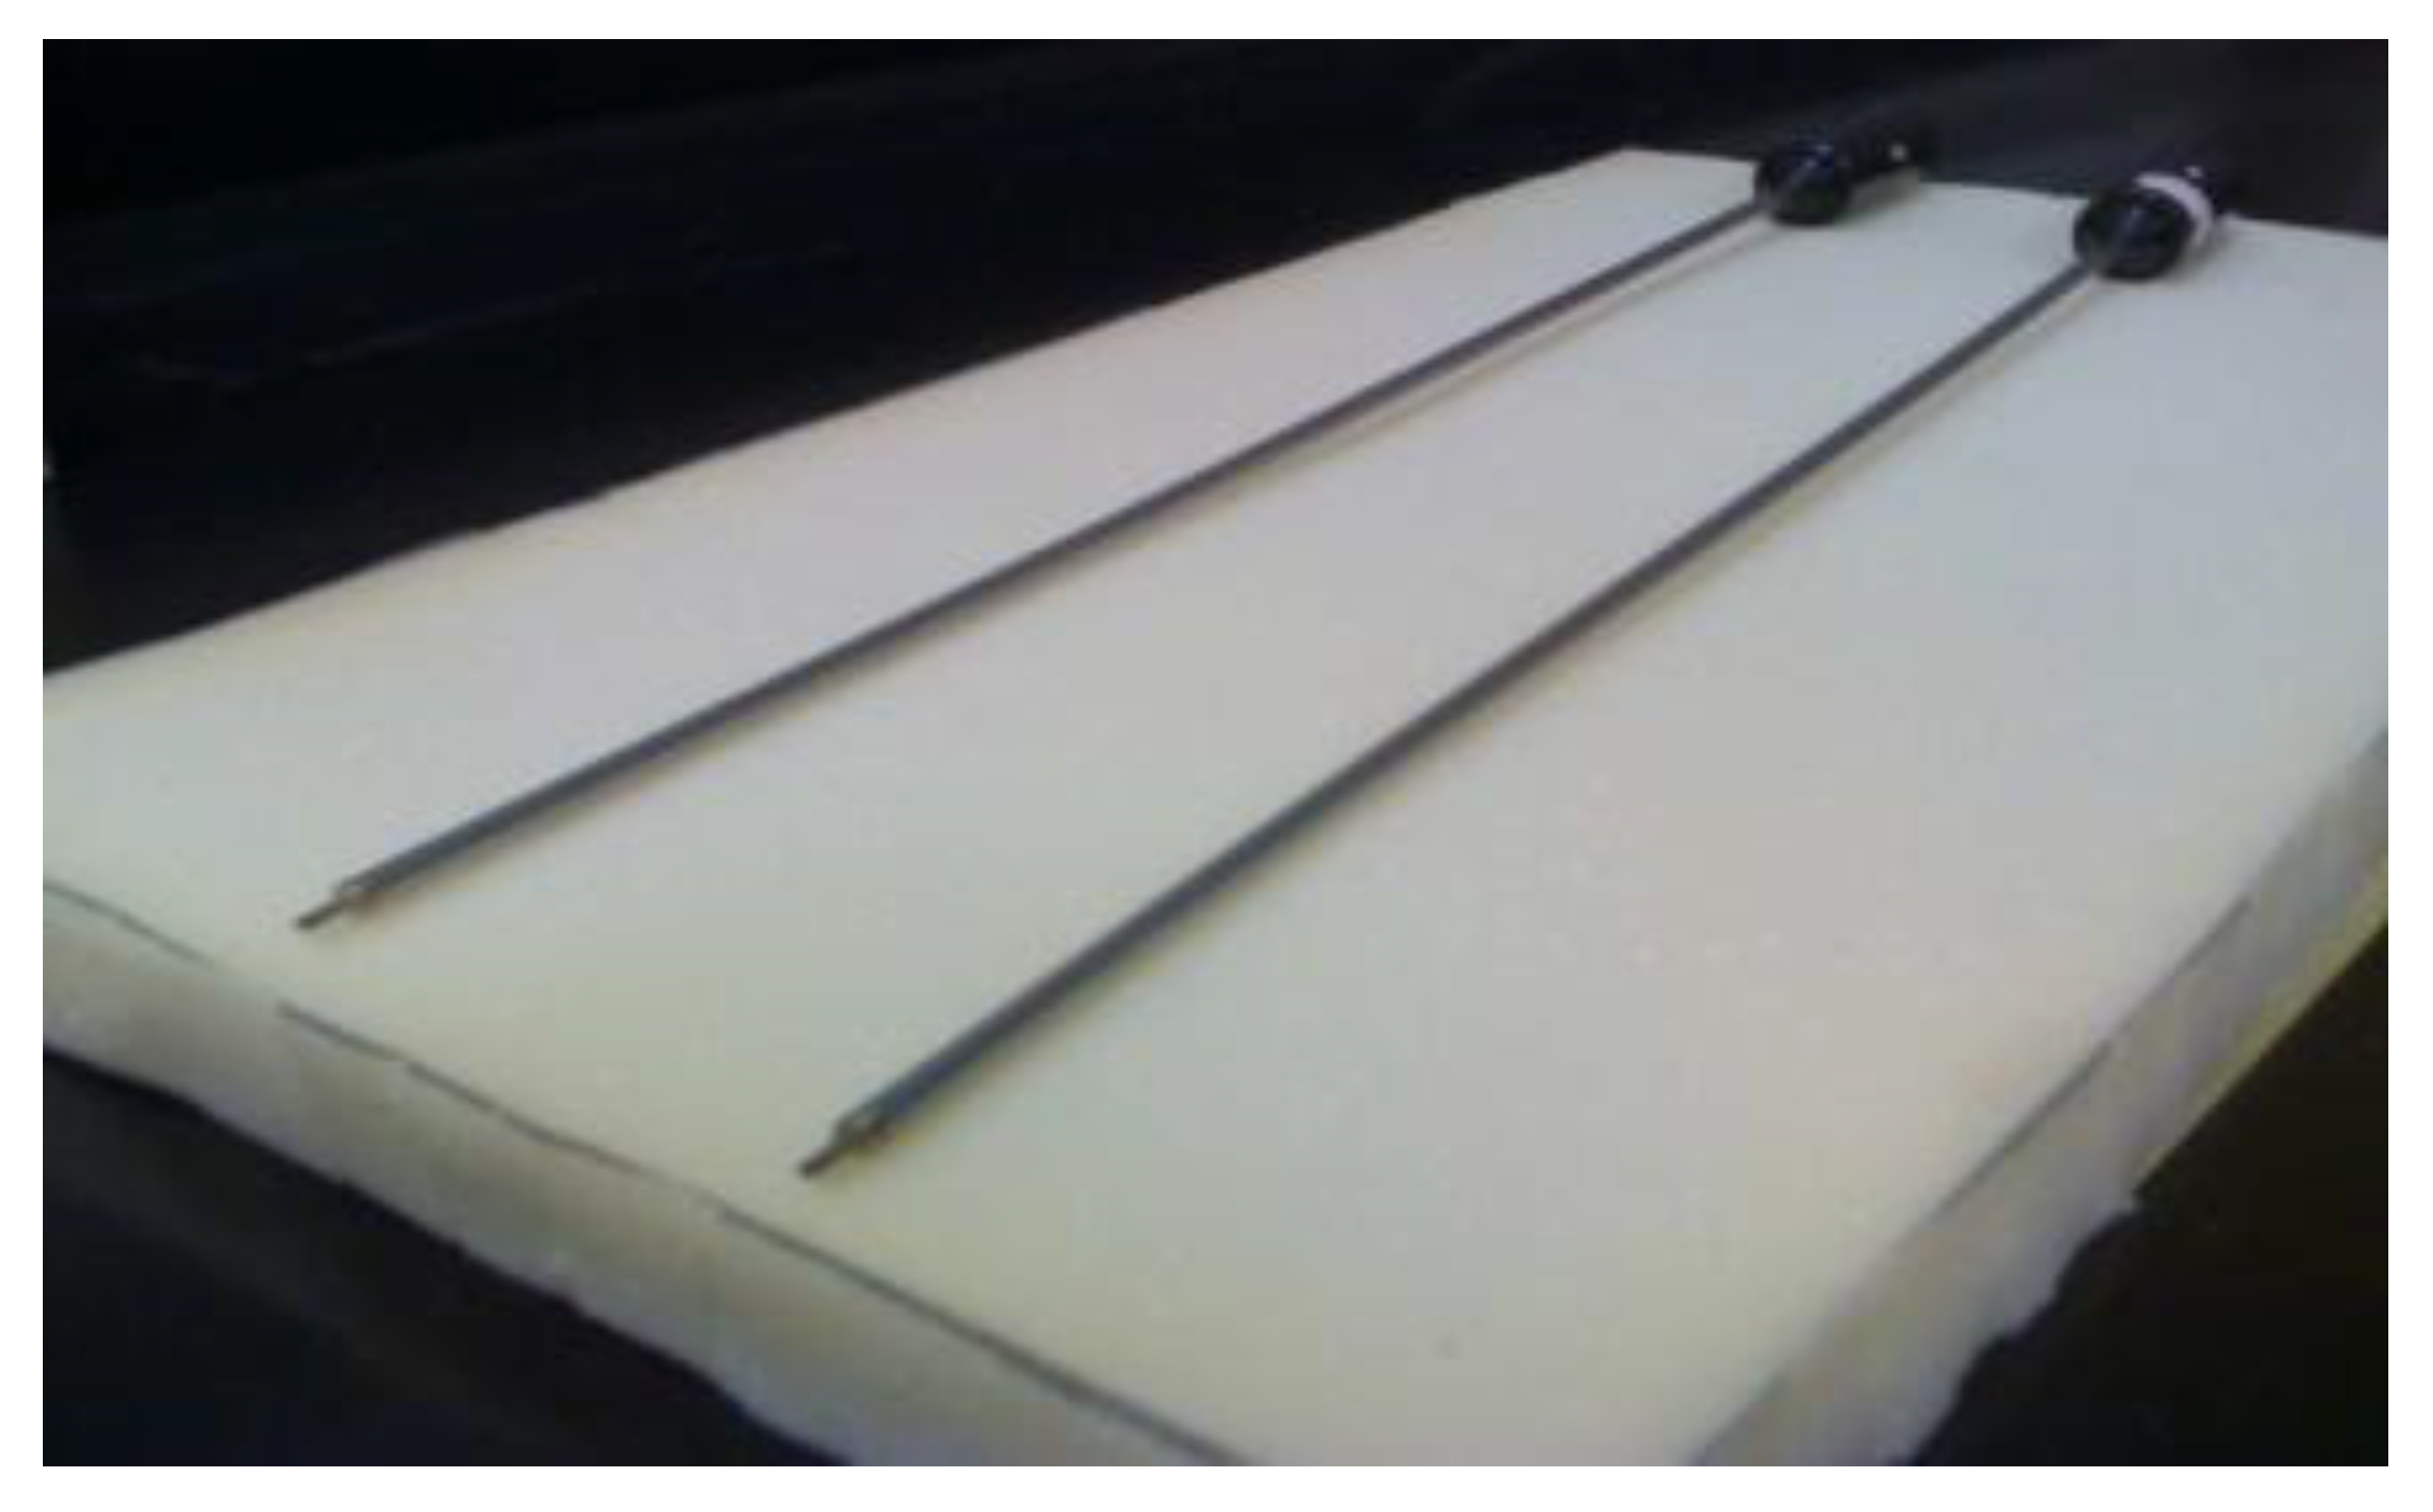
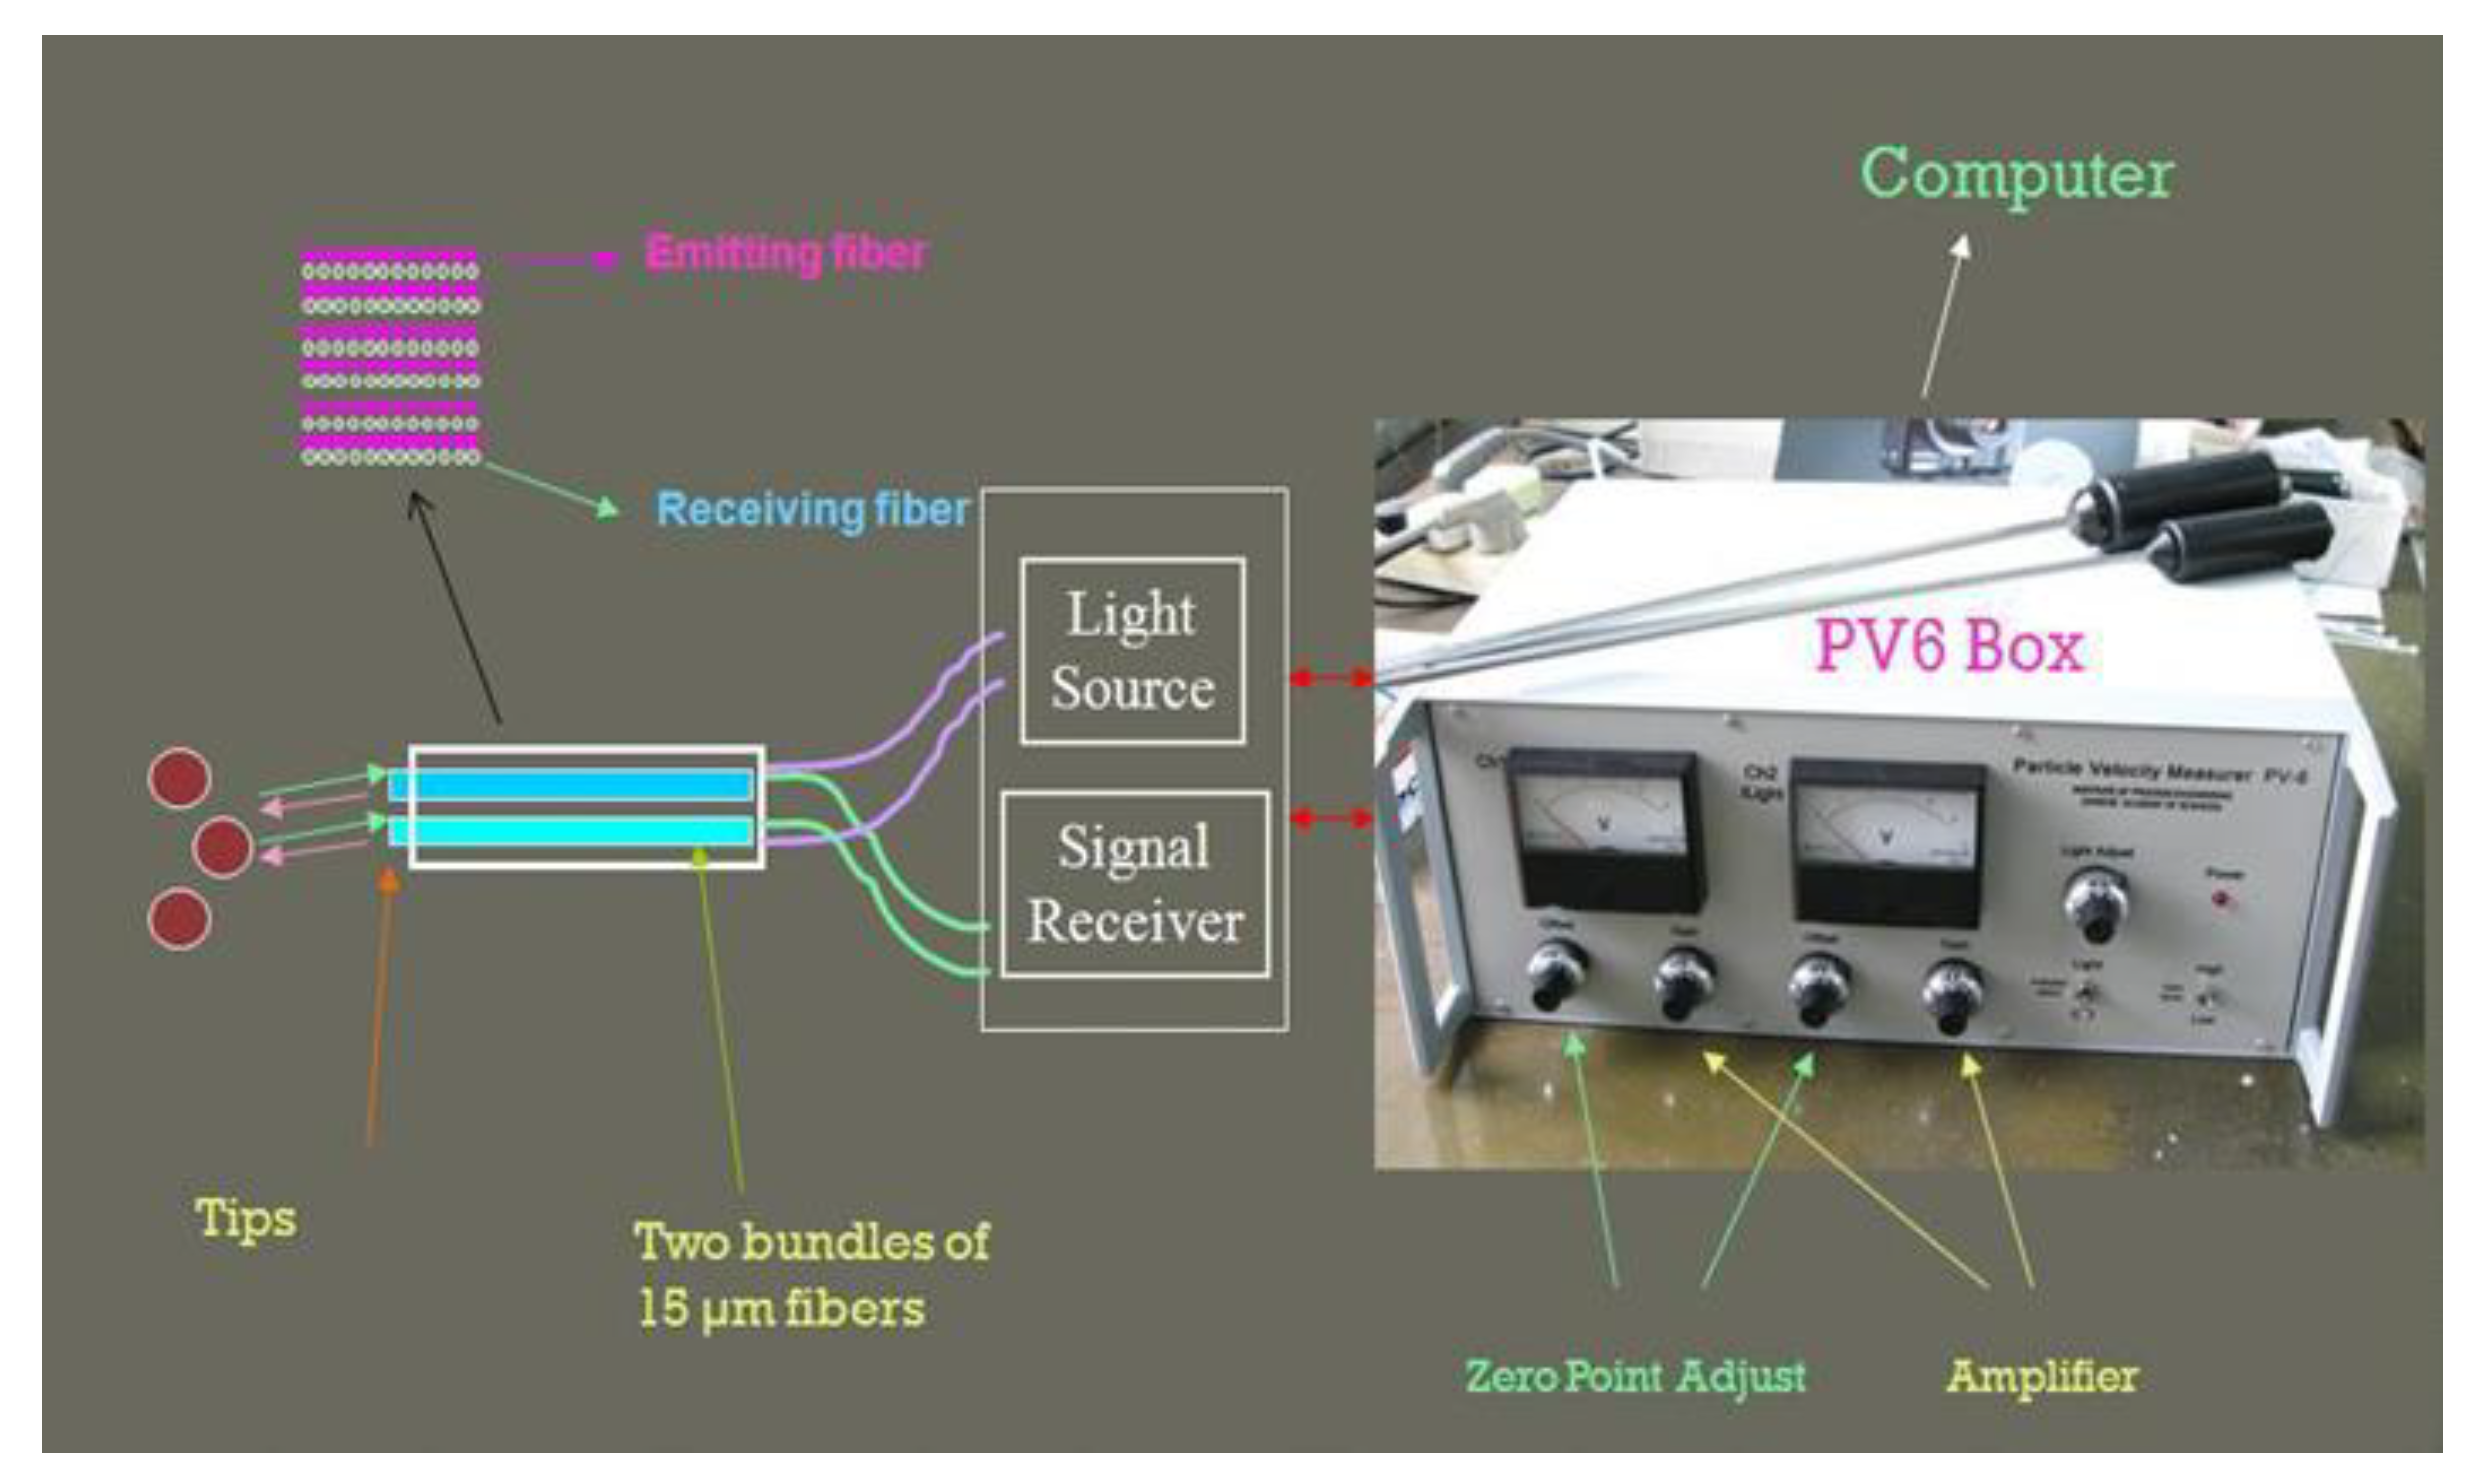
In general, the optical probe technique has been widely used in recent years to measure velocity and/or the volume fraction of particles in gas–solid systems. The optical probe has a fast response, is relatively inexpensive, and is reliably accurate, making it a technique used by many researchers. The optical probe technique developed by [34] was used in this study. Optical probes may be classified into single fiber and multifiber probes. The single-fiber type probes have only one fiber, with light being emitted and received after being reflected by particles of the same fiber [35]. The multifiber probes contain hundreds or even thousands of optical fibers arranged in precision [35]. Some of them are light emitting, while others are for light reception. The multifiber optical probes have the advantages of simultaneously measuring solids volume fraction, velocity, and their fluctuations. Their small size does not considerably disturb the overall flow structure and allows for rapid and sensitive measurement. These probes also measure from very dilute to very dense conditions [35]. Most importantly, they are nearly free from interference by temperature, humidity, electrostatics, and electromagnetic fields. The optical probe (PV6) used in the present study (shown in Figure 4) is a multifiber probe developed in collaboration with the Chinese Academy of Sciences. Optical fiber probes consist of two channels/tips of optical fibers where each channel consists of thousands of optical fibers that can emit and reflect light arranged parallel to one another. The arrangement is such that one layer consists of light-emitting fibers, and the layer next to it consists of light receiving fibers. Each fiber in the optical probe is approximately 15 μm in diameter. The probe size used in this study was 1.93 mm which was larger than the particle size proposed in this study.
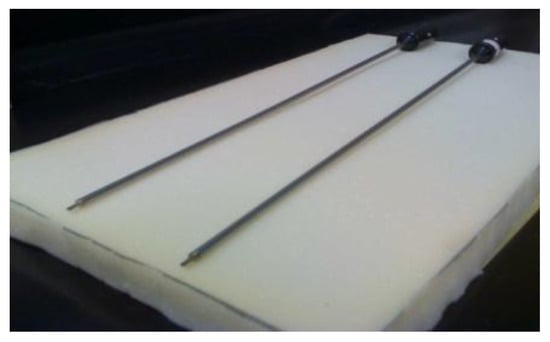
Figure 4.
Optical Probe (PV6) System (Institute of Process Engineering of the Chinese Academy of Sciences).
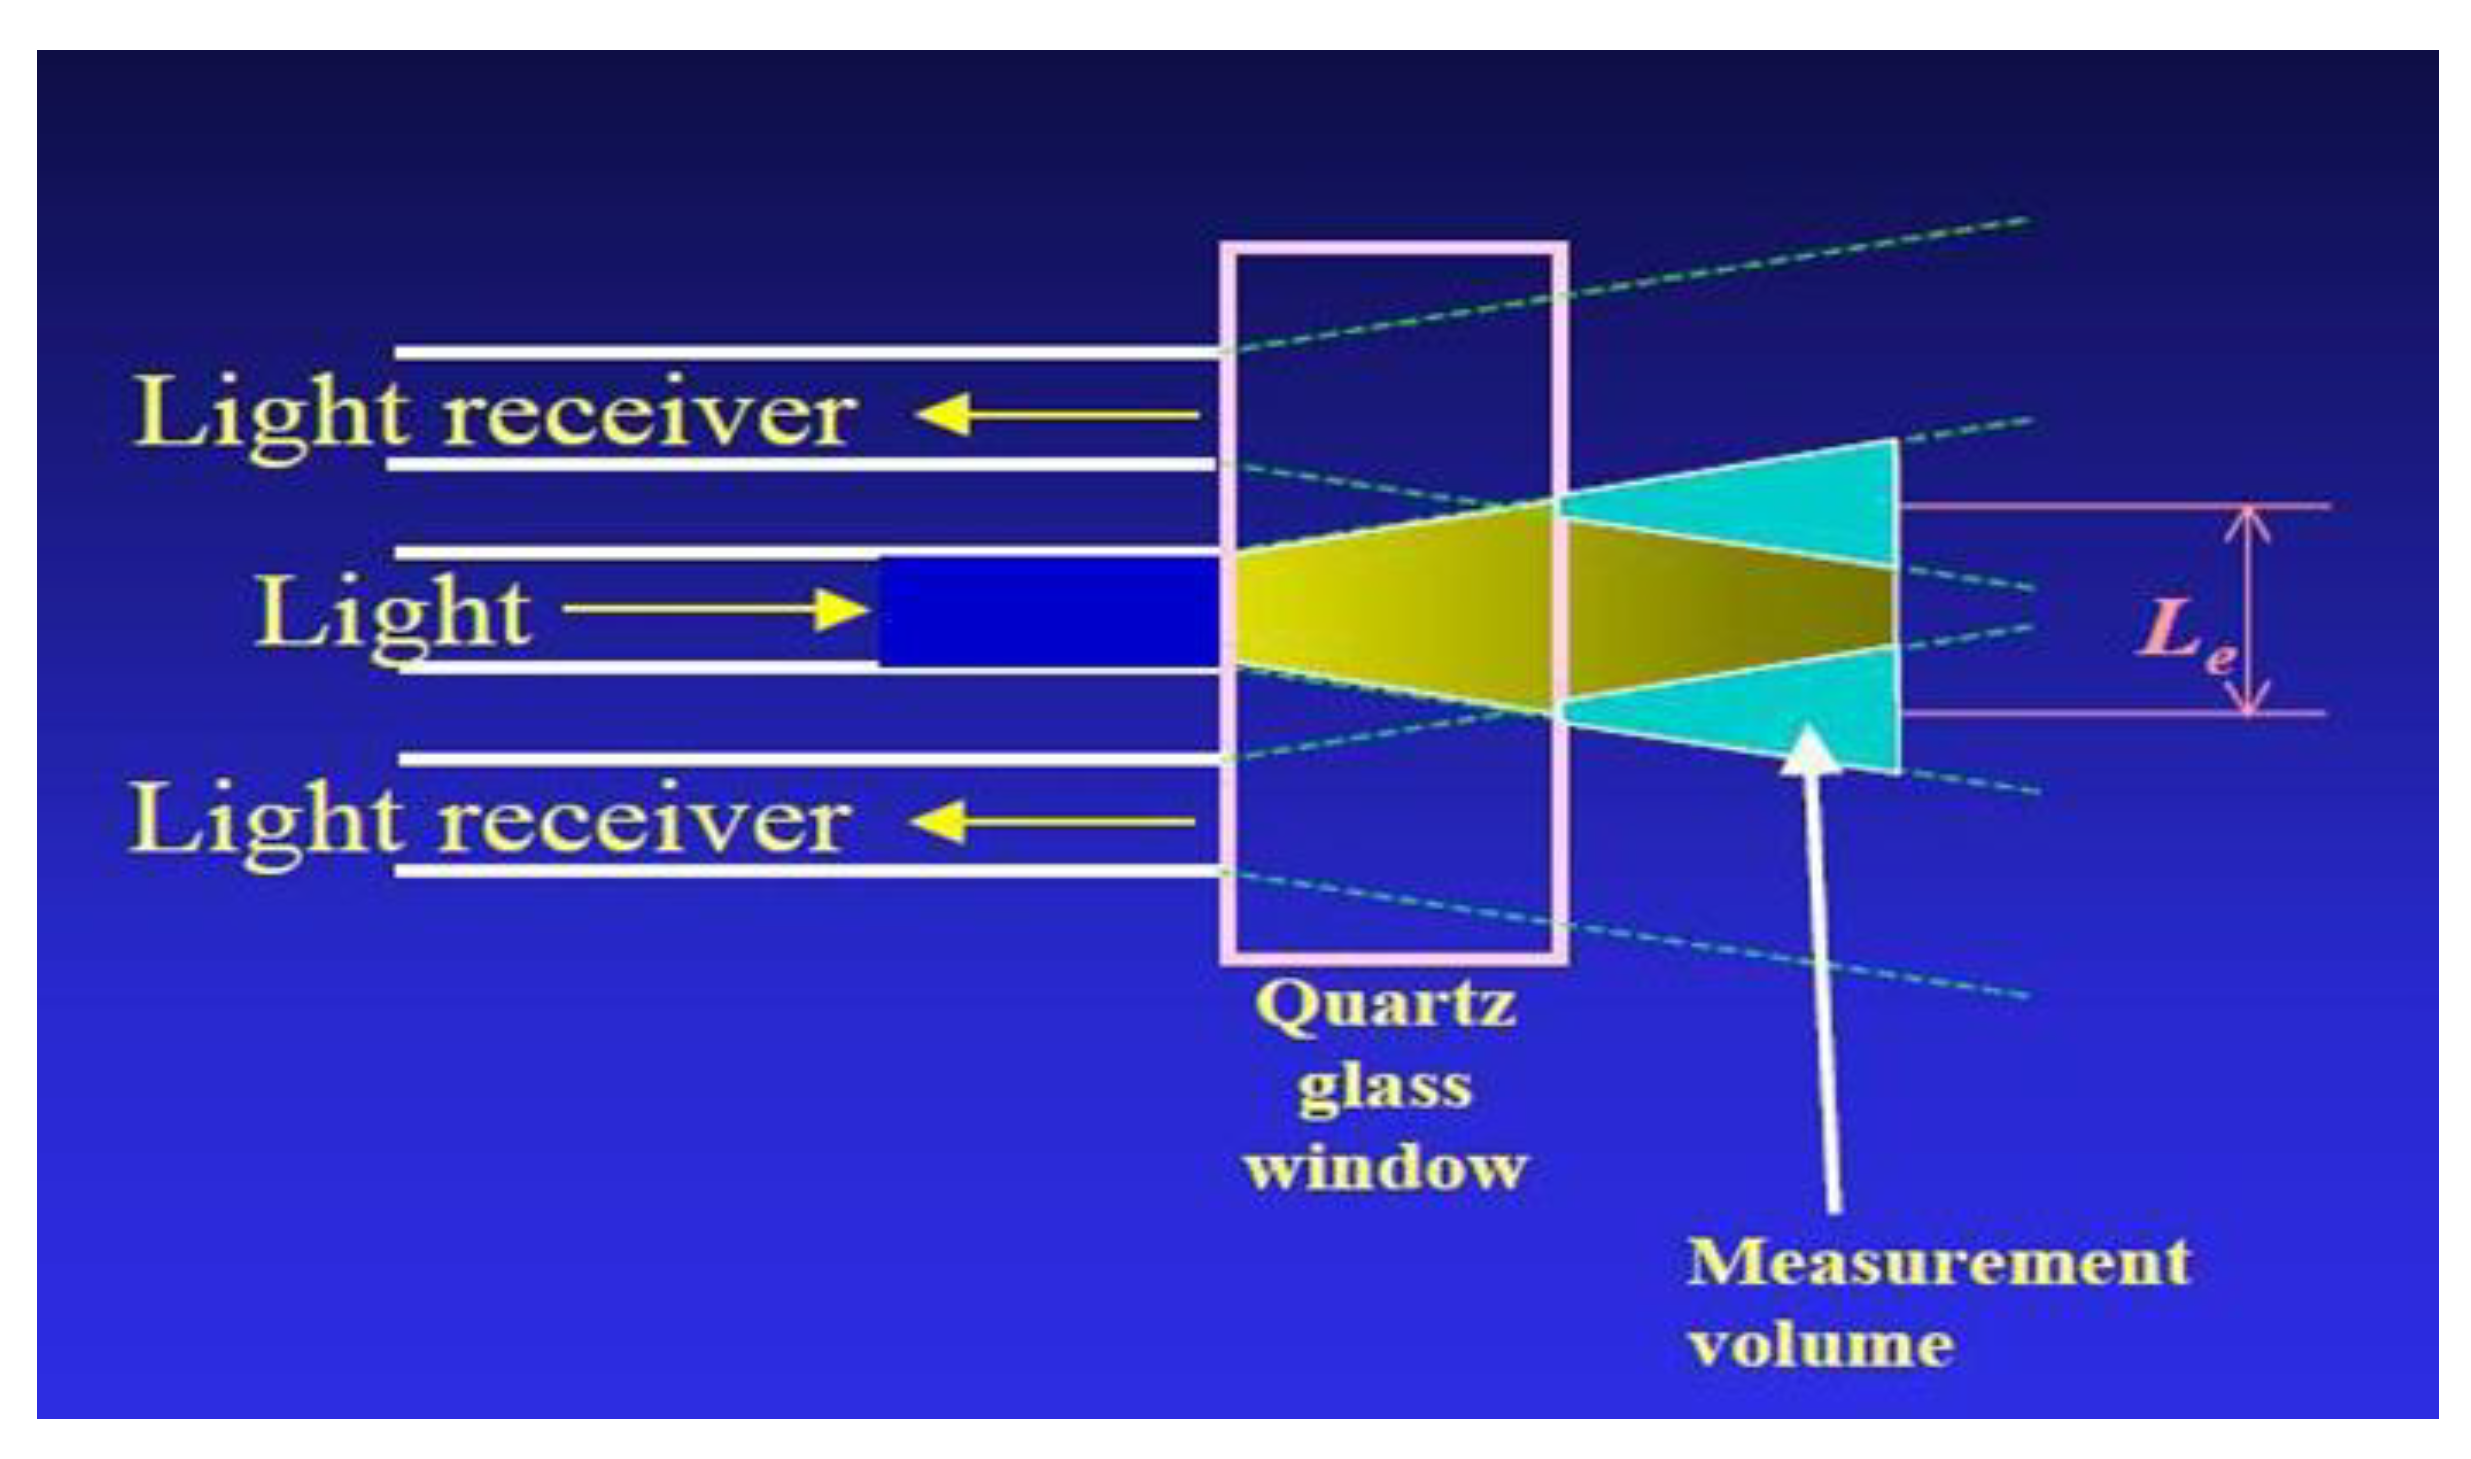
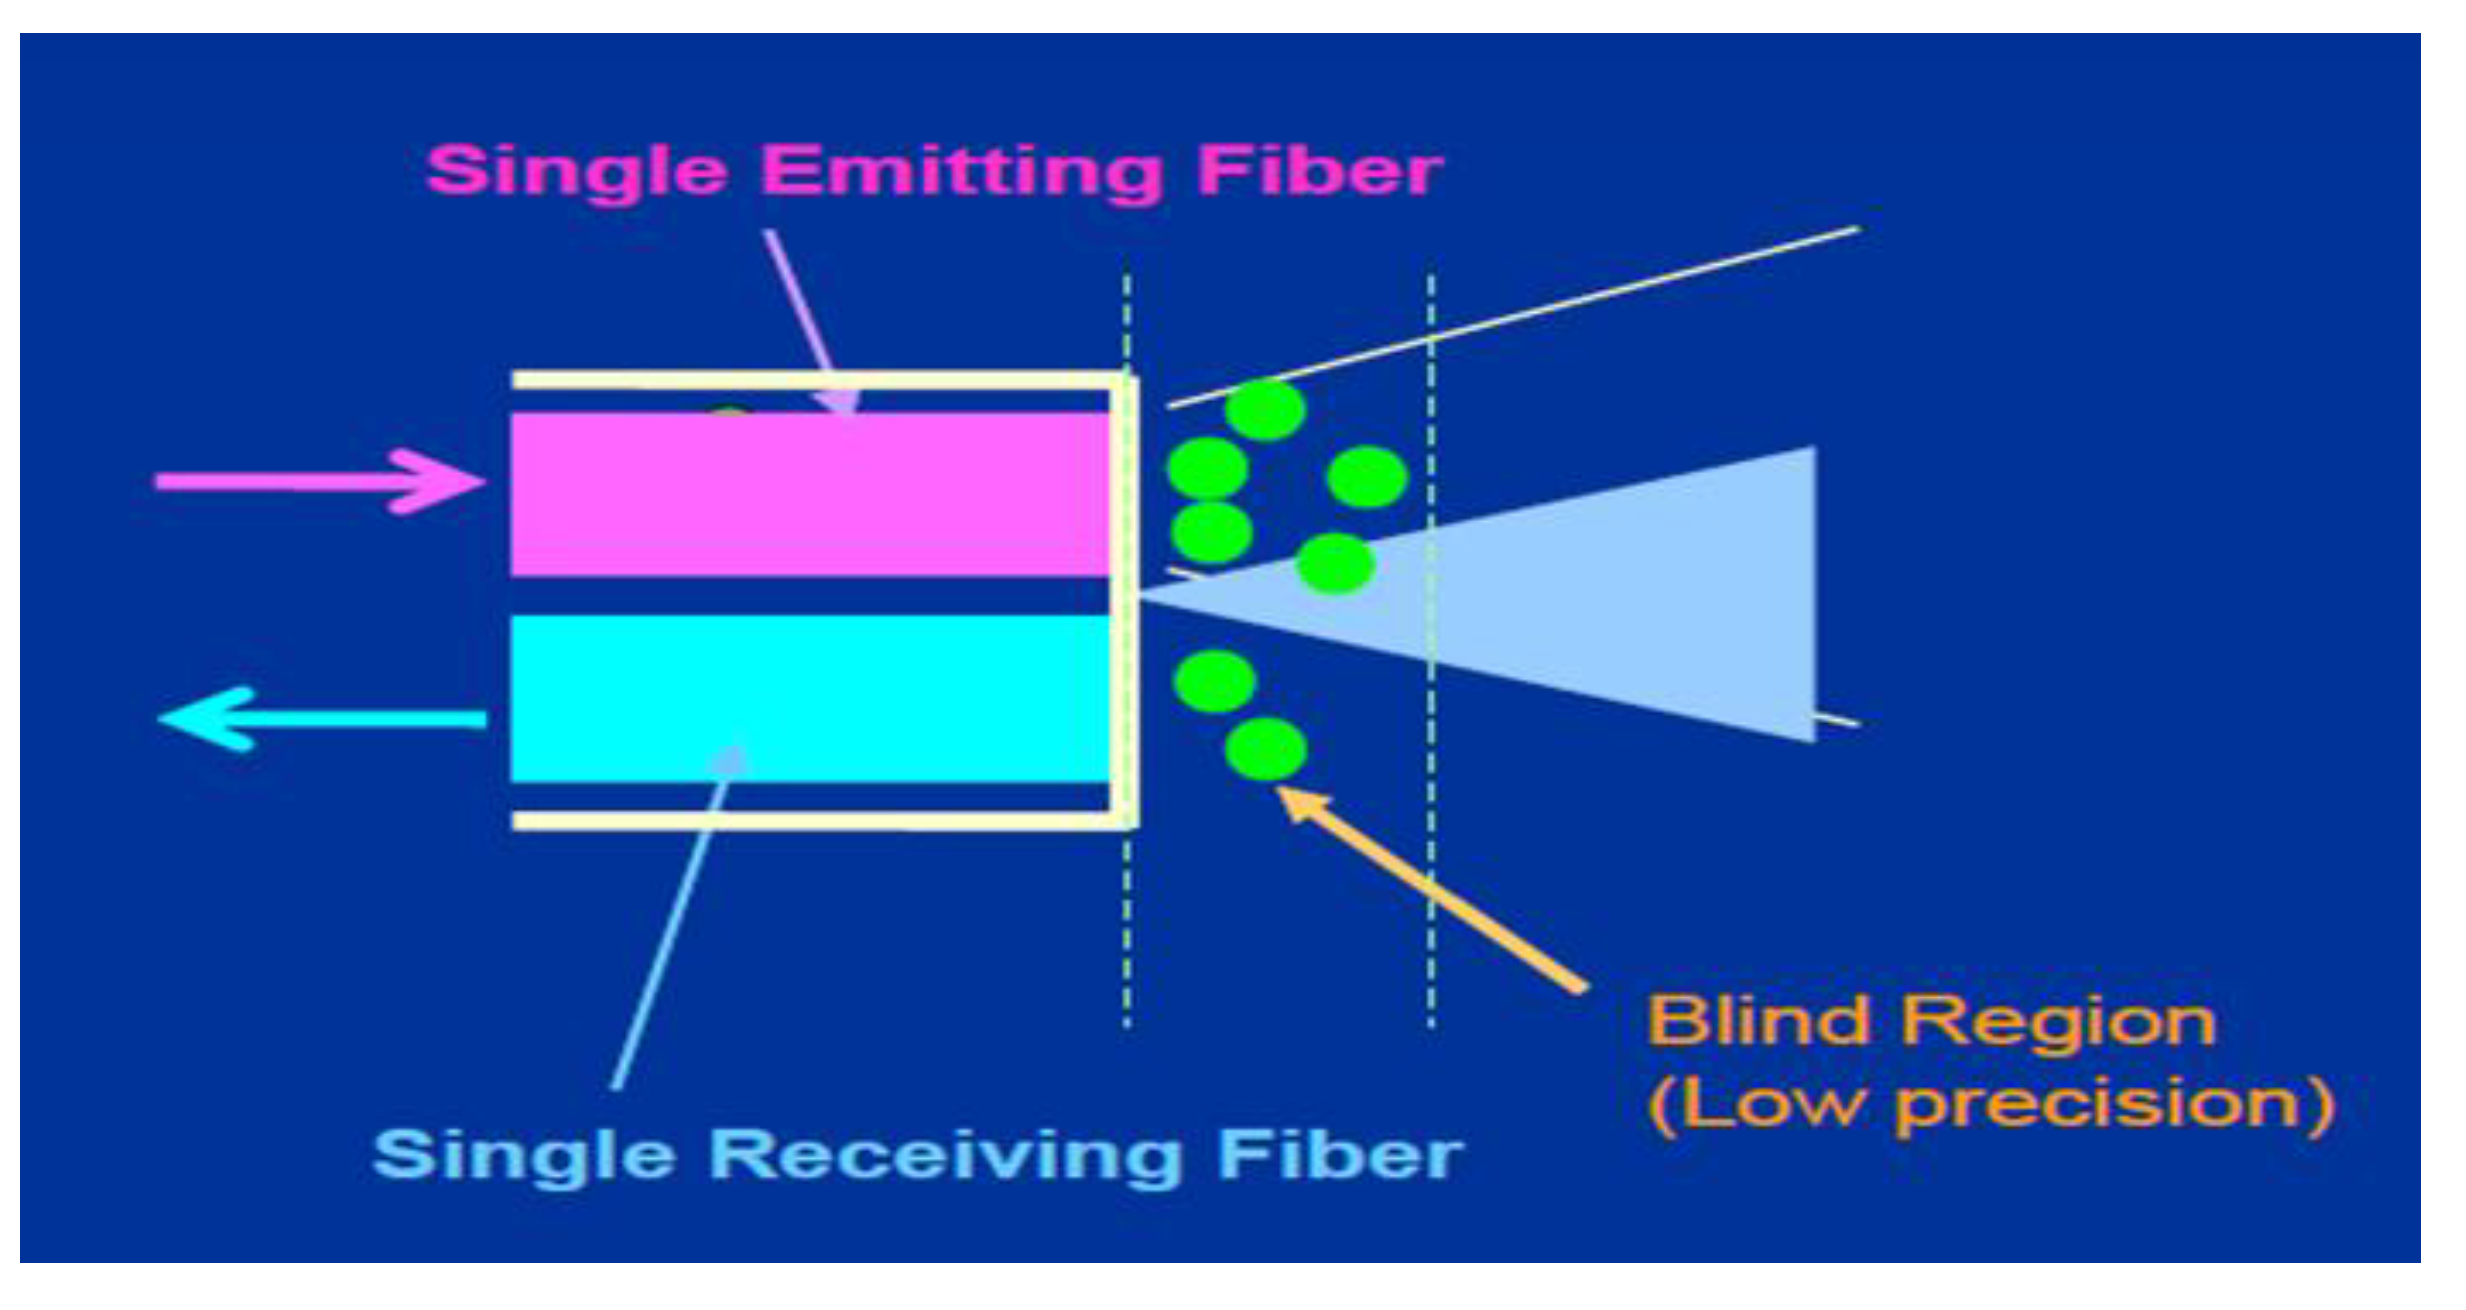
These probes are more precise in their measurement due to the elimination of a blind region. The tips of the probe are covered with a quartz window (see Figure 5), which eliminates the blind region [36]. The old probes that had the problem of a blind region (Figure 6) had less measuring volume, leading to faulty measurements. These blind zones acted as dead zones, thereby reducing the intensity of the reflected light and also providing a nonlinear response. All these drawbacks were addressed in the new probes (PV6).
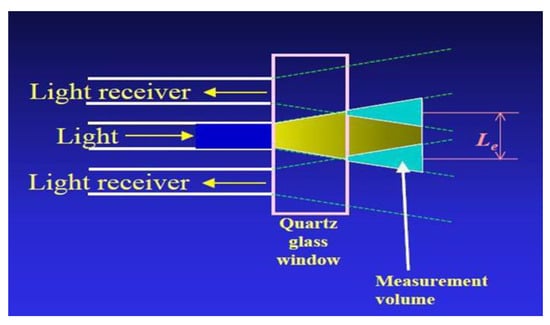
Figure 5.
New Optical Probe with a Quartz Window That Eliminates the Blind Region (Institute of Process Engineering of the Chinese Academy of Sciences).
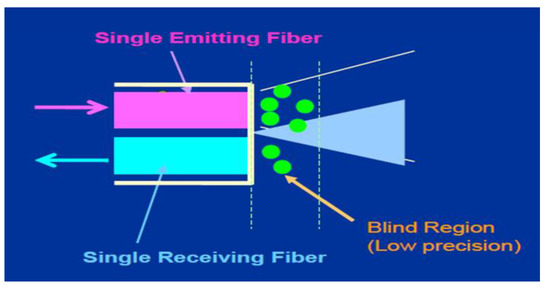
Figure 6.
Presence of the Blind Region in Old Optical Probes Marked by Poor Measuring Volume and Low Reflected Light Intensity (Institute of Process Engineering of the Chinese Academy of Sciences).
The PV6 particle velocity analyzer is an instrument for multiphase flow measurement, which is mainly used in the measurement of particle velocity in gas–solid and liquid–solid systems. The instrument has the following features: (1) it measures average velocity, instantaneous value, and the statistical distribution of particles in two-phase flow systems; (2) it measures the relative concentration (C) of moving particulate materials; and (3) it measures the frequency and velocity in gas–solid two-phase flow systems.
The selection of probes for the experiment is also important. At our laboratory, we use one of four optical probes, depending on the size of the particles being used. For the measurement of solids concentration, the probe size should be greater than or equal to twice the size of the particle under study. For the measurement of solids velocity, the probe size should be equal to the size of the particle under study. The particles used should have good reflective properties and should not be black or corrosive.
2.2.2. Optical Probe Electronics
The particle velocity analyzer, PV6, (see Figure 7) consists of optical fiber probes, a photoelectric converter, amplifying circuits, signal pre-processing circuits, a high-speed A/D interface card, and the PV6 software. Four different types of probes are available, which are chosen for measurements depending on the size of the particle under study. Each probe has two tips on the front face, consisting of several layers of light-emitting and -receiving optical fibers. Two or three bundles of optical fibers with diameters of 0.2–0.3 mm are arranged at standard intervals according to the size of the different particles to be measured by the optical probe. The light source is introduced into the measuring area in front of the optical fibers. The light reflecting off the particles at the end of the optical fibers are transferred into the photoelectric detector in the instrument through the same bundle of optical fibers and are converted into voltage signals corresponding to the concentration of particles. The A/D converter of the PV6 (software used for the optical probes) technique has two independent A/D converting paths.
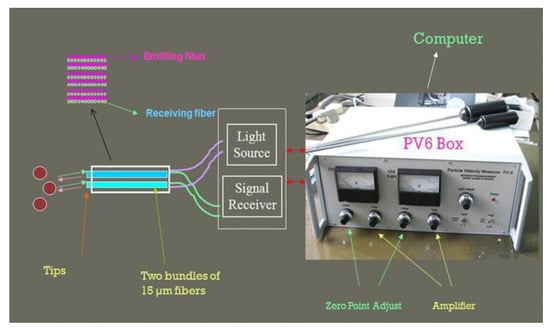
Figure 7.
Electronics of the developed optical probe (PV6) used in the present study for velocity and solids concentration measurements (Institute of Process Engineering of the Chinese Academy of Sciences).
The maximum sampling frequency of each channel is 2000 kHz, and the maximal range of velocity measurement is no less than 25 m/s when the distance between two measuring points is 0.25 mm. The A/D interface card of the PV6 instrument is designed for particle velocity measurement. It has the following features: synchronous and independent A/D conversion of signals from two channels without time delay, 60 Hz to 2 MHz sampling frequency of each channel with adjustable steps, 32–128k × 2 data memory, and a12-bit resolution.
2.2.3. Solids Velocity Measurement
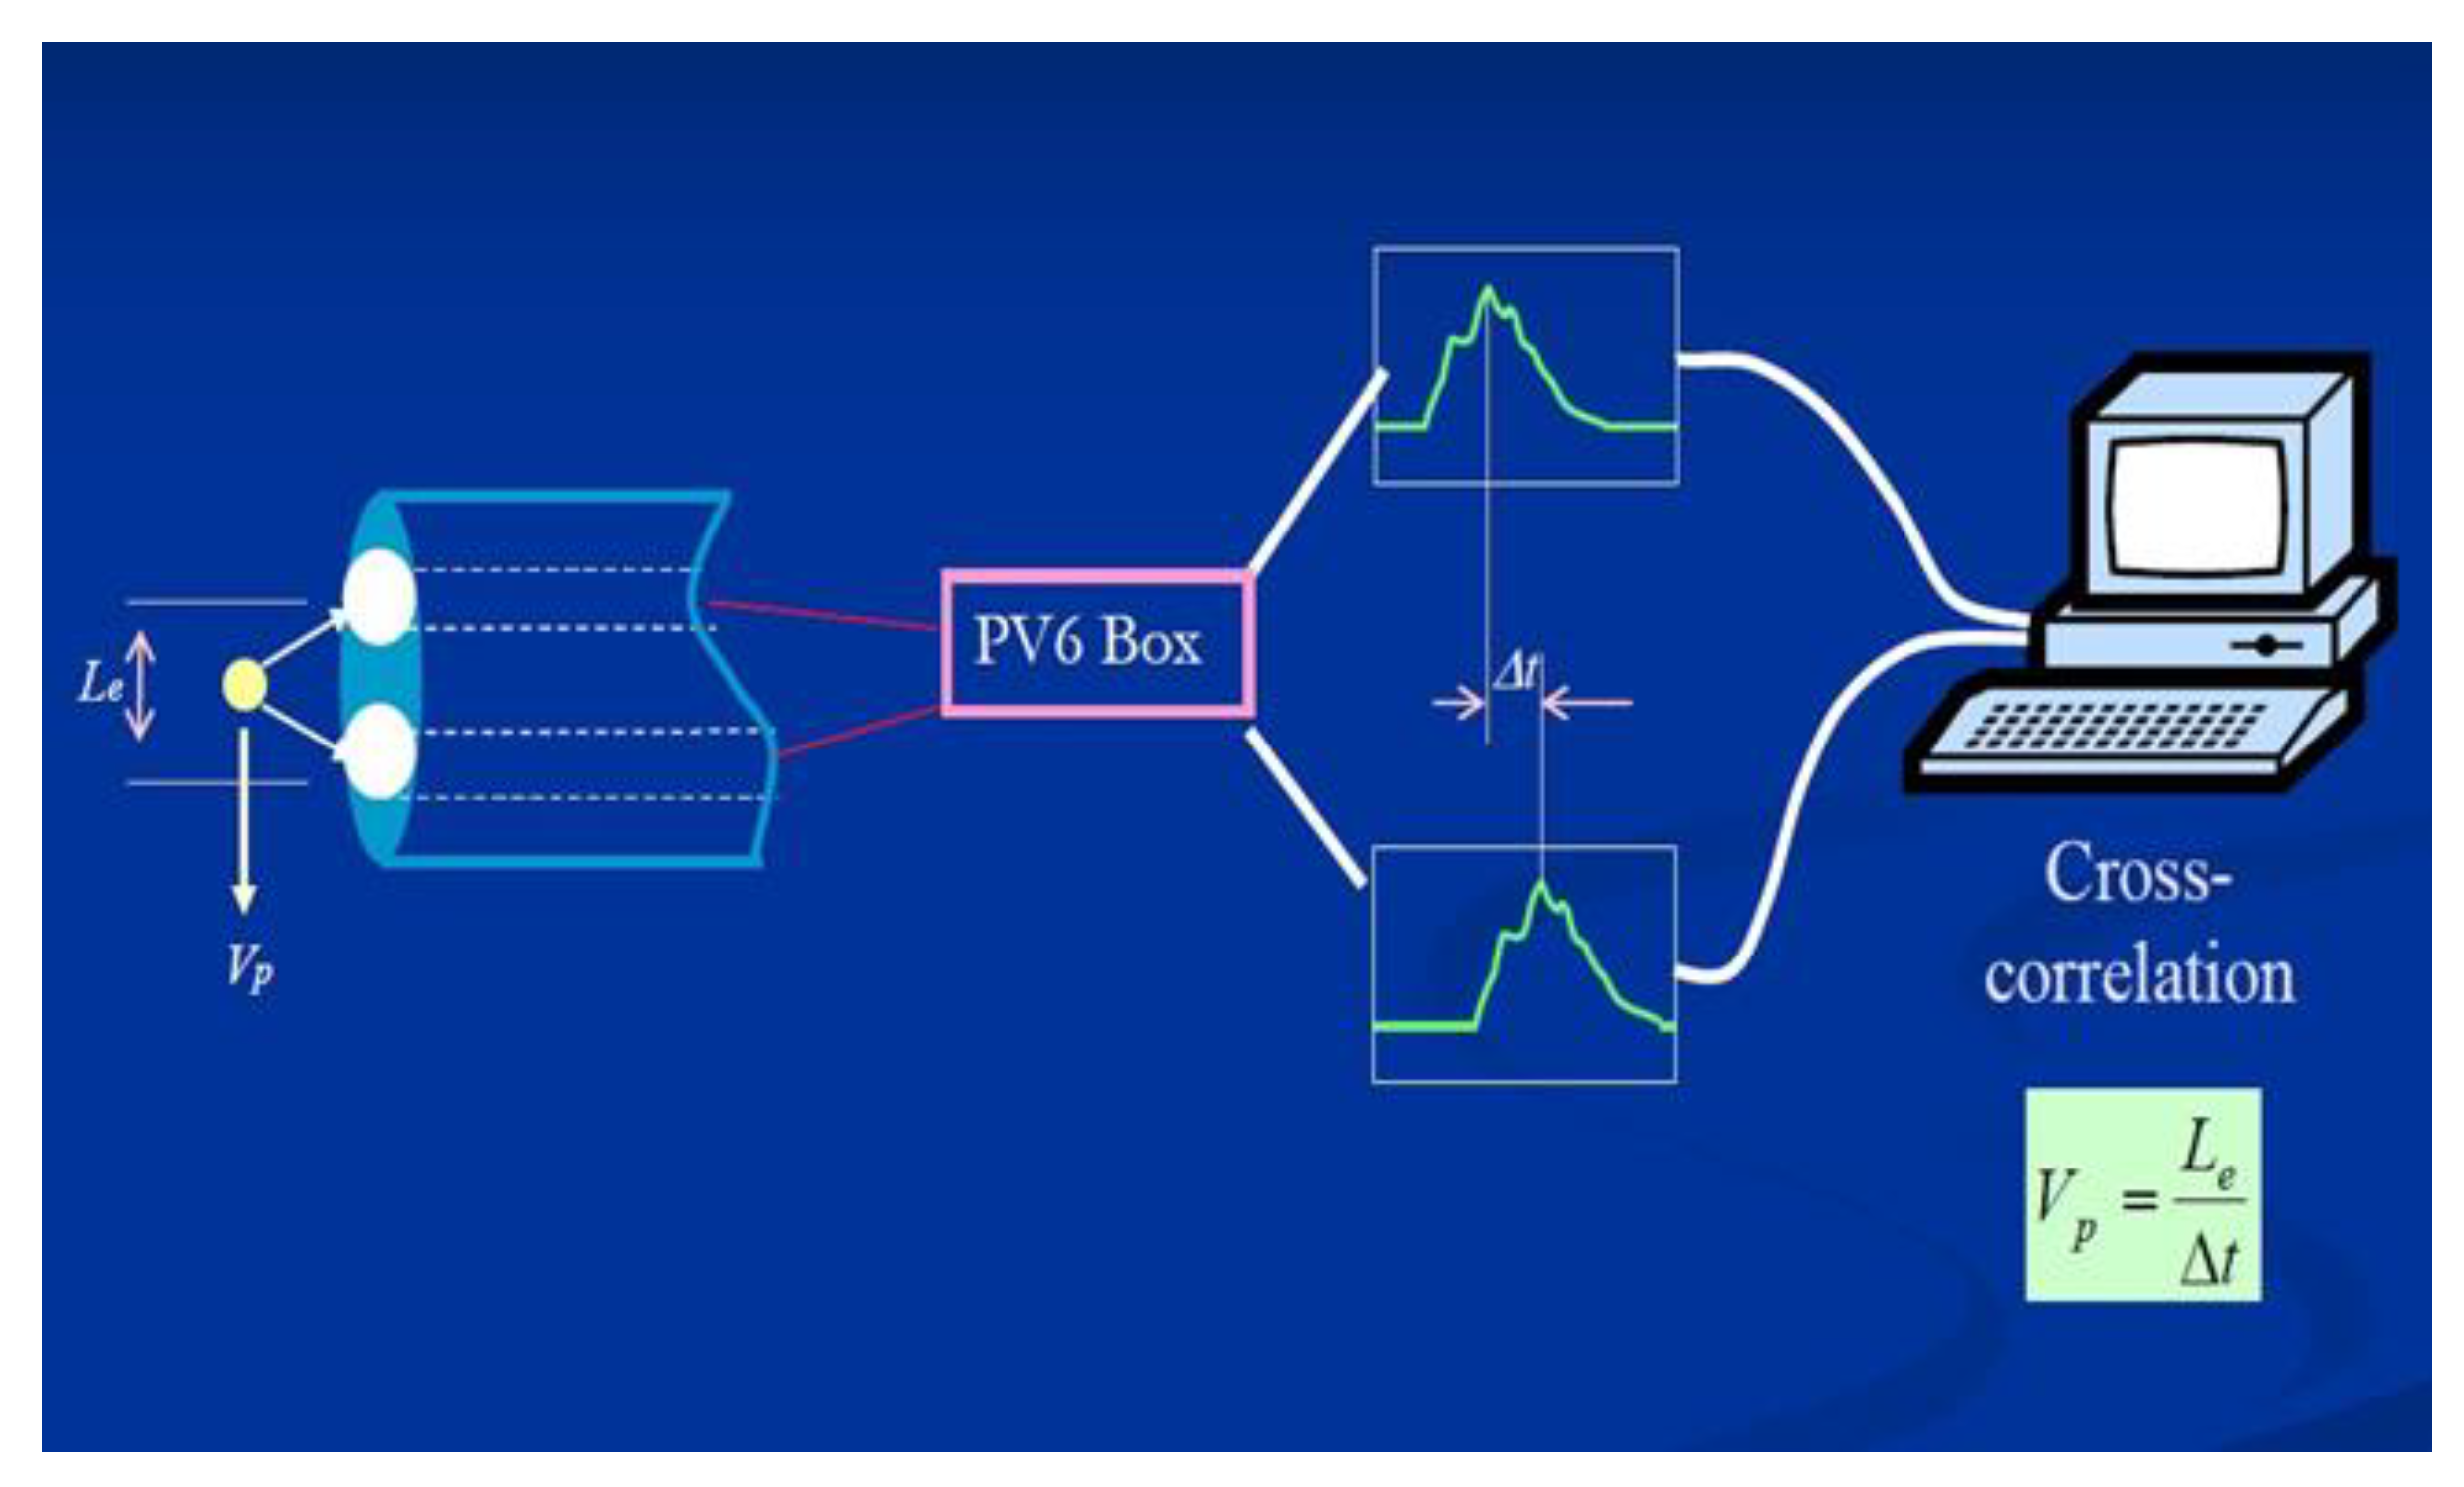
The measurement of solids velocity in an optical probe is based on the cross-correlation of signals (see Figure 8). The probe used in the measurement of the solid’s velocity should not be less than the diameter of the particles under study. The reflected signals from the movement of solids in front of the probe tips are converted into signals. Signals from the tips of the probes are used to determine solids velocity. The delay in time taken for a particle from one tip of the probe to the other tip of the probe is calculated using cross-correlation analysis (Equation (5)). The effective distance, distance between any light receiving/emitting fiber from one tip to the other, is a known quantity. The solid velocity is figured as distance over time.
where A(t) represents the signal of lower tip and B(t-τ) represents the signal of the upper tip. By processing the segments of the measured time series of these two tips of the optical probes according to Equation (2), the obtained cross correlation coefficient (C (τ)) can be either positive or negative. Positive (C (τ)) indicates upward solids velocity while negative (C(τ)) indicates downward solids velocity.
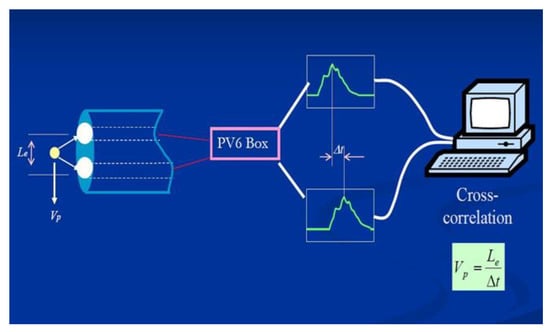
Figure 8.
Schematic Representation of the Cross-Correlation Analysis for Obtaining Solids Velocity Using an Optical Probe.
The procedure to carry out the measurement is to insert the probe into the measuring port of the experimental apparatus. The probe should be installed such that the direction mark on the middle part of the probe is in conformity with or opposite to the flow direction of the material. If the flow direction of the material cannot be identified, it is suggested that the mainstream direction of the material should be estimated first, and the actual direction of the material flow then be confirmed by revolving the probe during the experimental process. For transparent and translucent test equipment, the surroundings of the measuring points should be shielded so as to avoid the interference of stronger external light. Connect the probe to the “Probe” faucet on the back panel, using the cable enclosed, and screw in the cap. Connect the PV6 to your PC using a USB cable or an extension cable, if needed. Switch on the power of both the PV6 and your PC. A red LED USB indicator will light up, indicating that the computer and the PV6 have been connected correctly. Often, the PV6 and PC will get connected automatically after connecting them using a USB cable. If not, turn off the power supply of the PV6, and reconnect the PV6′s USB cable. Run the PV6 software. Adjust the two GAIN potentiometers of the two channels to “Offset” first, by turning them clockwise with no material before the measuring the end of the probe (empty bed). Adjust the two “Offset” potentiometers of the two channels to make the signal outputs of the two channels be at 0 voltage. With the equipment in the testing state, observe the indication of CH1 and CH2. Adjust the GAIN potentiometers to let the signal readings of the two channels. While adjusting, sample data, and observe the magnitude of the signals with the PV6 software. There is no strict requirement for signal magnitude, and normally the maximum signal value should be less than 5 voltages. Once these steps are complete, the data is collected and fed to the program to analyze them. Data which gives a cross-correlation coefficient of less than 0.7 is neglected, as it contains too much noise. The rest of the data is then further processed to calculate the velocity.
2.2.4. Solids Concentration Measurement
The probe selected should be greater than or equal to twice the size of the particles under study. This ensures that there is enough measuring volume to obtain accurate measurements. The probe tips illuminate a small volume in front of these tips. When there is a movement of particles in the measuring volume, light is reflected back, which is captured by the probe. This reflected light is then converted into signals. The signal from either of the tips can be used to obtain the solid’s concentration. Since most of the data published in the literature is in terms of solids hold-up, there is a need to convert this solids concentration into solids hold-up via a calibration equation. This calibration equation relates the measured voltage in the probe signals to the solids hold-up. Before the probe can be used to measure solids concentration, boundaries should be set for the probe as follows: (1) make sure that the end of the probe is under an empty-bed state (material concentration = 0), and keep the end of probe from the interference of external light, (2) adjust the “Offset” potentiometer on the instrument to make the output of the instrument be 0 voltage, (3) place the probe under the bulk concentration state (material concentration = 1), (4) adjust the GAIN potentiometer to let the output of the instrument be nearly to the full- scale value (e.g., 4.5 voltage), and (5) repeat the procedures mentioned above two or three times until the output of the probe is at 0 voltage when the material concentration is 0. The output of the probe is close to the full-scale value (e.g., 4.5 voltage) when the probe is under the state of bulk concentration. (There would be some difference in reproducibility of the 0 voltage and full-scale points due to the change in bulk density of the material and/or contamination of the probe.) The “Offset” and GAIN potentiometers cannot be readjusted during measurements, or the concentration measurement would be influenced. The full-scale output of the instrument can be adjusted on the basis of the maximum concentration of the material to be measured, which may extend the variation scope of the actual concentration of the material to the full scale of the instrument. When the particle measurement mode is selected, the magnitude of signals implies the value of relative concentration of material (0 for an empty bed). The optical probe measured at different levels and different radial positions for both columns, as shown in Figure 9. In every level, it measured six radial positions along with the column diameter form the center of the column to the wall. In all radial positions, optical probes measure local solids holdup, solids velocity, and their fluctuation at the different levels shown in Figure 1. Solids concentration was calculated as follows:
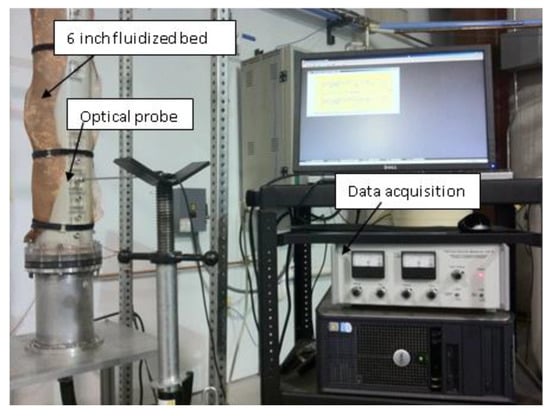
Figure 9.
Fiber optic probe (PV6) mounted on a 0.14 m inner diameter fluidized bed.
- The tips measure the number of particles in the measuring volume in front of the tips of the probe. The two tips produce signals related to voltage when there is movement and presence of particles. Any one of the signals can be taken to process the data.
- These recorded signals are then normalized as follows:where Vavg is average voltage, Vmax is maximum voltage, Vmin is minimum voltage.
Since the measurement does not truly represent the solids concentration, the dimensionless quantity is called dimensionless quantity related to solids concentration.
2.2.5. Pressure Transducer
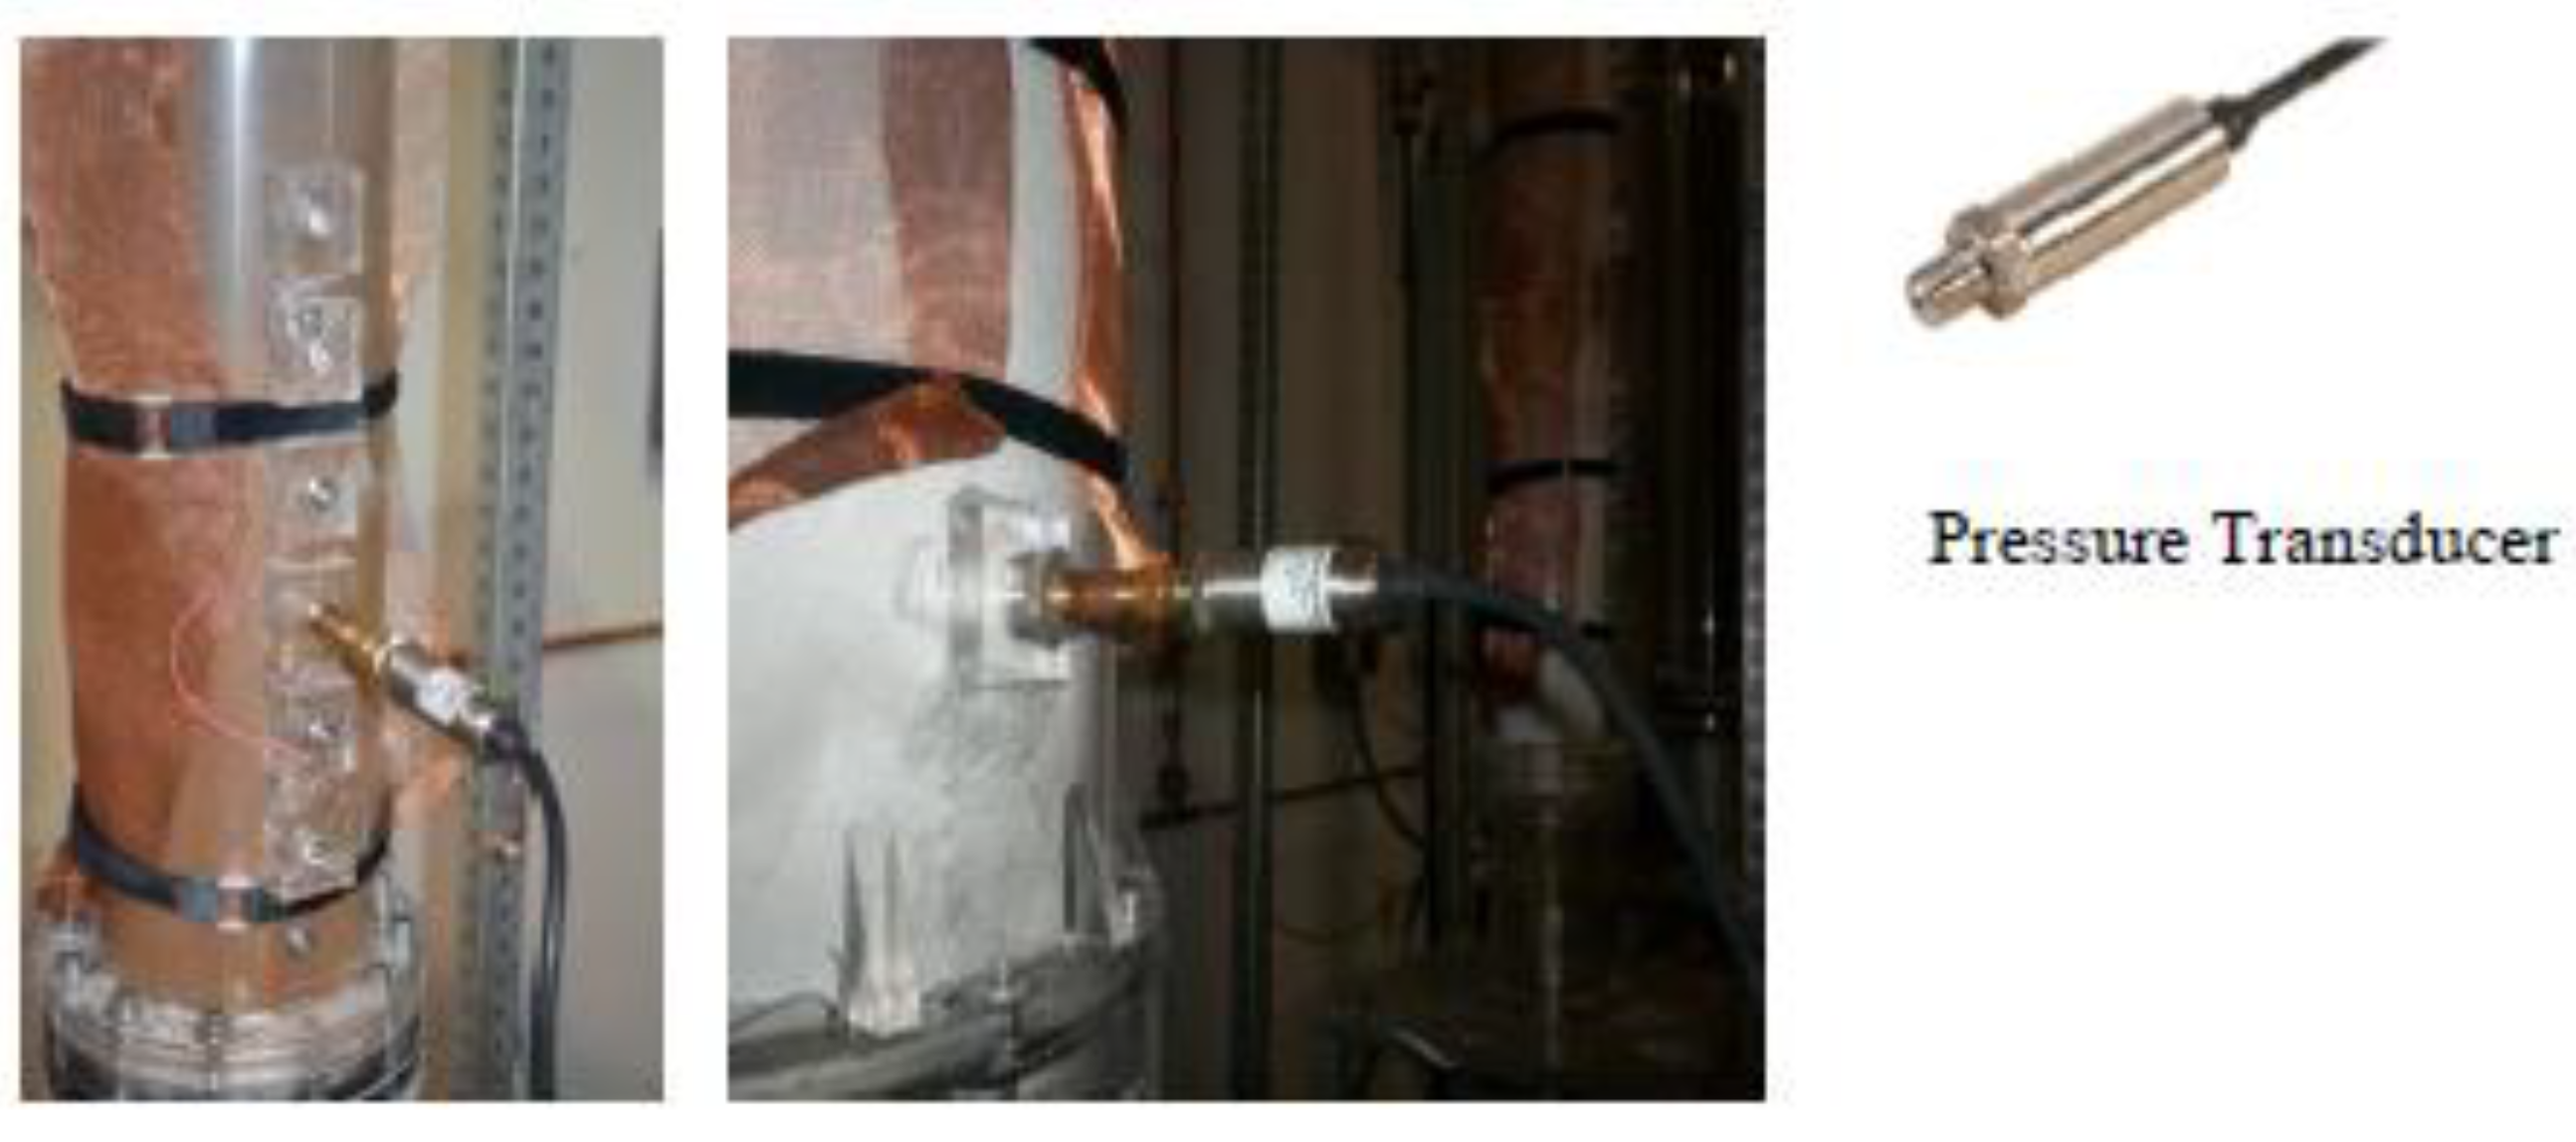
The pressure sensor technique could be used to measure the pressure of gases, liquids, or solids. The pressure is often expressed in terms of force per unit area and can be defined as the force necessary to prevent a fluid from expanding. The pressure sensor typically works as transducer where signals function the pressure enforced are generated. The pressure transducer used for the present study measures gauge pressure and (Model. No. PX409-0100G5V, Omega Dyne, Inc.) is a single-ended pressure measurement device. The data acquisition for the pressure transducer consists of an A/D converter, which converts the pressure fluctuations into electrical signals. The time series signals obtained from the transducer are then analyzed statistically to obtain important information about different flow regimes and the hydrodynamics of the multiphase systems. The pressure transducer was connected to the wall at different heights for both columns, as shown in Figure 10. As the transducer is very sensitive, aluminum mesh was connected in the transducer head to prevent the particles from getting inside the transducer. The time series signals obtained from the optical probe and the pressure transducer were analyzed statistically to identify different flow regimes.
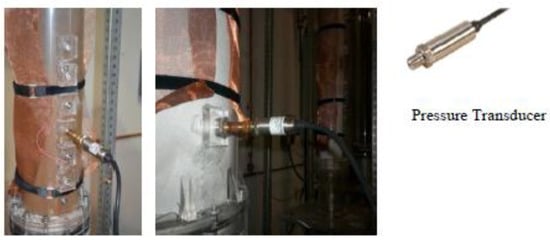
Figure 10.
Pressure transducer being mounted on the 0.14 m and 0.44 m inner diameter fluidized beds.
2.2.6. Experimental Conditions
As mentioned earlier, when discussed the simplified set, Glicksman et al. [20] suggested matching dimensionless groups when scaling up a fluidized bed to attain the hydrodynamics similarity. The dimensionless groups of [20] (Equation (3)) which include the following groups:
- Froude number (.
- The solids to gas density ratio ().
- The ratio of superficial gas velocity to minimum fluidization velocity ().
- Geometric ratios (), and ().
- Particle sphericity ().
- Particle size distribution.
Based on matching such scaling relationships, four conditions have been established that are summarized in Table 1. Case 1 lists the conditions used in the 0.44 m diameter column with glass beads of 210 µm mean diameter. Case 1 stands here as the reference Case for all the cases. In Case 2, the same particle used in Case 1, with mean particle diameter of 70 µm, was employed in the 0.14 m diameter bed. For Cases 3 and 4, glass beads of 210 µm mean diameter and copper particles of 210 µm mean diameter, respectively, were used in the 0.14 m diameter bed. For all the cases, air at room temperature and atmospheric pressure was used as the gas phase. To examine the influence of each dimensionless group in similarity, one or more groups was purposely mismatched in Cases 3 and 4. Cases 1 and 2 were matched and designed to study the validity of the scaling relationships. The absolute relative difference (ARD) values between scaling groups for Cases 1 and 2 are indicated in Table 1. The ARD values between Case 1 and Case 2 are acceptable since they are less than 5%. Cases 3 and 4 were mismatched. The groups in Case 3 and 4 gave mismatched values as the absolute relative difference between most of them was very high. Here, “match conditions” refers to maintaining the same value of dimensionless groups in Cases 1 and 2. The reported conditions for each of the cases are presented in Table 1, along with (ARD) between scaling groups.

Table 1.
The investigated conditions of matched and mismatched dimensionless groups for scale up relationships of fluidized beds.
3. Results and Discussion
The similarity in the local hydrodynamic parameters was assessed for the cases tabulated in Table 1. The investigated conditions are of matched and mismatched dimensionless groups where Case 1 here stands for the reference case. The conditions of Case 2 were originally designed to attain matching dimensionless groups with the reference case (Case 1). The ARD values between Case 1 and Case 2 indicated a good agreement between the two cases, where all dimensionless parameters in Table 1 were matched as closely as possible. The design of Cases 3 and 4 was intended to examine if successful scaling can be achieved by only matching the column and particle dimensions, and to demonstrate the importance of variables such as the Froude number, the ratio of superficial gas velocity to minimum fluidization velocity, the geometric ratios, and the solids to gas density ratio. The developed optical probe was used to measure local solids holdup, solids velocity, and their fluctuations, while the pressure transducer was used to measure pressure and its time series signal. The results obtained by optical probe for all cases at different height are presented in the following subsections. For convincing comparisons between the two different sizes fluidized beds, those vertical locations were non-dimensionalized (i.e., dimensionless heights z/D). These results are considered as local parameters that have to be evaluated in detail to assess the adequacy of the dimensionless group-based scale-up methodology. The error bar represents the standard deviation from the mean. In this study, the particles velocity study is based on the up flowing particles velocity.
3.1. Solids and Gas Hold-Up
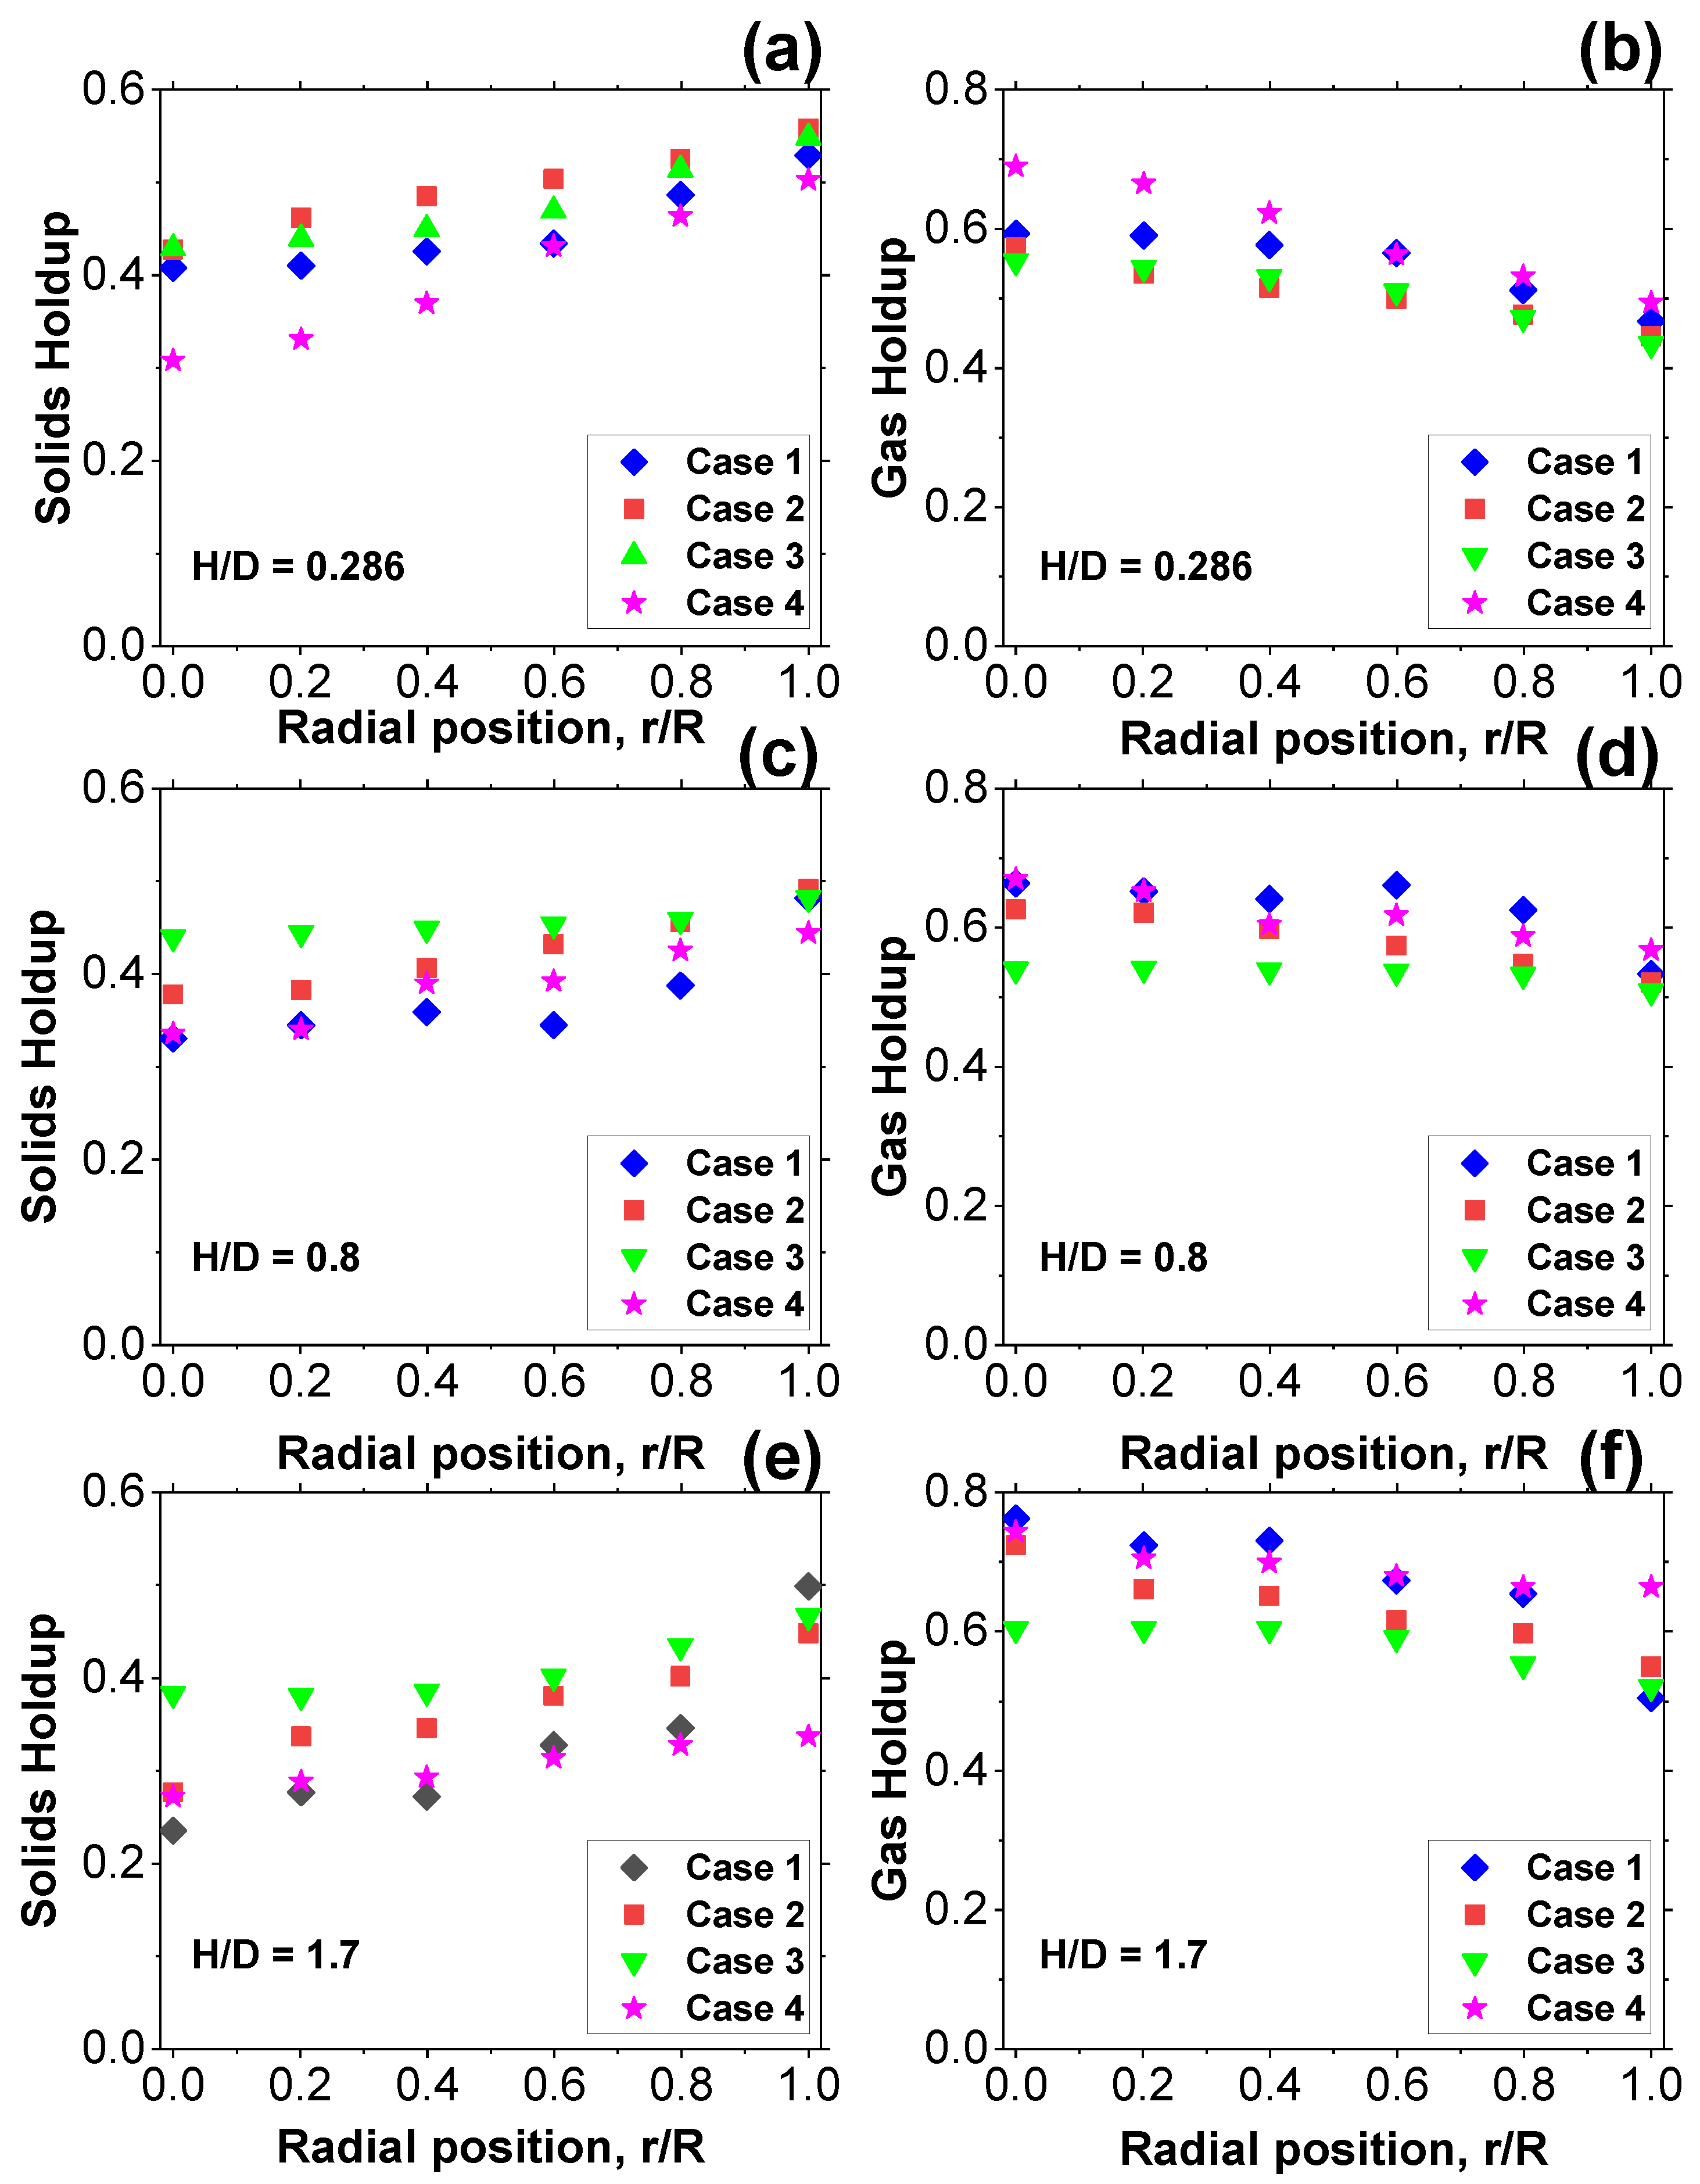
Figure 11a–c shows the solids holdup profiles a function of the dimensionless radial position for the investigated four cases outlined in Table 1 at different dimensionless axial locations. The results indicate that the solids holdup is minimal near the axis of the column and increases gradually towards the column wall. Along the dimensionless height, the solids holdup is lower near the gas inlet and increases as the height increases along the bed. This observation applies for all the investigated conditions in the 0.44 m and 0.14 m fluidized beds. The solids holdup and gas holdup profiles are in line with results found in the literature [14,37,38]. When comparing the reference case and the Case 2, the results profiles show deviation in local solids and gas holdup. The Average Absolute Relative Difference (AARD) was 12.5% between the results of the two cases at the fully development region (H/D = 1.7) shown in Figure 11e,f. At the fully developed region (H/D = 1.7), the ARD values were 5% near the column axis (r/R = 0); 6% at r/R = 0.2; 15% at r/R = 0.4; 9% at r/R = 0.6; 12% at r/R = 0.8; and 8% at r/R = 1 (close to the column wall). It is clear from the profiles and the ARD values that the similarity in solids and gas holdups (gas holdup = 1—solids holdup) is not achieved despite the matching of the dimensionless groups between the reference Case and Case 2. When comparing the gas holdup profiles of the reference case and Case 3, the gas holdup profiles of Case 3 were noticeably lower than that obtained for the reference case (Case 1). This is due to that the Dc/dp and U/Umf ratios of Case 3 were much lower than those of the reference case. Figure 11f shows that there was a clear difference in gas holdup profiles between Cases 1 and 3, where the AARD was about 15%. The results also indicate that the gas holdup of Case 4 was lower than for that of the reference case (Case 1), emphasizing the importance of the Froude number and the ρs/ρf ratio. Figure 11e,f also show that there was a deviation in gas/solids holdup profiles between Cases 1 and 4, where the AARD was about 10%. Similar results and findings are observed at the H/D = 0.8 where the AARD between Cases 1 and 2 in this region was about 12% (see Figure 11c,d). Conversely, at H/D = 0.286, which is the sparger region, there was not much deviation between Cases 1 and 2 due to the entrance effect (see Figure 1a,b). The differences in the gas and solids holdups radial profiles between the reference case and Case 2 is just as a result of the simple fact that these dimensionless groups will most likely not totally take into account the whole bed hydrodynamics. It is also noteworthy that it is hard to obtain conditions that provide matching and clear mismatching dimensionless group between two fluidized beds.
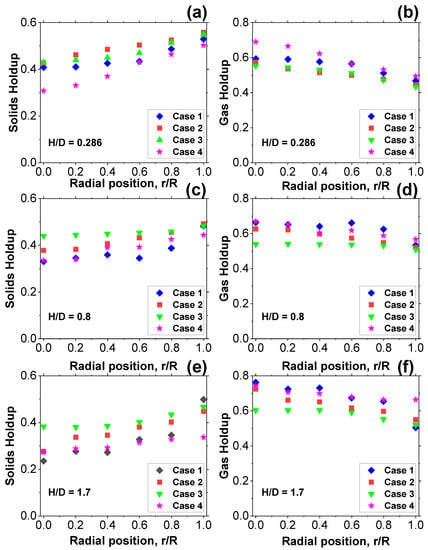
Figure 11.
Solids (a,c,e) and Gas (b,d,f) Holdup as a Function of Radial Position at Different Height Above the Distributor. The Conditions are Given in Table 1. where Case 2 are matching dimensionless groups, and Cases 3 and 4 are mismatching.
3.2. Particles Velocity
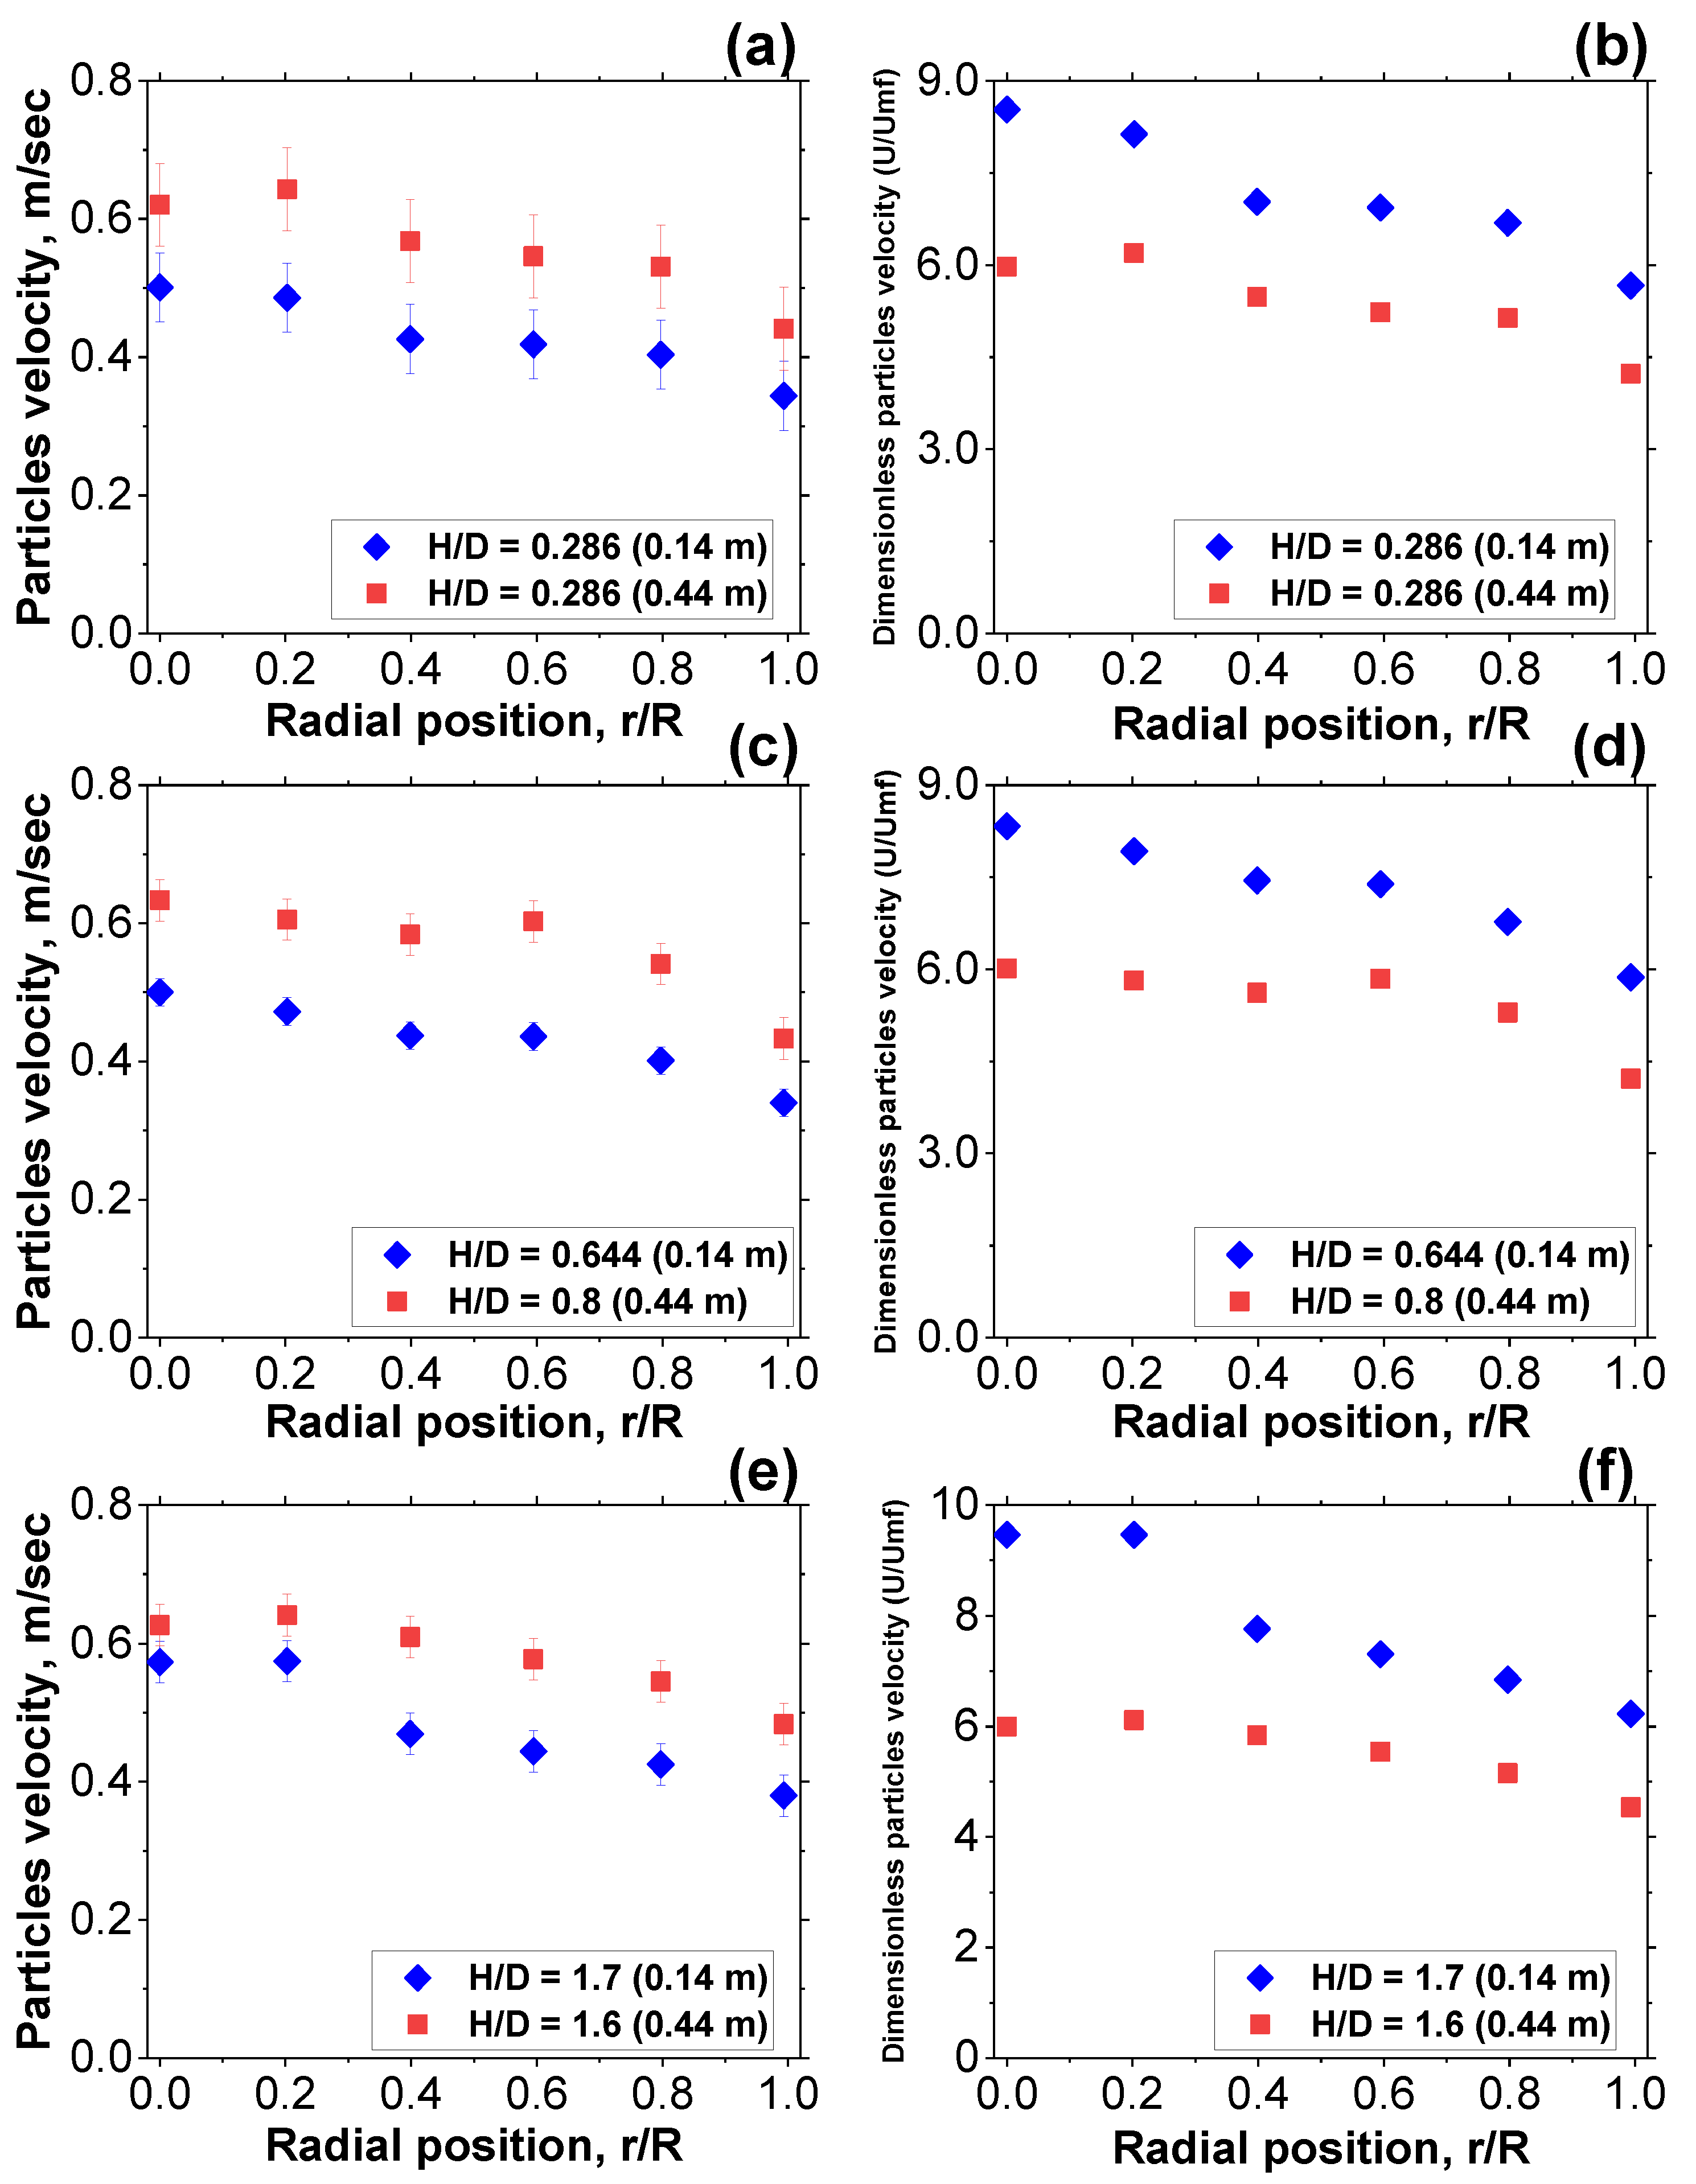
For particles velocity only the upward velocities are reported in this work. This is because only the positive cross correlation coefficient (C(T)) (Equation (7)) were used. Figure 12a,c,e) represents the local up flow particles velocity profiles for Cases 1 and 2. Local up flow solids velocity for Cases 1 and 2 was examined; the Average Absolute Relative Difference (AARD) was about 13.8% at the fully development region (Figure 12e). At the fully development region (H/D = 1.7), the ARD values were 10% near the column axis (r/R = 0); 11% at r/R = 0.2; 16% at r/R = 0.4; 15% at r/R = 0.6; 15% at r/R = 0.8; and 12% at r/R = 1 (close to the column wall). As the height decreased to 0.644, the Average Absolute Relative Difference (AARD) increased to 20.6% (see Figure 12c). At H/D = 0.286, which is the sparger region, there was difference between Cases 1 and 2 (see Figure 12a) profiles where the Average Absolute Relative Difference (AARD) was about 19.3%.
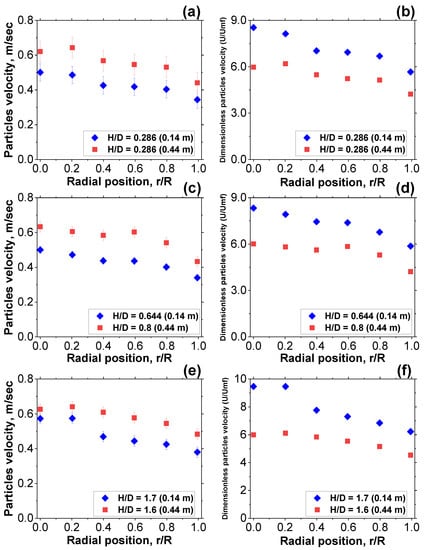
Figure 12.
Up Flowing Radial Particles Velocity (a,c,e) and Dimensionless Particles Velocities Profiles (b,d,f) for Case 1 and Case 2 at Different Height above the Distributor where Case 2 are matching dimensionless groups.
To have a basis of comparison, the solids velocity radial profiles of both the fluidized beds were divided by the minimum fluidization velocity (Umf) to represent the up-flow particles velocity in dimensionless value. Umf refers to the velocity at which the bed starts fluidization; below this velocity, the bed is not fluidized. is measured by the pressure drop through a bed of particles as a function of the gas velocity. The measured values were compared with the predictions of the correlation available in the literature [39] and the comparison was found to be in good agreement. The values of Umf for the 0.14 bed diameter using glass beads with 70 µm, 210 µm and copper with 200 µm mean particle size was 0.06 m/s, 0.12 m/s, and 0.2 m/s, respectively and for the 0.44 bed diameter using glass beads with 210 µm mean particle size was 0.105 m/s.
Figure 12b,d,f shows the dimensionless up flowing particles velocity of Cases 1 and 2 and compares them, showing that their profiles and their magnitudes were different. The AARD of the fully development region was at about 24%. As the height decreased to 0.644, the Average Absolute Relative Difference (AARD) increased to 30% (Figure 12d) and at H/D = 0.286, which is the sparger region, the AARD increased to 28%. Using U/Umf, the differences increase between those of case1 and case 2. Hence, presenting the up flowing particles velocity in the form of U/Umf does not help for assessing the hydrodynamics similarity. The deviation in up flowing particles velocity is higher compared to reference case 1.
3.3. Mass Flux of up Flowing Particles
Since only the up flowing particles velocities were estimated in this work as mentioned earlier, the mass flux of up flowing solids is estimated for further assessment of hydrodynamics similarity. Figure 13a–c shows the comparison of up flowing mass flux parameters at experimental conditions of Case 1 and Case 2 (Table 1) at different axial positions. To obtain the overall up flowing solids mass flux in the fluidized bed, two different sets of experiments were performed. One set of experiments was to obtain the solids holdup () at radial location of each axial height where the solids mass flux was to be evaluated. The second set of experiments was to obtain the up flowing particles velocity () at the corresponding location. Hence, by representing both the up flowing particles velocity and holdup by the sum of deterministic and fluctuating components , and given a cross sectional area (A) of the region of the measurements, the averaged solids mass flux, , at each location can be defined by the following equations (Satish, 2005):
from Equation (9) the parameters for mass flux are:
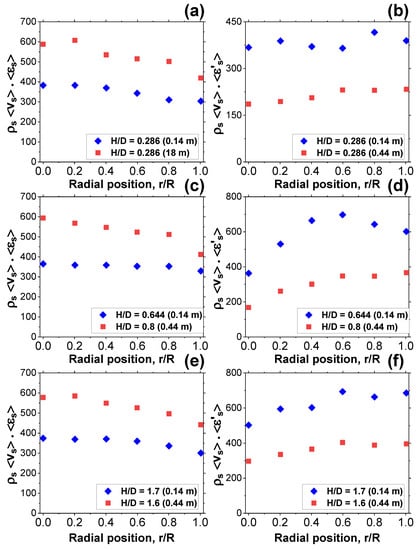
Figure 13.
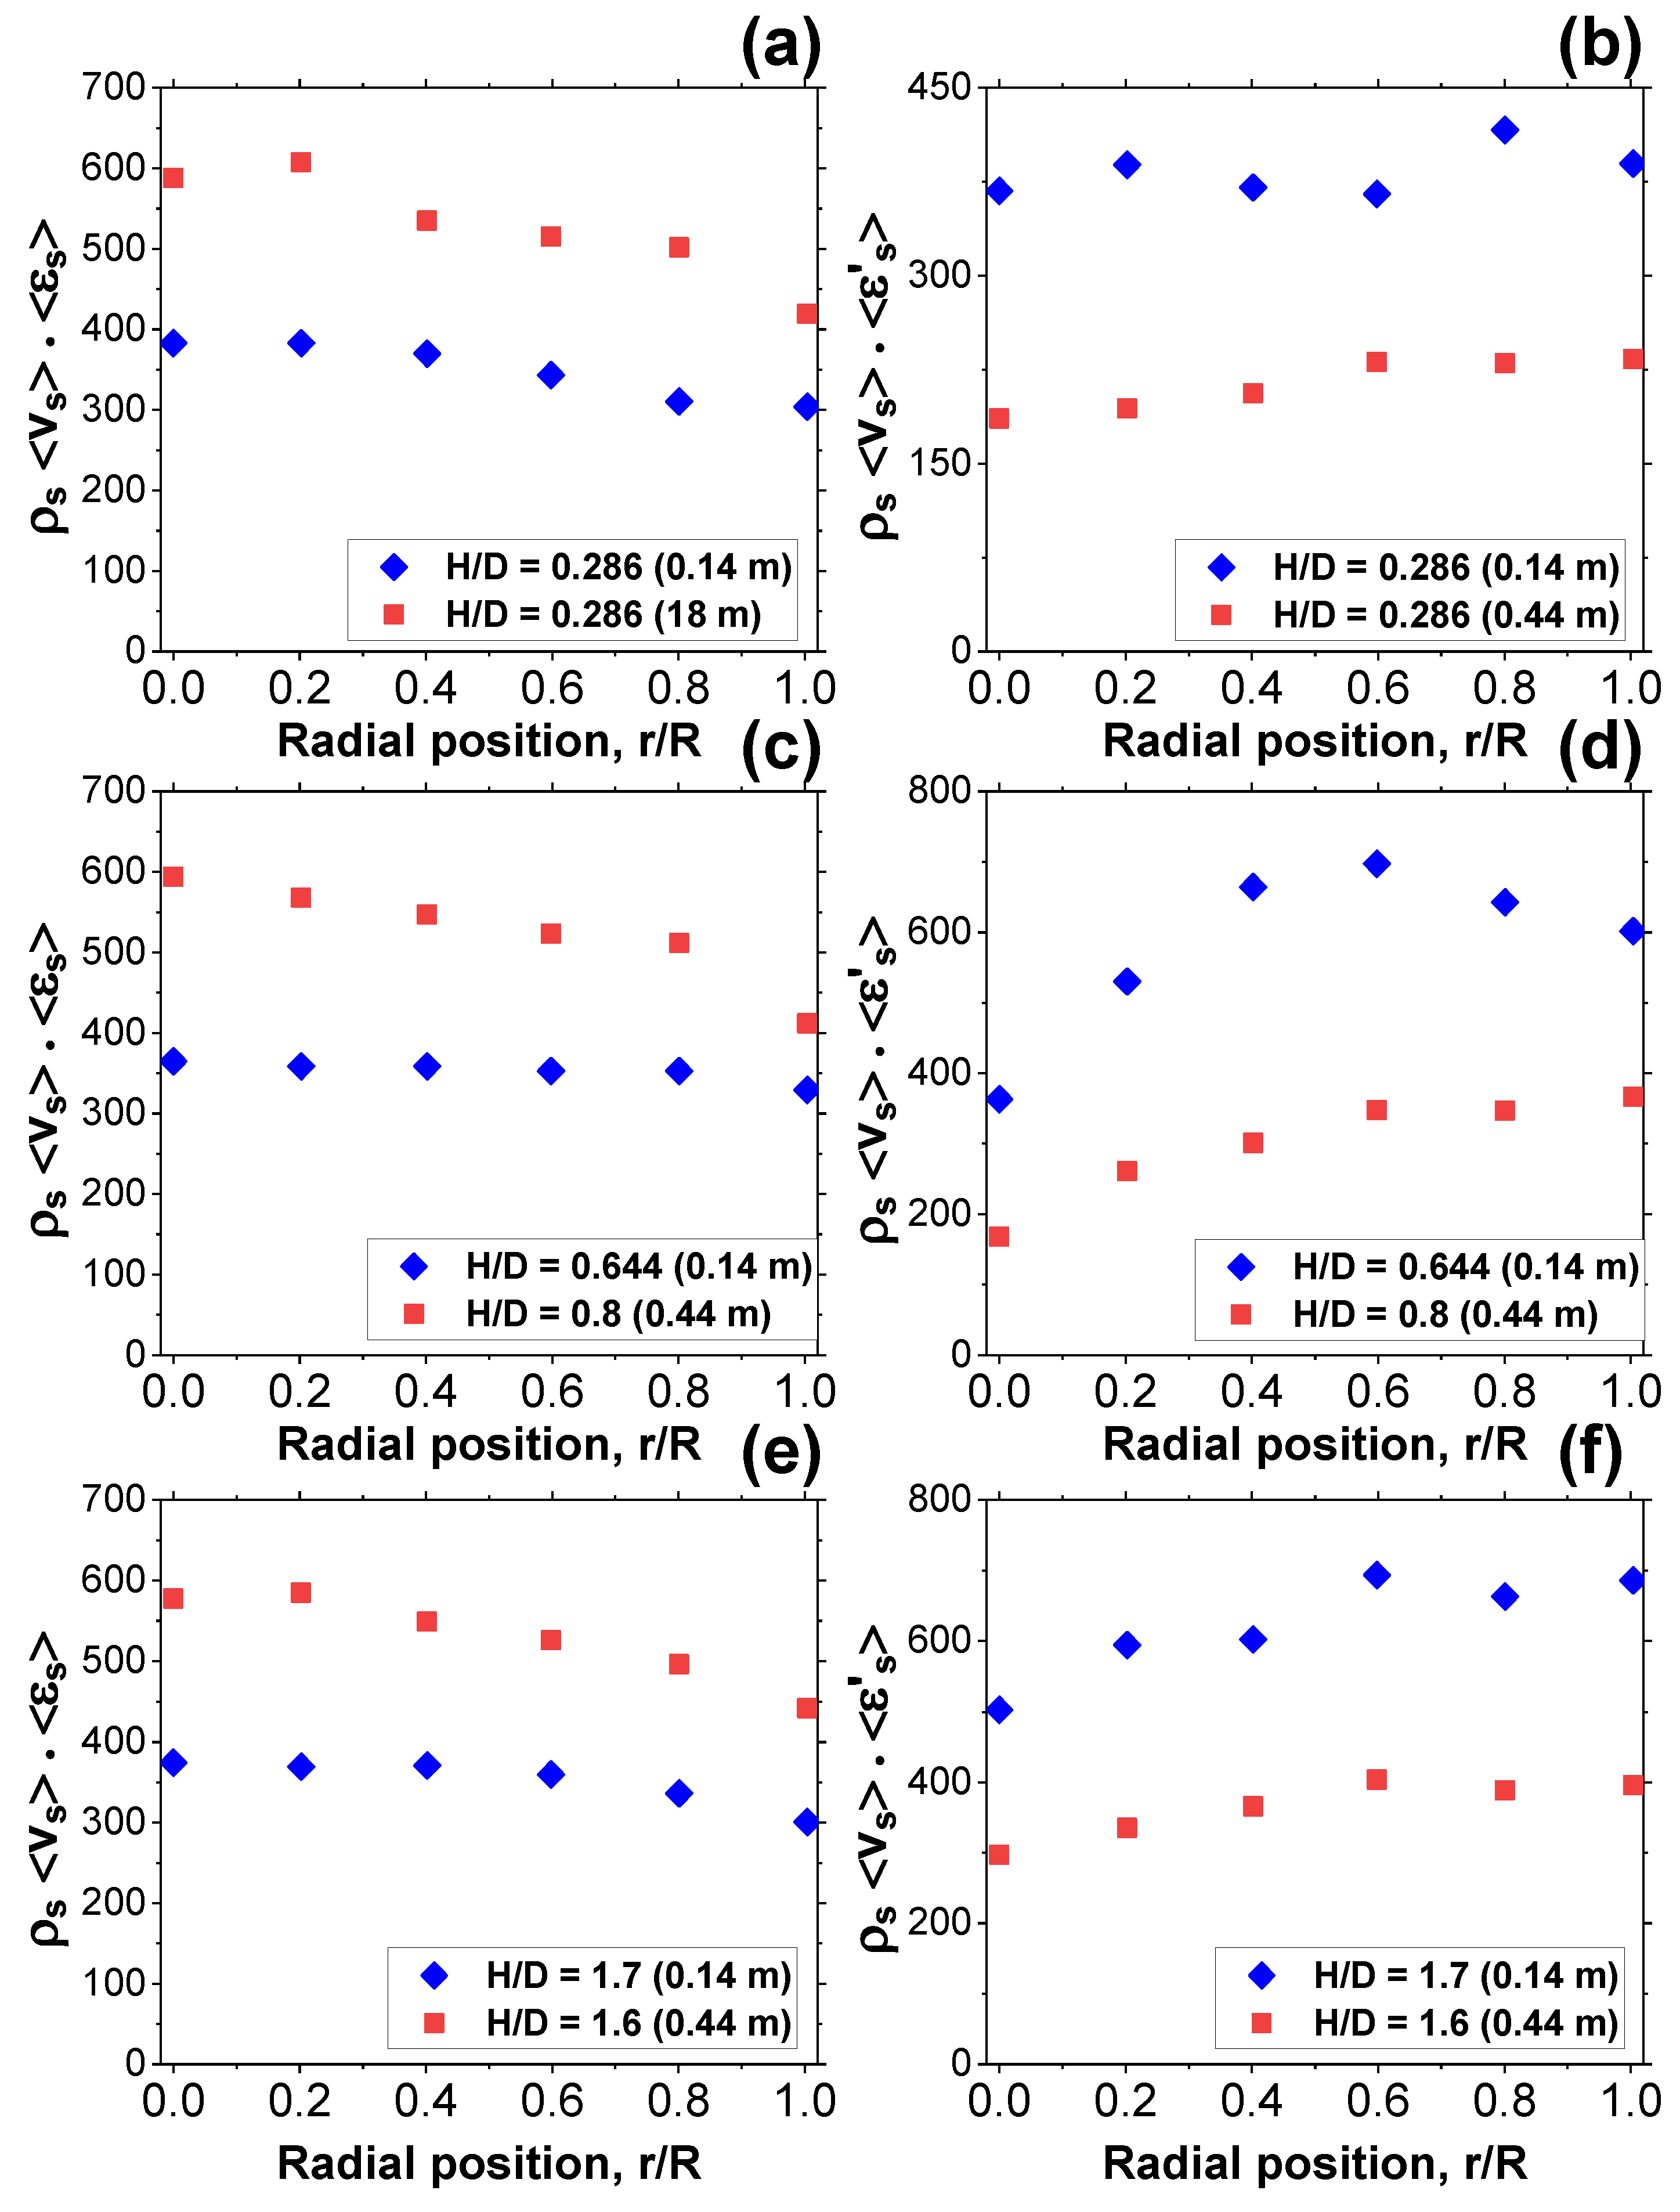
Comparison of the Mass Flux Parameters Profile of Up Flowing Particles for 0.14 m and 0.44 m Fluidized Beds at Different H/D, for Matching Conditions (Case 1 and Case 2). (a,c,e) represent the Mass Flux estimation using Equation (11). (b,d,f) represent the Mass flux estimation using Equation (12).
Term 1 represents mass flux parameter resulting in the estimation of its solids velocity and solids holdup at certain point with respect to the area of the probe measurement. Term 2 represents mass flux parameter resulting from fluctuation in solids velocity and holdup at the corresponding measurement location. Plotting these terms as a function of radial position to assess the mass flux of both beds size (Case 1 and 2). The result between Case 1 and Case 2 showed that the profiles and magnitude were different (shown in Figure 13. The Average Absolute Relative Difference (AARD) was in the fully development region at 33%. The AARD values confirm the dissimilarity in the local hydrodynamics using the matching conditions. Comparing term 1 and term 2 profiles shows that the value of term 1 () was higher in the center and low in the wall. This was because in the center there are larger flowing solids velocity and lower solids holdup compared to the wall region. However, it is the opposite trend for term 2 ().
3.4. Time Series of the Optical Probe and Pressure Fluctuation Measurement
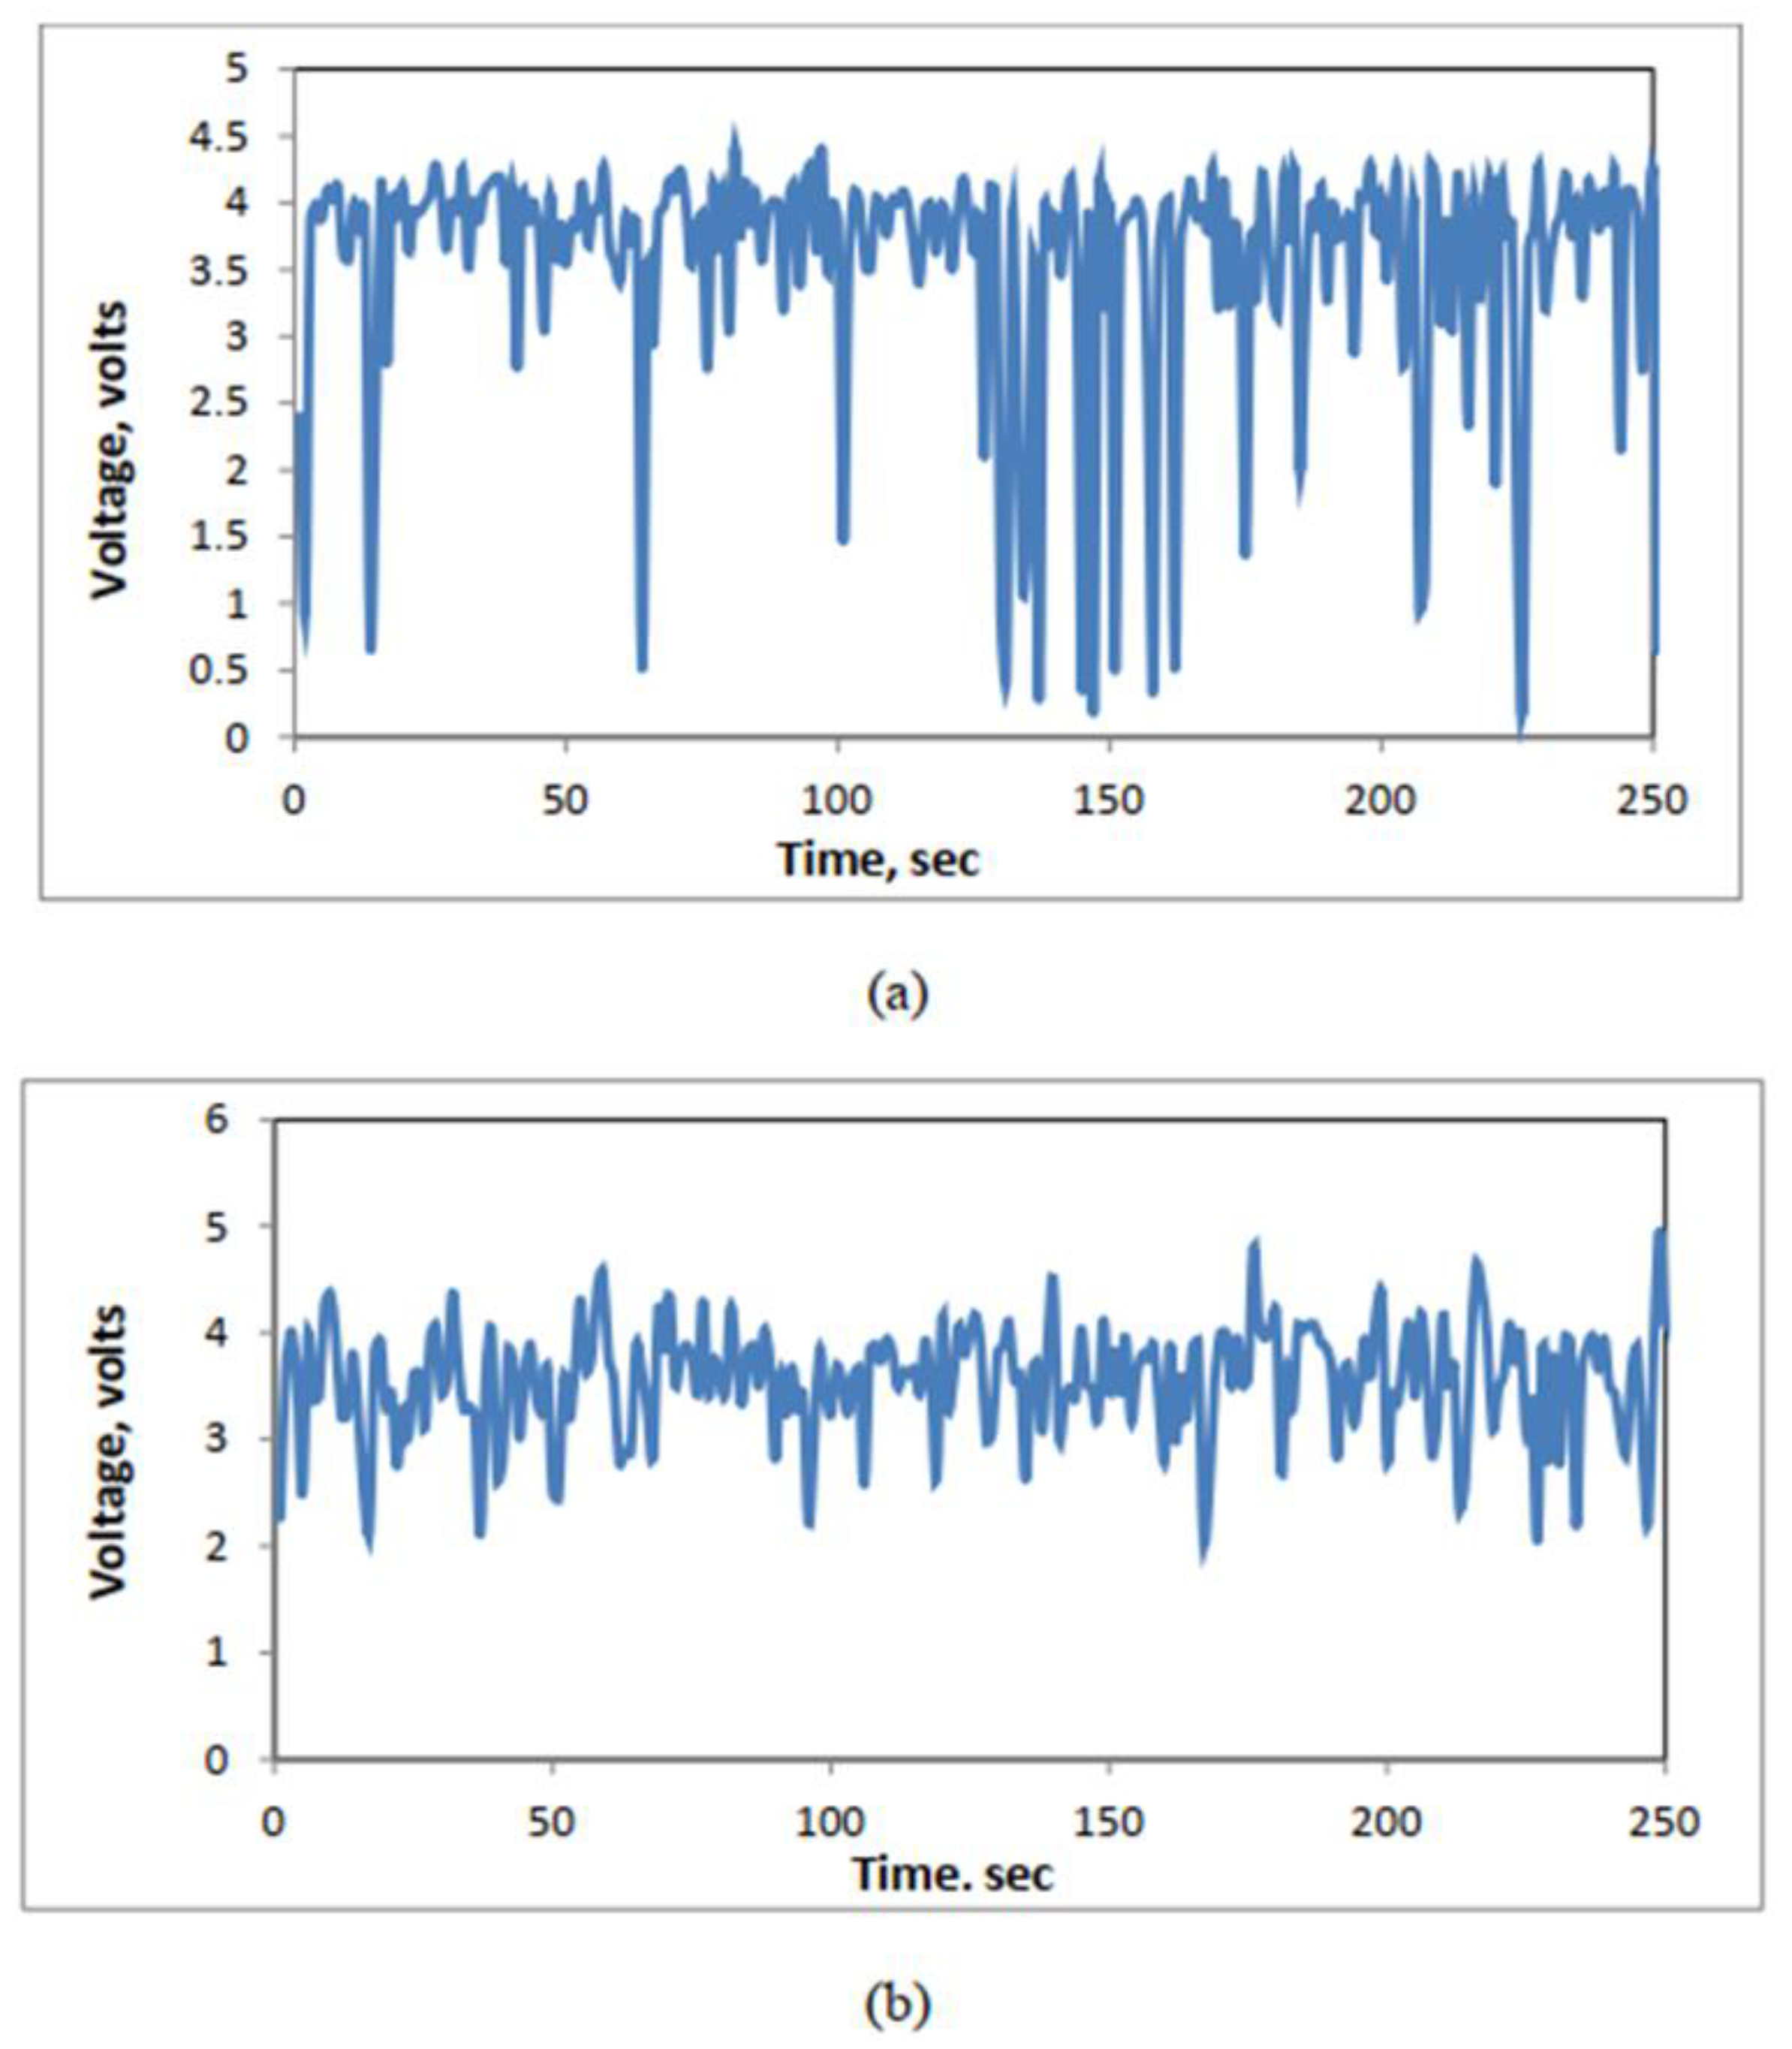
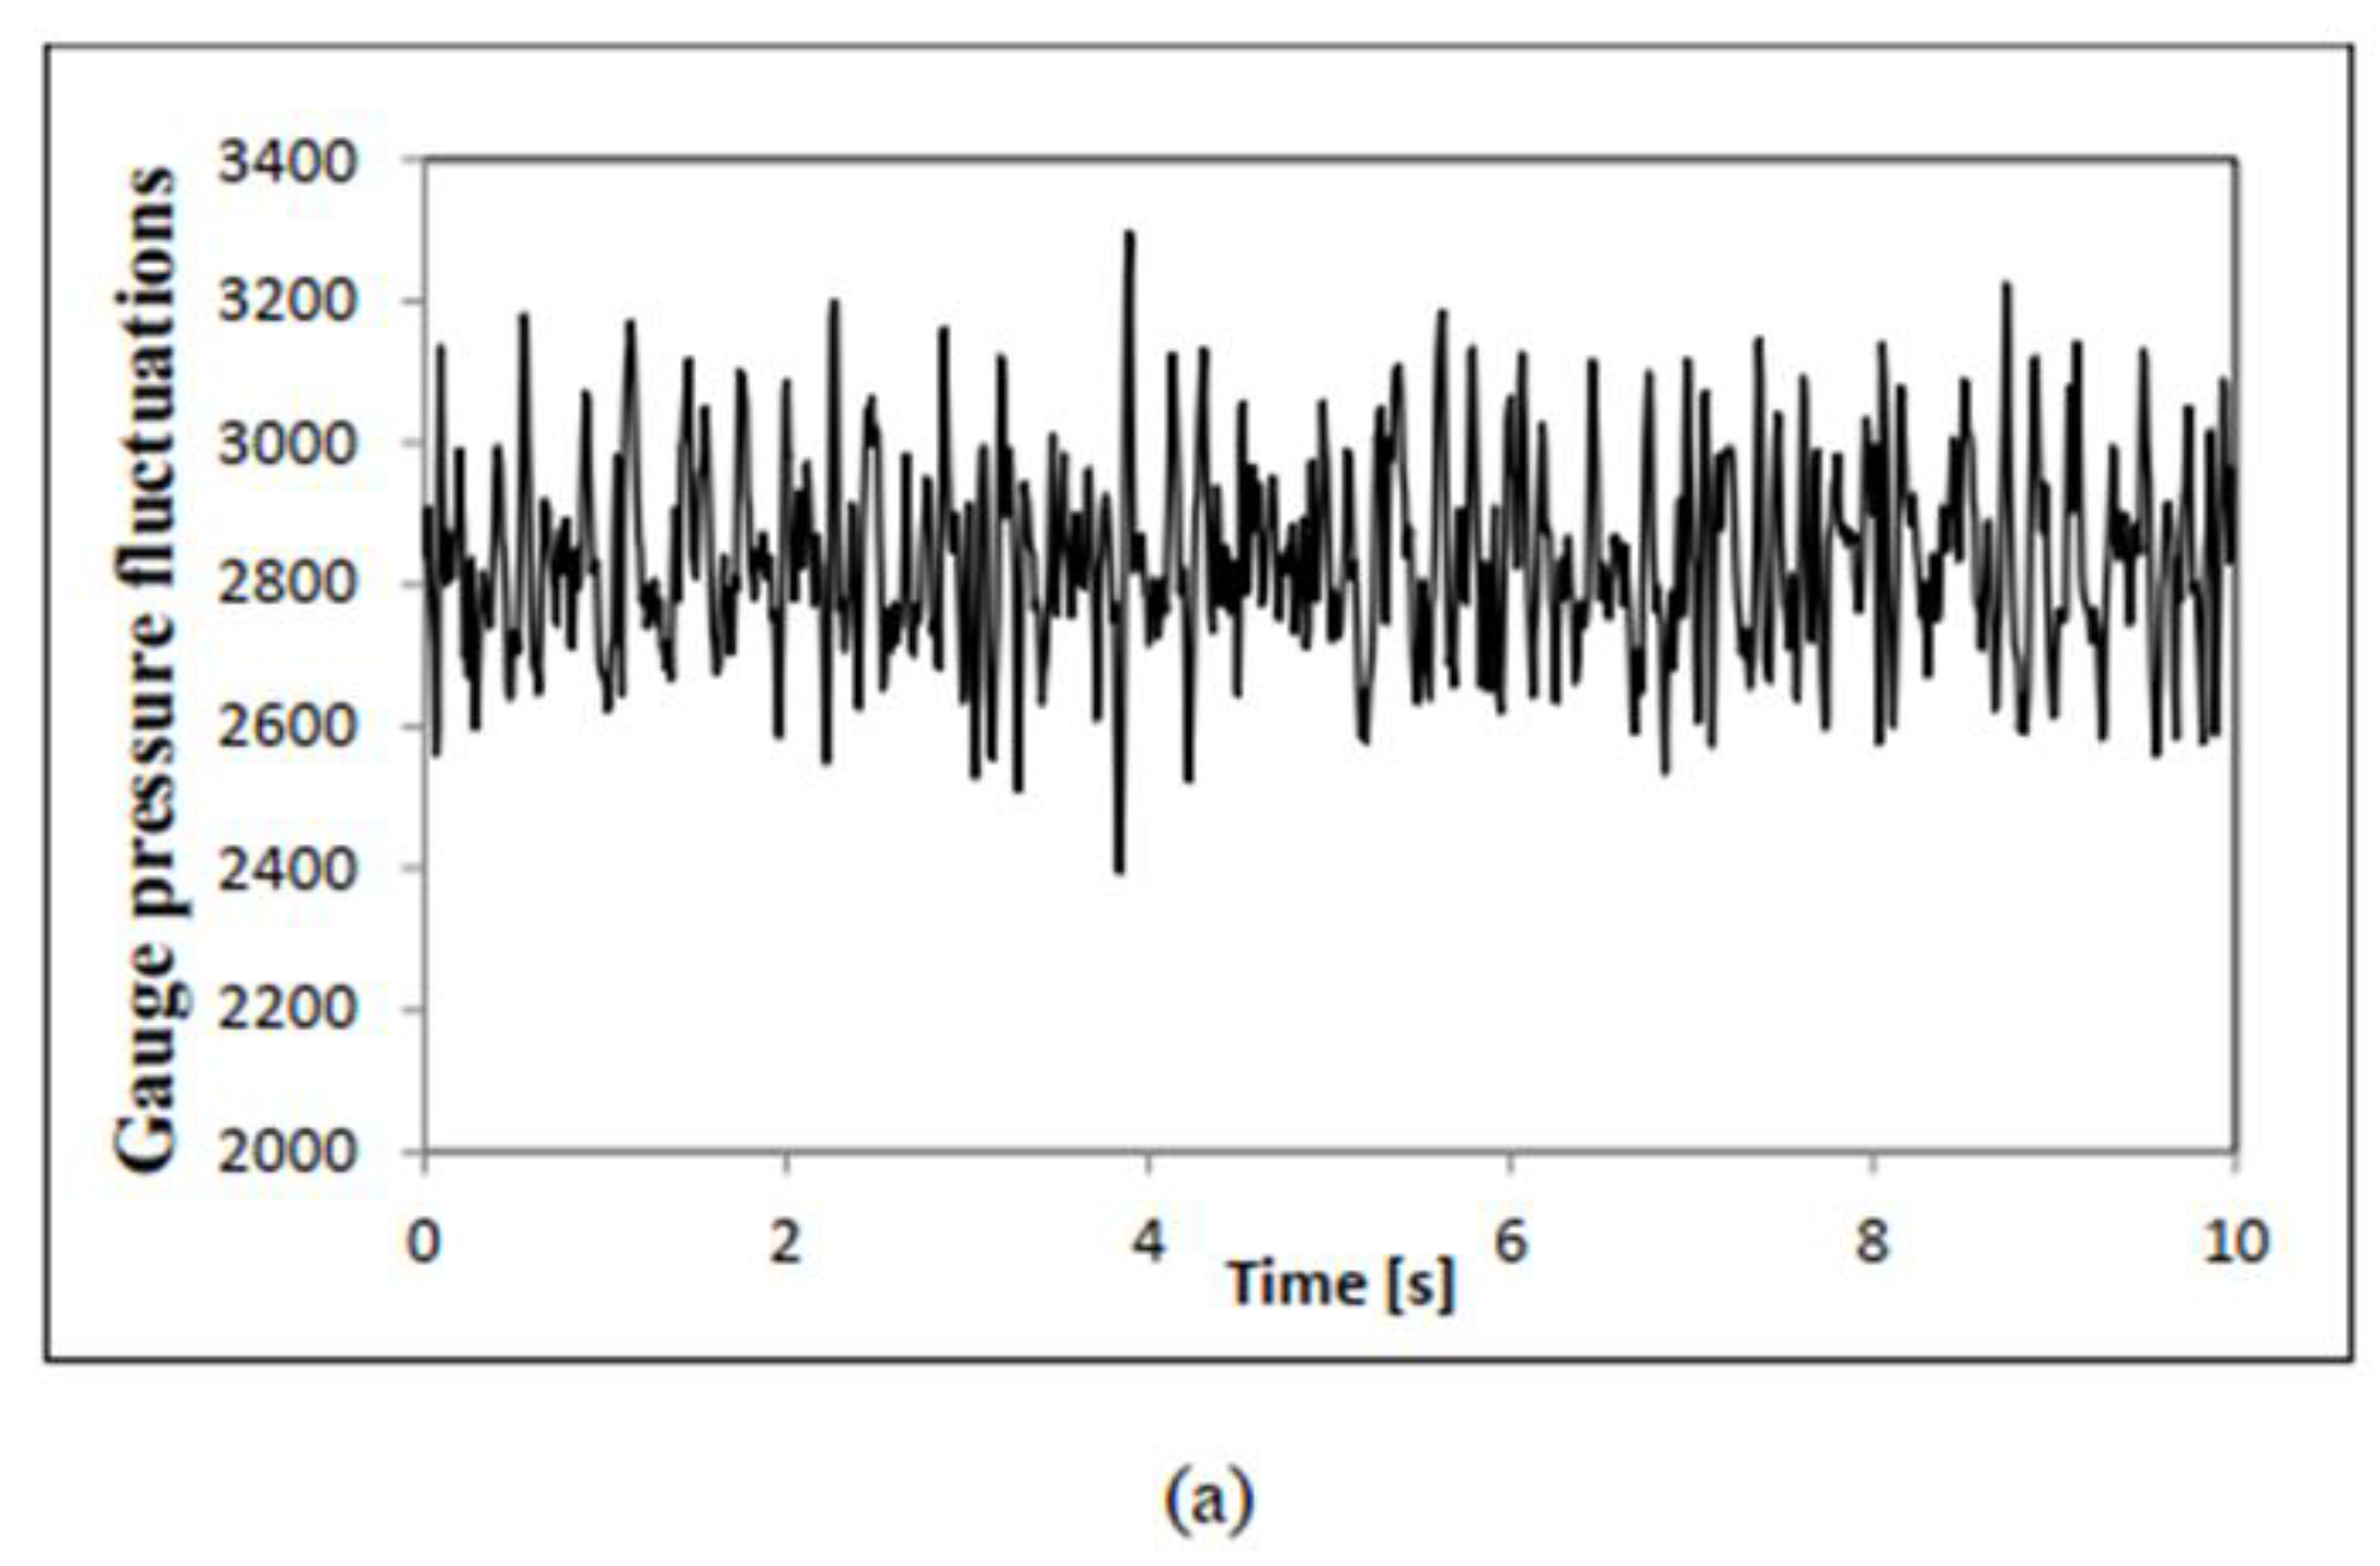
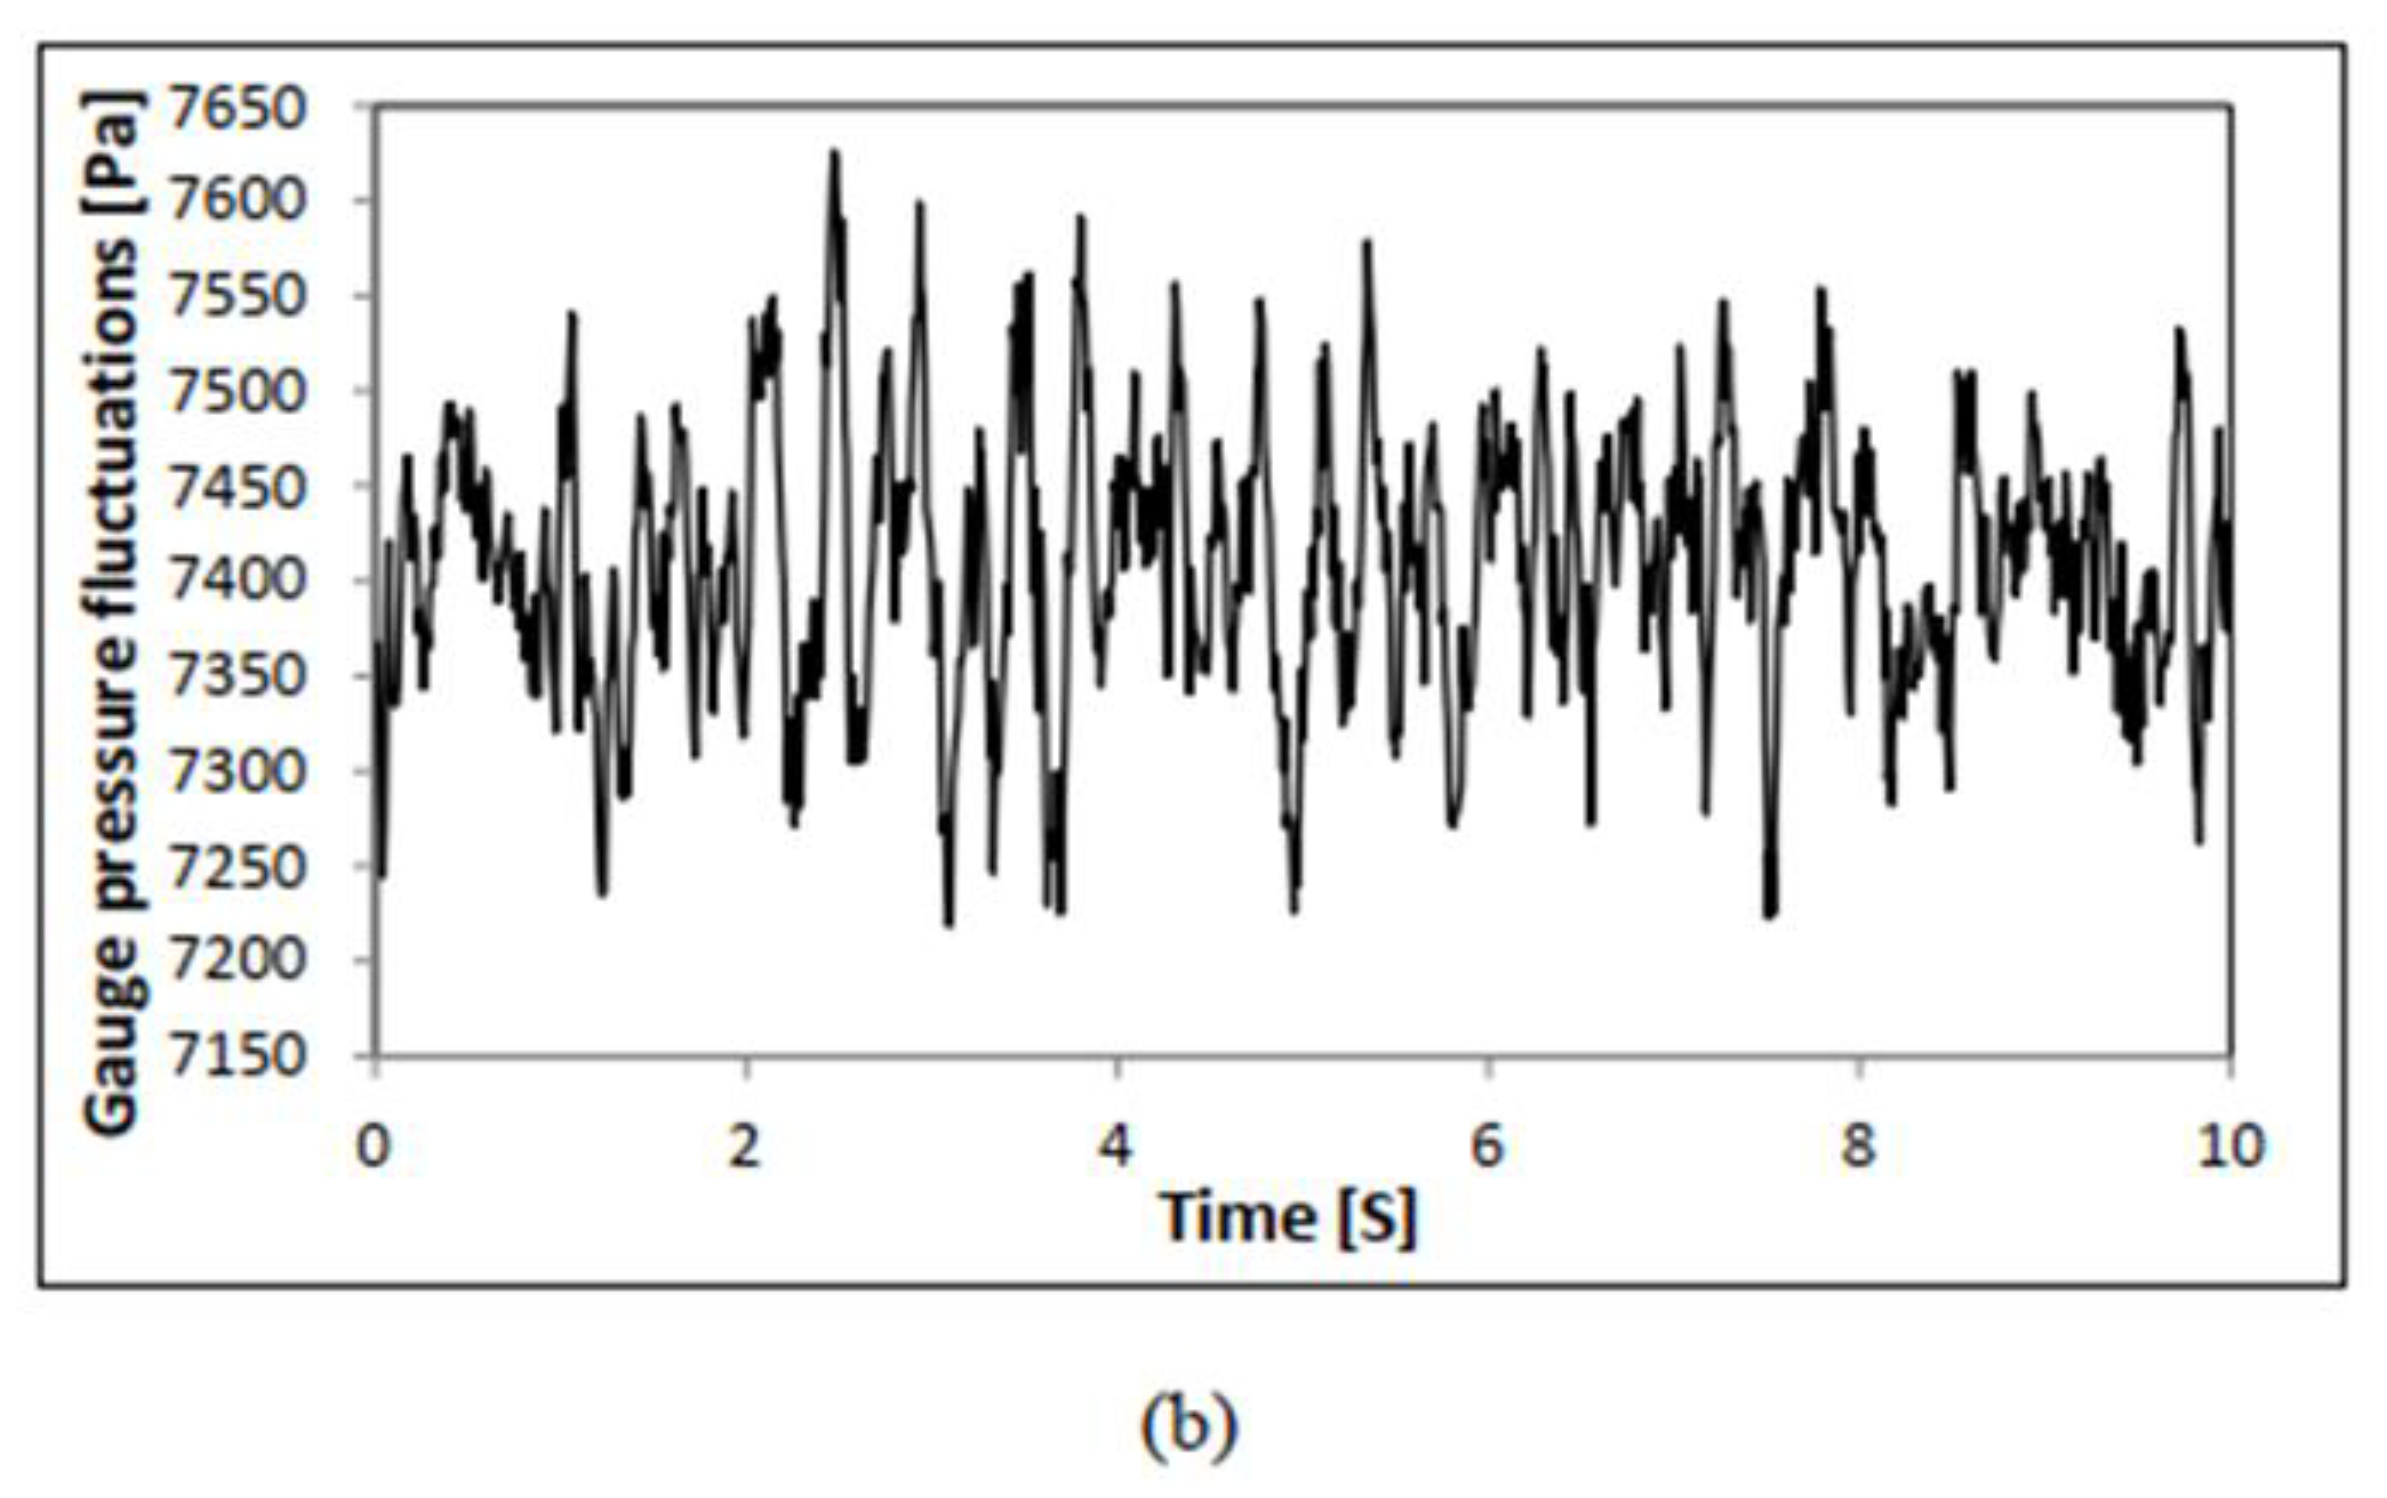
The time series of the optical probe was evaluated for Cases 1 and 2. Plotting and comparing the optical probe signals (see Figure 14a,b) of both the beds showed that the fluctuations were completely different (the variance of voltage fluctuation used in the 0.14 m and 0.44 m beds were 0.88 and 0.28, respectively, and the percentage difference was % 68.18). The analysis of pressure fluctuation measurements by pressure transducers was evaluated for Cases 1 and 2. Plotting and comparing the gauge pressure fluctuations (see Figure 15a,b) of both the reactors showed that the fluctuations were completely different. The variance of pressure fluctuation used in 0.14 m and 0.44 m beds were 0.006321 and 0.002564, respectively, and the percentage difference was % 61.42. The results indicated that the reported dimensionless groups are not sufficient to obtain similarity between two different sized fluidize beds where such groups did not take into account the whole bed hydrodynamics.
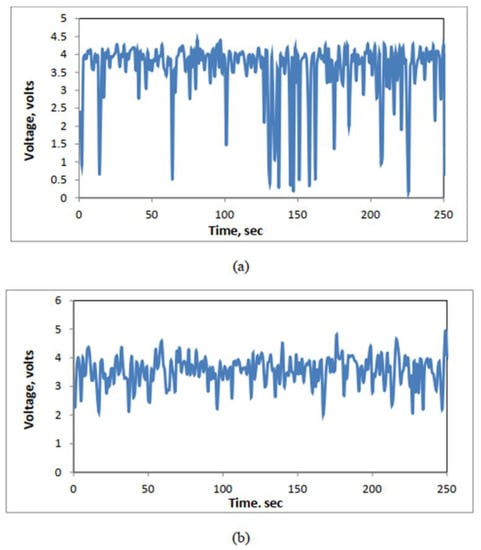
Figure 14.
Optical probe signal for matching conditions (a) Case 2 in 0.14 m inner dimeter bed and (b) Case 1 in 0.44 m inner dimeter fluidized beds at axial height (H/D = 1.7) and radial location (r/R = 0.5).

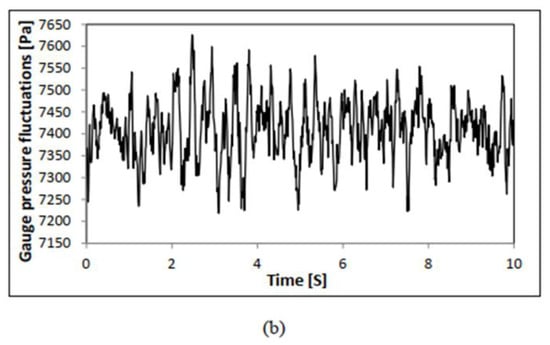
Figure 15.
Gauge Pressure Fluctuations for Matching Conditions (a) (Case 2) in 0.14 m ID and (b) (Case 1) in 0.44 m ID Fluidized Beds at Axial Height (H/D = 1.7).
4. Conclusions
The key conclusion drawn from the results of this work is that the dimensionless groups proposed by Glicksman et al. [20] are not sufficient to maintain similarity in terms of solids hold-up, gas hold-up, dimensionless up flowing particles velocity, and up flowing mass flux profiles. In addition, the analysis of the optical probe and pressure transducer signals showed different patterns in the fluidized beds at the compared levels of measurements. The statistical analysis of mean and variance also confirmed the deviations between the investigated fluidized beds. Having said that, it is also to mention the difficulty of matching all the key dimensionless groups between different sized fluidized beds. Finally, establishing a reliable methodology based on dimensional analysis for the scale-up of fluidized beds, must consider not only the similarity in global hydrodynamics, but also the similarity in local hydrodynamics which is not easy to achieve. Finally, a new phenomenological scale-up methodology of gas–solids fluidized beds is needed to be developed along with the assessment of local key parameter(s) that dictate the dynamics of the fluidized beds.
Author Contributions
Conceptualization, M.H.A.-D., Methodology, F.M.Z., H.A.-R., T.M.A. and M.H.A.-D.; Validation, F.M.Z.; Formal analysis, F.M.Z., H.A.-R., T.M.A. and M.H.A.-D.; Investigation, F.M.Z., H.A.-R., T.M.A. and M.H.A.-D.; Resources, F.M.Z. and M.H.A.-D.; Data Curation, F.M.Z.; Writing—Original Draft, F.M.Z., H.A.-R., T.M.A. and M.H.A.-D.; Writing—Review & Editing, H.A.-R., T.M.A. and M.H.A.-D.; Visualization, T.M.A.; Supervision, M.H.A.-D.; Funding acquisition, M.H.A.-D. All authors have read and agreed to the published version of the manuscript.
Funding
This research received no external funding.
Data Availability Statement
Not applicable.
Conflicts of Interest
The authors declare no conflict of interest.
Nomenclature
| Symbols | |
| Column Diameter | |
| Particle Diameter | |
| FBR | Fluidized Bed Reactor |
| Froude Number | |
| g | Gravitational Constant |
| H | Bed Height |
| L | Column Height |
| P | Pressure |
| Gas Reynold No. | |
| Particle Reynold No. | |
| Drag Coefficient | |
| Coefficient of Particle Restitution | |
| Particle-Wall restitution coefficient | |
| Production of Turbulence Kinetic Energy | |
| Radial Distribution Function | |
| The Second Invariant of the Deviatoric Stress Tensor | |
| Unit Tensor | |
| Turbulence Quantities of Gas Phase | |
| P | Bed Pressure |
| Overall Pressure Drop | |
| T | Temperature |
| t | Time |
| U | Superficial Gas Velocity |
| Umf | Minimum Fluidization Velocity |
| Particle Velocity | |
| Terminal Velocity | |
| Greek letters | |
| Gas Volume Fraction | |
| Solid Volume Fraction | |
| Specularity Coefficient | |
| Diffusion Coefficient | |
| Energy Dissipation | |
| Stress Tensor | |
| Solid Bulk Viscosity | |
| Solid Shear Viscosity | |
| Solid Collisional Viscosity | |
| Solid Frictional Viscosity | |
| Solid Kinetic Viscosity | |
| Internal Friction Angle of Particle | |
| Transfer rate of Kinetic Energy | |
| Density | |
| Granular Temperature | |
| Dispersion Prandtl Number | |
References
- Sun, Y.; Sage, V.; Sun, Z. An enhanced process of using direct fluidized bed calcination of shrimp shell for biodiesel catalyst preparation. Chem. Eng. Res. Des. 2017, 126, 142–152. [Google Scholar] [CrossRef]
- Kim, S.W.; Kim, S.D. Void Properties in Dense Bed of Cold-Flow Fluid Catalytic Cracking Regenerator. Processes 2018, 6, 80. [Google Scholar] [CrossRef]
- Husin, H.; Faisal, M.; Gani, A.; Mamat, R. Combustion Efficiency in a Fluidized-Bed Combustor with a Modified Perforated Plate for Air Distribution. Processes 2021, 9, 1489. [Google Scholar]
- Git, P.; Hofmeister, M.; Singer, R.F.; Körner, C. Fluidization behavior of graphitized glassy particles in a fluidized carbon bed cooling process for investment casting. Particuology 2022, 65, 32–38. [Google Scholar] [CrossRef]
- Zhuang, H.; Chen, X.; Feng, T. Research on Technology of Medicinal Functional Food. Processes 2022, 10, 1509. [Google Scholar] [CrossRef]
- Coppola, A.; Scala, F.; Azadi, M. Direct Dry Carbonation of Mining and Industrial Wastes in a Fluidized Bed for Offsetting Carbon Emissions. Processes 2022, 10, 582. [Google Scholar] [CrossRef]
- Zhang, R.; Hoffmann, T.; Tsotsas, E. Novel Technique for Coating of Fine Particles Using Fluidized Bed and Aerosol Atomizer. Processes 2020, 8, 1525. [Google Scholar] [CrossRef]
- Ali, N.; Al-Juwaya, T.; Al-Dahhan, M. An advanced evaluation of spouted beds scale-up for coating TRISO nuclear fuel particles using Radioactive Particle Tracking (RPT). Exp. Therm. Fluid Sci. 2017, 80, 90–104. [Google Scholar] [CrossRef]
- Wang, S.; Shen, Y. Particle-scale modelling of the pyrolysis of end-of-life solar panel particles in fluidized bed reactors. Resour. Conserv. Recycl. 2022, 183, 106378. [Google Scholar] [CrossRef]
- Żukowski, W.; Jankowski, D.; Wrona, J.; Berkowicz-Płatek, G. Combustion behavior and pollutant emission characteristics of polymers and biomass in a bubbling fluidized bed reactor. Energy 2023, 263, 125953. [Google Scholar] [CrossRef]
- Wang, S.; Shen, Y. Coarse-grained CFD-DEM modelling of dense gas-solid reacting flow. Int. J. Heat Mass Transf. 2022, 184, 122302. [Google Scholar] [CrossRef]
- Abdelmotalib, H.M.; Youssef, M.A.M.; Hassan, A.A.; Youn, S.B.; Im, I.-T. Heat transfer process in gas–solid fluidized bed combustors: A review. Int. J. Heat Mass Transf. 2015, 89, 567–575. [Google Scholar] [CrossRef]
- Horio, M.; Nonaka, A.; Sawa, Y.; Muchi, I. A new similarity rule for fluidized bed scale-up. AIChE J. 1986, 32, 1466–1482. [Google Scholar] [CrossRef]
- Efhaima, A.; Al-Dahhan, M.H. Assessment of scale-up dimensionless groups methodology of gas-solid fluidized beds using advanced non-invasive measurement techniques (CT and RPT). Can. J. Chem. Eng. 2017, 95, 656–669. [Google Scholar] [CrossRef]
- Efhaima, A.; Al-Dahhan, M.H. Validation of the new mechanistic scale-up of gas-solid fluidized beds using advanced non-invasive measurement techniques. Can. J. Chem. Eng. 2021, 99, 1984–2002. [Google Scholar] [CrossRef]
- Glicksman, L.R. Scaling relationships for fluidized beds. Chem. Eng. Sci. 1984, 39, 1373–1379. [Google Scholar] [CrossRef]
- Nicastro, M.T.; Glicksman, L.R. Experimental verification of scaling relationships for fluidized bed. Chem. Eng. Sci. 1984, 39, 1381–1391. [Google Scholar] [CrossRef]
- Schouten, J.C.; Vander Stappen, M.L.M.; Van Den Bleek, C.M. Scale-up of chaotic fluidized bed hydrodynamics. Chem. Eng. Sci. 1996, 51, 1991–2000. [Google Scholar] [CrossRef]
- Mabrouk, R.; Radmanesh, R.; Chaouki, J.; Guy, C. Scale Effects on Fluidized Bed Hydrodynamics. Int. J. Chem. React. Eng. 2005, 3. [Google Scholar] [CrossRef]
- Glicksman, L.R.; Hyre, M.; Woloshun, K. Simplified scaling relationships for fluidized beds. Powder Technol. 1993, 77, 177–199. [Google Scholar] [CrossRef]
- Knowlton, T.M.; Karri, S.B.R.; Issangya, A. Scale-up of fluidized-bed hydrodynamics. Powder Technol. 2005, 150, 72–77. [Google Scholar] [CrossRef]
- Patience, G.S.; Chaouki, J.; Berruti, F.; Wong, R. Scaling considerations for circulating fluidized bed risers. Powder Technol. 1992, 72, 31–37. [Google Scholar] [CrossRef]
- Rüdisüli, M.; Schildhauer, T.J.; Biollaz, S.M.A.; van Ommen, J.R. Scale-up of bubbling fluidized bed reactors—A review. Powder Technol. 2012, 217, 21–38. [Google Scholar] [CrossRef]
- Frye, C.G.; Lake, W.C.; Eckstrom, H.C. Gas-solid contacting with ozone decomposition reaction. AIChE J. 1958, 4, 403–408. [Google Scholar] [CrossRef]
- Chen, W.; Hasegawa, T.; Tsutsumi, A.; Otawara, K. Scale-up effects on the time-averaged and dynamic behavior in bubble column reactors. Chem. Eng. Sci. 2001, 56, 6149–6155. [Google Scholar] [CrossRef]
- van Ommen, J.R.; Teuling, M.; Nijenhuis, J.; van Wachem, B.G.M. Computational validation of the scaling rules for fluidized beds. Powder Technol. 2006, 163, 32–40. [Google Scholar] [CrossRef]
- Romero, J.B. Factors Affecting Fluidized Bed Quality; University of Washington: Seattle, WA, USA, 1959. [Google Scholar]
- Broadhurst, T.; Becker, H. The Application of the Theory of Dimensions to Fluidized Beds. In Proceedings of the International Symposium, Fluidization and its Applications, Toulouse, France; 1973; pp. 10–27. [Google Scholar]
- Foscolo, P.U.; Di Felice, R.; Gibilaro, L.G.; Pistone, L.; Piccolo, V. Scaling relationships for fluidisation: The generalised particle bed model. Chem. Eng. Sci. 1990, 45, 1647–1651. [Google Scholar] [CrossRef]
- Glicksman, L.R. Scaling relationships for fluidized beds. Chem. Eng. Sci. 1988, 43, 1419–1421. [Google Scholar] [CrossRef]
- Clift, R.; Grace, J.R. The Mechanism of Bubble Break-Up in Fluidised Beds. Chem. Eng. Sci. 1972, 27, 2309–2310. [Google Scholar] [CrossRef]
- Stein, M.; Ding, Y.L.; Seville, J.P.K. Experimental verification of the scaling relationships for bubbling gas-fluidised beds using the PEPT technique. Chem. Eng. Sci. 2002, 57, 3649–3658. [Google Scholar] [CrossRef]
- Taofeeq, H.; Al-Dahhan, M. Comparison between the new mechanistic and the chaos scale-up methods for gas-solid fluidized beds. Chin. J. Chem. Eng. 2018, 26, 1401–1411. [Google Scholar] [CrossRef]
- Aradhya, S.; Taofeeq, H.; Al-Dahhan, M. Evaluation of the dimensionless groups based scale-up of gas–solid spouted beds. Int. J. Multiph. Flow 2017, 94, 209–218. [Google Scholar] [CrossRef]
- Zhang, H.; Johnston, P.M.; Zhu, J.X.; de Lasa, H.I.; Bergougnou, M.A. A novel calibration procedure for a fiber optic solids concentration probe. Powder Technol. 1998, 100, 260–272. [Google Scholar] [CrossRef]
- Wang, Z.; Bi, H.T.; Lim, C.J. Measurements of local flow structures of conical spouted beds by optical fibre probes. Can. J. Chem. Eng. 2009, 87, 264–273. [Google Scholar] [CrossRef]
- Wang, C.; Li, Z.; Wei, J.; Lan, X.; Ye, M.; Gao, J. Quantitative Measurement of Solids Holdup for Group A and B Particles Using Images and Its Application in Fluidized Bed Reactors. Processes 2022, 10, 610. [Google Scholar] [CrossRef]
- Hilal, N.; Gunn, D.J. Solid hold up in gas fluidised beds. Chem. Eng. Process. Process Intensif. 2002, 41, 373–379. [Google Scholar] [CrossRef]
- Fogler, H.S.; Brown, L.F. Predictions of Fluidized Bed Operation Under Two Limiting Conditions: Reaction Control and Transport Control. In Chemical Reactors; American Chemical Society: Washington, DC, USA, 1981; Volume 168, pp. 31–54. [Google Scholar]
Disclaimer/Publisher’s Note: The statements, opinions and data contained in all publications are solely those of the individual author(s) and contributor(s) and not of MDPI and/or the editor(s). MDPI and/or the editor(s) disclaim responsibility for any injury to people or property resulting from any ideas, methods, instructions or products referred to in the content. |
© 2023 by the authors. Licensee MDPI, Basel, Switzerland. This article is an open access article distributed under the terms and conditions of the Creative Commons Attribution (CC BY) license (https://creativecommons.org/licenses/by/4.0/).

