Article

Applications and Development of X-ray Inspection Techniques in Battery Cell Production

1
Institute of Machine Tools and Production Technology, Technische Universität Braunschweig, 38106 Braunschweig, Germany
2
PowerCo SE, R&D-Line, 38239 Salzgitter, Germany
3
Battery LabFactory Braunschweig, Technische Universität Braunschweig, 38106 Braunschweig, Germany
*
Author to whom correspondence should be addressed.
These authors contributed equally to this work.
Processes 2023, 11(1), 10; https://doi.org/10.3390/pr11010010
Submission received: 28 November 2022 / Revised: 15 December 2022 / Accepted: 16 December 2022 / Published: 21 December 2022
(This article belongs to the Section Manufacturing Processes and Systems)

Abstract

:
Demand for lithium-ion battery cells (LIB) for electromobility has risen sharply in recent years. In order to continue to serve this growing market, large-scale production capacities require further expansion and the overall effectiveness of processes must be increased. Effectiveness can be significantly optimized through innovative manufacturing technology and by identifying scrap early in the production chain. To enable these two approaches, it is imperative to quantify safety- and function-critical product features in critical manufacturing steps through appropriate measurement techniques. The overview in this paper on quality control in LIB production illustrates the necessity for improved inspection techniques with X-rays to realize a fast, online measurement of inner features in large-scale cell assembly with short cycle times and to visualize inner product-process interactions for the optimization in electrolyte filling. Therefore, two new inspection techniques are presented that contribute to overcoming the aforementioned challenges through the targeted use of X-rays. First, based on the results of previous experiments in which the X-ray beam directions were deliberately varied, a online coordinate measurement of anode-cathode (AC) overhang was developed using a line detector. Second, a new concept and the results of a continuous 2D visualization of the electrolyte filling process are presented, which can be used in the future to optimize this time-critical process step. By using a X-ray-permeable and portable vacuum chamber it is possible to quantify the influence of process parameters on the distribution of the electrolyte in the LIB.

1. Introduction

LIBs have become established in mobile applications due to their comparatively high energy and power density combined with long lifetime. For this reason, LIBs are the key technology for electromobility from a technical and economic point of view [1,2]. However, in order to achieve the maximum electrochemical performance in every phase of the battery life cycle, a very high manufacturing quality has to be assured [3]. The primary challenge for a high quality of the product and a fast cell development process is the very high depth of production with complex and coupled subprocesses. Reliable testing of critical parameters of each part during production not only increases the overall safety of the cells produced, but also enables early detection of scrap parts in the production chain. As a result, subsequent production steps are not burdened with defective material, which increases overall effectiveness. For this reason, a great number of conventional and innovative inspection processes are being used and further being developed for quality control in lab- and large-scale production [4]. In recent years, many new, adapted applications with different principles have therefore been implemented for LIB production. In addition to non-destructive methods such as eddy current testing [5], ultrasonic testing [6] and classical visual inspection [7], X-rays are also used to characterize LIB materials in particular and to inspect the inner of intermediate products.
The following study begins by presenting the fundamentals of X-ray technology and then provides an overview of the current quality control and applications of X-ray inspection methods in LIB production. This overview shows that the potential for the use of X-rays to measure the dimensions of inner feature has not yet been exhausted in cell assembly. Based on this current state of the art, two novel test methods are presented that make a fundamental contribution to the non-destructive inspection of internal dimensions and the visualization of product-process interactions. First, a novel method for determining the AC overhang in the electrode-separator compound (ESC) for large-scale industrial production is presented, while the second method focuses on the in situ visualization of the electrolyte filling process.

2. Basics of X-ray Inspection Techniques

The use of X-rays to characterize microscopic and macroscopic material properties is quite diverse. First, there are various techniques that analyze the radiation emitted by the material after excitation by rays [8]. For example, in Energy-dispersive X-ray spectroscopy (EDX) [9] or X-ray fluorescence (XRF) [10] emitted radiation is used to analyze the material composition or structure. Second, the diffraction of X-rays (XRD) [11] is analyzed to study the crystalline structure of materials. Third, the transmitted radiation is detected to characterize the material with X-ray near-edge absorption spectroscopy (XANES) [12] or to visualize the internal properties of a test object in radiography. Radiography allows measurements with resolutions from few μm (with special systems below μm) to several mm in industrial applications [13].
The focus of this publication are inspection systems that make use of the radiography method and consist of at least one tube, a detector and a sample manipulator. A principle sketch, the arrangement of the components and a conventional X-ray inspection machine can be seen in the Figure 1a–c. The X-ray tube consists of a thin filament and a target usually made of tungsten. High electric currents flowing through the filament allow electrons to overcome the work function and leave the filament. These electrons are then accelerated from the cathode (filament) to an anode by a defined acceleration voltage. The deceleration of the electrons as they strike the anode material produces a characteristic radiation called Bremsstrahlung. The braking radiation can be influenced directly by adjusting the filament current and the accelerating voltage. The point of impact on the anode is called the focal spot [14].
The X-rays emerge from the tube aperture in a cone shape and interacts in the following with the test object. The absorption of the X-ray radiation depends on the geometric and chemical characteristics of the test object. The physical relationship is described by Lambert Beer’s law. The radiation intensity I R T passing through a homogeneous test sample with thickness h and a total attenuation coefficient μ can be calculated with the knowledge of the initial penetrating intensity I R T , 0 as follows [15]:
I R T = I R T , 0 · e μ · h .
The total attenuation coefficient μ depends on the material to be transmitted and is composed of the sum of the absorption coefficient, scattering coefficient and pair formation coefficient. The behavior of the coefficients is nonlinear over the radiant energy, resulting in an ideal braking spectrum as a function of the material and the direction of transmission. Due to the variation of the inner features of the test object the radiation intensity changes locally. In radiography there is always a superposition of features that are in the same radiation path. This effect is also shown in the sketch of Figure 1b. The part of the X-ray radiation I R T that is not absorbed in the sample reaches the top layer of the detector. Indirectly converting flat-panel detectors (FPD) are used as standard. In these detectors the X-rays are converted into visible light in a scintillator. Finally, a second light-sensitive layer converts the visible light into an electrical signal and a digital X-ray image is generated. The detector technology has improved tremendously in recent years so that 10 MP detectors and a pixel pitch of up to 200 μm are standard [16]. In addition to the basic quadratic form, line detectors are also available for large components or in production, where a quick image of usually moving samples is necessary. Due to the cone shaped beam spread of the X-ray radiation, the laws of central projection apply in radiographic inspection. These are also presented in the Figure 1a,b. The X-ray that hits the detector orthogonally is called the central beam. The plane that is parallel to the detector plane is subsequently referred to as the object plane. Due to the central projection the effects of geometric magnification, parallax, distortion and isometry have to be understood. These depend on the distances between focal point and object plane F O D as well as focal point and detector plane F D D . The geometric magnification defines the relationship between the resulting magnification of the projection of a feature in the detector plane. The magnification M depends on the position of the object plane between detector and focus and is defined with M = F D D / F O D . The central projection does not allow direct measurement in one single X-ray image without knowledge of the position of the feature relative to the tube and detector. The term parallax describes the effect that the change in position of a projection in the detector plane dependents also on the distance of the object plane to the focal point. The smaller the distance F O D , the greater the change in position of the projection when the feature moves in the object plane. The distortion describes the shape deviation of the projection depending on the distance of a feature in the object plane to the center beam. However, if the feature is located exclusively in one object plane then the size and shape of the projection does not change [17].
Basic working principles in radiography can be distinguished. All methods exploit the rules of center beam projection. In radiography, the object is imaged from only one direction. The generated X-ray image is primarily used for presence checking and attribute testing of features. Another established method is computed tomography (CT), in which the data acquisition is dependent on location and time. The test object rotates in a defined position in the beam path and several X-ray images are taken from different object directions. With this data a 3D reconstruction of the object can be realized and relative measurements of distances between inner features are possible. In addition to a CT, techniques such as linear or circular laminography are also applied. Linear laminography is mainly used for online inspection for thin, large area electronic components. In this process, the object, detector, and tube move in an opposing circular path in a parallel plane. The resulting oblique transmission allows object planes to be defined with high resolution. Thus, for thick components, multiple scans must be performed to create a volume in the center beam direction. In circular laminography or planar CT the detector and the tube are moved simultaneously in opposite directions, so that many projections from different directions of the component are acquired [18].
With these different inspection techniques the use of X-ray is very flexible and versatile. In large-scale production, the biggest challenge is to find and develop the most suitable image acquisition for a specific task. At the same time, the requirements of a very short measurement time must be implemented without parallelization of the expensive system concepts. For this reason, X-rays techniques are also used and optimized extensively for quality control of inner features of a LIB in production on lab and large-scale. An overview of these applications of X-ray inspection techniques is given in the following Section.

3. Quality Control and X-ray Inspection Techniques in Battery Cell Production

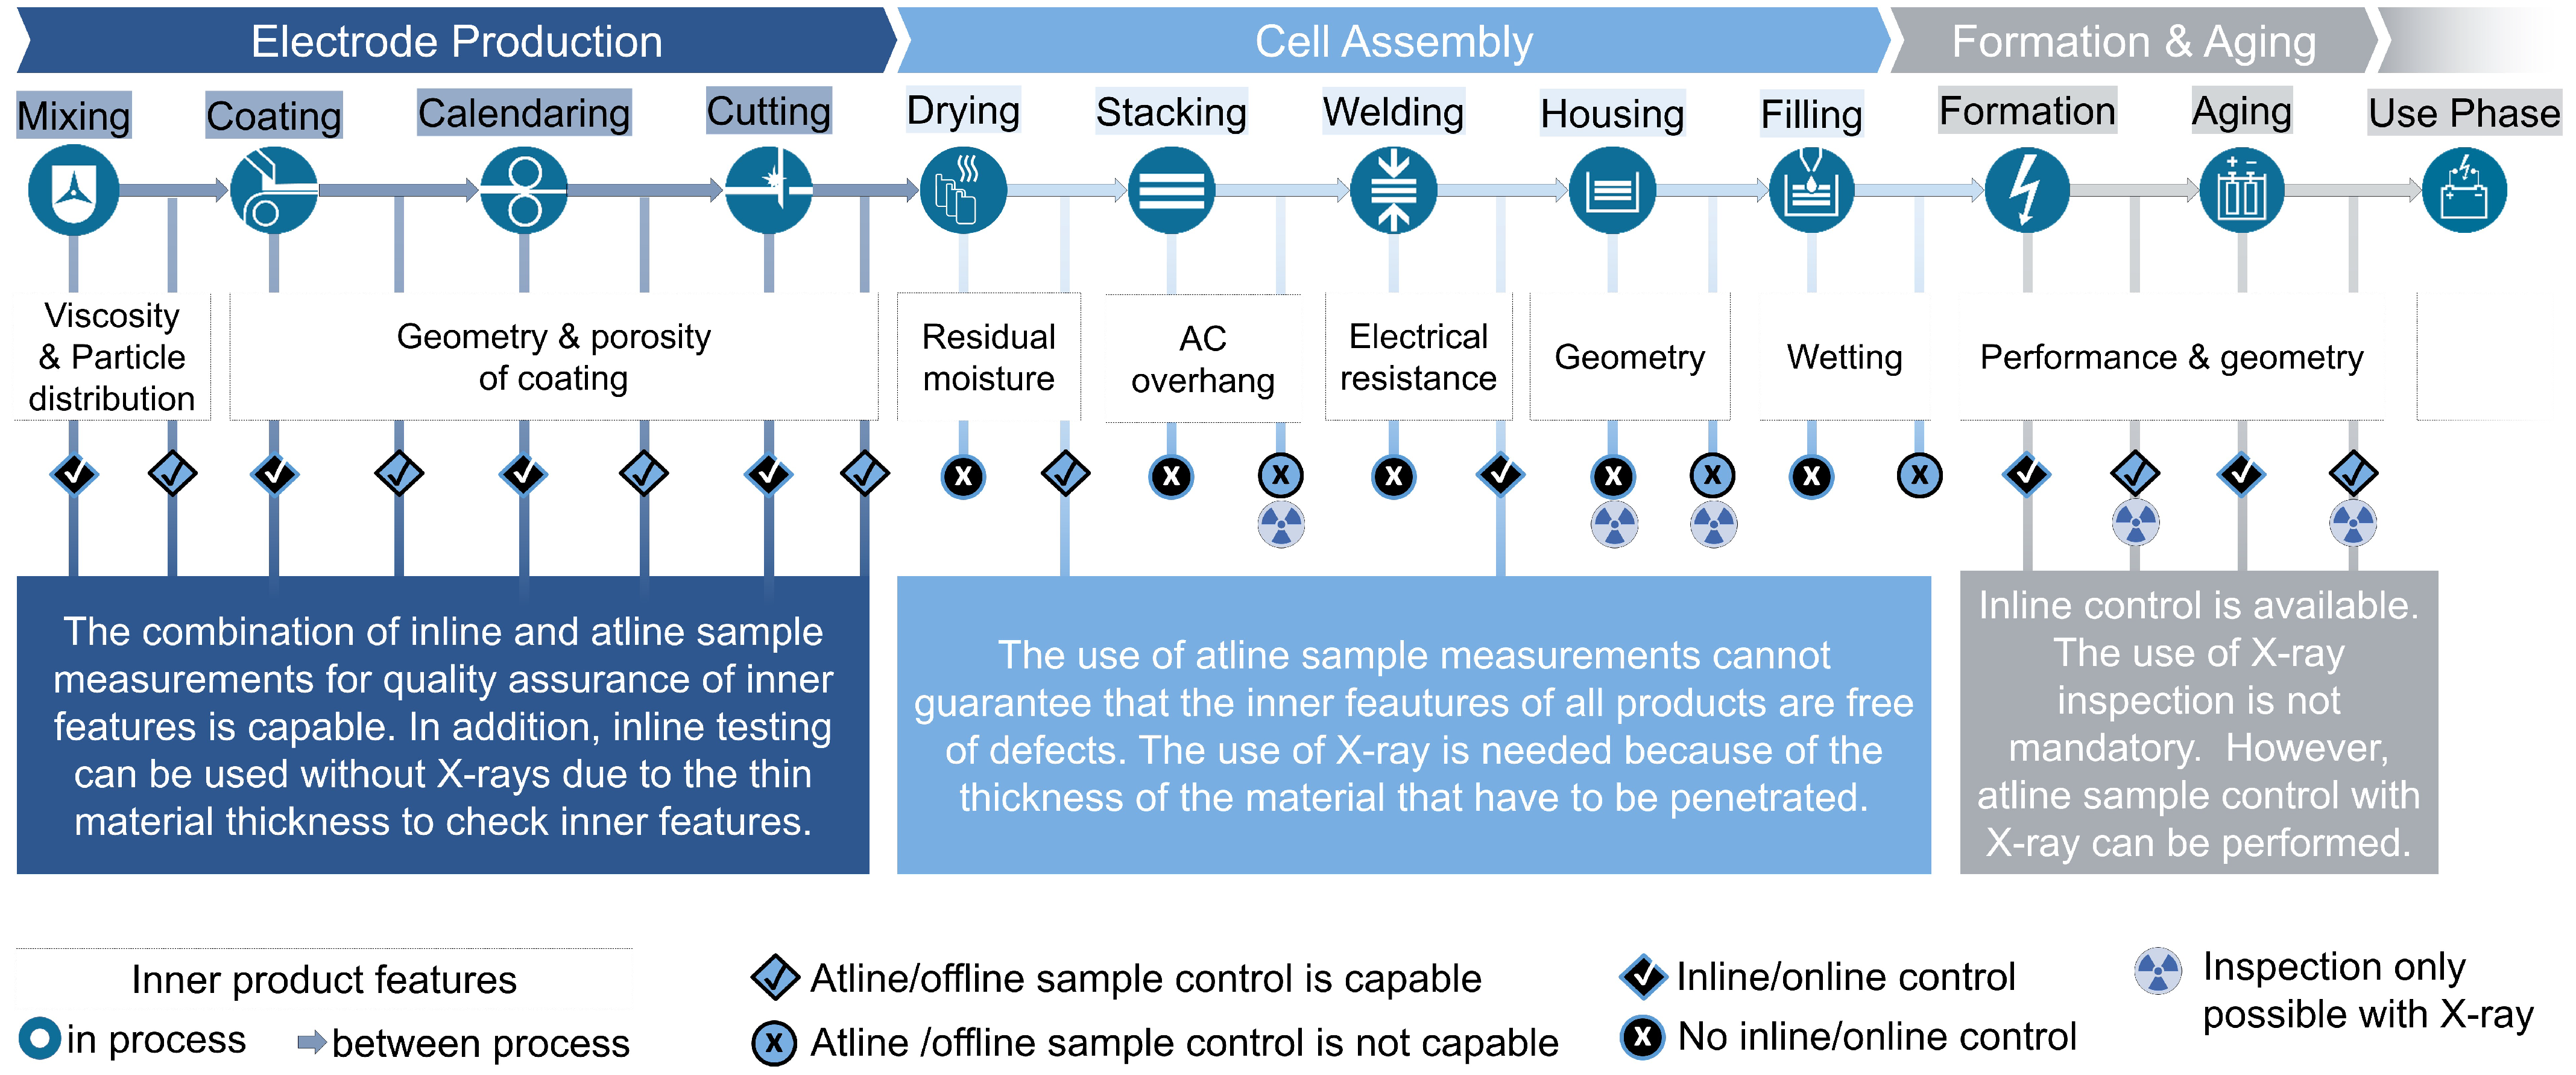
The aim of this Section is to provide a systematic overview of the most important inner features of intermediate products in specific production steps and the status of inspection techniques in lab- and large-scale LIB production. At this point, it must be mentioned that not all process techniques are described in an overall manner. Primarily, the standard process of cell manufacturing is presented, which can also be implemented in this form in the Battery LabFactory Braunschweig. In this steps the general status of quality assurance and, in particular, the use of X-ray inspection techniques for intermediate product features are presented. In the following descriptions, the measuring equipment is divided into the different classes inline, online, atline or offline, based on the definition of Dagger et al. [19]. An inline measuring method realizes a 100% control of features directly in the process. In contrast, an online method requires the implementation of an additional process step to realize a 100% control. Atline methods are manual random sample measurements, which require a short sample preparation. An offline method is distinguished from the other methods by a long sample preparation of random samples, so that an active process adjustment during production is not possible. On this basis, the demand for action for the further development of X-ray inspection techniques is then emphasized. The content of the following statements is illustrated by the Figure 2. For a further overview on all important process parameters, quality characteristics and measurement techniques in LIB production, Zanotto et al. [4] review is recommended.

3.1. Production of Electrodes

The raw materials for electrode production - active material, binder and conductive additives - are available in powder form. The selected formulation influences the physical and electrochemical properties of the following intermediate products (agglomerates, suspension, coating) of the electrode production and the final battery cell. In the first step of electrode production, these are mixed to create a suspension. In the dry mixing, the separate material particles are deagglomerated and blended. Depending on the desired result, the process is carried out with different process parameters, resulting in different viscosities and particle distributions of the suspension. In the subsequent wet mixing, dispersion - the equal distribution of the active materials, conductive additives and binders in a solvent - takes place. Here, it is mainly the dispersion time that influences the viscosity of the suspension and the subsequent pore size distribution in the electrode. In and after the mixing process, online and atline feature control can be performed by taking samples to measure the particle size distribution and viscosity [20,21]. In addition, there are online capable measuring systems that continuously monitor the properties of the suspension. Ref. [22] The use of X-rays is still uncommon in this area due to the high resolution necessary for the examination of particles in the submicrometre range and the resulting long scan times as well as the complex sample preparation. Usually the distribution of particles is determined offline by laser diffraction and the material composition by EDX [21]. However, there are first offline X-ray based approaches on lab level to examine the raw materials as well as the mixed agglomerates for their properties, such as internal cavities in the particles, which limit the energy density and promote degradation [23].
In the following coating process, the suspension is applied in a roll-to-roll process via doctor blade or nozzle application to the aluminum or copper foils, which later serve as current collector in the LIB. Homogeneity of the applied layer with uniform surface loading and sharp edges is of great importance. The coating process is immediately followed by the drying process, in which the applied suspension is exposed to heat—by conduction, convection or radiation - which evaporates the solvent and leaves behind the porous active material layer. Multiple temperature profiles are typically used to influence the porosity of the electrode, the adhesion and the distribution of carbon black as well as binder. For the inline inspection of quality parameters, e.g., ultrasound is used to determine the mass loading [24] or camera-based optical methods are used to determine coating defects on the surface [25,26,27]. Applications of X-ray based investigations in the coating process are mainly limited to the offline analysis of material properties. Investigations with micro- or nano-CTs and X-ray tomographic microscopy are used to determine the microstructural morphology and the distribution of the individual coating materials, such as active material, binder and conductive additives, to an accuracy of tenths of a micrometer [28,29]. These approaches are often supported by offline SEM images and different computational algorithms [30,31] to identify the components that are difficult to detect in the structure by X-ray technology. Many structural parameters such as porosity [32] or tortuosity [33] as well as optimization approaches for production processes and product development can be derived from the determined models of the electrode structures. The coated electrode is then compacted in a defined manner during the calendering process between two rolls. Thus, not only the thickness of the electrode is reduced, but also the adhesion to the current collector foil is improved, the surface roughness is balanced and a defined pore structure is set. This is important for proper electron and ion transport kinematics during LIB use. The influence of the calendering process step on the structural properties of the electrode coating is also being investigated offline using CT. Daemi et al. [34] and Lu et al. [35] have developed an offline inspection rig to observe the compression of the electrode coating and the displacement and deformation of the individual particles as well as the change in the pore structure inline. In this process step the use of X-ray technology is currently limited to gaining knowledge for structural parameters that are difficult to access.
The next step is cutting which can be divided into two processes. First, the wide electrode coil, also called mother coil, is divided into smaller daughter coils in the slitting machine. The width of these coils depends on the geometric formats of the electrodes for LIB construction. Depending on the LIB design, the coil is passed on directly (and wound for round or prismatic LIBs) or cut into individual electrode sheets using die or laser cutting. The quality of the cut edges is a quality criterion [36] and is conventionally determined inline by inline optical methods [37]. The use of X-ray inspection is usually not applied for quality control of the inner features in this process step. However, the analysis methods mentioned in the previous steps can also be used at this stage.

3.2. Cell Assembly

After the cutting process the anode, the cathode and the separator are transferred to the cell assembly. Until the LIB is enclosed, all following process steps take place in a conditioned, dry atmosphere to prevent the inclusion of water and impurities in the LIB structure. Water forms hydrofluoric acid with the electrolyte and reduces the capacity and cycling stability of the battery cell [38,39]. First, the water content of the electrodes is reduced in the drying process. An established atline method for determining the residual moisture in the sheets is Karl-Fischer tritation [40].
In the stacking process the ESC is built up. A differentiation of the process technologies is possible depending on the format of the input material. Either the electrodes and the separator can be processed as strip material or as single sheets. Winding, z-folding and single sheet stacking can thus be differentiated. Regardless of the type of composite, the accurate, absolute orientation and alignment of the all individual materials in the composite are critical to function and safety. A camera is often used in the process to measure the position of the electrodes inline after they have been deposited [41]. This method is not capable of measuring the final electrode placement in the stack, since a downstream shift of the electrodes in the process cannot be excluded. For this reason an atline CT in the corner region of the ESC is an established method to measure the relative, safety-critical anode-cathode (AC) overhang. Investigations with a standard CT system show that the AC overhang in prismatic and round LIBs can be measured by a one-hour scan (1900 projections) with voltage of 180 kV, current of 11 μA, and voxel size of 20 μA. In addition, variations in cathode coating thickness are visible [15]. Niedermeier et al. [42] investigates the influence of stepwise reduction of the number of projections from 1600 (measurement time = 53.3 min) to 120 (measurement time = 4 min) to inspect the electrode position in a corner region of a small round LIB. Despite reduction in data quality with shorter data acquisition time, a qualitative progression of AC overhang is visible. Moreover, automated processing of image data of the AC overhang was successfully implemented by Turetskyy et al. [43] and Pinter [44].
After building the ESC, the arrester tabs are welded to the single electrodes using the welding process. The welded connection must comply with specific mechanical and electrical properties. To realize this, it is important that a seam weld is homogeneous without the formation of unspecified alloys or defects like holes. The online inspection of the weld can be implemented with a electrical resistance test after the process or with a offline CT in the laboratory. The CT can resolve very small defects when compared to other non-destructive methods [45].
The next step of cell assembly is housing The contacted ESC is placed in the corresponding case—a soft plastic-aluminum composite foil (pouch LIBs) or a rigid aluminum housing (hardcase LIBs). After housing, the LIB can no longer be tested by visual inspection. Disassembling the LIBs can support further analysis of the interior. However, these methods do not guarantee that the interior will change as a result of disassembly. To measure the inner geometry, radiography or CT is the only capable technique at this point. With these methods, the position or even damage of the ESC in the case can be analyzed. In addition, with a high-resolution offline CT, the detection of particles can be implemented [4].
Between the ESC and the case is the dead volume. In the steps filling the electrolyte is filled through an opening in the LIB. From there, the electrolyte begins to wet the pore structures of the LIB stack materials. The duration of wetting is significantly longer compared to filling, so the LIBs must be stored for a sufficient time after final sealing [46]. This serves to ensure that all materials are sufficiently wetted and thus no uneven current densities occur during formation [2]. Current research approaches show that during filling and wetting of the LIB, the flow behavior and bubble development can be visualized using radiography [47,48,49]. Compared to determining the degree of wetting using electrochemical impedance spectroscopy (EIS) [50] or ultrasonic testing [6], X-rays allow the visualization of wetting in a location-dependent manner only comparable to neutron radiography [51]. As neutron radiography usually requires a powerful source of neutron radiation, such as nuclear reactors, this method is not transferable to industrial use. As such there remains a major challenge of high resolution and in situ visualization and quantification of electrolyte filling for evaluation of process parameters.

3.3. Formation and Aging

After all components for the LIB have been assembled, a formation and aging step is done. The the electrochemical performance is checked by monitoring battery characteristics in both steps. Finally, in the end-of-line test, a visual inspection and final documentation is performed for each LIB. These inline tests are associated with high process costs, so that defective LIBs are identified and excluded in the production process. If the LIB passes this final inspection, it is released for integration into the battery module and combined into a LIB system. In some cases, malfunctions occur in the LIB during operation, for example due to a short circuit. X-ray technology is used during electrical activation and after use phase to investigate correlations between the electrical characteristics and real condition. For example, delaminations of the active material from the substrate during the use phase can be detected [52]. Likewise, the influences of other defects on the structure of the LIB can be investigated [15] as well as the processes occurring during a thermal runaway [53].
X-ray investigations are also used for in-situ analysis of solid-electrolyte-interface evolution [54], gas evolution during formation [55] or structural change at particle level [56]. During the use phase of a LIB, there is a continuous cyclic reduction of the battery performances, despite the absence of defects, so that from circa 20% loss, the system is either reused in a following application or recycled. Offline X-ray technology is also used to characterize the LIBs for the respective application. Based on the detectable degradation of the electrode material by means of very fast scans, algorithms and sorting methods have been developed that perform a classification into reuse or recycling LIBs [57,58]. Also the influence of cycles with high C rates or of damaged packages is considered in different publications [59,60]. The use of X-ray technology has great potential to be used inline as a classification inspection of used LIBs for a circular production approach.

3.4. Summary and Reseach Gap

The previous Section shows that X-ray based techniques are used at various points in LIB production. However, there are clear differences in the necessity of using X-rays in electrode manufacturing, formation and aging compared to cell assembly. The main conclusions are summarized in the Figure 2.
In electrode manufacturing, X-rays are primarily used to quantify the material properties inside or on the surface of the electrode at the molecular level. Due to the very extensive preparation of samples, these applications can be considered as destructive, atline or offline sample measurement methods. In fact, the offline measurements are very time-consuming and can only be implemented for small samples. However, destructive, offline sample measurements are acceptable, since this means only a small loss of material. Moreover, the combined control of inline and atline sample measurements gives a good indication of the overall quality of the batches. Adding to this, the overview shows that there is no need for using X-ray in electrode manufacturing for inline or online measurement processes. There are other principles of operation to inspect the inner intermediate product properties due to the thin material thickness of the products.
The situation is similar in the formation and aging process steps. The use of X-ray inspection is not mandatory in this process steps. Inline measurement technology is available for battery classification, which allows a reliable statement to be made about the condition and quality of the LIB. For further analyses of the internal geometry properties, however, an offline sample inspection with X-ray inspection can also be performed.
In contrast to the inspection methods in electrode manufacturing, formation and aging, there are only a few alternatives to X-ray technology for quality control or for investigate product-process interdependencies of the inner products features in cell assembly. On the one hand the destructive sampling of intermediates, as implemented in electrode production, is only of limited benefit in cell assembly, because this method is very time-consuming and difficult to convert into a reproducible process. In addition, destructive disassembly is associated with a very high loss of material due to the depth of added value already achieved. On the other hand there is no suitable non-destructive inspection techniques to realize a quality control of the correct position of inner features. Methods which use eddy current or ultrasonic testing are limited because of the thickness of LIB material that must be penetrated for examination and the need of high detail resolution in a large region of interest. Inspection techniques such as impedance spectroscopy and electrical tests only give global quality gates. Incorrect positioning of inner parts, which can lead to failures in later operation, cannot be checked directly. For these reasons, the inner features of the battery are usually examined with X-rays. Figure 2 shows that there is the need for new inline or online inspection methods in the process steps stacking, housing and electrolyte filling to measure the position of inner features or visualize product-process interactions. Currently there is only the possibility to perform a atline CT or an online radiography. Compared to CT, radiography can realize very short acquisition times of less than 0.2 s because only one X-ray image is needed. Due to the fast inspection time, radiography can realize an qualitative visual inspection in large-scale production where an inspection time of few seconds per LIB is required. However, a spatial measurement cannot be performed with a single radiography. Several X-ray images are required for a stereoscopic measurement, as with CT.
Due to the long data acquisition times caused by multiple exposures, 3D X-ray inspection techniques are of limited use for online monitoring, of large volumes in mass production or continuous inline process and product monitoring. Nevertheless, manufacturers strive to guarantee their customers a defect-free and reliable product. For this reason, there is a high demand to realize an economical 100% inspection of safety-relevant features with a fast X-ray inspection process and to continue to improve the product and the process.
In addition to the challenge of making offline inspections online capable, Figure 2 shows that the electrolyte filling process suffers from a lack of inspection techniques that can detect the interactions between product and process. Previous studies have shown that visualization with X-rays is possible. However, the studies were not conducted under real process conditions, so the use of X-rays in the filling process is currently unexplored.
At this point, two major research gaps are identified. First, new, fast inspection techniques need to be developed that can quickly measure components inside the LIB with just a few X-ray images with radiography to guarantee defect free products. On the other hand fundamentally new inspection techniques need to be developed to extend the use of radiography to better understand process-product interactions. In this context, two new inspection techniques are presented below, which are examples of new approaches for measuring the position of inner features in cell assembly and which provide a basis for further new developments. First, an online inspection of the safety- and function-critical intermediate property of the AC overhang with few X-ray images is presented as an alternative to atline CT. Second, a new setup is shown to visualize the process and product interactions in electrolyte filling with X-rays. This in situ inspection technique can be used in the future to optimize the electrolyte filling process.

4. Development of a Fast X-ray Inspection of Anode-Cathode Overhang in a Battery Cell

Section 3 illustrates that there is the need to investigate a online quality control of safety relevant inner intermediate features in cell assembly with a fast X-ray inspection technique. In this context, a novel X-ray inspection method is presented below using AC overhang as an example. The AC overhang describes the distances between all anodes and all cathodes. Usually, the anode is circumferentially larger than the cathode, so that a minimum distance between all anode and cathode edges must be maintained around the entire compound.The different size of the electrodes is chosen because it provides the best electrochemical performance of the LIB. Moreover, the anode and cathode edges have to be places in a specific tolerance region. This quality control is necessary because a shift of the electrode position outside the tolerance range leads to an increased occurrence of LIB failures. This can be justified by the fact that a deviation of the relative electrode position promotes dendrite growth due to inhomogeneous current density distributions. The configuration of a geometrically larger anode relative to the cathode is choosen, because this leads to lower dendrite growths in the edge region [41,61,62,63]. However, when dendrite growth is present, there is the risk of damage the separator and LIB failures will occur as a result. Because of this maintaining the AC overhang throughout the entire compound is a basic requirement, above all to be able to guarantee safe operation, but also to implement very small dead volumes in the housing. The AC overhang is therefore a safety, function and process critical feature, so the development of a 100% online X-ray inspection technique in large-scale cell assembly is desiderated.

4.1. Design of the Development Process

The goal is to develop an online 100% X-ray inspection of the AC overhang of a large-format ESC for automotive applications after the stacking process. In Section 3 the advantages and disadvantages of radiography and CT are discussed. The challenge is that only a time-intensive CT can measure the electrode position with high resolution and an qualitative visual inspection with X-ray images is not sufficient for a safety-relevant feature. There are two possible approaches to optimize inspection processes. The first option is to show the minimum number of projections in a CT to reduce scan time. The second option is to evaluate different radiography options to realize stereoscopy with a minimum number of X-ray images. The second approach with multiple radiographies offers significant advantages through linear transport without rotation compared to CT. Due to this resulting economic advantage the following first investigations focuses on the qualitative evaluation of different beam directions of an ESC corner using radiography.
The test object is a large-format ESC for automtotive applications. A sketch of the test object is shown in Figure 3. It is initially manufactured using a single-sheet stacking process. The ESC with a height of approx. 10 mm is built up from 62 separators, 31 anodes and 30 cathodes. The anodes and cathodes are numbered separately, from bottom to top. The separator consists of a ceramic-coated polyethylene layer and is the largest sheet with a length of around 300 mm and depth of around 90 mm. The anode is a copper foil coated on both sides with graphite. The cathodes consist of an aluminum substrate coated on both sides with lithium nickel manganese cobalt oxides. The electrodes have the same thickness and the cathodes are circumferentially smaller than the anodes.
In the first step a reference measurement of the AC overhang in one corner of the test object is performed with a high-resolution CT. To do so a conventional, horizontally X-ray system with an open reflection tube and a flat panel detector is used. After this, radiographies with different beam directions of the ESC corner will be performed to compare qualitatively whether measuring the electrode position is in the different configurations. A coordination system is depicted in Figure 3 and is used to determine the beam directions. This zero coordinate system is placed at the cross point of the mirror axes of ideally cut and positioned sheets. Thus, the short edge of the sheet (depth) is in y0-direction and the long edge of the sheet (length) is in x0-direction. The z0-axis points in the direction of the stack thickness. In order to provide a better understanding of the images, the position of the central beam is represented in all images by a red cross with a center point. A vertical X-ray system with a microfocus transmission tube and a flat panel detector is used for these investigations. After the reference CT, the ESC corner is evaluated with lateral beam direction in the x0y0-plane. Second, the ESC is radiographed in the vertical z0-direction. Based on these results, a new online inspecting technique for electrode position using a parallax-free vertical imaging is developed.

4.2. Reference CT

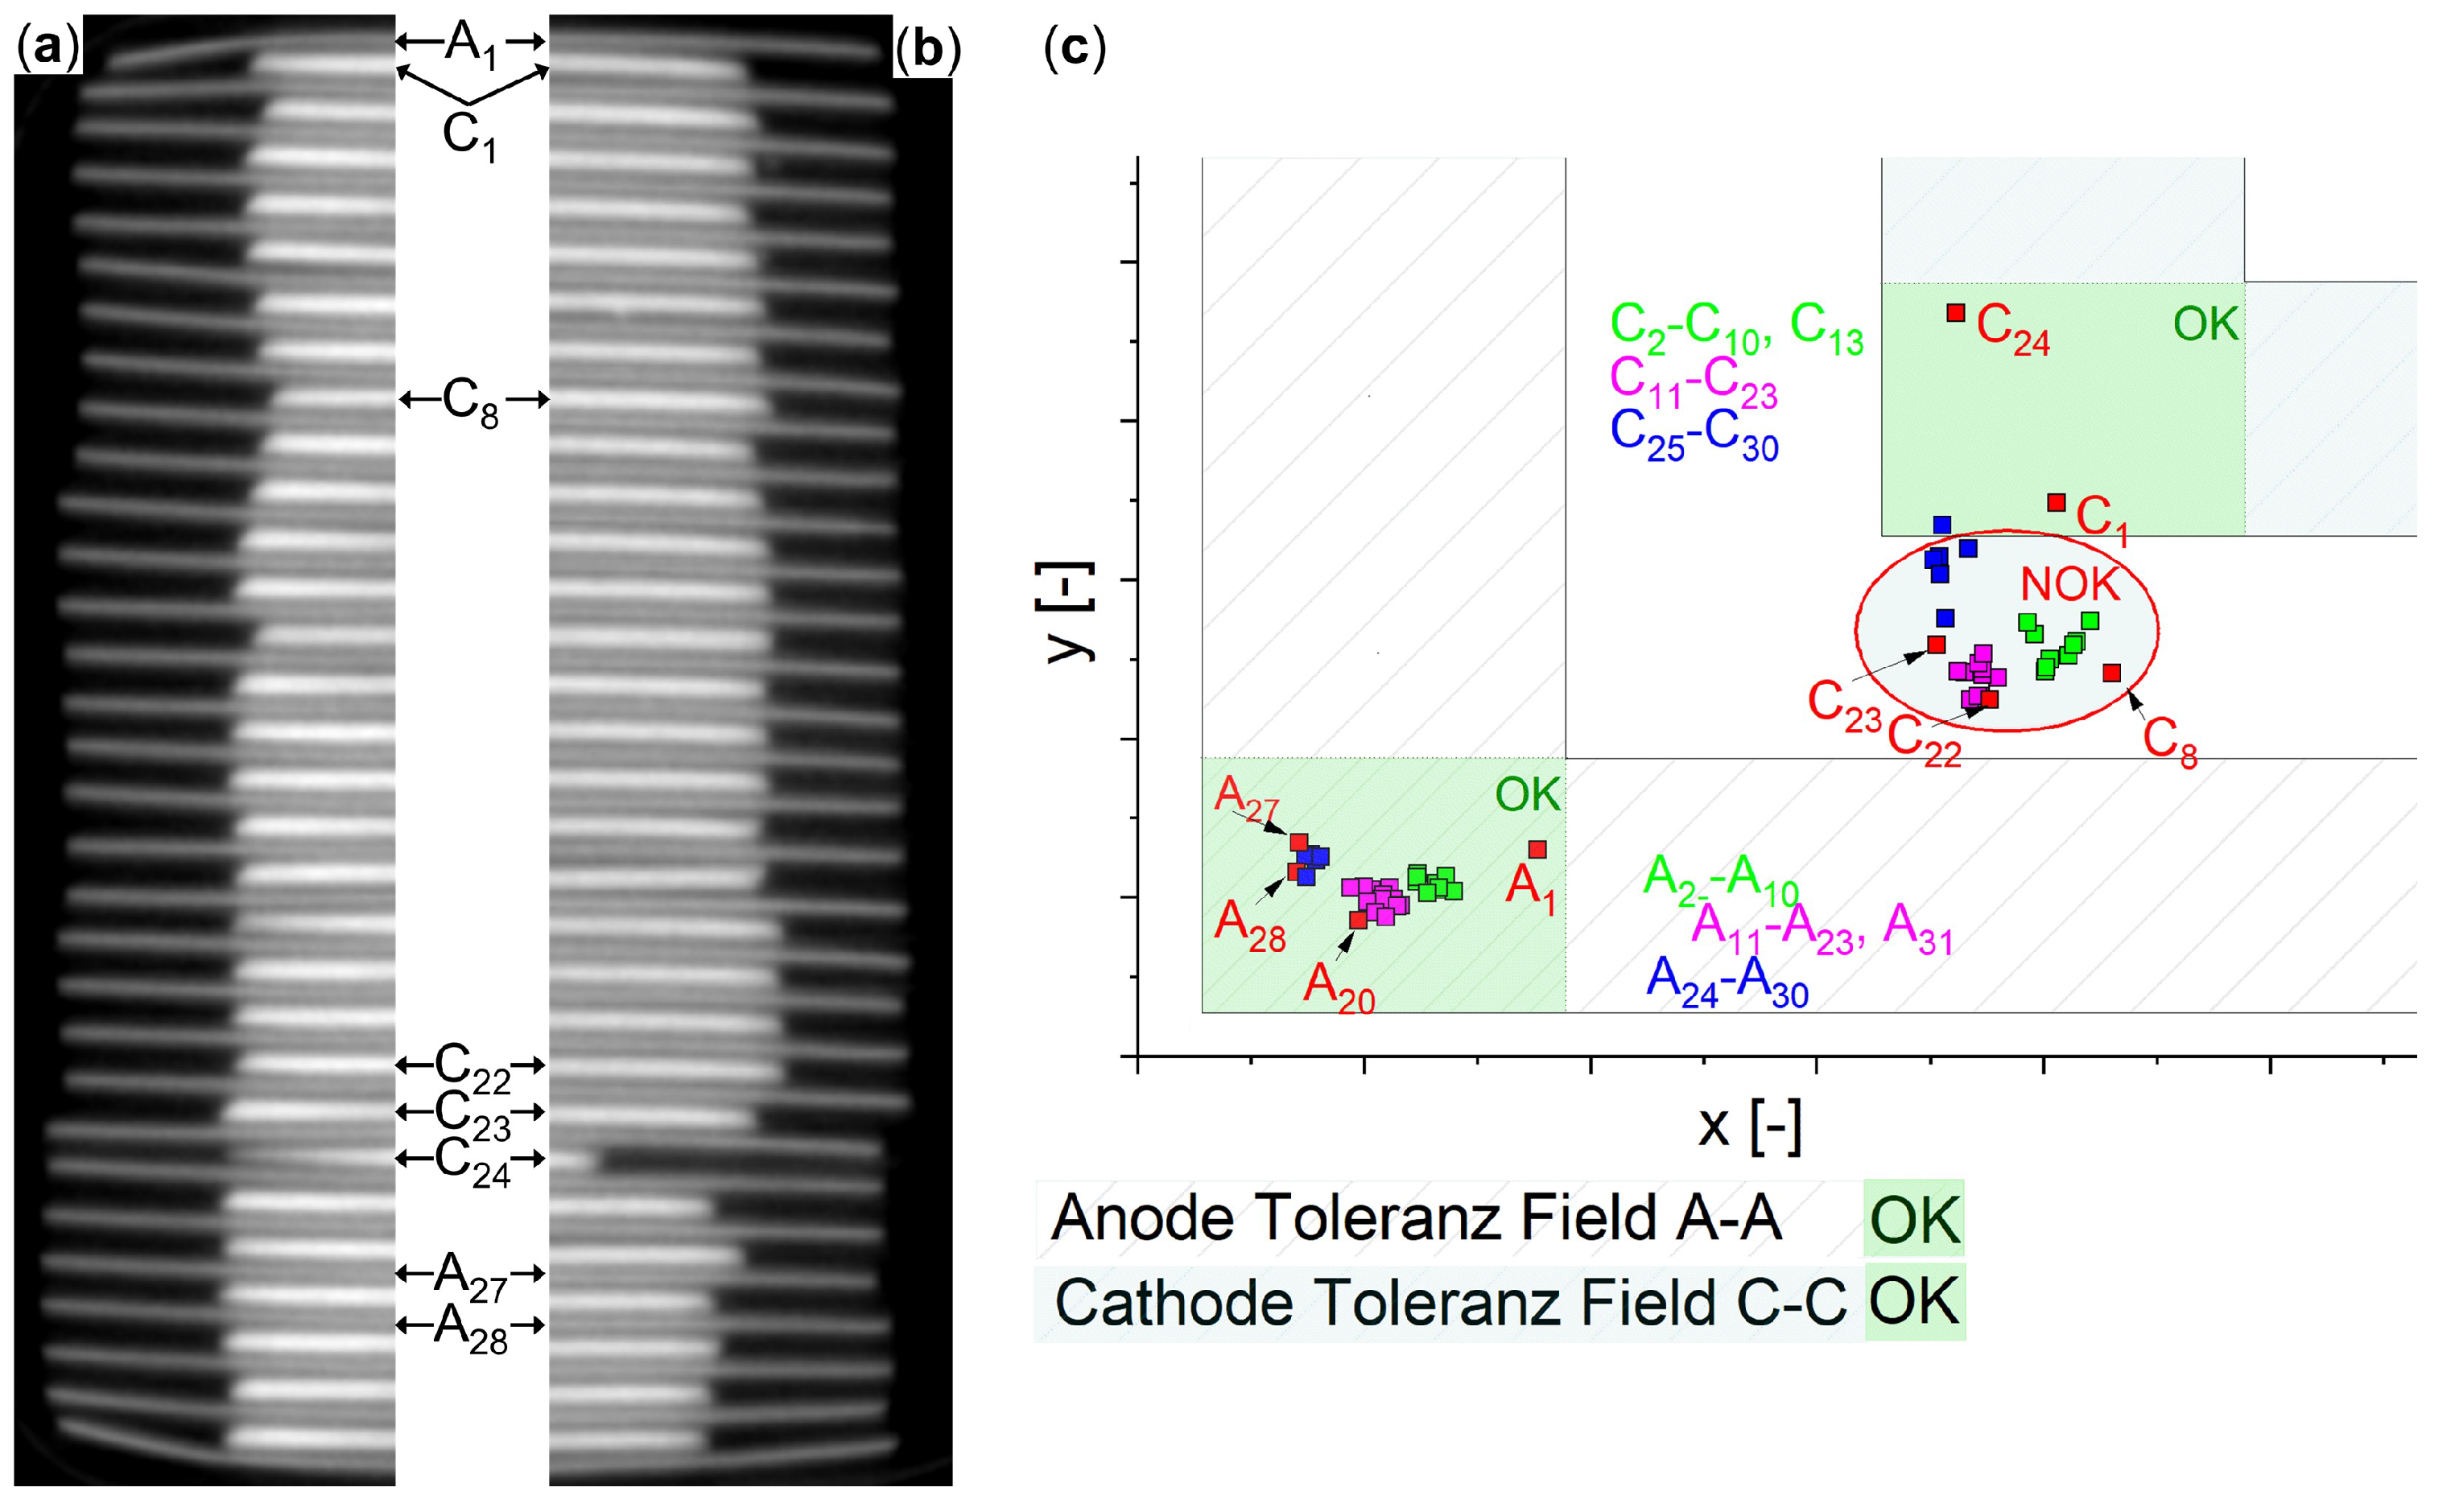
The CT is performed with an accelertion voltage of 200 kV, a filament current of 150 μm, a binning 1 × 1, frame binning of four and an exposure time of 200 ms are set. A total of 8280 images are taken and a scan time of around 28 min is needed. The resolution is 25 μm voxel. In the Figure 4a,b two CT slices in the x0z0- and y0z0-plane are shown. The separator is completely invisible in this setup. The position of the electrode edges is analyzed in various slice planes and merged into a linear function. By intersecting each electrode edge in the x0- and y0-directions, the relative vertices are calculated. The electrode edge points are plotted in the diagram (Figure 4c).
The data is adjusted so that the mean value of the anode positions is in the middle of the tolerance field of the anodes. All calculated anode corner points are in the specified tolerance field. The largest anode distance in x0-direction is between A1 and A28 and in y0-direction between A20 and A27. In the y0-direction there is a relative systematic offset of the anodes to the cathodes, so that the minimum distance is not fulfilled. The largest relative cathode distance is between C8 and C23 in the x0-direction. C24 is an outlier in the y0-direction and becomes an important reference point in the following qualitative evaluation.

4.3. Radiography with Lateral Transmission Direction

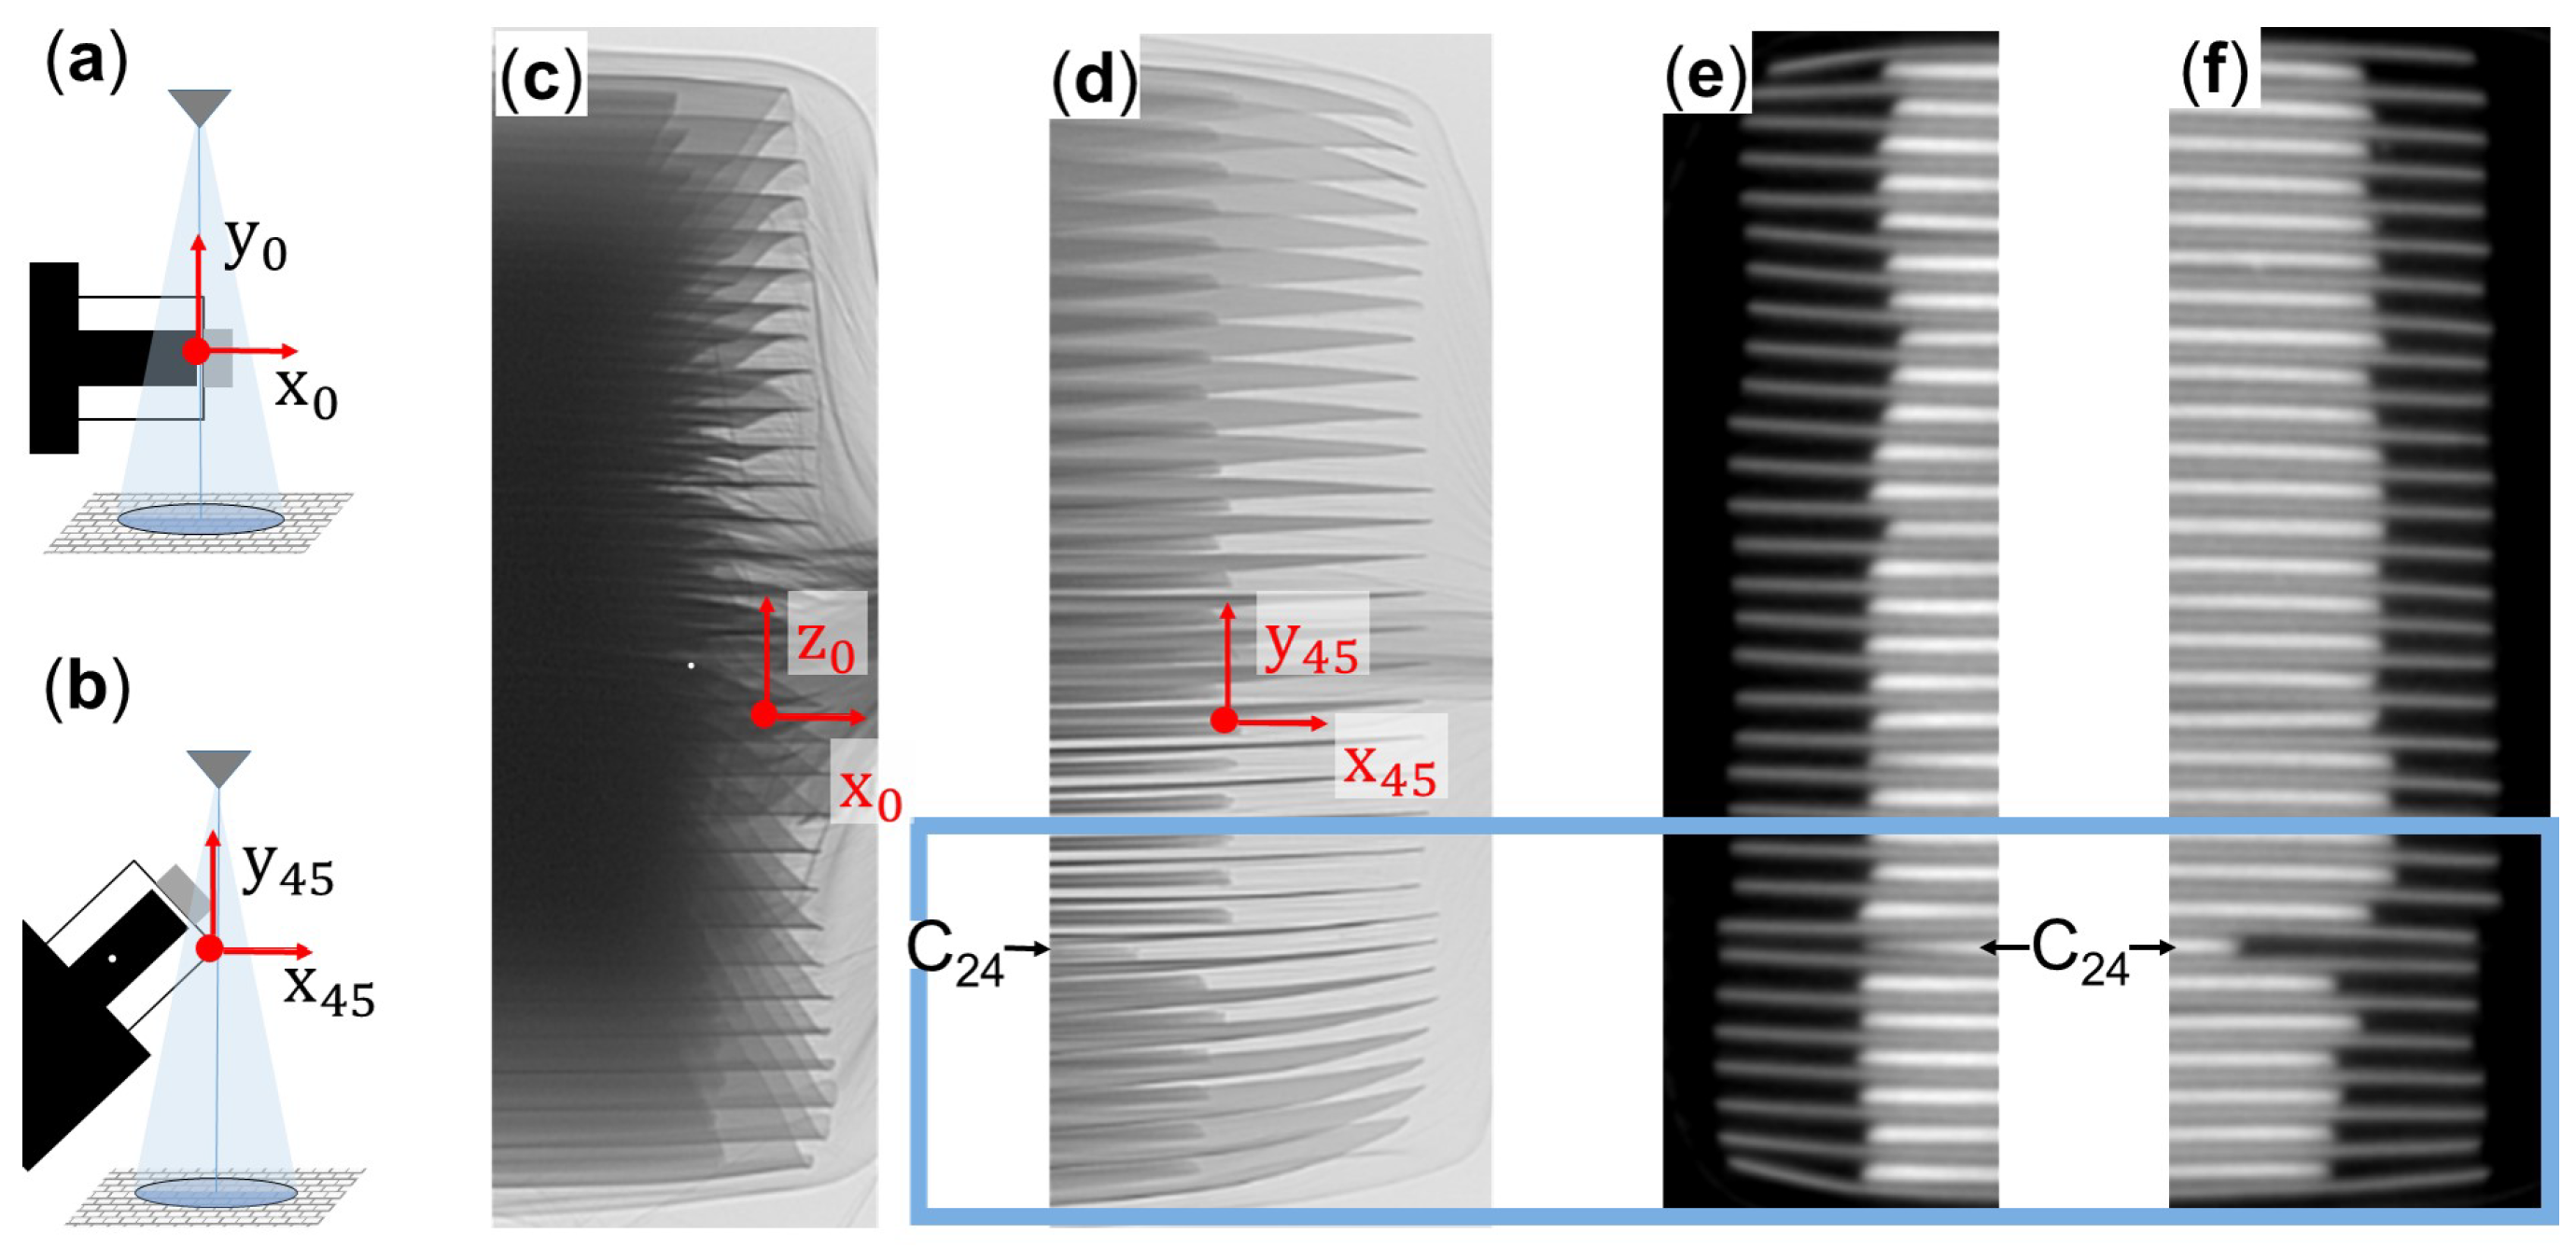
In the lateral radiography of the ESC corner is performed with two different angles in the x0y0-plane at 130 kV, 45 μm and 200 ms exposure time. The experimental setups, X-ray images and corresponding CT slices are shown in Figure 5 and the X-ray image in the Figure 5c is taken along the short side of the electrodes. The sketch in Figure 5a shows the setup. In this configuration, the central beam propagates in the y0-direction. There is a superposition of the anodes and the cathodes in the beam direction. Therefore, it is not possible to clearly determine the corner positions. In addition, the inner cathodes can only be detected to a limited extent. The outlier C24 cannot be seen in this beam direction. Therefore, this visualization is not suitable for measuring the positions of the electrode corners in y0-direction. When the central beam propagates in the x0-direction, even more material is transmitted and even higher superposition is observable. In the second setup the corner of the ESC is transmitted diagonally as depicted in Figure 5b. In this resulting X-ray image (cf. Figure 5d), the central beam is rotated 45° around the z0 -axis and points in the direction of x45-axis. The superpositions are reduced mainly in the central beam region where the beam path is almost parallel to the electrode surface. Despite the parallax, distortion and superposition of several features all electrode corners can be detected in this diagonal lateral radiography. The offset position of the anodes can be clearly identified by comparing the Figure 5d,e. The outlier C24 in the x0-direction is also visible. However, it can be seen that there are significant variations between the electrode positions displayed in the different images. The direct comparison of the image Figure 5d and the CT slices Figure 5e–f shows that a displacement of the electrodes is just visualized in the rotated x45z0-coordinate system. This becomes particularly obvious when comparing the lower electrodes marked with a blue box and the minimum and maximum outliers. Other perturbations such as a damaged corner shape or a rotational deviation of the electrode corner additionally complicate a quantitative evaluation of the electrode corner position.
In summary, the diagonal lateral radiography in x45z0-direction of a corner of the ESC has the potential to qualitatively check the electrode position. The unique benefit of this beam direction is the possibility of also identify bent or even folded electrode corners. The effect of strong distortion in bent electrodes can be solved by adjusting the position of the central beam along the z0-direction. The very good detectability of the electrode edge position in the central beam area provides the basis for automated detection. However, a measurement in this diagonal lateral X-ray image does not provide reliable information about the actual electrode positions in y0- and x0-direction due to the missing depth information in y45. In the future, it needs to be investigated whether the inspection can be improved by taking another X-ray image at a different focal point positions to realize stereoscopy.

4.4. Radiography with Vertical Beam Direction

Vertical radiation of the ESC corner along the z0-direction could directly indicate a x0y0-displacement of single electrodes and is inspected for this reason. The sketch in Figure 6a shows the setup and in the Figure 6b the X-ray projection in vertical transmission is depicted. In this setup the central beam is orthogonal to the x0y0-plane. High contrast in the X-ray image is achieved with an acceleration voltage of 128 kV, a filament current of 35 μA and an exposure time of 200 ms (cf. gray-scale histogram in the upper left corner). In this image, an additional image filter is used in the cathode region. The area is brightened by a gamma correction ( γ = 0.4 ) to make cathode edges more visible. The outliers of the anodes (A1, A20, A27, A28) and outliers of the cathodes (C22, C23) can be identified very well and are marked in the marginal regions of the X-ray image in Figure 6b. In comparison, the inner cathode edges are only visible with low contrast, because the material thickness and thus the absorption of the radiation is highest in this area. For a better understanding of the X-ray image, the representation of the electrode edges with the CT data is shown in Figure 6. The edge of C24 in the y0-direction can nevertheless be identified with a low contrast. However, the inward shifted C8 in the x0-direction, cannot be clearly identified. This can be mainly explained by the superposition of the edges, which occurs due to the small position deviation in x0-direction, if the central beam is not directly above the observed edge. In addition, it can be seen in the CT slice in the x0z0-plane that C24 has continuous decoating. This does not result in a differentiable attenuation of the X-ray intensity which means that the edges may not show a clear contrast. Compared to the cathodes, this effect as a result of decoating in the edge areas of anodes is smaller, since the copper substrate and not the graphite coating is responsible for the absorption of the radiation.
The influence of the center beam projection can also be seen in the Figure 6b. The edges in y0-direction are projected further away from each other than the edges in x0-direction because of the larger distance of the central beam to the edges in y0-direction. However, the vertical beam direction shows that not all electrode edges can be clearly distinguished with one single X-ray image. If the anode edges are counted in the y0-direction, a maximum of 20 edges out of 31 can be clearly differentiated in this example. Thus, with perpendicular radiography, the completeness of the stack cannot be inspected with a single X-ray image. For this reason, future experiments must test whether the completeness of the ESC is possible despite superposition of electrode edges. Two approaches are possible, especially for the anodes. One is to test whether a defined attenuated intensity can be assigned to an exact number of anodes in the center beam. Another approach is to move the ESC in the x0y0-plane, so that different superpositions occur due to the parallax arising in different transmission directions. By continuous image acquisition with tracking of the anode edges the completeness could be checked. If these approaches are not effective from a technical or economic point of view, the completeness can also be checked by tracking the electrodes in the stacking process and subsequently measuring the thickness of the entire ESC.
Another disadvantage of vertical radiography is that folded cathodes cannot be clearly classified. In addition, it cannot be evaluated whether electrodes are bent. For these two cases, the diagonal lateral transmission has an advantage. Furthermore, the depth information in the z0-direction is of course also missing here. This means it is unknown which electrode has a large deviation of position. Because of this for an optimization of the stacking process, the vertical radiation cannot be used. In this case, CT is recommended. However, in order to measure only the position of outlier electrodes in y0- and x0-direction, vertical radiography can be an alternative to CT and will therefore be further evaluated in the following.
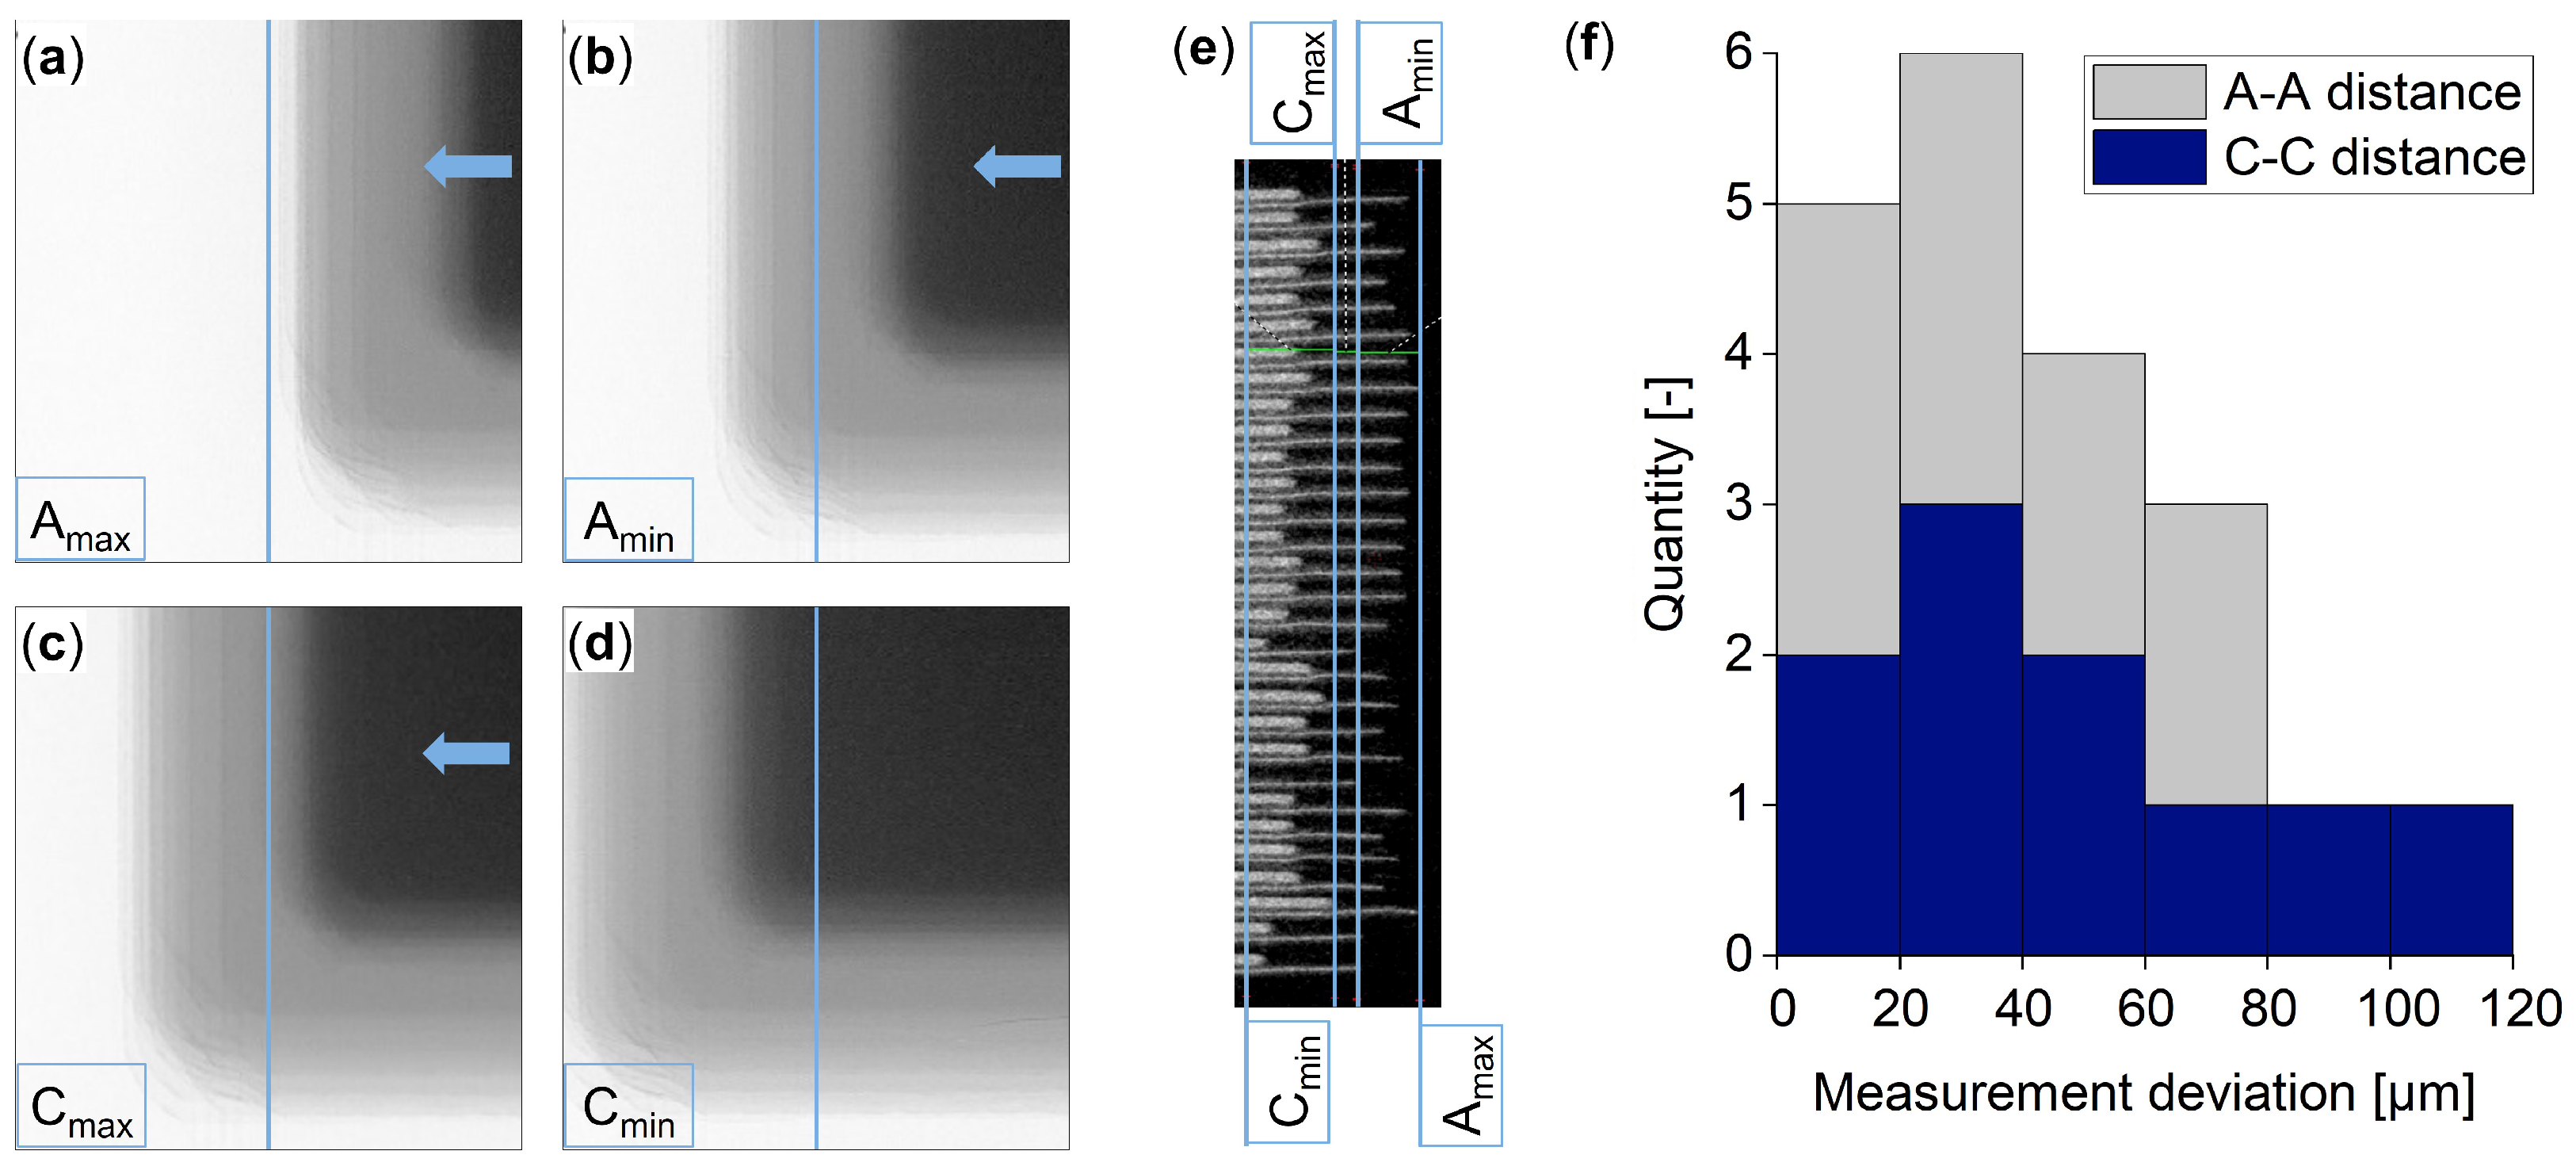
The qualitative evaluation of radiography with vertical beam direction shows a high potential that the maximum distances between outliers of anodes and cathodes can be measured even for a thick, large scale ESC. Reference measurements are made at the beginning using a CT of ESC corners with 30 compartments to assess the concept of vertical radiography. The selected ESCs have a high variation of electrode position. A digital resolution of 25 μm/voxel is achieved in the reference CT and a sample slice is shown in the Figure 7e. The data is manually analyzed. The method has a measurement accuracy for a distance measurement between electrode edges of ±50 μm because of the resolution. Next, an inspection of the identical ESC corners is carried out in the vertical beam direction. To realize this, a coordinate measurement with several images is implemented by focusing the central beam on the appropriate electrode edge in x0- and y0-direction. The ESC is moved manually orthogonally to the outliers of the electrode edges (marked in blue) as visualized in Figure 7a–d. Using the relative position of the portal axis system in the images show (traverse accuracy of ±1 μm) the anode distance A-A and cathode distance C-C can then be calculated from the coordination position of the points Amax, Amin, Cmax, Cmin. In the images an exposure time of 200 ms and a digital resolution of 5.08 μm/pixel are used. Repetitive measurements of the distances A-A and C-C show that an accuracy of approx. ±15 μm is achieved. Finally, the measurement data from CTs and coordination radiographies are directly compared. The relative deviation of 10 distance measurements between the CT measurements and the coordinate measurement in the vertical coordination radiography are shown in the diagram Figure 7f. This relative comparison of the measurement results from the CTs and coordination radiography results in a summed measurement accuracy of ±50 μm ± 15 μm = ±65 μm. It can be seen that for the anodes and cathodes almost all measurements have a maximum deviation of ±65 μm and thus lie within the summed accuracy. It is also evident that the measurement deviations for the anodes are smaller than those for the cathodes due to the clear visibility of the anode edges. Only for the cathode distances are relative deviations of the measurement results of more than ±65 μm present. This is attributed in individual cases to the low contrast of the edge of inner cathodes. In summary, the results show that a vertical coordination radiography can measure the maximum anode and cathode distances with a high resolution. The main challenge with this technique is the visibility of the inner cathode edge.
In order to conclusively demonstrate the ability of the vertical coordination radiography, further trials have to be carried out based on this work. Most importantly, the correlation of ESC thickness and coating height on the visibility of the innermost cathode edge must be investigated. Additionally automated data acquisition and processing must be developed since edge detection is not trivial due to the low contrasts. For a system concept in large-scale industrial production the use of a fixed tube and crossed line detectors positioned in the center beam axis can then be particularly suitable. By continuously taking line detector images of the composite corners and moving the ESC in x0- and y0- directions around the central beam, the anode and cathode maximum distances in all corners can be measured in the generated stitched, parallax-free image. Typical frequencies of line detectors with scintillator layers are currently around 2 kHz. Much faster examination times are given by Sackewitz [16] for the Time Delayed Integrated line scan cameras. These can realize feed rates up to 2 m/s with a pixel pitch of 400 μm and a line frequency of 10 kHz. For edge detection in one ESC corner with a region of interest of 40 × 40 mm approximately 25 corners per second could be inspected with the crossed line detectors in two axis direction. It must be taken into account that the total measurement time includes not only data acquisition, but also image processing. In this context, it has to be investigated whether an image acquisition speed has to be reduced if higher exposure times are required for automated detection of internal cathode edges. Therefore, the method should be tested with a prototype to obtain a final evaluation for the inline vertical coordination radiography concept.
The previous evaluation of different beam directions has shown that a single X-ray image can only realize an qualitative inspection process for the position of the electrode edges. For a measurement of distances, several images are necessary in all tested beam directions due to the effects of center beam projection and the missing depth information. Especially in the vertical beam direction measuring the maximum distances of anodes and cathodes for an ESC with up to 30 compartments is possible with very high accuracy and offers a potential solution for a continuous, online measurement process for large volumes. However, the results also show that there is further development potential in other inspection concepts. In principle, the possibilities of different combinations of beam directions should be practically explored in order to increase the measurement accuracy of a radiography with multiple X-ray images. For example, a stitched, parallax-free image can be acquired with the diagonal lateral beam direction at the ESC corner. If the procedure is performed for multiple corners or for two orthogonally aligned transmission directions with knowledge of electrode geometry, this technique can be another AC overhang measurement. Future investigations must therefore deal with the further testing and development of alternative measurement processes compared to CT in order to be able to realize a more economical inspection of the electrode position.

5. Development of a System for 2D Analysis of Electrolyte Filling

The electrolyte filling, which completes the cell assembly, is known as a quality and time critical process step [64]. A successfully filled LIB is primarily characterized by a homogeneous distribution of the electrolyte in the LIB’s electrode-separator-assembly. Incompletely wetted areas result in reduced LIB performance, accelerated aging and reduced safety. Due to the high value added already, waste in this stage of the production results in high monetary losses.
Inhomogeneous electrolyte distributions result in both reduced capacities and inhomogeneous current density distributions. These inhomogeneous current density distributions promote an increased growth of dendrites and can lead to piercing of the separator and thus microscopic shorts. This drastically accelerates LIB aging and in the worst case can result in a thermal runaway [65]. Since the microscopic wetting of all pores of the LIB components is primarily driven by capillary forces, this process is very time-consuming. Due to a lack of methods to characterize the progress of the wetting, large-format LIBs are typically stored for several hours before formation (cf. Section 3).

5.1. Design of a X-ray Permeable Electrolyte Filling System

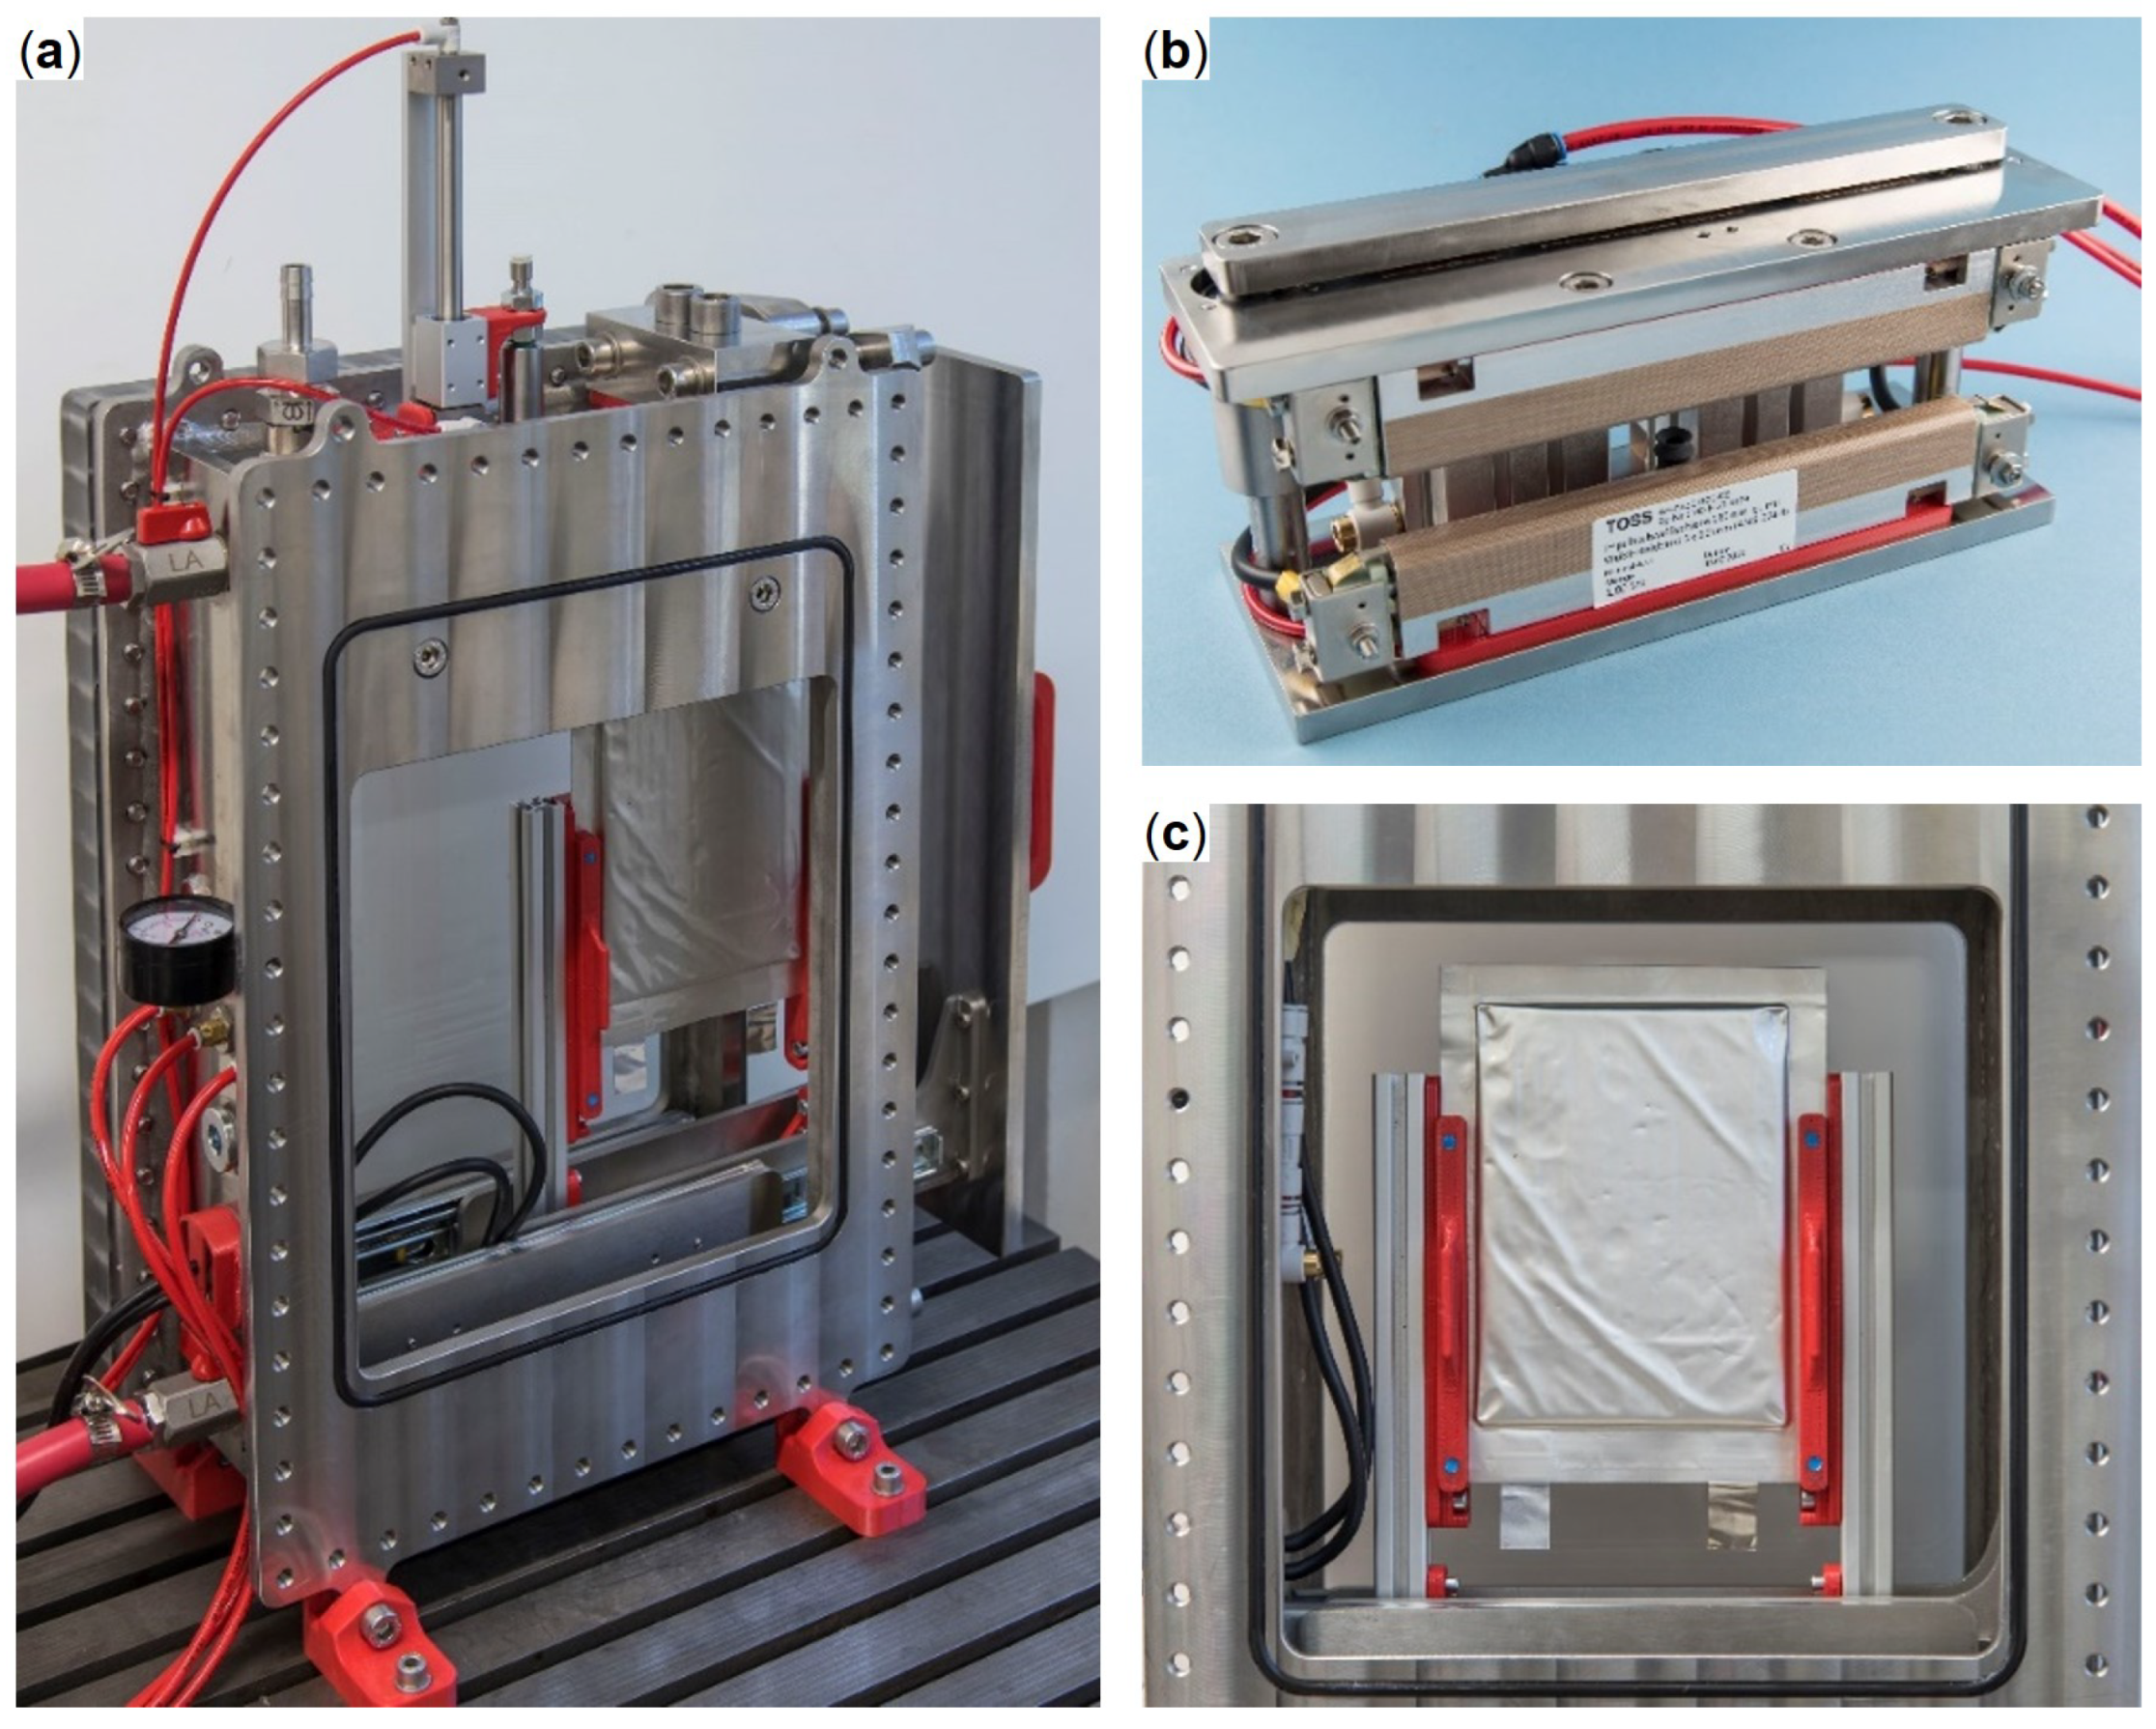
This investigation addresses the filling of pouch LIBs, which have a higher energy density than prismatic hard-case LIBs and are increasingly used in automotive applications. Pouch LIBs are filled under either inert gas, dry atmosphere or vacuum and are typically sealed in a vacuum. An inspection system must allow for controlling this defined atmosphere and the application of vacuum. Further, the system must provide precise control over all process parameters such as the applied vacuum profile or dosing speed to enable true process optimization. According these requirements, the radiolucent vacuum chamber shown in Figure 8 was designed.
Due to high corrosion resistance, high strength and good machinability, stainless steel (1.4301) was chosen for the main body of the chamber while the sides were constructed from radiolucent cast PMMA plates. For the insertion of the LIB, a sled with a clamping device for the LIB was developed. The primary dimensions of the chamber of 350 × 500 × 220 mm are determined by the targeted X-ray system in which the chamber is to be mounted. Finally, the rough design of the chamber (wall thicknesses, flanges, seals) was based on the AD2000 code [66] and was validated by a static FEM analysis.
For control and monitoring of the filling process, the vacuum chamber was equipped with various peripherals. A check valve pump with a theoretic resolution of 0.0024 mL is used to dose the electrolyte. The electrolyte is pumped into the LIB via a dosing needle that can be lowered and lifted pneumatically. To seal the filled LIB, the impulse seal unit shown in Figure 8 (top right) was developed and mounted in the vacuum chamber. To evacuate the chamber, a 3-staged membrane pump allows the flexible programming of custom vacuum profiles and allows for flushing with inert gasses. Furthermore, the system is equipped with temperature and pressure sensors to monitor the process. The overall process control is automated using a programmable logic controller.

5.2. X-ray Imaging of Fluid Behaviour

The vacuum chamber shown in Figure 8 as well as the associated periphery for dosing the fluid were set up in the X-ray system for experimental evaluation (see Figure 1c). With an accelerating voltage of 120 kV, a filament current of 350 µA and an exposure time of 160 ms, ten minute X-ray videos were generated with this setup starting with the injection of the fluid. To validate the functionality of the setup and the methodology, a series of experiments with varying vacuum levels was carried out. The selected vacuum levels were 200 mbar, 400 mbar, 600 mbar and 800 mbar. Since these experiments took place outside a controlled dry room atmosphere the highly moisture sensitive electrolyte could not be used for this study. First experiments using only the electrolyte’s solvent (dimethylcarbonat) resulted in insufficient contrast at the required exposure times. To improve contrasts, a medical X-ray contrast agent was chosen for this first prove of concept. Sample images 60 s after filling are shown in Figure 9.
The decreasing filling level of the LIB with increasing pressure (decreasing vacuum) despite the constant fluid quantity is striking. This can be explained by the expansion of the remaining gas bubbles due to the lower ambient pressure for high vacuum levels. Similarly, the larger area and number of bubbles at higher vacuum levels is also noticeable. This can also be attributed to the lower ambient pressure. As gas bubbles will lead to blockages in ion transportation and thus increasingly inhomogeneous current distributions, their formation should be minimized. To further quantify their development the following paragraph will introduce a image processing chain for the analysis of the recorded X-ray videos.

5.2.1. Image Processing for Analysis of Bubble Formation

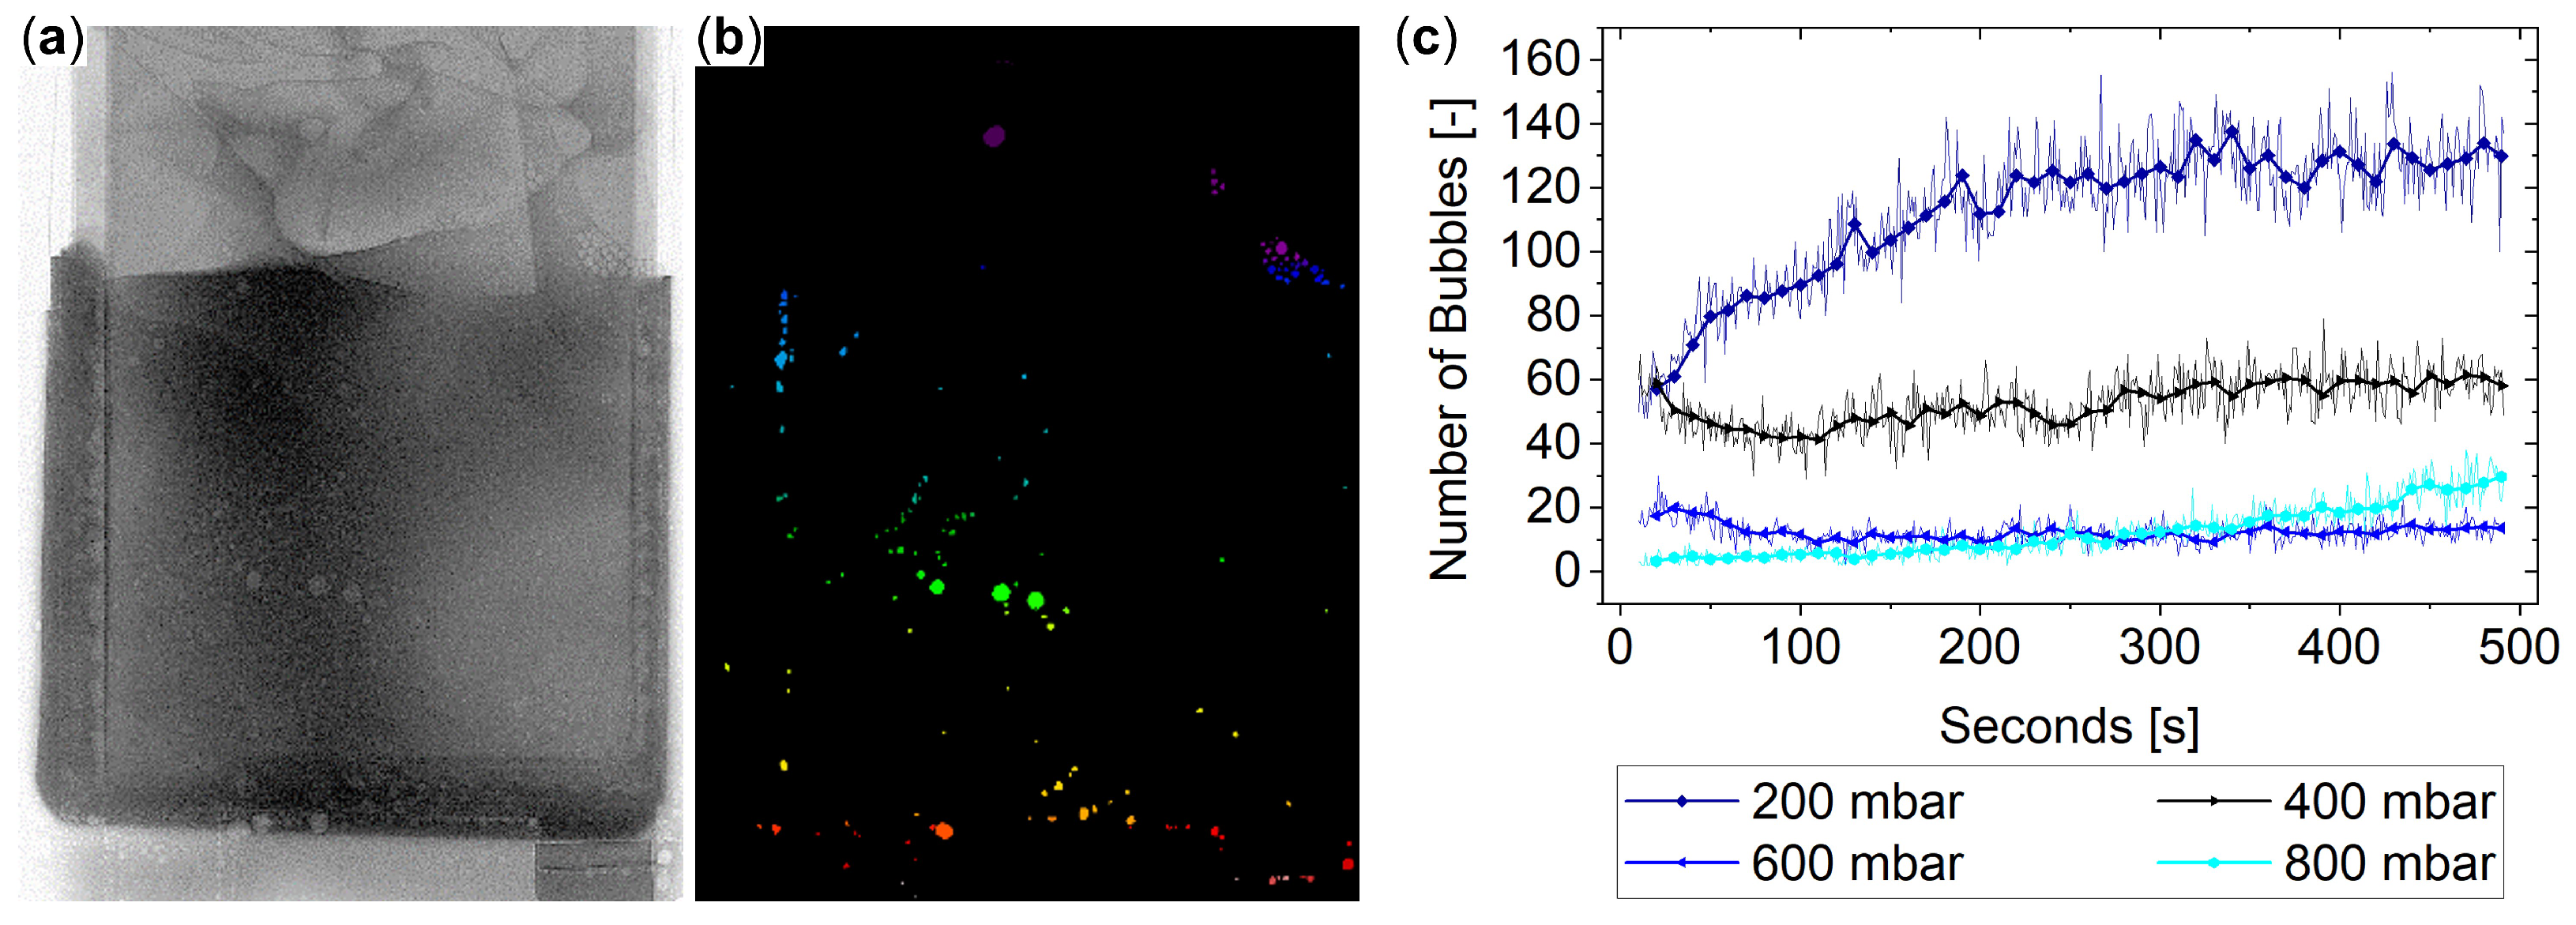
For the quantifying evaluation of the bubble formation of the performed series of experiments, an image processing routine was developed to determine the number of bubbles in each image of the recording. This routine begins by resampling of the generated video, exporting individual images at 1-s intervals and extracting the relevant region of interest. To optimize the contrast of the transitions between bubbles and fluid, contrast limited adaptive histogram equalization (CLAHE) [67] was applied in the next step. To reduce the noise present in the image while preserving sharp bubble contours, finally a median filter with a [3 × 3] kernel was applied.
To evaluate the processed images, the contours in the image were extracted using the Canny algorithm [68]. The parameters of the Canny algorithm were set according to best practice rules and validated on individual images distributed over the time span of all videos of the process variations. Since various contours not belonging to the bubbles remain in the image even after the parameters of the Canny algorithm have been optimized, the binary image of the Canny algorithm is further filtered in the next step by using various operators (closing, opening, inversion, convex hull and flood fill). The contours remaining in the image after these filtering steps are finally filtered in terms of their size in pixels. The resulting image (example shown in Figure 10a,b) contains the detected bubbles. By counting the bubbles for each extracted image of each process variation, the bubble count curves over time shown in Figure 10c were generated.
Figure 10c shows both the number of bubbles per second (pale) and the averaged value over 10-s intervals. The remaining measurement noise is due to the image noise of the X-ray images and the rigid parameterization of the image processing algorithms. An individual or adaptive parameterization for each X-ray video or even each image could further reduce this measurement noise in the future.
Analyzing the graphs, the previously qualitatively assumed dependence of the number of bubbles on the vacuum level in the chamber can be evaluated. A decreasing chamber pressure leads to an increased number of bubbles in the fluid. This can be explained by the lower forces acting on the bubbles at lower pressures and the resulting stronger expansion of even small gas volumes, which are not visible at higher pressures.

5.2.2. Visualization of Fluid Distribution in Evacuated LIBs

As a further analysis method, the developed setup allows the distribution of the fluid within the LIB. To quantify this LIB property, the proof-of-concept described below was performed. A sealed pouch LIB in BLB1 format was equipped with two ports, one for evacuating the LIB and another for injecting the fluid. This LIB was evacuated via the first port (while being surrounded by ambient pressure) and then the previously used contrast medium injected. Due to the acting pressure difference, the foil casing of the LIB is pressed onto the LIB stack and a direct flow of the fluid between the layers is avoided. A sample image of the X-ray video generated in this way can be seen in Figure 11a (after preprocessing).
The videos were processed using CLAHE and median filters, analogous to the procedure described previously for bubble quantification. From the resulting processed image (Figure 11a), the initial image at time 0 s was subtracted in a second step to produce the difference image shown in Figure 11b. Accordingly, the resulting differential image exclusively represents the filled fluid in the LIB. By selectively masking the areas of the LIB stack and dead volume of the LIB (Figure 11c) the quantification of the distribution of the fluid on respective areas was carried out. Figure 11d represents the course of this distribution over time.
For the exemplary scenario presented, this method can be used to determine that around 40% of the fluid remains in the dead volume of the LIB and that a reduction in the amount of electrolyte would be appropriate. In addition to dosing the fluid into an already evacuated LIB, this method is also suitable for analyzing the fluid distribution inside a LIB for a conventional filling process under vacuum. However, it must be ensured that the steps of sealing and subsequent flooding of the vacuum chamber do not cause significant movement of the LIB. Any movement of the LIB would lead to a distortion of the differential image as well as the masking of the LIB areas and thus the quantification of the distribution of the fluid quantities. A fixed clamping of the LIB is therefore necessary for this scenario.

5.3. Conclusion of X-ray Imaging for the Analysis of Electrolyte Filling

The system presented is capable of performing a filling process under real process conditions (vacuum, dry or inert atmosphere) with varying process parameters and generating X-ray images of the LIB-internal distribution of the electrolyte. The use of the presented image processing methods offers various possibilities for the quantifying investigation of different LIB and process properties for the process of electrolyte filling. To extend the analysis capabilities of the system, work is currently underway to integrate a potentiostat that will enable simultaneous X-ray analysis and electrochemical impedance spectroscopy.
The greatest challenge for the establishment of the method is considered to be the current need for a contrast agent. The specific wetting properties of the contrast agent used in this first proof of concept are not know and as such a transfer of results to conventional electrolytes is problematic. This challenge could on the one hand be tackled by the development of a contrast agent with wetting properties (e.g., viscosity, density or contact angle) comparable to conventional electrolytes. On the other hand the latest developments in X-ray imaging (e.g., photon counting detectors or dual-energy/high dynamic range systems) might enable the visualization of conventional electrolytes without any additives.

6. Summary and Outlook

In this paper, the basics of X-ray technology were summarized at the beginning. Next, an overview of quality control and of inspection techniques with X-rays was presented, focusing on the inline, atline and offline quality assurance in LIB production. This state of the art methods clearly show that, especially in cell assembly, the use of X-rays must to be expanded in many places to explore interactions of the inner of the product with defined process conditions or to integrate X-ray technology for measuring inner geometries of products in large-scale production. In this context, the development of two new X-ray inspection techniques in LIB assembly were presented. First, a promising measurements for a fast inspection of the AC overhang with a continuous radiography was presented. The next step for this application is to develop and test the continuous, automated image acquisition and processing in order to realize a technical and economical evaluate. Second, a X-ray permeable vacuum chamber for analysis of the filling process was developed, manufactured and tested. The acquired X-ray images show that a qualitative and quantitative evaluation of effects, such as bubble formation or the resulting electrolyte distribution in the LIB is feasible. Subsequent research needs to conduct a parameter study to investigate further product and process interactions. In summary, this work provides the basis for two new inspection techniques using X-rays, which seems promising to have a significant contribution to the optimization of products, processes and quality assurance of LIB manufacturing in the laboratory or in large-scale production in the near future.

Author Contributions

Conceptualization, S.M., P.G. and N.K.; methodology, S.M. and P.G.; software, S.M. and P.G.; validation, S.M., P.G. and K.D.; formal analysis, S.M. and P.G.; investigation, S.M. and P.G.; resources, S.M. and P.G.; data curation, S.M. and P.G.; writing—original draft preparation, S.M., P.G. and N.K.; writing—review and editing, S.M., P.G. and K.D.; visualization, S.M. and P.G.; supervision, K.D.; project administration S.M., P.G., N.K. and K.D.; funding acquisition, S.M., P.G. and K.D. All authors have read and agreed to the published version of the manuscript.

Funding

This work was in part funded by the PowerCo SE, German Federal Ministry of Education and Research (BMBF) and is part of the project HEMkoop (Grant 03XP0117B). HEMkoop investigates optimized materials and production technologies for the manufacturing of economically and ecologically sustainable high-energy batteries.

Data Availability Statement

MDPI Research Data Policies. Data is contained within the article.

Conflicts of Interest

The authors declare no conflict of interest. The funders had no role in the design of the study, in the collection, analyses, or interpretation of data, in the writing of the manuscript.

References

  1. Kwade, A.; Haselrieder, W.; Leithoff, R.; Modlinger, A.; Dietrich, F.; Droeder, K. Current status and challenges for automotive battery production technologies. Nat. Energy 2018, 3, 290–300. [Google Scholar] [CrossRef]
  2. Korthauer, R. (Ed.) Handbook Lithium-Ion Batteries: Basics and Applications; Springer: Berlin/Heidelberg, Germany, 2018. [Google Scholar]
  3. Turetskyy, A.; Wessel, J.; Herrmann, C.; Thiede, S. Battery production design using multi-output machine learning models. Energy Storage Mater. 2021, 38, 93–112. [Google Scholar] [CrossRef]
  4. Zanotto, F.M.; Dominguez, D.Z.; Ayerbe, E.; Boyano, I.; Burmeister, C.; Duquesnoy, M.; Eisentraeger, M.; Montaño, J.F.; Gallo-Bueno, A.; Gold, L.; et al. Data Specifications for Battery Manufacturing Digitalization: Current Status, Challenges, and Opportunities. Batter. Supercaps 2022, 5, 12. [Google Scholar] [CrossRef]
  5. Zhang, X.; Chatzidrosos, G.; Hu, Y.; Zheng, H.; Wickenbrock, A.; Jerschow, A.; Budker, D. Battery Characterization via Eddy-Current Imaging with Nitrogen-Vacancy Centers in Diamond. Appl. Sci. 2021, 11, 3069. [Google Scholar] [CrossRef]
  6. Deng, Z.; Huang, Z.; Shen, Y.; Huang, Y.; Ding, H.; Luscombe, A.; Johnson, M.; Harlow, J.E.; Gauthier, R.; Dahn, J.R. Ultrasonic Scanning to Observe Wetting and “Unwetting” in Li-Ion Pouch Cells. Joule 2020, 4, 2017–2029. [Google Scholar] [CrossRef]
  7. Huber, J.; Tammer, C.; Schneider, D.; Seidel, C.; Reinhart, G. Non-destructive Quality Testing of Battery Separators. Procedia CIRP 2017, 62, 423–428. [Google Scholar] [CrossRef]
  8. Liu, X.; Weng, T.C. Synchrotron-based X-ray absorption spectroscopy for energy materials. MRS Bull. 2016, 41, 466–472. [Google Scholar] [CrossRef] [Green Version]
  9. Zhang, P.; Yuan, T.; Pang, Y.; Peng, C.; Yang, J.; Ma, Z.F.; Zheng, S. Influence of Current Density on Graphite Anode Failure in Lithium-Ion Batteries. J. Electrochem. Soc. 2019, 166, A5489–A5495. [Google Scholar] [CrossRef]
  10. Evertz, M.; Lürenbaum, C.; Vortmann, B.; Winter, M.; Nowak, S. Development of a method for direct elemental analysis of lithium ion battery degradation products by means of total reflection X-ray fluorescence. Spectrochim. Acta Part At. Spectrosc. 2015, 112, 34–39. [Google Scholar] [CrossRef]
  11. Liu, Y.; Yang, H.; Zheng, H.; Jia, M.; Huang, A. Structural Characteristics and Electrochemical Performance of N,P-Codoped Porous Carbon as a Lithium-Ion Battery Anode Electrode. ACS Omega 2022. [Google Scholar] [CrossRef]
  12. Qian, G.; Monaco, F.; Meng, D.; Lee, S.J.; Zan, G.; Li, J.; Karpov, D.; Gul, S.; Vine, D.; Stripe, B.; et al. The role of structural defects in commercial lithium-ion batteries. Cell Rep. Phys. Sci. 2021, 2, 100554. [Google Scholar] [CrossRef]
  13. de Chiffre, L.; Carmignato, S.; Kruth, J.P.; Schmitt, R.; Weckenmann, A. Industrial applications of computed tomography. CIRP Ann. 2014, 63, 655–677. [Google Scholar] [CrossRef]
  14. Buratti, A. Model-Based Optimization of Setup Parameters for Dimensional Measurements on Monomaterial and Multimaterial Workpieces in Industrial Computed Tomography. Ph.D. Thesis, Aachen, Germany, 2018. [Google Scholar]
  15. Wu, Y.; Saxena, S.; Xing, Y.; Wang, Y.; Li, C.; Yung, W.; Pecht, M. Analysis of Manufacturing-Induced Defects and Structural Deformations in Lithium-Ion Batteries Using Computed Tomography. Energies 2018, 11, 925. [Google Scholar] [CrossRef] [Green Version]
  16. Sackewitz, M. (Ed.) Leitfaden zur industriellen Röntgentechnik: Zerstörungsfreie Prüfung mit Bildverarbeitung; 2., vollständig aktualisierte und erweiterte auflage ed.; Vision-Leitfaden; Fraunhofer Verlag: Stuttgart, Germany, 2015; Volume 15. [Google Scholar]
  17. Beyerer, J.; Puente León, F.; Frese, C. Machine Vision: Automated Visual Inspection: Theory, Practice and Applications, 1st ed.; Springer: Berlin/Heidelberg, Germany, 2016. [Google Scholar] [CrossRef]
  18. Malte Kurfiss, G.S. 3-dimensional X-ray inspection of very large objects is no longer a promise only-600 kV Digital Laminography offers a solution. In Proceedings of the 18th World Conference on Non-Destructive Testing 2012, Durban, South Africa, 16–20 April 2012; pp. 202–207. [Google Scholar]
  19. Dagge, L.; Harr, K.; Paul, M.; Schnedl, G. Classification of process analysis: Offline, atline, online, inline. Cem. Int. 2009, 7, 72–81. [Google Scholar]
  20. Rohkohl, E.; Schönemann, M.; Bodrov, Y.; Herrmann, C. A data mining approach for continuous battery cell manufacturing processes from development towards production. Adv. Ind. Manuf. Eng. 2022, 4, 100078. [Google Scholar] [CrossRef]
  21. Dreger, H.; Huelsebrock, M.; Froboese, L.; Kwade, A. Method Development for Quality Control of Suspensions for Lithium-Ion Battery Electrodes. Ind. Eng. Chem. Res. 2017, 56, 2466–2474. [Google Scholar] [CrossRef]
  22. Tronci, S.; van Neer, P.; Giling, E.; Stelwagen, U.; Piras, D.; Mei, R.; Corominas, F.; Grosso, M. In-Line Monitoring and Control of Rheological Properties through Data-Driven Ultrasound Soft-Sensors. Sensors 2019, 19, 5009. [Google Scholar] [CrossRef] [Green Version]
  23. Heenan, T.M.M.; Llewellyn, A.V.; Leach, A.S.; Kok, M.D.R.; Tan, C.; Jervis, R.; Brett, D.J.L.; Shearing, P.R. Resolving Li-Ion Battery Electrode Particles Using Rapid Lab-Based X-Ray Nano-Computed Tomography for High-Throughput Quantification. Adv. Sci. 2020, 7, 2000362. [Google Scholar] [CrossRef]
  24. Diener, A.; Ivanov, S.; Haselrieder, W.; Kwade, A. Evaluation of Deformation Behavior and Fast Elastic Recovery of Lithium–Ion Battery Cathodes via Direct Roll–Gap Detection During Calendering. Energy Technol. 2022, 10, 2101033. [Google Scholar] [CrossRef]
  25. Kapeller, C.; Bodenstorfer, E. Photometric stereo-based high-speed inline battery electrode inspection. TM-Tech. Mess. 2021, 88, 423–432. [Google Scholar] [CrossRef]
  26. Mohanty, D.; Li, J.; Born, R.; Maxey, L.C.; Dinwiddie, R.B.; Daniel, C.; Wood, I.D.L. Non-destructive evaluation of slot-die-coated lithium secondary battery electrodes by in-line laser caliper and IR thermography methods. Anal. Methods 2014, 6, 674–683. [Google Scholar] [CrossRef]
  27. Frommknecht, A.; Schmauder, M.; Boonen, L.; Glanz, C. Automated inline visual inspection and 3D measuring in electrode manufacturing. In Proceedings of the Optical Measurement Systems for Industrial Inspection XI, Munich, Germany, 24–27 June 2019; Lehmann, P., Osten, W., Gonçalves, A.A., Jr., Eds.; SPIE: Bellingham, WA, USA, 2019; p. 66. [Google Scholar] [CrossRef]
  28. Daemi, S.R.; Tan, C.; Volkenandt, T.; Cooper, S.J.; Palacios-Padros, A.; Cookson, J.; Brett, D.J.L.; Shearing, P.R. Visualizing the Carbon Binder Phase of Battery Electrodes in Three Dimensions. ACS Appl. Energy Mater. 2018, 1, 3702–3710. [Google Scholar] [CrossRef]
  29. Müller, S.; Sauter, C.; Shunmugasundaram, R.; Wenzler, N.; de Andrade, V.; de Carlo, F.; Konukoglu, E.; Wood, V. Deep learning-based segmentation of lithium-ion battery microstructures enhanced by artificially generated electrodes. Nat. Commun. 2021, 12, 6205. [Google Scholar] [CrossRef] [PubMed]
  30. Lu, X.; Bertei, A.; Finegan, D.P.; Tan, C.; Daemi, S.R.; Weaving, J.S.; O’Regan, K.B.; Heenan, T.M.M.; Hinds, G.; Kendrick, E.; et al. 3D microstructure design of lithium-ion battery electrodes assisted by X-ray nano-computed tomography and modelling. Nat. Commun. 2020, 11, 2079. [Google Scholar] [CrossRef]
  31. Furat, O.; Petrich, L.; Finegan, D.P.; Diercks, D.; Usseglio-Viretta, F.; Smith, K.; Schmidt, V. Artificial generation of representative single Li-ion electrode particle architectures from microscopy data. NPJ Comput. Mater. 2021, 7. [Google Scholar] [CrossRef]
  32. Taiwo, O.O.; Finegan, D.P.; Gelb, J.; Holzner, C.; Brett, D.J.; Shearing, P.R. The use of contrast enhancement techniques in X-ray imaging of lithium–ion battery electrodes. Chem. Eng. Sci. 2016, 154, 27–33. [Google Scholar] [CrossRef] [Green Version]
  33. Landesfeind, J.; Ebner, M.; Eldiven, A.; Wood, V.; Gasteiger, H.A. Tortuosity of Battery Electrodes: Validation of Impedance-Derived Values and Critical Comparison with 3D Tomography. J. Electrochem. Soc. 2018, 165, A469–A476. [Google Scholar] [CrossRef]
  34. Daemi, S.R.; Lu, X.; Sykes, D.; Behnsen, J.; Tan, C.; Palacios-Padros, A.; Cookson, J.; Petrucco, E.; Withers, P.J.; Brett, D.J.L.; et al. 4D visualisation of in situ nano-compression of Li-ion cathode materials to mimic early stage calendering. Mater. Horizons 2019, 6, 612–617. [Google Scholar] [CrossRef] [Green Version]
  35. Lu, X.; Daemi, S.R.; Bertei, A.; Kok, M.D.; O’Regan, K.B.; Rasha, L.; Park, J.; Hinds, G.; Kendrick, E.; Brett, D.J.; et al. Microstructural Evolution of Battery Electrodes During Calendering. Joule 2020, 4, 2746–2768. [Google Scholar] [CrossRef]
  36. Jansen, T.; Kandula, M.; Hartwig, S.; Hoffmann, L.; Haselrieder, W.; Dilger, K. Influence of Laser-Generated Cutting Edges on the Electrical Performance of Large Lithium-Ion Pouch Cells. Batteries 2019, 5, 73. [Google Scholar] [CrossRef] [Green Version]
  37. Kriegler, J.; Binzer, M.; Zaeh, M.F. Process strategies for laser cutting of electrodes in lithium-ion battery production. J. Laser Appl. 2021, 33, 012006. [Google Scholar] [CrossRef]
  38. Huttner, F.; Haselrieder, W.; Kwade, A. The Influence of Different Post–Drying Procedures on Remaining Water Content and Physical and Electrochemical Properties of Lithium–Ion Batteries. Energy Technol. 2019, 8, 1900245. [Google Scholar] [CrossRef]
  39. Li, J.; Daniel, C.; An, S.J.; Wood, D. Evaluation Residual Moisture in Lithium-Ion Battery Electrodes and Its Effect on Electrode Performance. MRS Adv. 2016, 1, 1029–1035. [Google Scholar] [CrossRef] [Green Version]
  40. Kosfeld, M.; Westphal, B.; Kwade, A. Correct water content measuring of lithium-ion battery components and the impact of calendering via Karl-Fischer titration. J. Energy Storage 2022, 51, 104398. [Google Scholar] [CrossRef]
  41. Leithoff, R.; Fröhlich, A.; Dröder, K. Investigation of the Influence of Deposition Accuracy of Electrodes on the Electrochemical Properties of Lithium–Ion Batteries. Energy Technol. 2020, 8, 1900129. [Google Scholar] [CrossRef]
  42. Niedermeier, J.; Kopp, A.; Schmidt, J.; Schmidt, P.; Bernthaler, T.; Schneider, G. Metrologische Computertomografie zur seriennahen Anwendung an großformatigen Batteriezellen zur Qualitäts- und Funktionsbewertung. DGZfP Jahrestag. 2018, 1–8. Available online: https://www.ndt.net/article/dgzfp2018/papers/Mi.2.C.4.pdf (accessed on 15 December 2022).
  43. Turetskyy, A.; Leithoff, R.; Xu, W.; Thiede, S.; Dietrich, F.; Dröder, K.; Herrmann, C. Assessment of battery cell assembly through non-invasive cell characterization using X-ray computer tomography. In Proceedings of the 31st International Electric Vehicle Symposium & Exhibition and International Electric Vehicle Technology Conference (EVS31 & EVTeC 2018), Kobe, Japan, 1–3 October 2018; Volume 1, pp. 402–407. [Google Scholar]
  44. Pinter, P. Using CT to Detect Defects in Lithium-Ion Batteries. SAE Int. 2021. Available online: https://www.sae.org/news/2021/05/using-ct-to-detect-defects-in-lithium-ion-batteries (accessed on 15 December 2022).
  45. Rohkohl, E.; Kraken, M.; Schönemann, M.; Breuer, A.; Herrmann, C. How to characterize a NDT method for weld inspection in battery cell manufacturing using deep learning. Int. J. Adv. Manuf. Technol. 2022, 119, 4829–4843. [Google Scholar] [CrossRef]
  46. Wood, D.L.; Li, J.; Daniel, C. Prospects for reducing the processing cost of lithium ion batteries. J. Power Sources 2015, 275, 234–242. [Google Scholar] [CrossRef] [Green Version]
  47. Schilling, A.; Gümbel, P.; Möller, M.; Kalkan, F.; Dietrich, F.; Dröder, K. X-ray Based Visualization of the Electrolyte Filling Process of Lithium Ion Batteries. J. Electrochem. Soc. 2018, 166, A5163–A5167. [Google Scholar] [CrossRef]
  48. Eifert, L.; Bevilacqua, N.; Köble, K.; Fahy, K.; Xiao, L.; Li, M.; Duan, K.; Bazylak, A.; Sui, P.C.; Zeis, R. Synchrotron X-ray Radiography and Tomography of Vanadium Redox Flow Batteries-Cell Design, Electrolyte Flow Geometry, and Gas Bubble Formation. ChemSusChem 2020, 13, 3154–3165. [Google Scholar] [CrossRef] [PubMed]
  49. Gebhard, M.; Schnucklake, M.; Hilger, A.; Röhe, M.; Osenberg, M.; Krewer, U.; Manke, I.; Roth, C. X–Ray–Computed Radiography and Tomography Study of Electrolyte Invasion and Distribution inside Pristine and Heat–Treated Carbon Felts for Redox Flow Batteries. Energy Technol. 2020, 8, 1901214. [Google Scholar] [CrossRef] [Green Version]
  50. Günter, F.J.; Habedank, J.B.; Schreiner, D.; Neuwirth, T.; Gilles, R.; Reinhart, G. Introduction to Electrochemical Impedance Spectroscopy as a Measurement Method for the Wetting Degree of Lithium-Ion Cells. J. Electrochem. Soc. 2018, 165, A3249–A3256. [Google Scholar] [CrossRef] [Green Version]
  51. Weydanz, W.; Reisenweber, H.; Gottschalk, A.; Schulz, M.; Knoche, T.; Reinhart, G.; Masuch, M.; Franke, J.; Gilles, R. Visualization of electrolyte filling process and influence of vacuum during filling for hard case prismatic lithium ion cells by neutron imaging to optimize the production process. J. Power Sources 2018, 380, 126–134. [Google Scholar] [CrossRef]
  52. Wang, H.; Watkins, T.R.; Simunovic, S.; Bingham, P.R.; Allu, S.; Turner, J.A. Fragmentation of copper current collectors in Li-ion batteries during spherical indentation. J. Power Sources 2017, 364, 432–436. [Google Scholar] [CrossRef]
  53. Finegan, D.P.; Scheel, M.; Robinson, J.B.; Tjaden, B.; Hunt, I.; Mason, T.J.; Millichamp, J.; Di Michiel, M.; Offer, G.J.; Hinds, G.; et al. In-operando high-speed tomography of lithium-ion batteries during thermal runaway. Nat. Commun. 2015, 6, 6924. [Google Scholar] [CrossRef] [PubMed] [Green Version]
  54. Chattopadhyay, S.; Lipson, A.L.; Karmel, H.J.; Emery, J.D.; Fister, T.T.; Fenter, P.A.; Hersam, M.C.; Bedzyk, M.J. In Situ X-ray Study of the Solid Electrolyte Interphase (SEI) Formation on Graphene as a Model Li-ion Battery Anode. Chem. Mater. 2012, 24, 3038–3043. [Google Scholar] [CrossRef]
  55. Schröder, D.; Bender, C.L.; Arlt, T.; Osenberg, M.; Hilger, A.; Risse, S.; Ballauff, M.; Manke, I.; Janek, J. In operando X-ray tomography for next-generation batteries: A systematic approach to monitor reaction product distribution and transport processes. J. Phys. Appl. Phys. 2016, 49, 404001. [Google Scholar] [CrossRef]
  56. Vanpeene, V.; Villanova, J.; Suuronen, J.P.; King, A.; Bonnin, A.; Adrien, J.; Maire, E.; Roué, L. Monitoring the morphological changes of Si-based electrodes by X-ray computed tomography: A 4D-multiscale approach. Nano Energy 2020, 74, 104848. [Google Scholar] [CrossRef]
  57. Chen, H.; Shen, J. A degradation-based sorting method for lithium-ion battery reuse. PLoS ONE 2017, 12, e0185922. [Google Scholar] [CrossRef] [Green Version]
  58. Ran, A.; Chen, S.; Zhang, S.; Liu, S.; Zhou, Z.; Nie, P.; Qian, K.; Fang, L.; Zhao, S.X.; Li, B.; et al. A gradient screening approach for retired lithium-ion batteries based on X-ray computed tomography images. RSC Adv. 2020, 10, 19117–19123. [Google Scholar] [CrossRef] [PubMed]
  59. Carter, R.; Huhman, B.; Love, C.T.; Zenyuk, I.V. X-ray computed tomography comparison of individual and parallel assembled commercial lithium iron phosphate batteries at end of life after high rate cycling. J. Power Sources 2018, 381, 46–55. [Google Scholar] [CrossRef]
  60. Kong, L.; Hu, X.; Gui, G.; Su, Y.; Pecht, M. Computed Tomography Analysis of Li-Ion Battery Case Ruptures. Fire Technol. 2020, 56, 2565–2578. [Google Scholar] [CrossRef]
  61. An, S.J.; Li, J.; Daniel, C.; Kalnaus, S.; Wood, D.L. Design and Demonstration of Three-Electrode Pouch Cells for Lithium-Ion Batteries. J. Electrochem. Soc. 2017, 164, A1755–A1764. [Google Scholar] [CrossRef]
  62. Mao, C.; Ruther, R.E.; Li, J.; Du, Z.; Belharouak, I. Identifying the limiting electrode in lithium ion batteries for extreme fast charging. Electrochem. Commun. 2018, 97, 37–41. [Google Scholar] [CrossRef]
  63. Tang, M.; Albertus, P.; Newman, J. Two-Dimensional Modeling of Lithium Deposition during Cell Charging. J. Electrochem. Soc. 2009, 156, A390. [Google Scholar] [CrossRef]
  64. Pfleging, W.; Pröll, J. A new approach for rapid electrolyte wetting in tape cast electrodes for lithium-ion batteries. J. Mater. Chem. A 2014, 2, 14918–14926. [Google Scholar] [CrossRef]
  65. Galushkin, N.E.; Yazvinskaya, N.N.; Galushkin, D.N. Mechanism of Thermal Runaway in Lithium-Ion Cells. J. Electrochem. Soc. 2018, 165, A1303–A1308. [Google Scholar] [CrossRef]
  66. Nord, T. AD 2000 Code-Technical Rules for Pressure Vessels; Beuth Verlag GmbH: Berlin, Germany, 2003. [Google Scholar]
  67. Pizer, S.M.; Amburn, E.P.; Austin, J.D.; Cromartie, R.; Geselowitz, A.; Greer, T.; ter Haar Romeny, B.; Zimmerman, J.B.; Zuiderveld, K. Adaptive histogram equalization and its variations. Comput. Vision Graph. Image Process. 1987, 39, 355–368. [Google Scholar] [CrossRef]
  68. Canny, J. A computational approach to edge detection. IEEE Trans. Pattern Anal. Mach. Intell. 1986, 6, 679–698. [Google Scholar] [CrossRef]
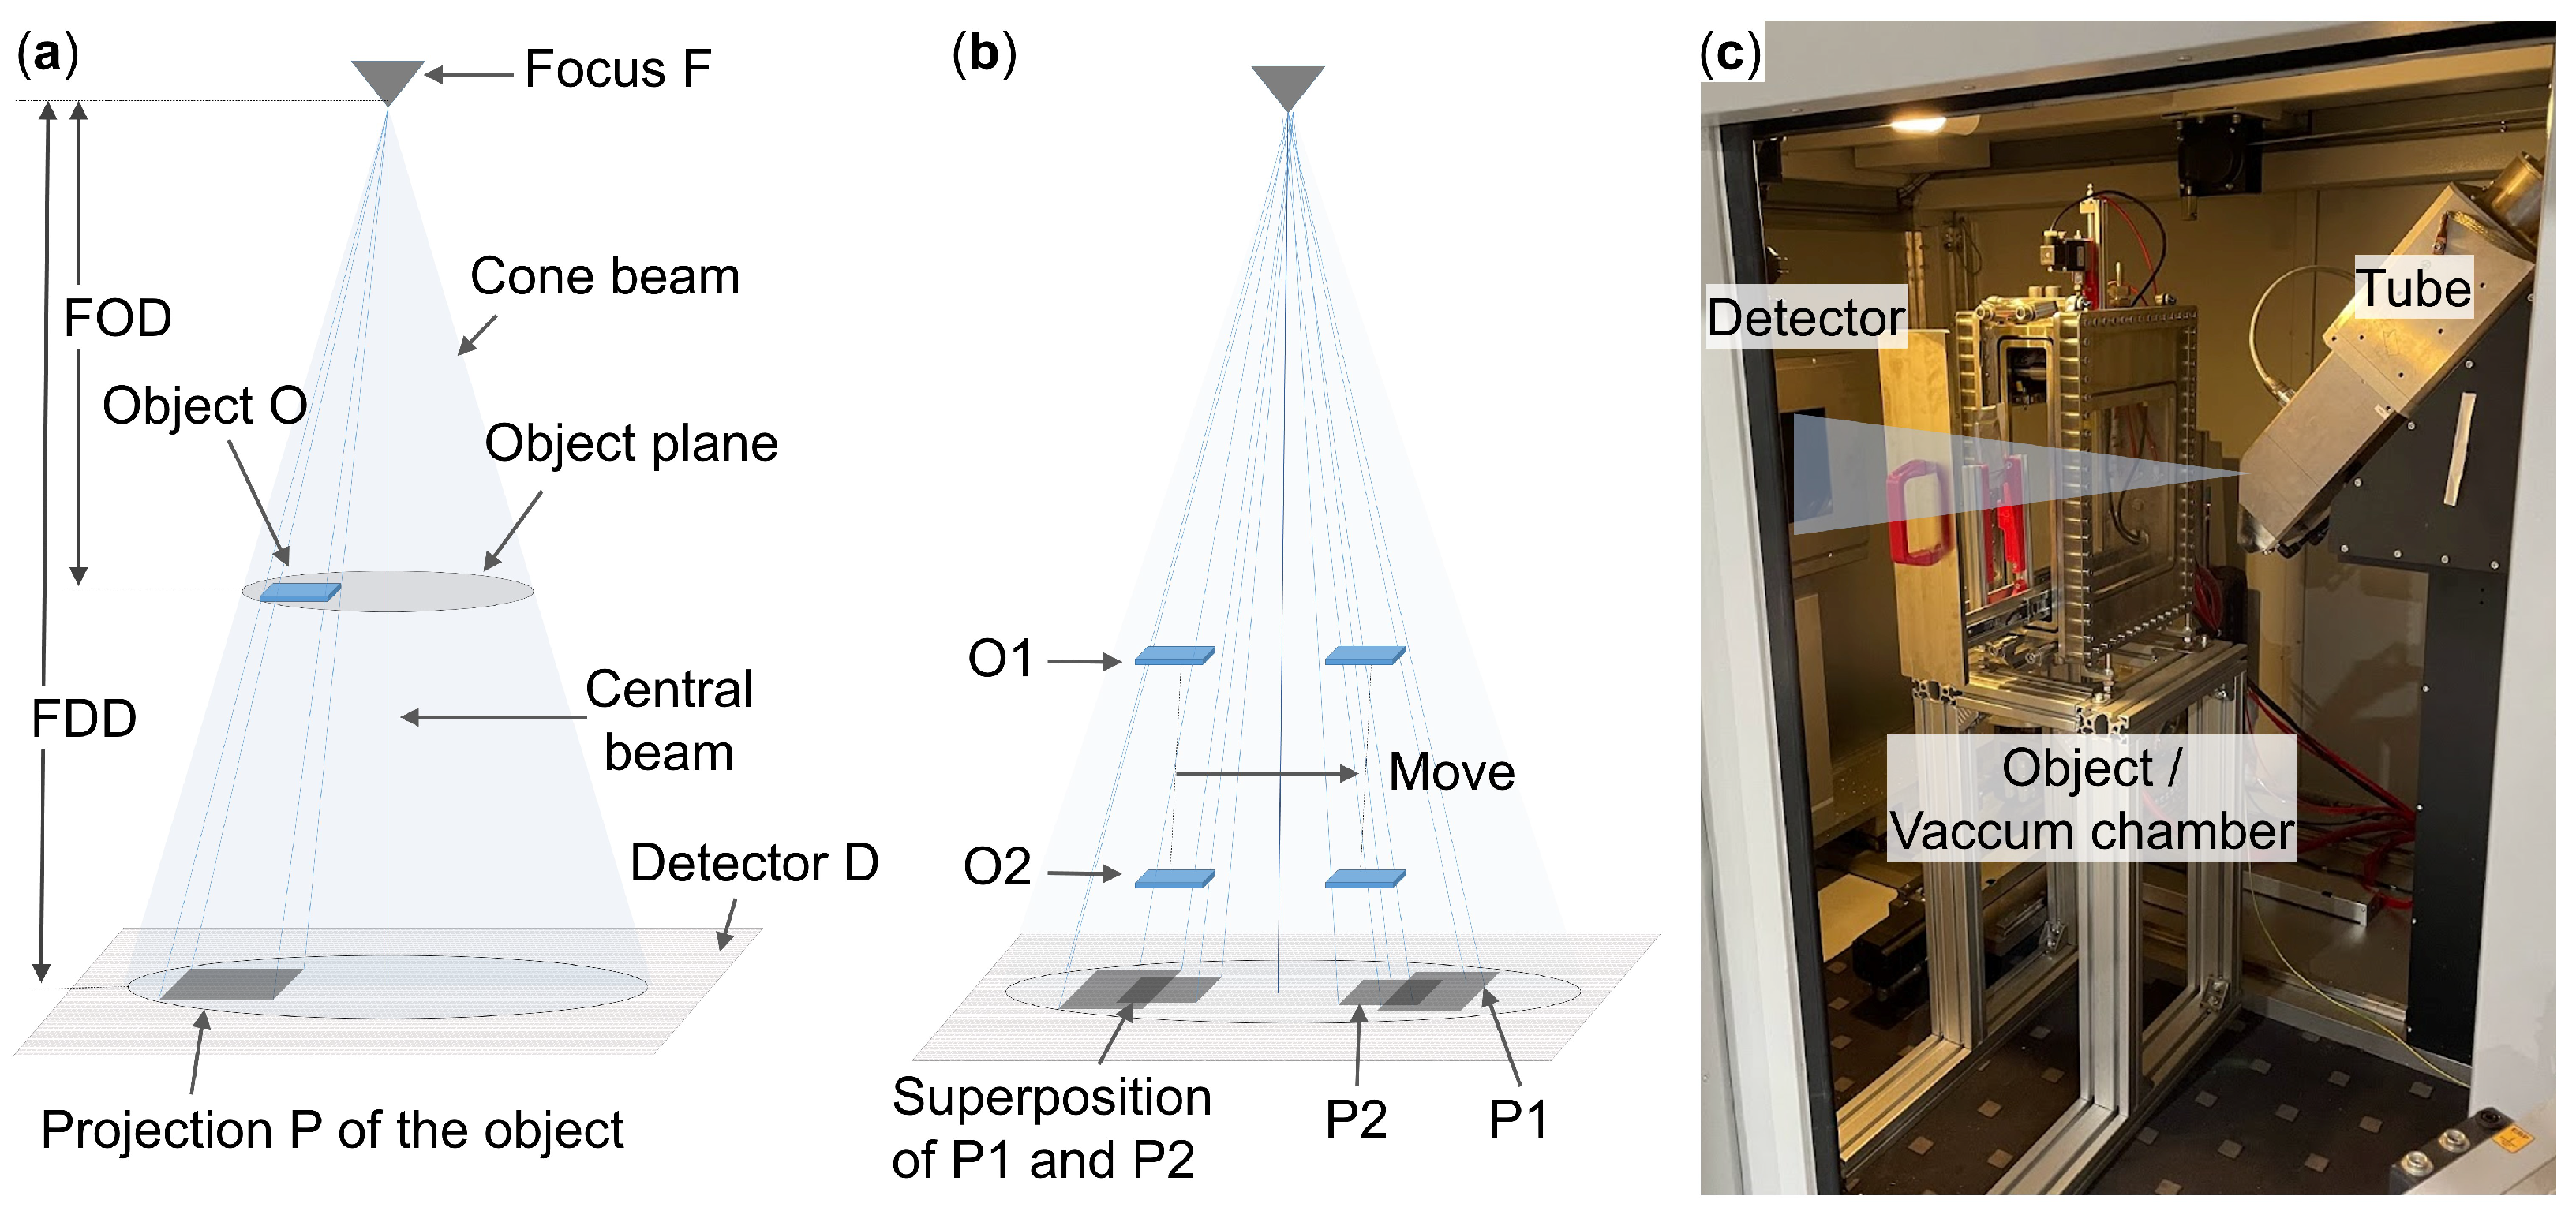
Figure 1. (a): Definition of basic terms of an X-ray inspection with cone beam. (b): Illustration of superposition and the effects of the central beam projection in a radiography. (c): Convetionional X-ray inspection machine and experimental setup for visualization of the electrolyte filling machine (cf. Section 5).
Processes 11 00010 g001
Figure 2. Overview of applications of X-ray inspection techniques in the production steps of a LIB.
Processes 11 00010 g002
Figure 3. (a): Drawing of the ESC in top view. (b): Shown is the S-S Section illustrating the AC overhang in a detailed view.
Processes 11 00010 g003
Figure 4. (a): CT slice in x0z0-plane. (b): CT slice in y0z0-plane. (c): The diagram shows the calculated electrode edge points of the investigated ESC corner. Moreover the relative tolerance field of anodes and cathodes are given.
Processes 11 00010 g004
Figure 5. With the figures presented, different lateral beam directions are qualitatively evaluated: Sketch (a) shows the experimental setup for a lateral beam direction of the ESC corner in y0 direction and the corresponding X-ray image is shown in (c). Sketch (b) shows the experimental setup for a diagonal lateral beam direction of the ESC corner in x45 direction and the corresponding X-ray image is shown in (d). In picture (e) is the CT slice in x0z0-plane and in (f) the CT slice in y0z0-plane is illustrated.
Processes 11 00010 g005
Figure 6. Sketch (a) shows the experimental setup for a vertical beam direction of the ESC corner in z0-direction and the corresponding X-ray image is shown in (b). The diagram in (c) illustrates the linear fit of the electrode edges with the CT data in y0- and x0-direction.
Processes 11 00010 g006
Figure 7. Determination of measurement deviation between a CT and a vertical coordination radiography: The X-ray images (ad) illustrates the vertical coordination radiography in y0-direction by moving the ESC in x0-direction. The y0z0-plane of the central beam is illustrated with a blue line and is focused on Amax in (a), Amin in (b), Cmax in (c), Cmin in (d). Picture (e) shows an example CT slice and the manual measurement of the A-A and C-C distance. In the diagram (f) the measurement deviation between CT and a vertical coordination radiography of 10 ESC edges is plotted. The x-axis depicts the measurement deviations of the A-A and C-C distances in groups of 20 μm and the quantity of measurements in a group can be read on the y-axis.
Processes 11 00010 g007
Figure 8. (a): X-ray permeable vacuum chamber. (b): Impulse sealing system. (c): View of a pouch LIB through their permeable (and see through) sides.
Processes 11 00010 g008
Figure 9. X-ray image of LIBs during filling of 10 mL contrast agent after 60 s. (a): 200 mbar absolute pressure; (b): 400 mbar absolute pressure; (c): 600 mbar absolute pressure; (d): 800 mbar absolute pressure.
Processes 11 00010 g009
Figure 10. Detection of bubbles in X-ray images (200 mbar, 400 s shown here); (a): Sampled and preprocessed X-ray image. (b): Detected bubbles. (c): Number of bubbles over time for 200 mbar, 400 mbar, 600 mbar and 800 mbar chamber pressure. The pale colors show raw measurements while the thick lines show averages over 10 s intervals (non-sliding).
Processes 11 00010 g010
Figure 11. Image processing for evaluation of fluid distribution in an evacuated LIB around 10 s after dosing the fluid. (a): Preprocessed input image. (b): Calibrated differential image. (c): Masked LIB areas. (d): Distribution of fluid in the LIB stack and dead volume over time.
Processes 11 00010 g011
Disclaimer/Publisher’s Note: The statements, opinions and data contained in all publications are solely those of the individual author(s) and contributor(s) and not of MDPI and/or the editor(s). MDPI and/or the editor(s) disclaim responsibility for any injury to people or property resulting from any ideas, methods, instructions or products referred to in the content.