Article

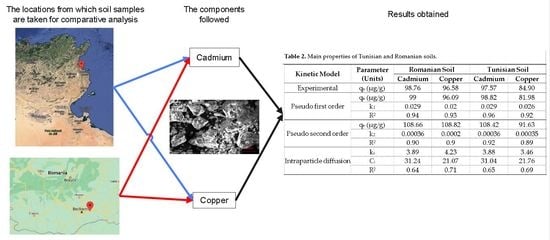
Assessment of Cadmium and Copper Adsorption by Two Agricultural Soils from Romania and Tunisia: Risk of Water Resource Pollution

by
Mohamed Abdelwaheb
1,2,
Valentin Nedeff
2,3,
Sonia Dridi-Dhaouadi
1,
Emilian Moșneguțu
2,*,
Narcis Barsan
2 and
Alexandra-Dana Chițimus
2,*
1
Research Laboratory of Environmental Chemistry and Clean Processes (LR21ES04), Faculty of Sciences of Monastir, University of Monastir, Monastir 5000, Tunisia
2
Department of Environmental Engineering and Mechanical Engineering, Faculty of Engineering, Vasile Alecsandri University of Bacau, 157 Calea Marasesti, 600115 Bacau, Romania
3
The Academy of Agricultural and Forestry Sciences “Gheorghe Ionescu-Şişeşti”, 011464 Bucuresti, Romania
*
Authors to whom correspondence should be addressed.
Processes 2022, 10(9), 1802; https://doi.org/10.3390/pr10091802
Submission received: 12 August 2022 / Revised: 2 September 2022 / Accepted: 2 September 2022 / Published: 7 September 2022
(This article belongs to the Special Issue Microbial Biotechnology for Environmental Remediation and Restoration)

Abstract

:
Using treated wastewater for irrigation is a good solution for conserving water, but it is also in part responsible for groundwater and water surface pollution by heavy metals, especially copper and cadmium. The soil can be a barrier to retaining these pollutants and protecting the water resource. This study presents an assessment of the adsorption of copper and cadmium by two agricultural soils from Tunisia and Romania to evaluate the risk of water pollution. At first, the two soils were characterized with a scanning electron microscope and different physico-chemical analyses. Before adsorption, the elemental analysis performed with an SEM showed a very low amount of cadmium and copper in both soils (0.01%). The Tunisian soil was considered clayey soil, and the Romanian soil was sandy clayey soil. All experimental kinetics and isotherms were well correlated (R2 > 0.9) with the pseudo-first-order kinetic model and the modified and extended Redlich–Peterson binary adsorption model. For an initial concentration of both pollutants of 0.1 mmol·L−1, the amounts retained and the adsorption percentage of copper and cadmium by the two soils indicate that the Romanian soil (qCu = 0.87 μmol·g−1; % Cu = 98%; qCd = 0.88 μmol·L−1; % Cd = 99%) retained both pollutants better than the Tunisian soil (qCu = 0.65 μmol·g−1, %Cu = 83%; qCd = 0.73 μmol·g−1; %Cd = 93%). Copper presents the greatest risk of water resource pollution, especially in Tunisia. The SEM confirmed the soil adsorption of Cu and Cd and estimated that the retention mechanisms of these two heavy metals are mainly related to the amount of phosphorus, chloride, sulfur and carbon by complexation and precipitation reactions.

Graphical Abstract

1. Introduction

Agriculture activity has developed considerably in the last few centuries. Irrigation is one of the most important agricultural activities to ensure food self-sufficiency even as water resources are decreasing. One of the solutions is to use treated wastewater supplied by water treatment plants. This solution increases the risk of soil pollution by heavy metals which present an insistent contaminant. These elements can leach into the groundwater or drain toward surface water. Copper and cadmium are the most known heavy metals used in different fields. Copper is used for fabricating valves, fittings and pipes, and it is an essential element in coatings and alloys. Cadmium is electrodeposited onto steel and is used as an anticorrosive. Electric batteries, nuclear reactors, pigments in plastics and some electronic components are mainly formed from cadmium compounds. Cadmium is a carcinogenic heavy metal, and it occurs in testis and prostate cancers [1,2]. Other effects have been reported by Krajnc [3] such as problems in the liver, hematopoietic system and immune system. Copper can cause hematuria, hepatocellular toxicity, gastrointestinal bleeding, acute renal failure and intravascular hemolysis in high doses [4], and in low doses, symptoms common to food poisoning (nausea, diarrhea, vomiting and headache) are caused [5,6].
Copper and cadmium exist in different soils in different parts of the world, especially in Romania and Tunisia. Cordos [7] and Ulman [8] showed the pollution of a Romanian soil by different heavy metals, especially copper and cadmium; in the same way, Khelifi [9], Ghemari [10] and Boussen [11] presented different Tunisian soils contaminated by heavy metals, principally Cu and Cd. Cadmium is a greater soil pollutant than copper in the two countries.
The aim of this work was to quantify the risk of pollution of water resources by cadmium and copper in two different countries (Tunisia and Romania). The study was an assessment of the adsorption of cadmium and copper in two agricultural soils from Tunisia and Romania. The pollutants’ behaviors were estimated by different isotherm and kinetic adsorption models. Scanning electron microscope and different physico-chemical analyses were performed to analyze these soils in order to estimate the retention mechanism of Cu and Cd by these soils.

2. Materials and Methods

2.1. Preparation of Cadmium and Copper Solutions

The solutions of cadmium and copper were prepared from CdSO4 and CuSO4.5H2O (Alfa Aesar by Thermo Fisher), respectively. In distilled water, these solids were dissolved to have a concentration of 1000 mg·L−1 for each metal cation. Different dilutions were completed to have each other’s concentrations.

2.2. Preparation and Characterization of the Soils

Tunisian and Romanian soils from the agricultural region of Chat Meriem (Sousse, Tunisia) and from an agricultural region of Fundulea (Bucharest, Romania) were dried for 24 h, sieved to keep the particles less than 2 mm in width and finally characterized. Soil electrical conductivity and pH were measured using WTW multi 9420 in demineralized water/soil suspension of 2.5/1 (volume/weight). The pH of zero charges was established by a pH metric method using sodium chloride as an adsorbent, and the two soils as adsorbents. pH value was measured before and after contact between the sodium solution and the soils, and the interaction between the curves of initial pH and final pH is the pHzpc [12]. Soil texture was established using Robinson pipette. The cationic exchange capacity was estimated by a colorimetric method based on the Cu-triethylenetetramine complex. The organic carbon was determined by Mignorance [13] method based on the oxidation of carbon in soil with the dichromate. After extraction of soil with the mixture of sulfuric acid and hydrochloric acid, the determination of chloride, nitrate, nitrite, phosphorus and sulfur concentrations in the soils was carried out by different colorimetric methods. Nitrate and nitrite were analyzed by Henrikson and Selmer [14] method, based on nitrate reduction to nitrite with copper and cadmium solution; nitrites form with sulfanilamide a diazo compound and react with N-(1-naphthyl) ethylenediamine dihydrochloride to form an azo dye, measured at 520 nm. Total phosphorus from phospho-molybdate compound with molybdenum blue was measured at 720 nm [15]. Sulfur forms with barium chloride a precipitate of barium sulfate which was measured at 420 nm [16]. Chloride was titrated with silver nitrate (AgNO3) using potassium dichromate as an indicator (K2Cr2O7) [17].
The structural analysis of soils was carried out with scanning electron microscope (Tuscan SEM) to examine soil particle morphology and chemical composition [18].

2.3. Adsorption Experiment of Cadmium and Copper by the Soils

The kinetics and isotherms of copper and cadmium in Tunisian and Romanian soils were obtained in a stirring batch reactor. A total of 500 mL of heavy metal solution (cadmium and copper) was mixed with 50 g of each soil with a crossed-blade mixing bar (2 cm × 1 cm × 25 cm) that relied on Heidolph type RZR-2102 motor. Stirring was maintained at a constant temperature of 22 °C at 260 rpm, and the pH of the solution was between 7.0 and 7.5 (without adjustment).
The adsorption kinetics was obtained to estimate the needed time to attain the equilibrium of each pollutant. The concentration used was 10 mg·L−1, and aliquots of 1 mL were taken after 15, 30, 45, 60, 120, 180, 240, 360 and 420 min for centrifugation (3000 RPM, 20 min) and analyzed with atomic absorption spectrometer. Adsorption isotherm was obtained after kinetics for concentration of between 2 and 80 mg·L−1.
The adsorption capacity for each heavy metal by soil q (mg·g−1) was evaluated with the following equation:
q = ((Ci − Ct)/m) × V
Ci and Ct (mg·L−1) are the initial and each time concentrations of cadmium or copper, V (mL) is solution volume, and m (g) is the mass of each dry soil.

2.4. Adsorption Modeling

The kinetic data of cadmium and copper in each soil was explained by three models: pseudo first order, pseudo second order and intraparticle diffusion.
Pseudo first order qt = qe (1 − Exp(−k1 t))
where qe and qt (mg·g−1) are the cadmium or copper adsorption quantity at equilibrium and at time t (min), and k1 (min−1) is the rate constant of pseudo-first-order model.
This model shows physical adsorption which represents low interaction forces between pollutants (adsorbate) and soil (adsorbent) [19].
Pseudo second order pt = (qe2 k2 t)/(1 + qe k2 t)
where k2 (g·mg−1·min−1) is the rate constant of the pseudo-second-order model.
This model assumes chemical adsorption which shows a strong interaction force between pollutants (adsorbate) and soil (adsorbent) [19]:
Intraparticle   diffusion   q t = k i t + c i
where ki (mg·g−1·min−1) is the rate constant of intraparticle diffusion model, and ci (mg·g−1) is a parameter linked to the boundary layer thickness.
The intraparticle diffusion model is defined, at first, by an external mass transfer in the solution of the adsorbate and, secondly, diffusion to the pores of adsorbent, which predicts the thickness of the boundary film [20].
The isotherm data which relied on the equilibrium adsorption capacity qe (mg·g−1) and concentration of copper and cadmium in the two soils Ce (mg·L−1) were fitted by three unary models: Langmuir, Freundlich and Redlich–Peterson [21]:
Langmuir isotherm qe = (qmax KL Ce)/(1 + KL Ce)
where KL (L·mg−1) is the constant of Langmuir, and qmax (mg·g−1) is the maximum adsorbed cadmium or copper quantity.
Langmuir isotherm shows monolayer adsorption, the sites are identical and equivalent, and there is no interaction between the molecules adsorbed on adjoining sites.
Freundlich isotherm qe = KF Ce(1/nf)
where KF (mg1−1/nf·L1/nf·g−1) is the constant of Freundlich, and 1/nf (dimensionless) is the intensity of the adsorption.
Freundlich model defines multilayer adsorption in heterogonous surface [22]:
Redlich–Peterson qe = (KRP Ce)/(1 + aRP CebRP)
where KRP (L·g−1), aRP (mg(1−bRP)·LbRP·g−1) and bRP (dimensionless) are the constant of Redlich–Peterson isotherm model.
Redlich–Peterson is combined with both Freundlich and Langmuir isotherms, and the adsorption process is hybrid that is carried out on heterogeneous surfaces [19,22].
The solution contains two pollutants (copper and cadmium) in competition; therefore, the unary model used was not applied in this case. Three modified and competitive binary models of Langmuir, Freundlich and Redlich–Peterson were employed to describe the behavior of these heavy metals in soils [23].
Langmuir modified and competitive:
q(e,i) = (qmaxi K(L,i) (C(e,i)(L,i)))/(1 + ∑(j=1)NK(L,j) (C(e,j)(L,j)))
where qe,i (mg·g−1) is the equilibrium adsorption quantity of compound i; C(e,i) and C(e,j) (mg·L−1) are the equilibrium concentration of compounds i and j, respectively; K(L,i) and K(L,j) (L·g−1) are Langmuir constant for compounds i and j, respectively; qmaxi (mg·g−1) is the maximum adsorbed quantity for compound i; N (dimensionless) is the total number of pollutants in the solution; and ηL,I and ηL,j are the interaction factor between compound i and compound j, and vice versa [23].
This model introduces an interaction factor η which estimates the competitive effect in the solution of the adsorbates; this parameter depends on other element concentrations (copper or cadmium) present in the solution.
Freundlich modified and competitive q(e,i) = (K(F,i) C(e,i)(ni+xi))/(C(e,i)xi + yi C(e,j)zi)
K(F,i) (L·g(−1)) and ni are Freundlich constants for compound i; x, y and z are constants determined by minimizing error in nonlinear regression analysis.
This isotherm model is for heterogeneous surfaces when different interactions occur between the retained molecules (copper and cadmium) [23].
Redlich–Peterson modified and competitive:
q(e,i) = (K(RP,i) (C(e,i)(RP,i)))/(1 + ∑(j=1)N(a(RP,j) (C(e,j)(RP,j))RP,j)))
K(RP,i) (L·mg−1) and a(RP,j) (mg1−bRP·LbRP·g−1) are Redlich–Peterson constants for compounds i and j, respectively; βRP,j is Redlich–Peterson exponent varying from 0 to 1 relating to compound j; and ηRP,I and ηRP,j are the interaction factor between compound i and compound j, and vice versa [23].
This model presents an interaction term that evaluates the interaction nature between the molecules present in competition.
The modeling for these models was performed using the origin program by nonlinear regression [12,19,20,21].

3. Results

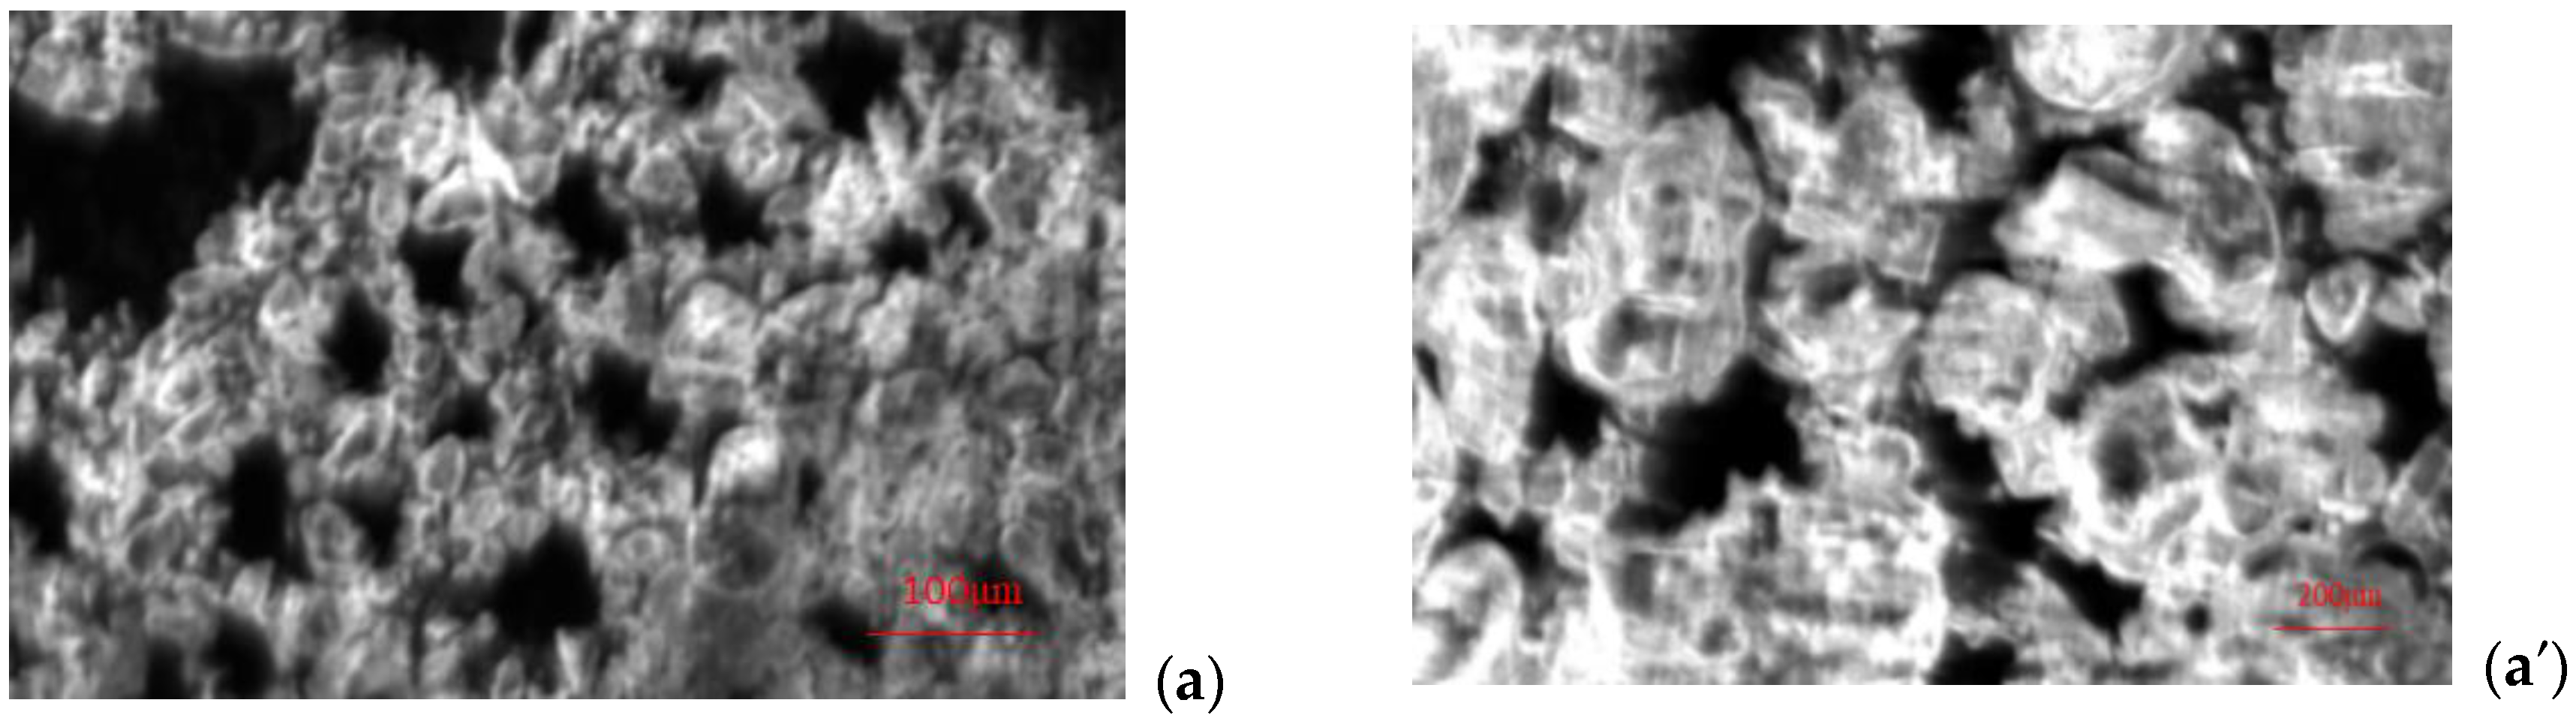
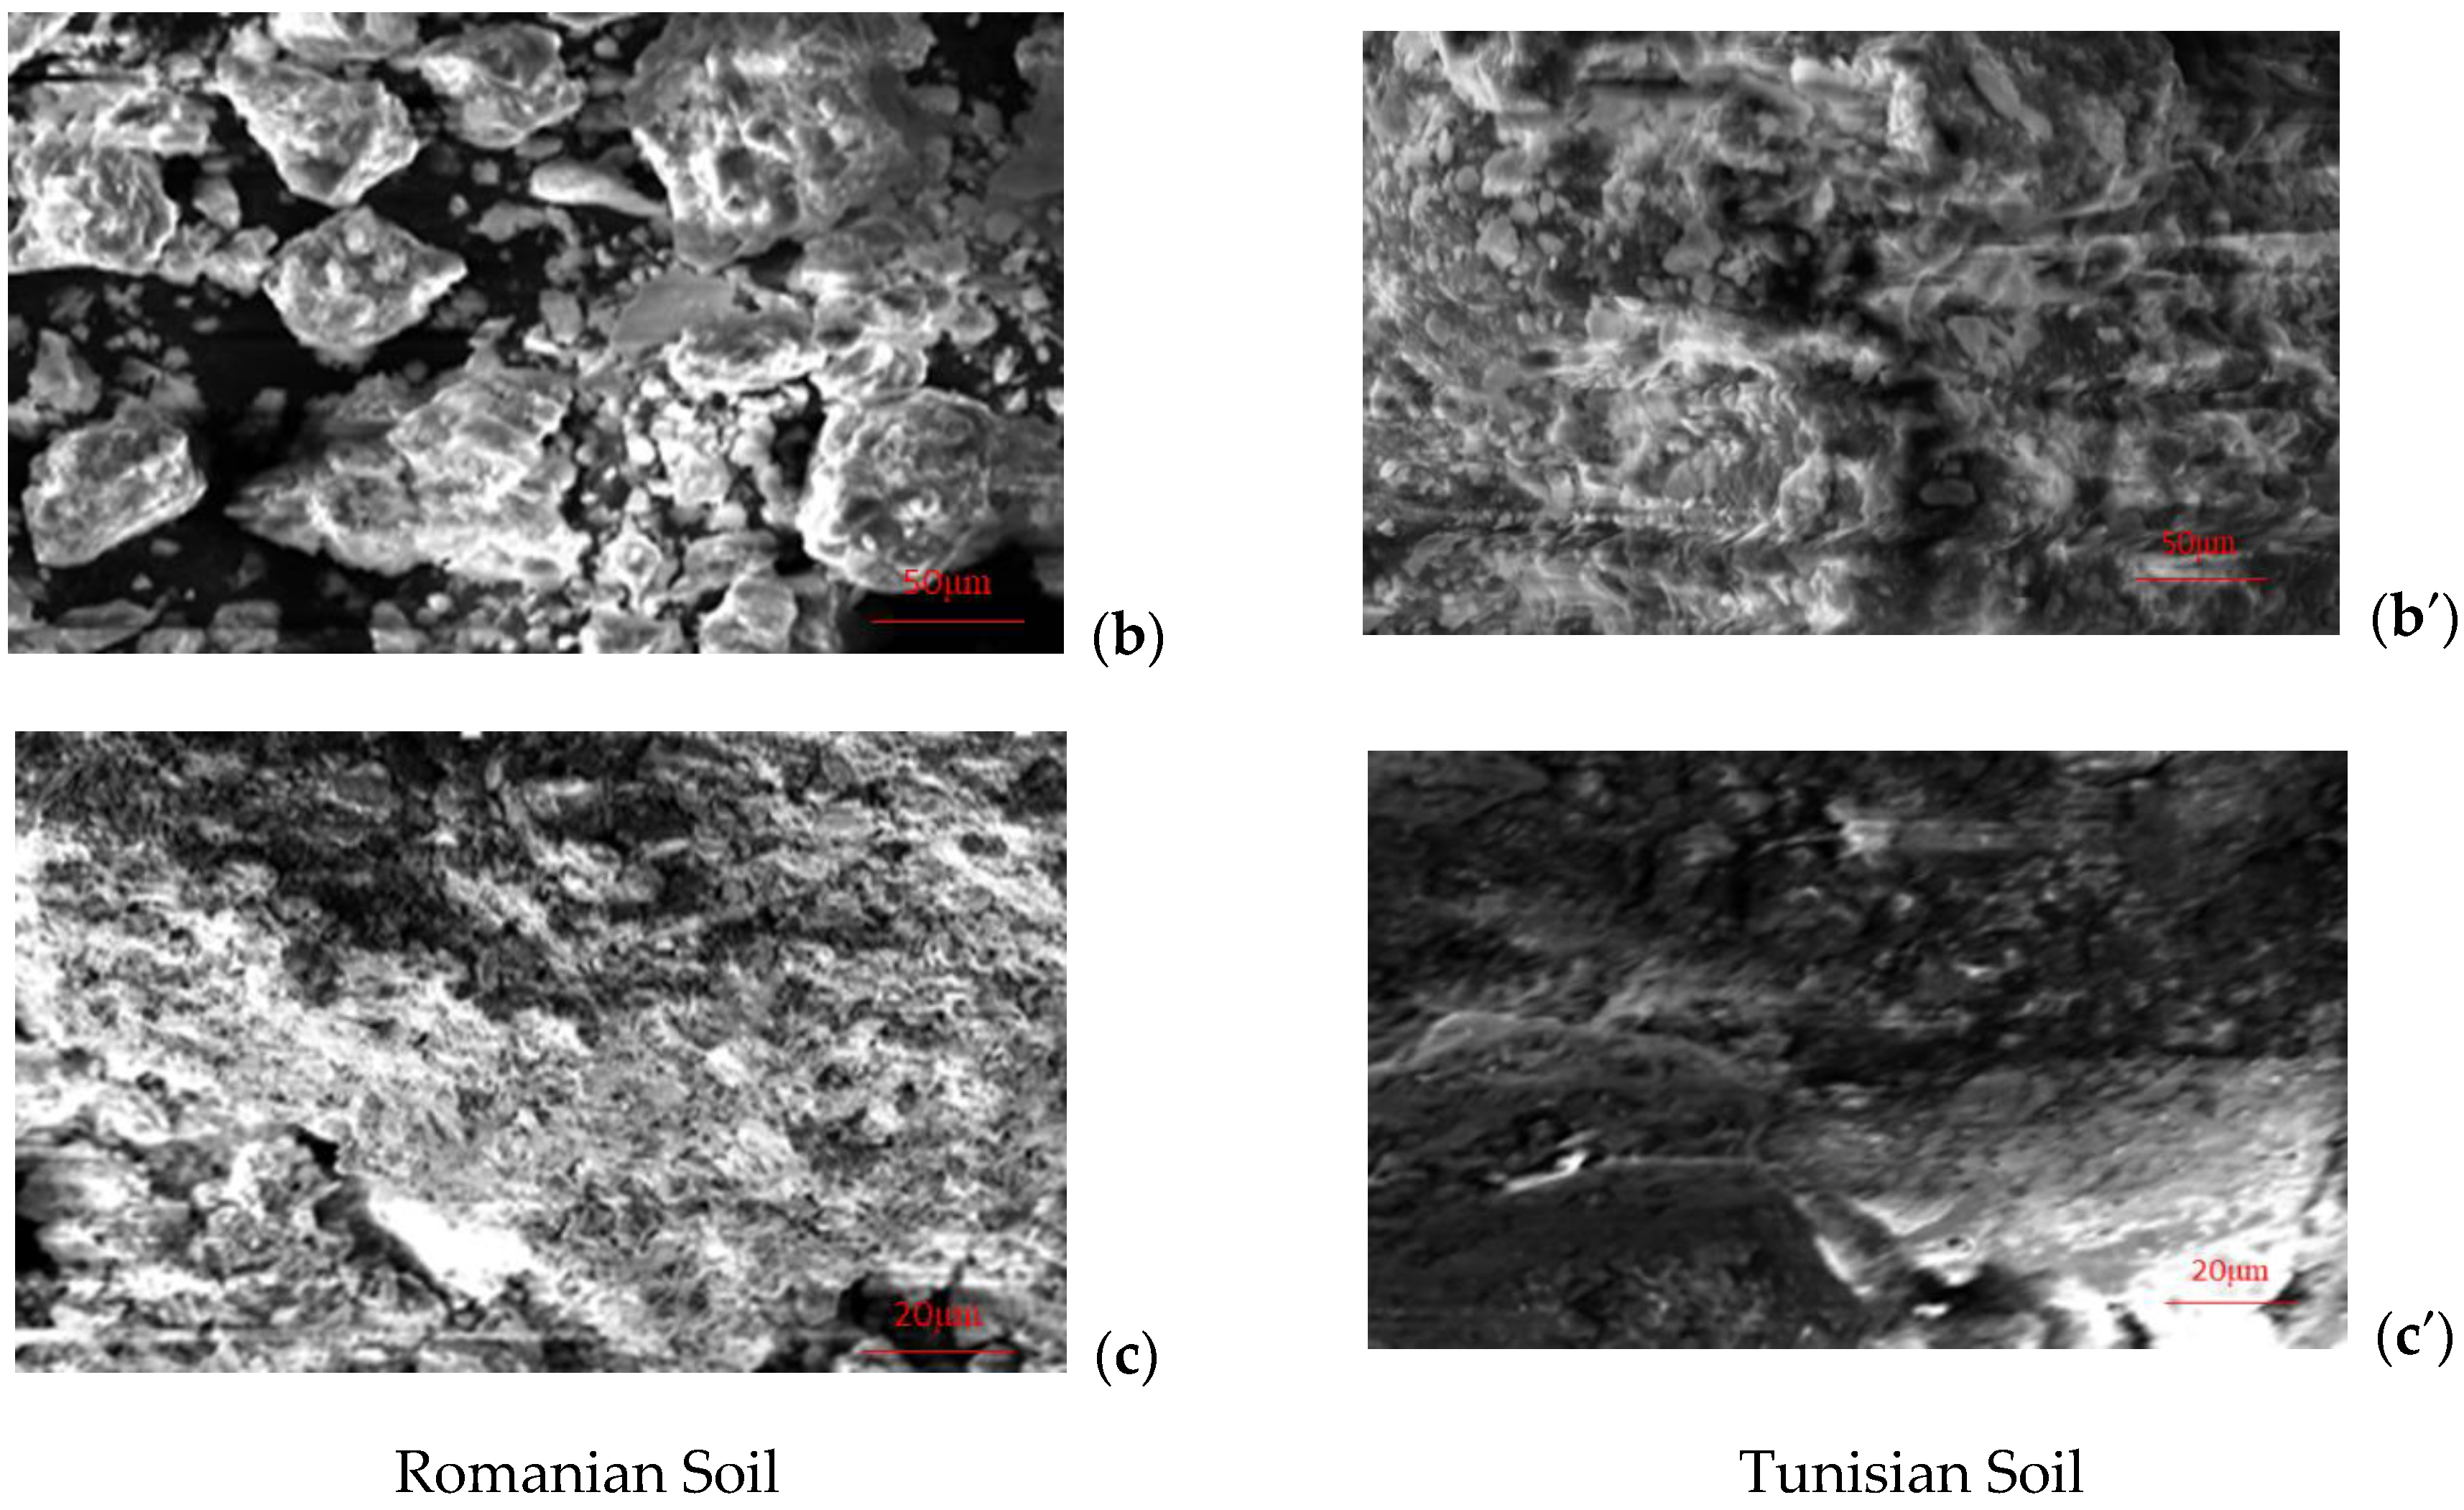
3.1. Soil Properties

The soils’ physico-chemical properties are presented in Table 1. The texture of the Tunisian soil is considered clayey, and the Romanian soil is sandy clayey soil. The organic carbon (OC) content is moderate for both soils, and these values are above the Tunisian [24] and Romanian soil OC [25]. The cationic exchange capacity of the Tunisian soil is higher than the Romanian; this parameter is related to the clay and organic carbon amount, and the Tunisian soil presents more clay than the Romanian soil. The pH of the Tunisian soil is alkaline (pH > 7.5) while the Romanian soil is neutral (6.5 < pH < 7.5). The electric conductivity (EC) values are between 2000 µS·cm−1 and 4000 µS·cm−1; these soils are considered slightly saline, and crop growth or germination of seeds is not limited [26]. The electric conductivity relied on chloride concentration (Cl) in the soils which led to revealing the value difference between those two soils [17]. Phosphorus (P), nitrogen (NO3, NO2) and sulfur (S) are important for plant growth and metabolism; the Tunisian soil presents higher P, N and S than the Romanian soil, and the amounts of these elements depend on agriculture activity and are mainly explained by how much mineral fertilizers are used in this Tunisian soil [27,28]. To analyze the soil morphology and to determine the chemical elements presented, a scanning electron microscope was used.
Figure 1 presents several images with resolutions of between 200 μm and 20 μm for the Romanian and Tunisian soils. Figure 1a,a′ (resolutions are 200 μm and 100 μm) show the high heterogeneity of soil particle sizes for both soils. On the other hand, Figure 1b,b′ (resolution 50 μm) and Figure 1c,c′ (resolution 20 μm) show that soil surfaces present a vacuum and therefore have a porous structure capable of absorbing different types of pollutants [29].
The elemental analysis of each soil was performed with a binding energy of between 0 and 25 Kev. The Romanian and Tunisian soils present a high percentage of carbon and oxygen, followed by silicon. Silicon confirms the high level of quartz in both soils, especially in the Romanian soil. The Romanian soil is essentially composed of aluminum and iron while the Tunisian soil is formed essentially of aluminum and calcium; these results show that the two soils mainly present two different types of clay.

3.2. Adsorption Kinetics of Copper and Cadmium in Romanian and Tunisian Soils

Figure 2, which presents cadmium and copper adsorption kinetics in the Romanian and Tunisian soils, shows that the equilibrium of cadmium and copper in both soils was attained between 60 (1 h) and 120 min (2 h), and the adsorption process was rapid and efficient, especially in the Romanian soil. In this soil, the percentage of adsorption for cadmium and copper was about 98%, although, in the Tunisian soil, the cadmium percentage (98%) was higher than copper (85%). Figure 3 presents also the kinetic models as better fitting. Table 2 shows the parameter for three kinetic models used to fit the results.
The pseudo first order and the pseudo second order were well correlated with the experimental kinetic results for cadmium and copper in the two soils, with the nonlinear determination coefficient R2 varying between 0.89 and 0.96 depending on the soil and the pollutant. In the same way, the equilibrium adsorption capacity estimated by pseudo first order agrees better with the experimental one than pseudo second order. These results mainly indicate a mixture of physical and chemical interactions between cadmium, copper and the soil [18]. However, the intraparticle diffusion model was an inadequate model to describe these kinetics (R2 < 0.75) for cadmium and copper in the Romanian and Tunisian soils.

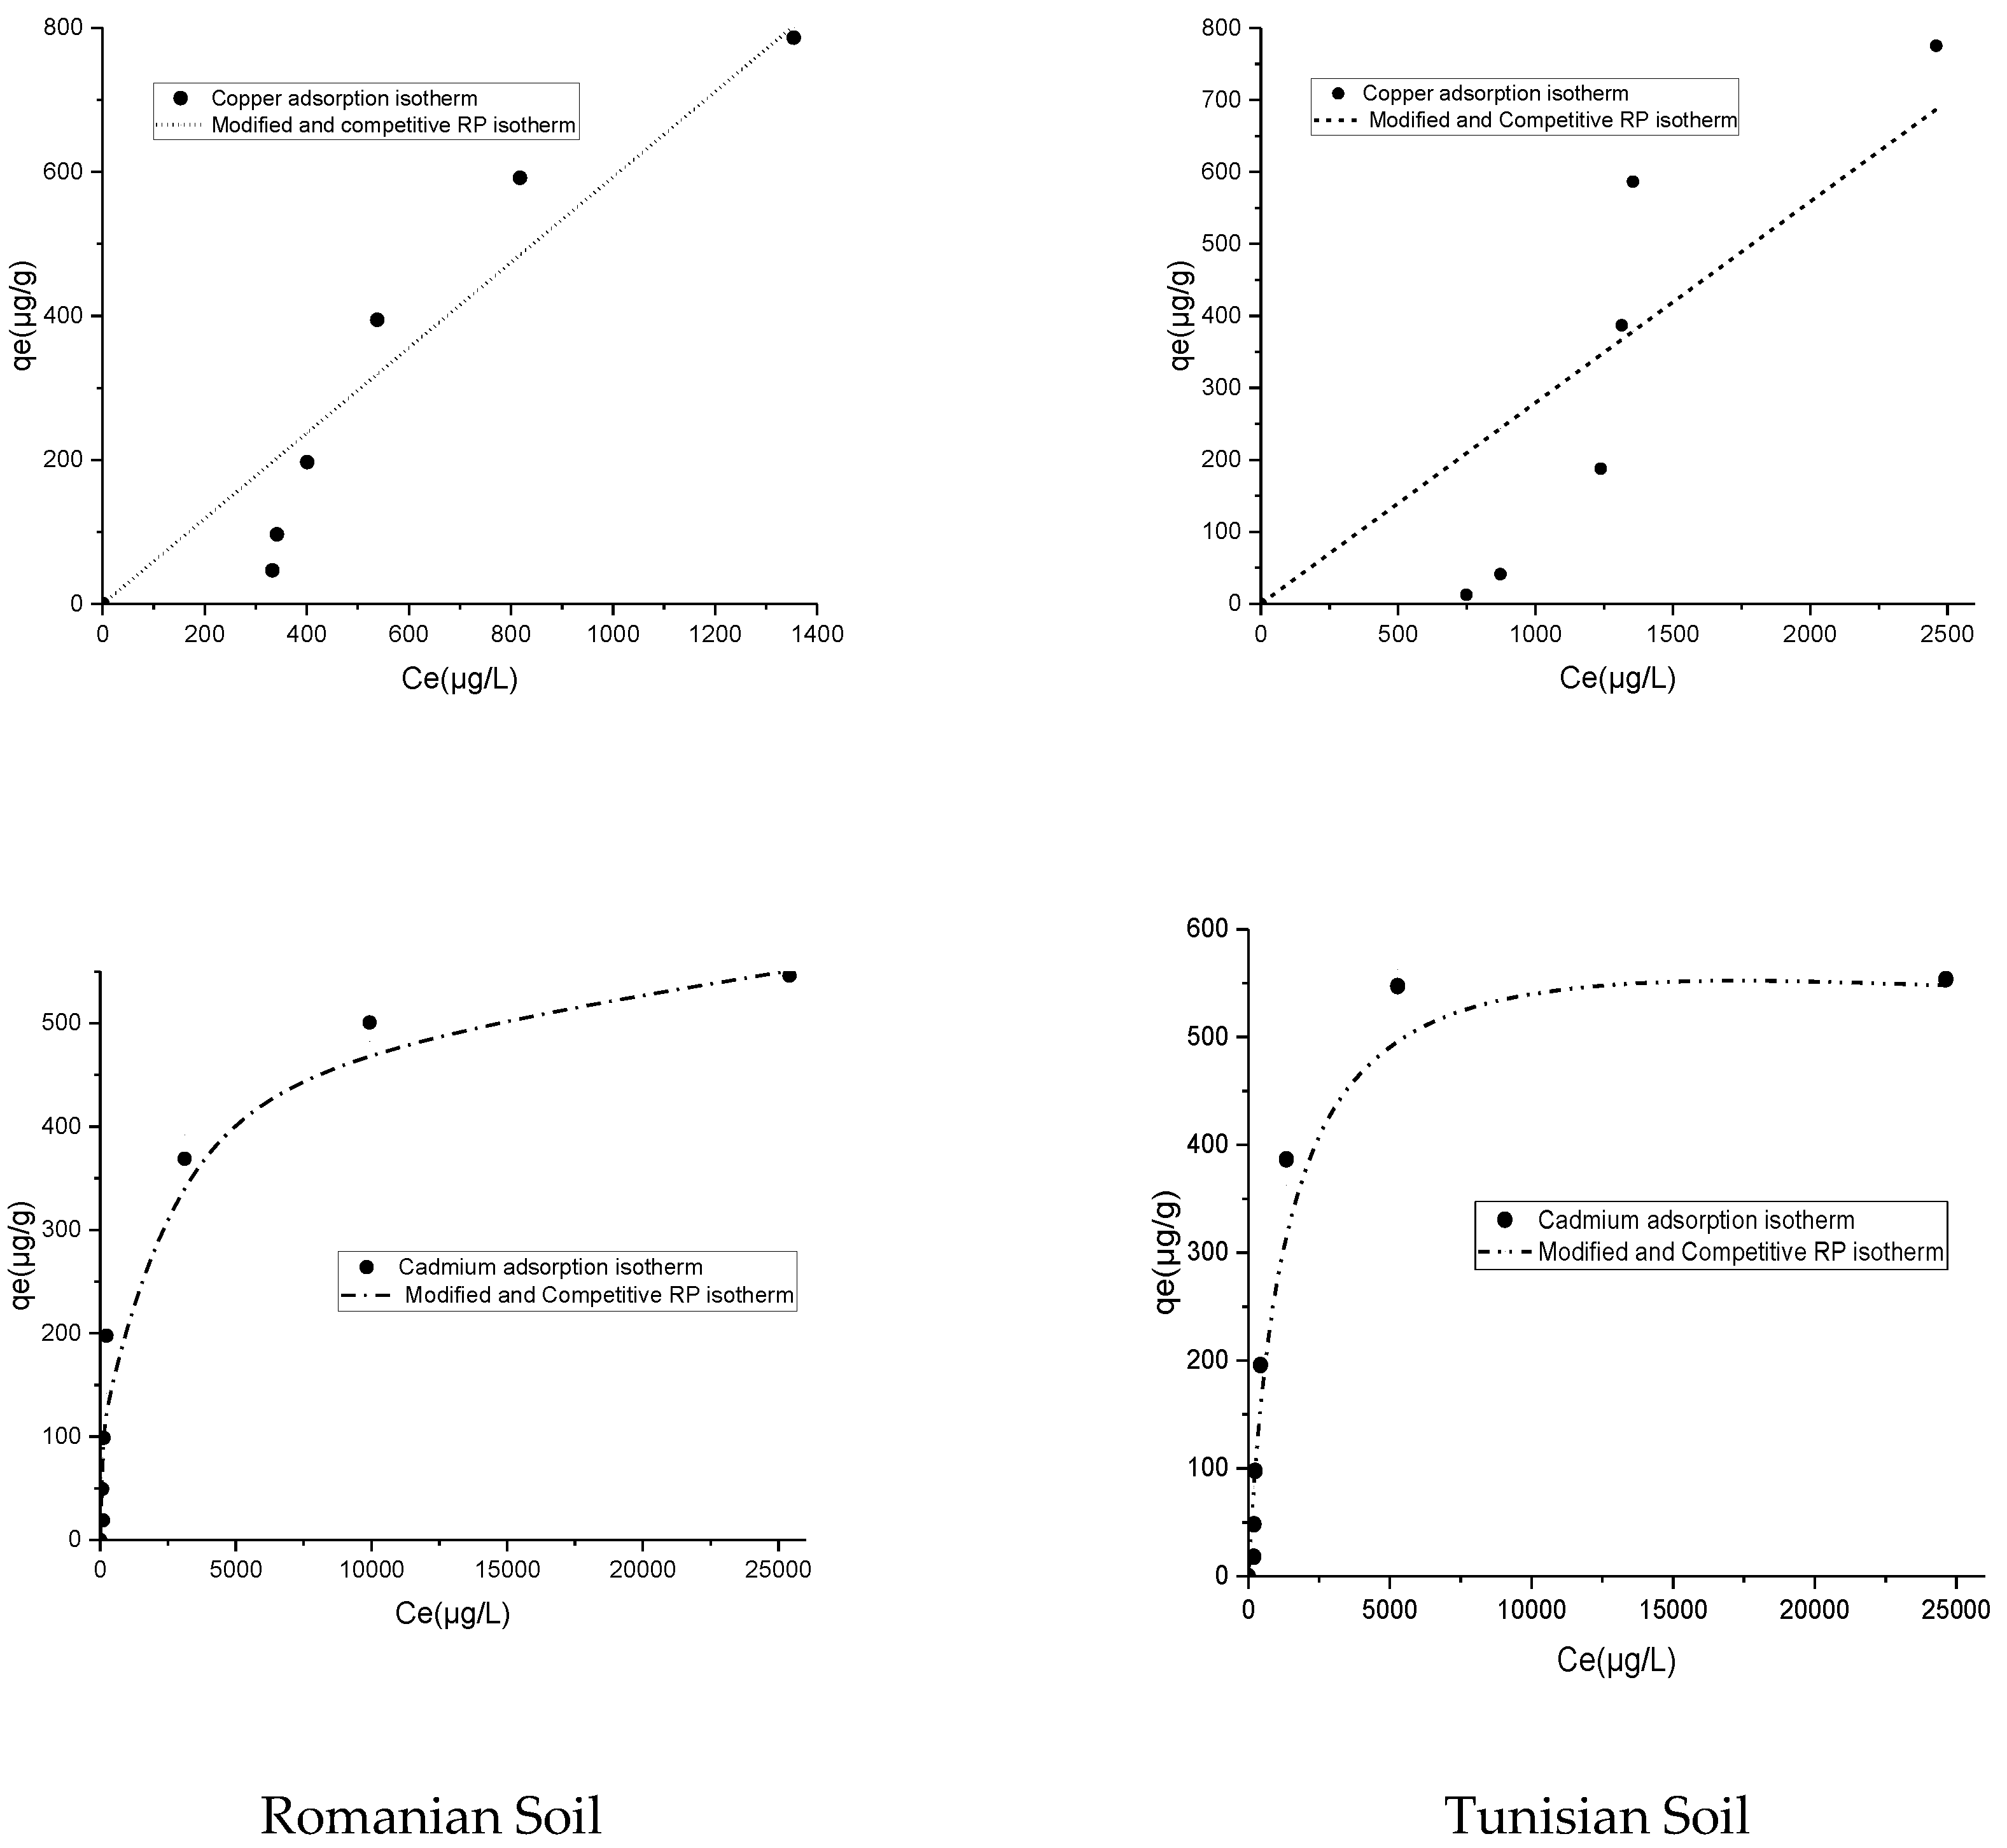
3.3. Adsorption Isotherm of Copper and Cadmium in Romanian and Tunisian Soils

Figure 4 shows the adsorption isotherms of copper and cadmium in the Romanian and Tunisian soils. The isotherm adsorption for the copper is L-type and H-type for the cadmium whatever the soil origin. L-type indicates that the more sites occupied by adsorbate molecules, the more difficult the adsorption of new molecules. H-type indicates that low-concentration adsorbate molecules are completely adsorbed on the adsorbent [30]. Concerning the modeling by mathematical models, three unary models were used to estimate the behavior of each contaminant in the soils (Table 3). In the Tunisian soil, Langmuir and Redlich–Peterson were better correlated for cadmium adsorption (R2 = 0.96 and 0.98, respectively); for copper adsorption, the Freundlich model was the best fitted (R2 = 0.78). In the Romanian soil, the Langmuir, Freundlich and Redlich–Peterson models showed an acceptable fitting with a determination coefficient of 0.96, 0.93 and 0.98, respectively, for cadmium; the Freundlich and Redlich–Peterson models were better correlated for copper (R2 = 0.9 and 0.88, respectively). The maximum adsorption capacity determined by the Langmuir model for copper in the Tunisian and Romanian soils was very different from the experimental one, and therefore, this model was not correlated with copper adsorption isotherms. These results indicate especially that the adsorption process is a mixture of monolayer and multilayer adsorption on the heterogeneous surface of the soil.
In order to introduce the competition effect between cadmium and copper, the multi-component models that were used to smooth the experimental isotherms were the modified and competitive models of Langmuir, Freundlich and Redlich–Peterson. Table 4 shows the fitting of these isotherm parameters of cadmium and copper adsorption in the Tunisian and Romanian soils. The modified and competitive Redlich–Peterson model was better correlated with the experimental results than the modified and competitive Langmuir and Freundlich for copper and cadmium adsorption in the Romanian and Tunisian soils with the determination coefficient varying between 0.86 and 0.98. Compared to the unary models, modified and competitive Redlich–Peterson is the best model that fitted the experimental results for copper and cadmium in the two soils. This model shows hybrid adsorption with the possibility of interaction between these two pollutants, and this interaction may be a repulsion exerted by cadmium on copper.

3.4. Environmental Risk of Water Resource Pollution in Romania and Tunisia by Copper and Cadmium

Figure 5 shows an elemental analysis of the Romanian soil after the adsorption process. Comparing Figure 2 (elemental analysis of the Romanian soil before the adsorption process) and Figure 5, the copper percentage increased from 0.01 to between 0.03 and 0.99% in the Romanian soil and from 0.01 to between 0.25 and 0.6% in the Tunisian soil; the cadmium percentage also increased from 0.01 to between 0.29 and 1.36% in the Romanian soil and from 0.01 to between 0.38 and 0.95% in the Tunisian soil. This result shows that these two soils are able to retain these two pollutants, but it was interesting to evaluate the best soil to prevent water resource pollution.
Figure 6 estimates the adsorption percentage and capacity of copper and cadmium in the Tunisian and Romanian soils at [Cu2+] ≈ [Cd2+] ≈ 0.1 mmol·L−1, considering that the limit of cadmium and copper in water is 0.0035 [31] and 2 mg·L−1 [32] and therefore 3.10−5 mmol·L−1 and 0.03 mmol·L−1.
Comparing the two soils, the soil of Romania better retained copper and cadmium than the soil of Tunisia. Regarding the pH of the solution (7.0–7.5) and the pH of zero charges for the Romanian and Tunisian soils (6.84 and 7.95, respectively), these results indicate that the Romanian soil surfaces were negatively charged suggesting the possibility of electrostatic interaction with copper and cadmium during the adsorption process [12] compared to the Tunisian soil surfaces which were positively charged (no electrostatic interaction with metallic cations).
On the other hand, copper was less retained than cadmium in both soils and presents the greatest risk of water pollution, with a percentage of adsorption of 83% <98% and an adsorption capacity of 0.65 < 0.87 μmol·g−1 in the Tunisian soil and with a percentage of adsorption of 93% < 99% and an adsorption capacity of 0.73 < 0.88 μmol·g−1 in the Romanian soil. Therefore, copper presents the highest risk of contamination of the water resources in this Tunisian soil.
To estimate the retention mechanisms of copper and cadmium by soils, Figure 7a–e present the spatial distribution of cadmium and copper; cadmium, copper and chloride; cadmium, copper and phosphorus; cadmium, copper and sulfur; and finally, cadmium, copper and carbon, respectively. Figure 6a indicates that cadmium occupies more surface area than copper which confirms its high retention compared to copper. Figure 7b–d show that the metallic cation is well associated with the molecules of chloride, phosphorus and sulfur (determined in Table 1), giving a strong possibility of interaction between these elements. These interactions can be represented by complex and precipitate formation, shown by the following equations [33,34,35,36,37,38].
2 PO 4 3 + { 3 Cu 2 + 3 Cd 2 + { Cu 3   ( PO 4 ) 2 Cd 3   ( PO 4 ) 2
Cl + 3 PO 4 3 + { 5 Cu 2 + 5 Cd 2 + { Cu 5   ( PO 4 ) 3 Cl Cd 5   ( PO 4 ) 3 Cl
Cl + { Cu 2 + Cd 2 + { Cu   Cl + Cd   Cl +
S 2 + { Cu 2 + Cd 2 + { Cu   S Cd   S
In the same way, Figure 7e shows that copper and cadmium also interact well with the carbon present in the soil [39,40]; the organic carbon is mainly formed from humic acid and fulvic acid [41], and these organic compounds form various complexes with copper and cadmium [42,43].
On the other hand, cation exchange could be another retention mechanism because both soils present a high percentage of clay [12]; the competition between copper and cadmium gives the advantage to the ion with the largest ionic radius [44] which is cadmium.

4. Conclusions

This study showed an assessment of copper and cadmium adsorption by two agricultural soils from Tunisia and Romania. For this purpose, the two soils were analyzed by physico-chemical and scanning electron microscope analyses, and then, kinetic and isotherm experimental adsorption was correlated by various mathematical models.
The pseudo-first-order and pseudo-second-order kinetic models fitted the kinetic experiment for copper and cadmium in the Tunisian and Romanian soils. The modified and extended Redlich–Peterson isotherm model was a suitable model to describe the copper and cadmium experimental isotherm values in the two soils.
Thus, the results of this work indicate that copper and cadmium were better retained in the agricultural Romanian soil than in the Tunisian soil, and copper presents the greatest risk of water resource pollution than cadmium, especially in the soil of Tunisia.
On the other hand, the retention mechanism of these two heavy metals is mainly related to the surface charge (electrostatic interaction) and the presence of phosphorus, sulfur, chloride and carbon in the soil (precipitation and complexation reaction).

Author Contributions

Conceptualization, M.A. and A.-D.C.; methodology, M.A. and S.D.-D.; software, S.D.-D.; validation, N.B.; formal analysis, M.A.; investigation, M.A.; resources, V.N. and E.M.; data curation, S.D.-D.; writing—original draft preparation, M.A. and A.-D.C.; writing—review and editing, M.A.; visualization, V.N.; supervision, S.D.-D. and A.-D.C. All authors have read and agreed to the published version of the manuscript.

Funding

This research received no external funding.

Institutional Review Board Statement

Not applicable.

Informed Consent Statement

Not applicable.

Data Availability Statement

Not applicable.

Conflicts of Interest

The authors declare no conflict of interest.

References

  1. World Health Organization. Preventing Disease through Healthy Environments: Exposure to Cadmium: A Major Public Health Concern; World Health Organization: Geneva, Switzerland, 2019. [Google Scholar]
  2. World Health Organization. Preventing Disease through Healthy Environments: Exposure to Lead: A Major Public Health Concern; World Health Organization: Geneva, Switzerland, 2019. [Google Scholar]
  3. Krajnc. Integrated criteria document, Cadmium—Effects, Appendix; National Institute of Public Health and Environmental Protection: Bilthoven, The Netherlands, 1987. [Google Scholar]
  4. Agarwal, S.K.; Tiwari, S.C.; Dash, S.C. Spectrum of poisoning requiring hemodialysis in a tertiarycare hospital in India. Int. J. Artif. Organs 1993, 16, 20–22. [Google Scholar] [CrossRef]
  5. Low, B.A.; Donohue, J.M.; Bartley, C.B. Backflow Prevention Failures and Copper Poisonings Associated with Post-Mix Soft Drink Dispensers; NSF International: Ann Arbor, MI, USA, 1996. [Google Scholar]
  6. Stenhammar, L. Diarrhoea following contamination of drinking water with copper. Eur. J. Med. Res. 1996, 4, 217–218. [Google Scholar]
  7. Cordos, E.; Roman, C.; Ponta, M.; Frentiu, T.; Rautiu, R. Evaluation of soil pollution with copper, lead, zinc and cadmium in the mining area Baia Mare. Rev. De Chim.-Buchar. 2007, 58, 470–474. [Google Scholar]
  8. Ulmanu, M.; Anger, I.; Gament, E.; Olanescu, G.; Predescu, C.; Sonaciu, M. Effect of a Romanian zeolite on heavy metals transfer from polluted soil to corn, mustard and oat. UPB Sci. Bull. B. 2006, 68, 67–78. [Google Scholar]
  9. Khelifi, F.; Melki, A.; Hamed, Y.; Adamo, P.; Caporale, A.G. Environmental and human health risk assessment of potentially toxic elements in soil, sediments, and ore-processing wastes from a mining area of southwestern Tunisia. Environ. Geochem. Health 2019, 42, 4125–4139. [Google Scholar] [CrossRef] [PubMed]
  10. Ghemari, C.; Waterlot, C.; Ayari, A.; Leclercq, J.; Douay, F.; Nasri-Ammar, K. Assessment of heavy metals in soil and terrestrial isopod Porcelliolaevis in Tunisian industrialized areas. Environ. Earth Sci. 2017, 76, 623. [Google Scholar] [CrossRef]
  11. Boussen, S.; Soubrand, M.; Bril, H.; Ouerfelli, K.; Abdeljaouad, S. Transfer of lead, zinc and cadmium from mine tailings to wheat (Triticumaestivum) in carbonated Mediterranean (Northern Tunisia) soils. Geoderma 2013, 192, 227–236. [Google Scholar] [CrossRef]
  12. Abdelwaheb, M.; Jebali, K.; Dhaouadi, H.; Dridi-Dhaouadi, S. Adsorption of nitrate, phosphate, nickel and lead on soils: Risk of groundwater contamination. Ecotoxicol. Environ. Saf. 2019, 179, 182–187. [Google Scholar] [CrossRef] [PubMed]
  13. Mingorance, M.D.; Barahona, E.; Fernández-Gálvez, J. Guidelines for improving organic carbon recovery by the wet oxidation method. Chemosphere 2007, 68, 409–413. [Google Scholar] [CrossRef]
  14. Henriksen, A.; Selmer-Olsen, A.R. Automatic methods for determining nitrate and nitrite in water and soil extracts. Analyst 1970, 95, 514–518. [Google Scholar] [CrossRef]
  15. Ye, Z.H.; Shu, W.S.; Zhang, Z.Q.; Lan, C.Y.; Wong, M.H. Evaluation of major constraints to revegetation of lead/zinc mine tailings using bioassay techniques. Chemosphere 2002, 47, 1103–1111. [Google Scholar] [CrossRef]
  16. Xing, R.; Yang, Z.; Zhou, Y.; Wang, S. Rapid determination of total sulfur content in green liquors by turbidimetric method. Bio Resour. 2020, 15, 721–728. [Google Scholar]
  17. Hajrasuliha, S.; Cassel, D.K.; Rezainejad, Y. Estimation of chloride ion concentration in saline soils from measurement of electrical conductivity of saturated soil extracts. Geoderma 1991, 49, 117–127. [Google Scholar] [CrossRef]
  18. Hachem, M.; Sharma, B.K.; El Naggar, A.; Pilankar, I.; Anwar, N. Systematic approaches for soil analysis in forensic investigation. In Proceedings of the 2020 Advances in Science and Engineering Technology International Conferences (ASET), Dubai, United Arab Emirates, 4 February–9 April 2020; pp. 1–5. [Google Scholar]
  19. Dhouibi, N.; Binous, H.; Dhaouadi, H.; Dridi-Dhaouadi, S. Hydrodistillation residues of Centaureanicaeensis plant for copper and zinc ions removal: Novel concepts for waste re-use. J. Clean. Prod. 2020, 261, 121106. [Google Scholar] [CrossRef]
  20. Abdelwaheb, M.; Ayeb, A.; Dhaouadi, H.; Dridi-Dhaouadi, S.; Peña, A. Risk of water contamination: Adsorption of dimethoate on a Mediterranean soil. Int. J. Environ. Stud. 2022, 1–20. [Google Scholar] [CrossRef]
  21. Tor, A.; Danaoglu, N.; Arslan, G.; Cengeloglu, Y. Removal of fluoride from water by using granular red mud: Batch and column studies. J. Hazard. Mater. 2009, 164, 271–278. [Google Scholar] [CrossRef] [PubMed]
  22. Hsini, N.; Abdelwaheb, M.; Dhaouadi, H.; Dridi-Dhaouadi, S. Valorization of solid wastes from Dittrichia essential oil extraction as biosorbents for cadmium removal: Biosorbent characterizations and isotherm modeling. Int. J. Environ. Sci. Technol. 2020, 17, 4611–4622. [Google Scholar] [CrossRef]
  23. Girish, C.R. Various isotherm models for multicomponent adsorption: A review. Int. J. Civ. Eng. Technol. 2017, 8, 80–86. [Google Scholar]
  24. Annabi, M.; Bahri, H.; Latiri, K. Statut Organique et Respiration Microbienne des sols du Nord de la Tunisie; Biotechnol. Agron. Soc. Environ. 2009, 13, 401–408. [Google Scholar]
  25. Cristian, P.; Radu, L.; Andrei, V.; Rovena, L.A. Organic carbon sequestration and nitrogen content in forest soils versus arable soils within a heavy-clay Phaeozem landscape: A Romanian case study. Arch. Agron. Soil Sci. 2020, 66, 2026–2038. [Google Scholar] [CrossRef]
  26. Alonge, T.A.; Ojo, O.I.; Adejumobi, M.A. Electrical conductivity based classification and mapping of salt affected soils in kampe-omi irrigation scheme. GSJ 2018, 6, 1075. [Google Scholar]
  27. Mechri, M.; Patil, S.B.; Saidi, W.; Hajri, R.; Jarrahi, T.; Gharbi, A.; Jedidi, N. Soil organic carbon and nitrogen status under fallow and cereal-legume species in a Tunisian semi-arid conditions. Eur. J. Earth Environ. 2016, 3, 1–13. [Google Scholar]
  28. Halmajan, H.V.; Nastase, D.; Vasile, G.; Paun, V.; Stoian, F.; Gidea, M. Fertilization practices in oilseed rape in Romania. Agriculture 2007, 63, 69–72. [Google Scholar]
  29. Rahardjo, H.; Aung, K.K.; Leong, E.C.; Rezaur, R.B. Characteristics of residual soils in Singapore as formed by weathering. Eng. Geol. 2004, 73, 157–169. [Google Scholar] [CrossRef]
  30. Giles, C.H.; Mac Ewan, T.H.; Nakhwa, S.N.; Smith, D. Studies in adsorption. Part XI. A system of classification of solution adsorption isotherms, and its use in diagnosis of adsorption mechanisms and in measurement of specific surface areas of solids. J. Chem. Soc. 1960, 3973–3993. [Google Scholar] [CrossRef]
  31. WHO. Copper in Drinking-Water, Background Document for Preparation of WHO Guidelines for Drinking-Water Quality: Geneva; World Health Organization: Geneva, Switzerland, 2003. [Google Scholar]
  32. WHO. Cadmium in Drinking-Water, Background Document for Preparation of WHO Guidelines for Drinking-Water Quality, Geneva; World Health Organization: Geneva, Switzerland, 2003. [Google Scholar]
  33. Eighmy, T.T.; Crannell, B.S.; Butler, L.G.; Cartledge, F.K.; Emery, E.F.; Oblas, D.; Francis, C.A. Heavy metal stabilization in municipal solid waste combustion dry scrubber residue using soluble phosphate. Environ. Sci. Technol. 1997, 31, 3330–3338. [Google Scholar] [CrossRef]
  34. Liu, R.; Zhao, D. In situ immobilization of Cu (II) in soils using a new class of iron phosphate nanoparticles. Chemosphere 2007, 68, 1867–1876. [Google Scholar] [CrossRef]
  35. Lee, H.H.; Owens, V.N.; Park, S.; Kim, J.; Hong, C.O. Adsorption and precipitation of cadmium affected by chemical form and addition rate of phosphate in soils having different levels of cadmium. Chemosphere 2018, 206, 369–375. [Google Scholar] [CrossRef]
  36. Yong, R.N.; Sheremata, T.W. Effect of chloride ions on adsorption of cadmium from a landfill leachate. Can. Geotech. J. 1991, 28, 378–387. [Google Scholar] [CrossRef]
  37. Fulda, B.; Voegelin, A.; Ehlert, K.; Kretzschmar, R. Redox transformation, solid phase speciation and solution dynamics of copper during soil reduction and reoxidation as affected by sulfate availability. Geochim. Cosmochim. 2013, 123, 385–402. [Google Scholar] [CrossRef]
  38. Ruangcharus, C.; Kim, S.U.; Hong, C.O. Mechanism of cadmium immobilization in phosphate-amended arable soils. Appl. Biol. Chem. 2020, 63, 36. [Google Scholar] [CrossRef]
  39. Christensen, J.B.; Jensen, D.L.; Christensen, T.H. Effect of dissolved organic carbon on the mobility of cadmium, nickel and zinc in leachate polluted groundwater. Water Res. 1996, 30, 3037–3049. [Google Scholar] [CrossRef]
  40. Pommery, J.; Ebenga, J.P.; Imbenotte, M.; Palavit, G.; Erb, F. Etude de la complexation du cadmium par un acide humique de reference. WaterResearch 1988, 22, 185–189. [Google Scholar] [CrossRef]
  41. Zaring, D. Agriculture, nonpoint source pollution, and regulatory control: The clean water act’s bleak present and future. Harv. Envtl. L. Rev. 1996, 20, 515. [Google Scholar]
  42. Brady, B.; Pagenkopf, G.K. Cadmium complexation by soil fulvic acid. Can. J. Chem. 1978, 56, 2331–2336. [Google Scholar] [CrossRef]
  43. Parat, C.; Chaussod, R.; Lévêque, J.; Dousset, S.; Andreux, F. The relationship between copper accumulated in vineyard calcareous soils and soil organic matter and iron. Eur. J. Soil Sci. 2002, 53, 663–670. [Google Scholar] [CrossRef]
  44. Ruellan, A.; Delétang, J. Les Phénomènes D’échange de Cations et D’anions dans les Sols; Office de la recherche scientifique et technique outre-mer: Paris, France, 1967. [Google Scholar]
Figure 1. SEM image for Romanian and Tunisian soils: (a) resolution 100 μm; (a′) resolution 200 μm; (b) and (b′) resolution 50 μm; (c) and (c′) resolution 20 μm.
Processes 10 01802 g001aProcesses 10 01802 g001b
Figure 2. Elemental analysis of Tunisian soil before adsorption process.
Processes 10 01802 g002
Figure 3. Cadmium and copper adsorption kinetics in Romanian and Tunisian soils (T = 22 °C, 260 rpm, m/V = 0.1 g·mL−1, pH = 7.0–7.5).
Processes 10 01802 g003
Figure 4. Cadmium and copper adsorption isotherms in Romanian and Tunisian soils (T = 22 °C, 260 rpm, m/V = 0.1 g·mL−1, pH = 7.0–7.5).
Processes 10 01802 g004
Figure 5. Elemental analysis of Romanian and Tunisian soils after the adsorption process.
Processes 10 01802 g005
Figure 6. Copper and cadmium in Tunisian and Romanian soils ([Cu2+] ≈ [Cd2+] ≈ 0.1 mmol·L−1): (a) adsorption percentage; (b) capacity.
Processes 10 01802 g006
Figure 7. Spatial distribution of copper and cadmium in a different region: (a) Romanian soil after the adsorption process; (b) Romanian soil before the adsorption process; (c) Tunisian soil after the adsorption process; (d) Tunisian soil after the adsorption process; (e) Tunisian soil before the adsorption process.
Processes 10 01802 g007
Table 1. Main properties of Tunisian and Romanian soils.
ParameterTunisian SoilRomanian Soil
Sand (%) 46.6756
Silt (%) 3.338
Clay (%) 5036
Organic carbon (%) 2.722.67
Cationic exchange capacity (CEC) (mmol/100 g) 36.8913.33
pH 8.156.6
pHpzc7.956.84
EC (µS · cm−1) 384.1220.12
[P] (ppm) 375100.89
[S] (ppm) 256.76
[NO3] (ppm) 203.42
[NO2] (ppm) 0.50.5
[Cl] (ppm) 3216
Table 2. Main properties of Tunisian and Romanian soils.
Kinetic Model Parameter (Units)Romanian SoilTunisian Soil
Cadmium CopperCadmium Copper
Experimental qe (µg/g)98.7696.5897.5784.90
Pseudo first orderqe (µg/g)9996.0998.8281.98
k10.0290.020.0290.026
R20.940.930.960.92
Pseudo second orderqe (µg/g)108.66108.82108.4291.63
k20.000360.00020.000360.00035
R20.900.90.920.89
Intraparticle diffusionki3.894.233.883.46
Ci31.2421.0731.0421.76
R20.640.710.650.69
Table 3. Fitting of the unary isotherm parameters of cadmium and copper adsorption in Tunisian and Romanian soils.
Isotherm Model Parameter (Units)Romanian SoilTunisian Soil
Cadmium CopperCadmium Copper
Experimentalqeexp (µg/g)545.9786.5553.7775.4
Langmuirqmax (µg/g)524.6111,082618.6523,793
KL (L·μg-1)0.00155.4 × 10−60.000911.13 × 10−5
R20.960.880.960.58
Freundlich1/nF0.311.120.311.5
KF (m·L1/nF·µg1−1/nF·g−1)26.760.2528.430.0062
R20.930.90.780.78
Redlich–PetersonKRP1.080.590.440.28
aRP0.0060.0010.00010.0016
bRP0.880.0311.160.001
R20.980.880.980.63
Table 4. Fitting of the binary isotherm parameters of cadmium and copper adsorption in Tunisian and Romanian soils.
Isotherm Model Parameter (Units)Romanian SoilTunisian Soil
Cadmium CopperCadmium Copper
Experimental qeexp (µg/g)545.9786.5553.7775.4
Modified competitive Langmuir qmax (µg/g)524.62590553.7775
KL1 (L·μg−1)0.00180.00150.00241.41
KL2 (L·μg−1)5.4 × 10−61.14 × 10−51.1 × 10−71.2 × 10−5
n132.510.000151.1 × 10−5112,042
n22,844,2532.22,844,2532,844,253
R20.70.450.60.16
Modified competitive Freundlichx13.822.723.771.15
x23.223.443.170.0001
z110−710−710−710−7
Kf126.770.2528.430.006
n11.100.541.12.73
y210–810–810–810–8
R20.920.900.780.78
Modified competitive Redlich–PetersonKRP1153.467.40.001771.57
n10.150.150.004224.9
n20.010.011.1 × 10−59.8 × 10⁻⁶
aRP11.0777.392 × 10−69.3 × 10⁻⁷
aRP2932.77772.110.00160.13
bRP10.890.0011.1610,883
bRP20.00019.9 × 10−50.0010.0001
R20.980.880.980.86
Publisher’s Note: MDPI stays neutral with regard to jurisdictional claims in published maps and institutional affiliations.

