Article

Experimental Study on Particle-Based Temporary Plugging Material Selection and Diversion Law of Shale Gas Reservoirs in WY Area, Sichuan, China

1
Cooperative Innovation Center of Unconventional Oil and Gas, Yangtze University, Wuhan 430100, China
2
School of Petroleum Engineering, Yangtze University, Wuhan 430100, China
3
Hubei Key Laboratory of Drilling and Production Engineering for Oil and Gas, Yangtze University, Wuhan 430100, China
4
Bo-Xing Division of CNPC Offshore Engineering Company Limited, Tianjin 300451, China
*
Authors to whom correspondence should be addressed.
Processes 2022, 10(9), 1720; https://doi.org/10.3390/pr10091720
Submission received: 29 June 2022 / Revised: 20 August 2022 / Accepted: 24 August 2022 / Published: 29 August 2022
(This article belongs to the Section Energy Systems)

Abstract

:
A temporary plugging agent is an effective tool for increasing production in old wells. By considering the temporary plugging materials used in the remote WY area, three concentrations and five ratios under different fracture widths were designed and optimized. Thus, the fracture diversion under true triaxial stress was studied. The results showed that when the fracture widths were 2.0, 4.0, and 6.0 mm, the corresponding optimal plugging scheme was that the concentrations of the temporary plugging agent were 12.0, 18.0, and 18.0 kg/m3 and the ratios of 20–70 mesh to 200–300 mesh temporary plugging agent were 4:1, 2:1 and 4:1, respectively. When maintaining the same horizontal stress, an increase in the axial stress was accompanied by an increase in the fracture pressure; the initial fractures almost propagated along the direction of the horizontal maximum principal stress, but the shapes of the turning fractures were different. When the axial stress was the same, an increase in the horizontal stress difference was accompanied by a decrease in the corresponding fracture pressure and a gradual decrease in the degree of fracture turning. This study provides a basis for numerical simulation and field application of temporary plugging fracturing at fracture ends.

1. Introduction

Advances in science and technology have increased the energy-supply proportion of unconventional oil and gas resources, such as shale oil and gas. Moreover, hydraulic fracturing technology has become an indispensable method for developing such resources [1,2,3]. However, during conventional hydraulic fracturing, hydraulic fractures tend to be initiated and propagate along the direction of low resistance, resulting in insufficient overall utilization of the target layer. By pumping a degradable temporary plugging agent, engineers use the temporary plugging fracturing technology to plug pre-pressure fractures, change the flow direction, open new fractures in the unreformed interval, and significantly improve the overall transformation effect [4,5].
Key determinants of the effectiveness of the temporary plugging agent are its particle size, applied concentration, dosage, carrying liquid properties, and pump injection parameters. Various experimental methods have been explored in studying the plugging law of the temporary plugging agent. At present, the single-particle and multi-particle bridging models have been proposed to study the influence of particle size and shape on the temporary plugging effect [6,7]. In order to optimize the particle size distribution, Carpenter et al. designed a water injector connected to a rectangular groove with a specific opening and installed a filter at the end of the groove to simulate the clogging experiment. Xue et al. used foam horizontal steel plate to simulate hydraulic fractures and studied the effects of plugging agent dosage, particle size, adding speed, and adding method on plugging capacity [8,9]. The physical model test of true triaxial hydraulic fracturing is an important means to study the propagation and steering law of hydraulic fractures [10,11]. Fiber, granular and layered materials, particles and proppant mixture, and other materials have been used to simulate temporary plugging steering. Experiments show that it can effectively block the old cracks and turn to open new cracks [12,13,14,15,16,17]. Zhou et al., Liu et al., and Zhang et al. used a true triaxial hydraulic fracturing system to study the influence of natural fracture network on hydraulic fracture propagation, mechanical properties, and permeability mechanism of carbonate reservoir, which provided basic data and theoretical support for shale gas exploration and development in China [18,19,20].
In view of the differences in the optimal values of the concentration and ratio of temporary plugging materials in different shale blocks, as well as the inter-well interference caused by rolling development in the WY area, it is necessary to combine the temporary plugging steering technology in the field to improve the temporary plugging steering to reduce the pressure channeling effect under different working conditions by optimizing the temporary plugging parameters at the fracture end. In this paper, based on the indoor simulation of 3D fracture temporary plugging steering fracturing and temporary plugging belt formation device, the optimal ratio and concentration of temporary plugging agents suitable for different fracture widths are carried out. Combined with the field outcrop simulation, the fracture initiation law and steering after temporary plugging at the fracture end are studied, so as to provide theoretical support and technical guidance for shale gas wells in the WY area to achieve efficient temporary plugging steering fracturing.

2. Materials and Methods

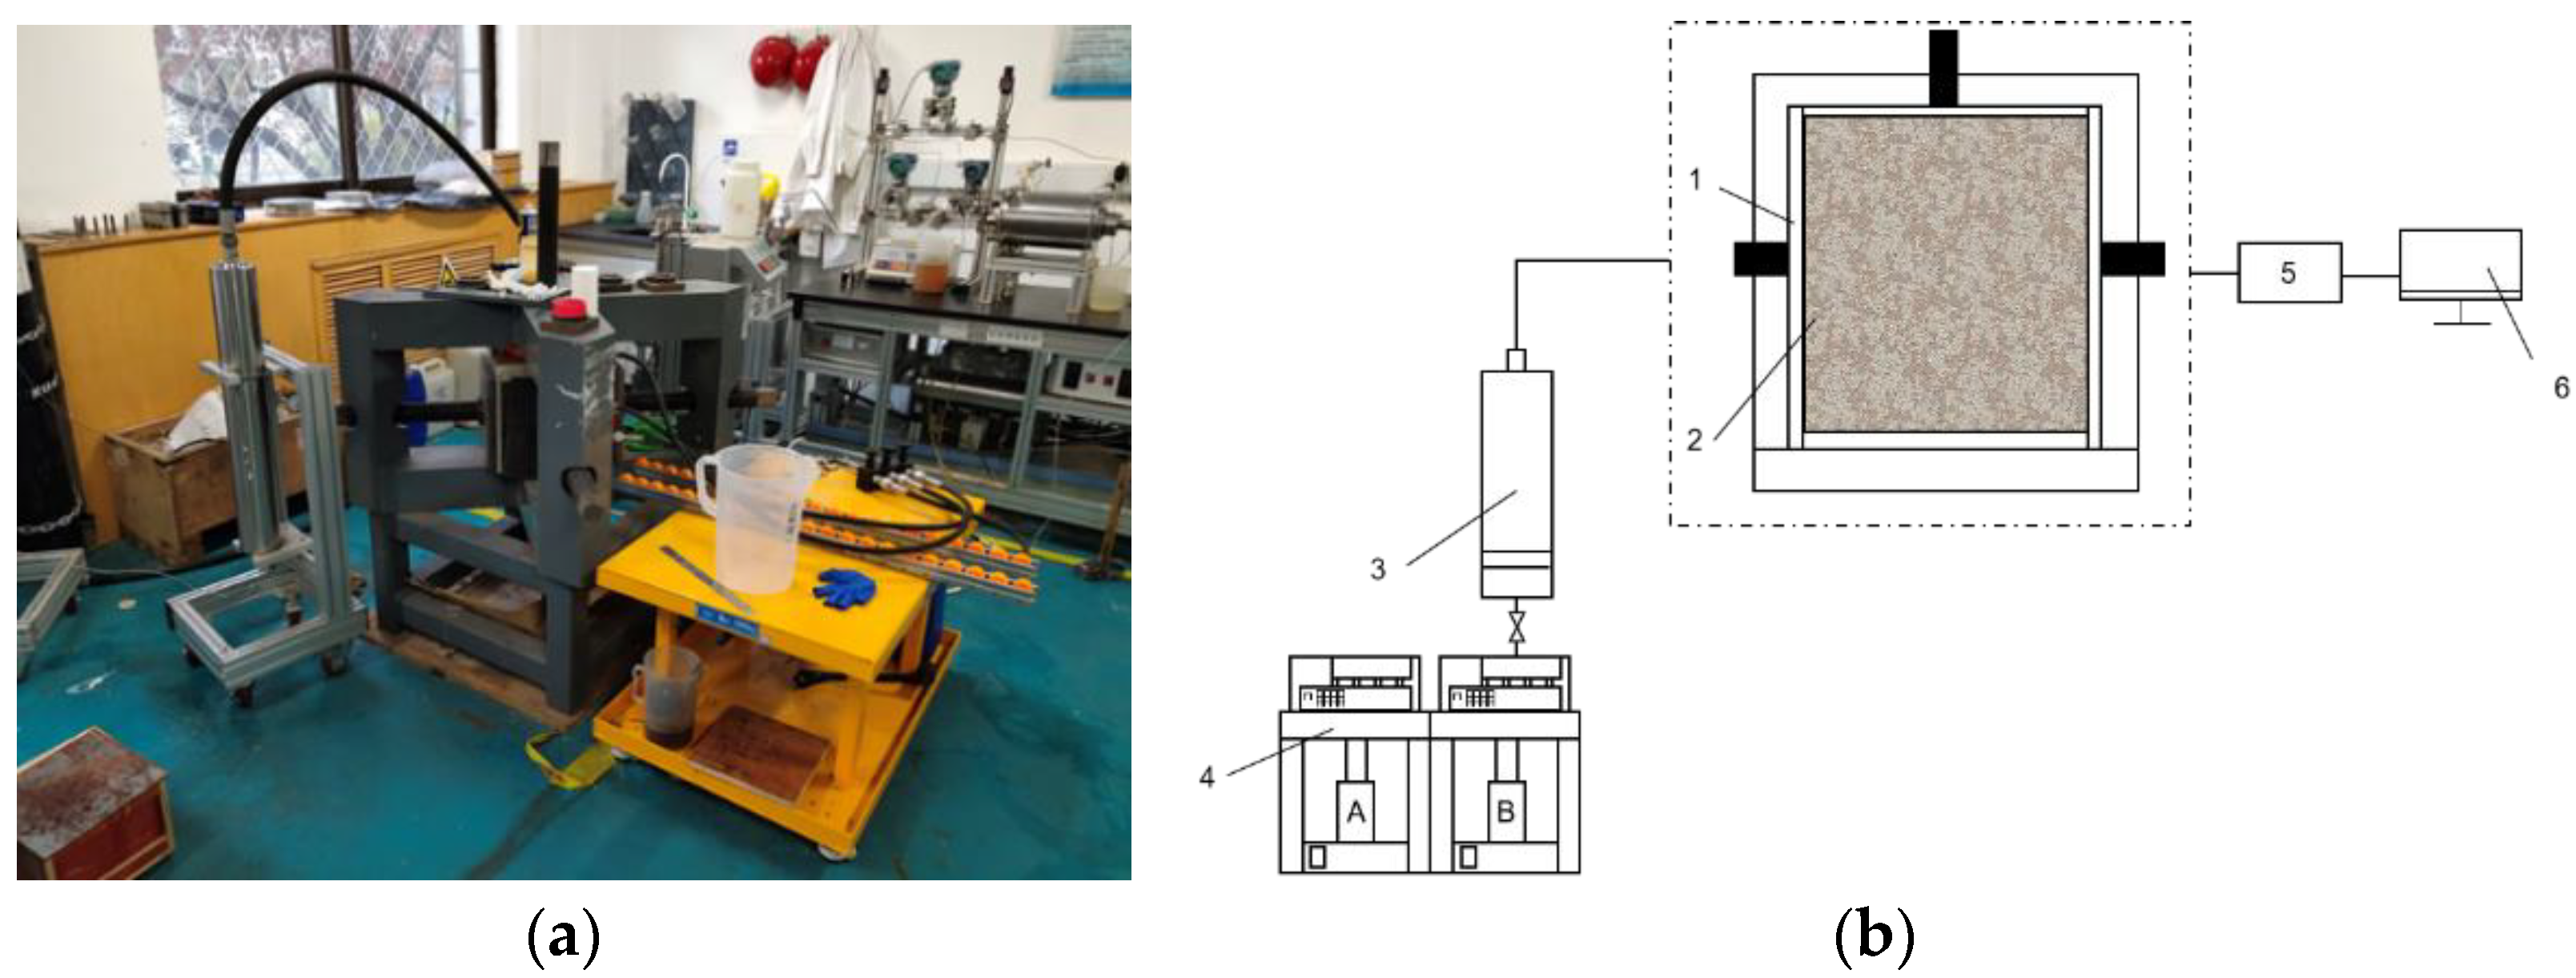
2.1. Experimental Material and Equipment

The samples used in the experiment were taken from the WY area in the southern Sichuan Basin, China. The samples included temporary plugging agents with different mesh sizes (including 20–70 and 200–300 mesh powders), variable viscosity sliding water and natural shale outcrop rock samples (300.0 mm × 300.0 mm × 300.0 mm).
3D-printed slabs simulating real cracks are shown in Figure 1. Figure 2 shows the experimental device for simulating the temporary plugging of fractures. The real fractured rock slab of the reservoir was split, and the simulated rock slab was prepared using 3D-printing technology to achieve the effect of repeated use. Different fracture widths under the same fracture morphology were simulated, and the plugging effects of different ratios of the temporary plugging agents were tested. The parameters were optimized, including the ratio of the temporary plugging materials and use concentration, were optimized.
The system is mainly comprised of a confining pressure pump, displacement pump, intermediate container, diversion chamber, press, balance, and computer. A 3D-printed fracture simulation was installed in the diversion chamber. The diversion chamber was put into a press, and the surrounding pressure was applied above and below the diversion chamber. Temporary plugging was displaced into a simulated crack in the diversion chamber using a double pump (ISCO), and the real-time pressure and outflow were automatically collected by the computer through data acquisition software.
The optimized parameters obtained from the previous experiment are applied to this part. Figure 3 shows the large-scale true triaxial simulation system. The fracture initiation rule after temporary plugging was studied by simulation, providing reference data for the numerical simulation study of the temporary plugging at the fracture end.
The system comprised a sample holding chamber, a confining pressure loading system, a pumping system, and a data acquisition and processing system. When the rock sample size was 300.0 mm × 300.0 mm × 300.0 mm, the maximum 3D stress can be loaded to 50.0 MPa, and the maximum pump pressure can reach 70.0 MPa. During the experiment, the ISCO pump was used to pump distilled water into the lower end of the intermediate vessel; subsequently, the piston was pushed to squeeze the fracturing fluid from the high-pressure pipeline into the rock sample. The wellhead connector comprised three parts: a short steel pipe with a rubber ring, a square steel plate with a side length of 300.0 mm, and a long steel pipe with a threaded joint. During the experiment, the short steel pipe was inserted directly into the wellbore for an absolute sealing of the wellbore and pipeline through a metallic contact and a rubber ring. A square steel plate was used to apply stress to the rock along the wellbore while avoiding the ejection of the short steel pipe from the wellbore by the high-pressure fluid. The long steel pipe was extended from the middle hole of the circular cover plate and connected to a high-pressure rubber pipeline to ensure the integrity of the liquid supply system.

2.2. Experimental Setup and Procedure

2.2.1. Fracture Temporary Plugging Experiment

Successful plugging of fractures is closely related to the fracture width, concentration, particle size ratio of the temporary plugging agent, and distribution in fractures. Considering the large pumping speed of temporary plugging fracturing fluid during actual field construction, the flow rate in the experiment was set as the maximum flow rate allowed by the constant speed and constant pressure pump of 60.0 mL/min. According to the use of granular temporary plugging agent in the WY area, five temporary plugging agent ratios (20–70 mesh:200–300 mesh = 1:1, 1:2, 1:4, 2:1, and 4:1) were used to conduct temporary plugging chamber experiments on fractures with different fracture widths (2.0 mm, 4.0 mm, 6.0 mm) at different concentrations (12.0, 18.0, and 24.0 kg/m3). Further, the temporary plugging effect was evaluated, and the concentration and ratio of the temporary plugging agent under different fracture widths were optimized. When the injection pressure reached the fracture turning pressure of approximately 20.0 MPa, the experiment was terminated. As shown in Table 1 below:
The specific experimental steps are as follows:
First, the temporary plugging fluid was configured, and a crack slate was installed to adjust the fracture width. The diversion chamber was placed in the press while confining pressure was applied on both sides. Subsequently, the temporary plugging liquid was poured into the intermediate container, the pipeline equipment was connected, the liquid injection pump was turned on, and the liquid volume was recorded. The computer was used to record the fracturing pressure and fluid output in real time. When the pressure reached the turning pressure, it was maintained for 5 min. Finally, the pressure was relieved, the rock plate was disassembled, and the crack plugging effect was recorded.

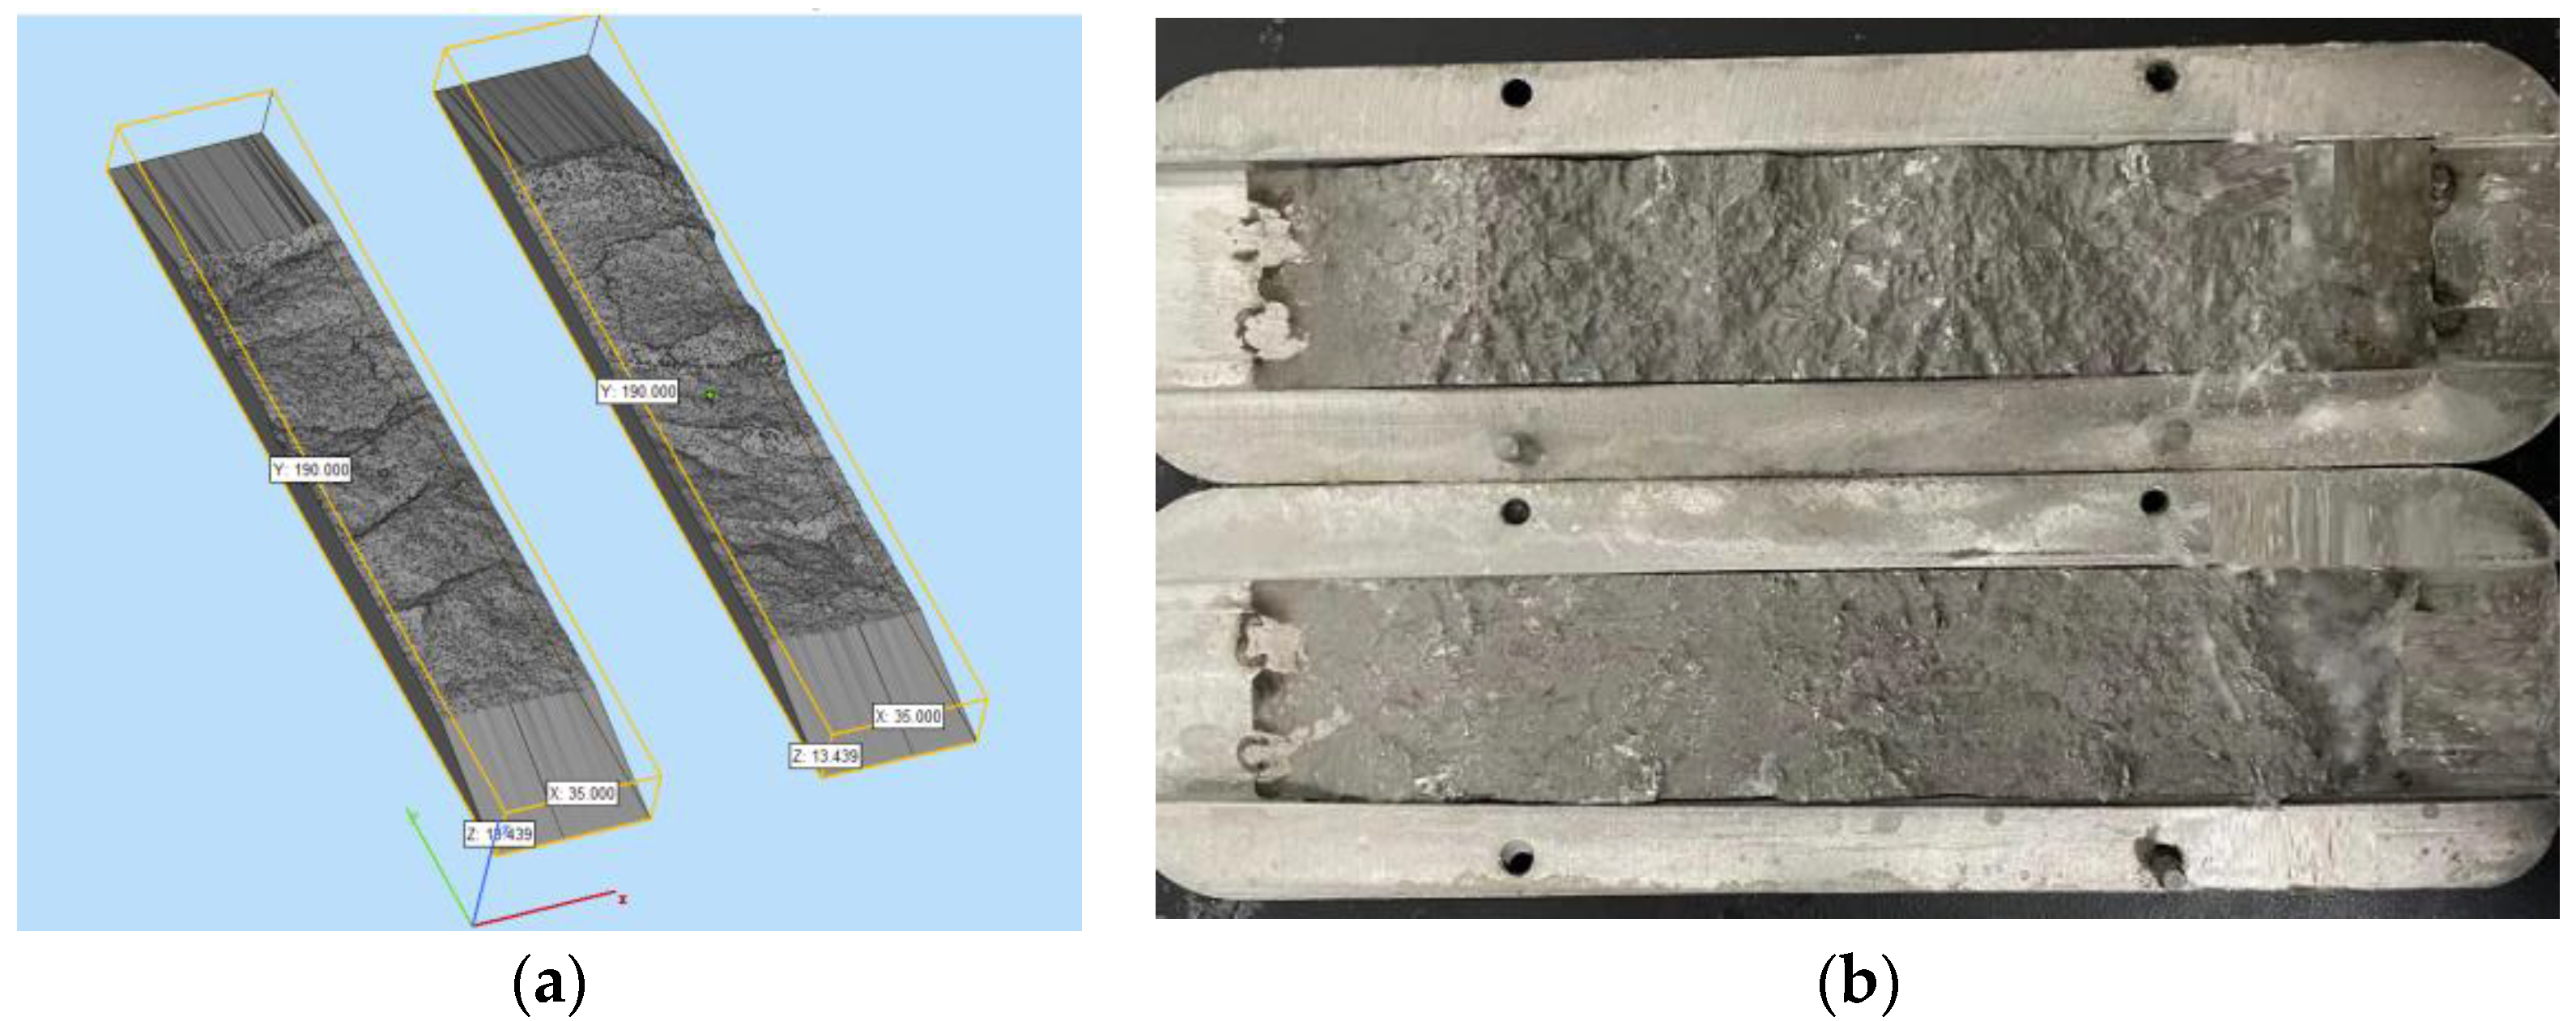
2.2.2. Temporary Plugging Diversion Test of True Triaxial Large Scale Model

The entire hydraulic fracturing process can be simulated by a natural outcrop rock sample and pumping fracturing fluid after applying a confining pressure: The fracturing fluid flows into the wellbore from the pipeline, the fracture is opened by holding the pressure at the wellbore, and then the fluid flows into the fracture. The fracture extends forward, and the pressure drops after the pump is stopped.
The specific experimental steps are as follows:
As illustrated in Figure 4 [21,22], the natural outcrop is drilled and well cemented. The fracturing fluid is prepared and added in the optimal concentration and ratio. Then the direction of in-situ stress is indicated while the natural fracture is replicated in the true triaxial fracturing simulation system. For the first fracturing, a low-viscosity fracturing fluid is used for the simulation at a flow rate of 20.0 mL/min, and tracer marks are used to record the pressure changes during the experiment. The rock sample is then placed down, and the cracks formed after the first fracturing are observed and photographed. Subsequently, the rock sample is reinstalled while the same triaxial stress as the first time is applied. Fracturing fluid containing a temporary plugging agent is then injected into the sample at a constant displacement, simulating secondary fracturing. The pressure change during the experiment is recorded, the rock sample is placed down, and the cracks formed after the second fracturing are observed and photographed.
Based on the fracturing design in the WY area, the ground stress is σH > σv > σh; the horizontal stress difference is between 15.1 MPa and 16.5 MPa, with an average of 15.9 MPa; the horizontal stress difference of the adjacent wells is between 12.1 MPa and 17.3 MPa, with an average of 14.7 MPa, slightly higher than that of the adjacent wells. During the experiment, different ground stresses are applied to the three sides of the rock sample to simulate the rock sample in five different stress states. The corresponding stress values of the five experiments are shown in Table 2. This paper mainly takes experiments (1) and (2) as examples.

3. Results and Discussions

3.1. Fracture Temporary Plugging Experiment

The temporary plugging experiment was conducted using 3D-printed fractures with the same tortuosity. The temporary plugging behavior of the sliding water system was explored by varying the fracture width, the concentration ratio of the temporary plugging materials, and the concentration of temporary plugging material. For different fracture widths, the best scheme was selected using a classification method of the same ratio and different concentrations as well as one of the different ratios and the same concentration.

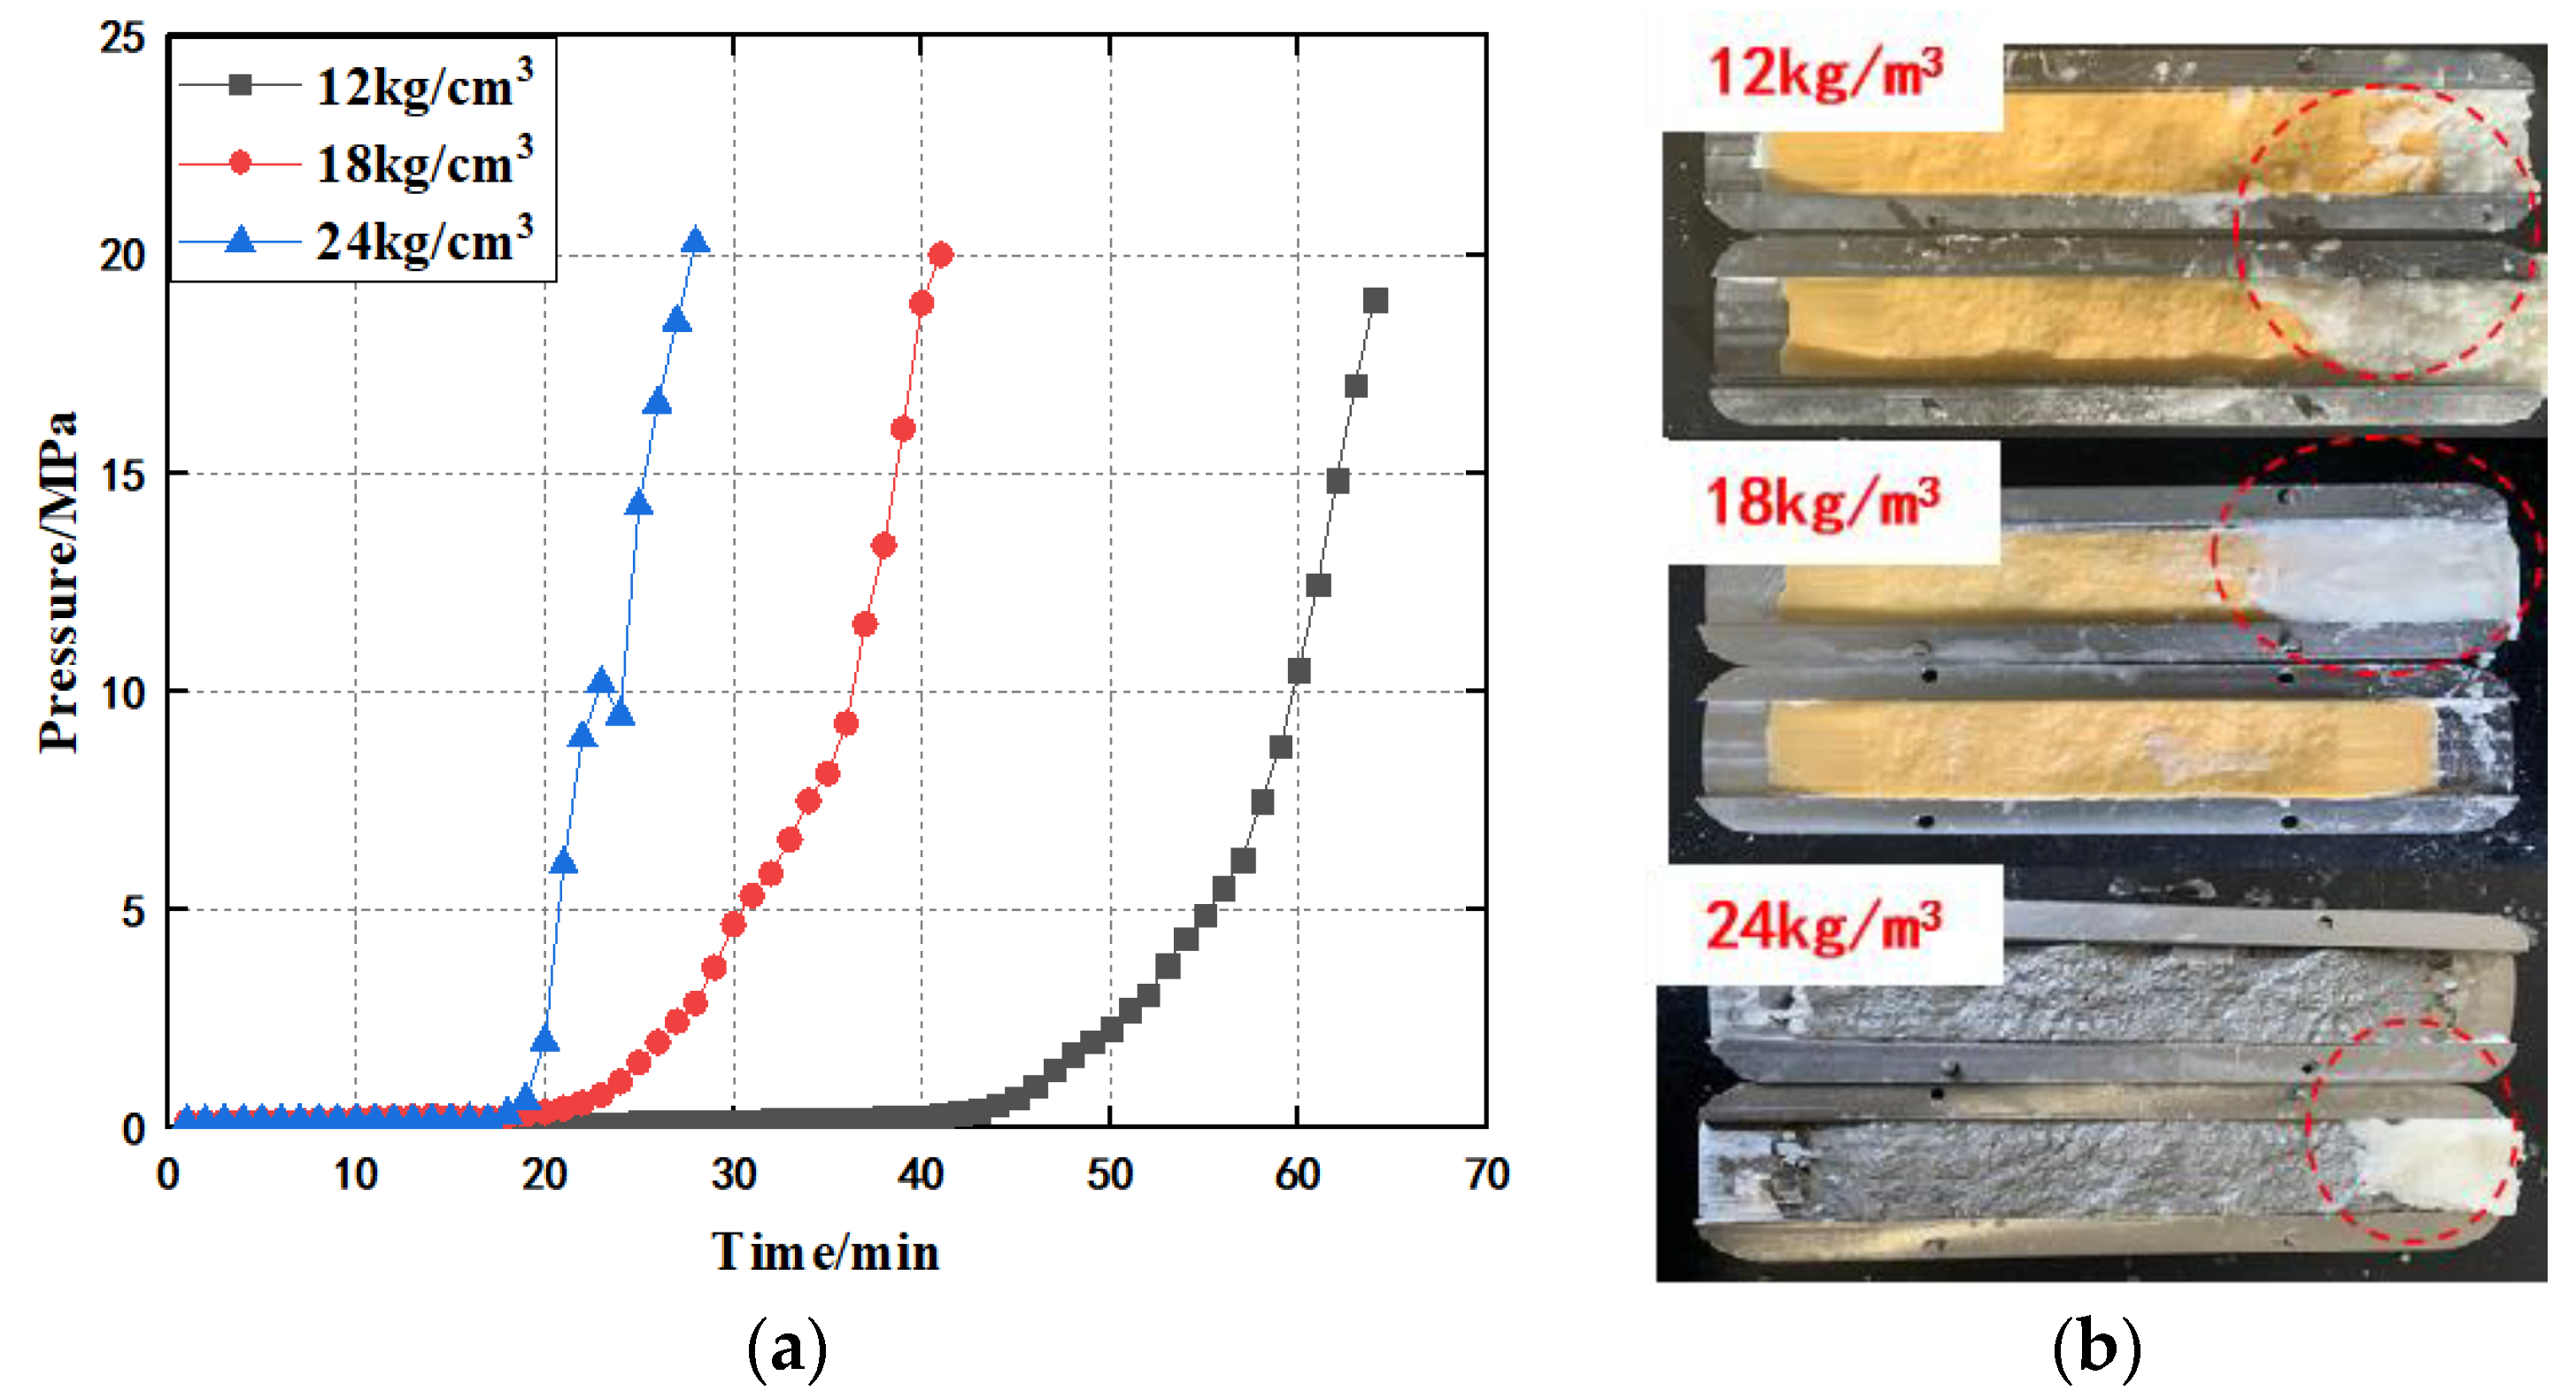
3.1.1. Same Ratio and Different Concentration

Experimental conditions of a fixed ratio and different concentrations were considered in studying and analyzing the temporary plugging of different fracture widths. Figure 5, Figure 6, Figure 7, Figure 8, Figure 9 and Figure 10 show that as the fracture width increased, the low-concentration temporary plugging agent failed to meet the temporary plugging requirements.
Figure 5a,b respectively show the pressure curve and the aggregation forms of the temporary plugging agent with the fracture width of 2.0 mm; the ratio of 20–70 mesh:200–300 mesh = 1:1; and the concentrations of 12.0, 18.0, and 24.0 kg/m3. As the concentration increased, denser aggregates formed after plugging (inside the red dotted-line circle in the figure) resulting in higher concentrations and shorter times for plugging effect realization. Considering the comprehensive cost, when effective plugging is formed, the fracturing fluid with a low temporary plugging agent concentration of 12.0 kg/cm3 can be selected for the temporary plugging at the fracture end in 2 mm fracture width plugging.
For the fracture width of 4 mm, all schemes with a concentration of 12.0 kg/m3 cannot achieve the plugging effect. Figure 6a,b respectively show the pressure curve and the aggregation form of the temporary plugging agent with a ratio of 20–70:200–300 mesh = 2:1 and concentrations of 18.0 kg/m3 and 24.0 kg/m3. Although the effect of 24.0 kg/m3 is better than that of 18 kg/m3., the curve growth trends are similar while the maximum pressures only differ slightly. In terms of the comprehensive cost, when effective plugging is achieved, the fracturing fluid with a medium temporary plugging agent concentration of 18 kg/m3 can be selected for the temporary plugging at the fracture end in 4 mm fracture width plugging.
For the fracture width of 6 mm, a low concentration of 12.0 kg/m3 did not achieve the same effect as that of the fracture width of 4 mm. Figure 7a,b shows the pressure curve and the aggregation forms of the temporary plugging agent with a ratio of 20–70:200–300 mesh = 4:1 and concentrations of 18.0 kg/m3 and 24.0 kg/m3, respectively. Considering the cost problem, when effective plugging is achieved, the fracturing fluid with a medium temporary plugging agent concentration of 18.0 kg/m3 can be selected for on-site construction of temporary plugging at the fracture end when the fracture width is 6.0 mm.

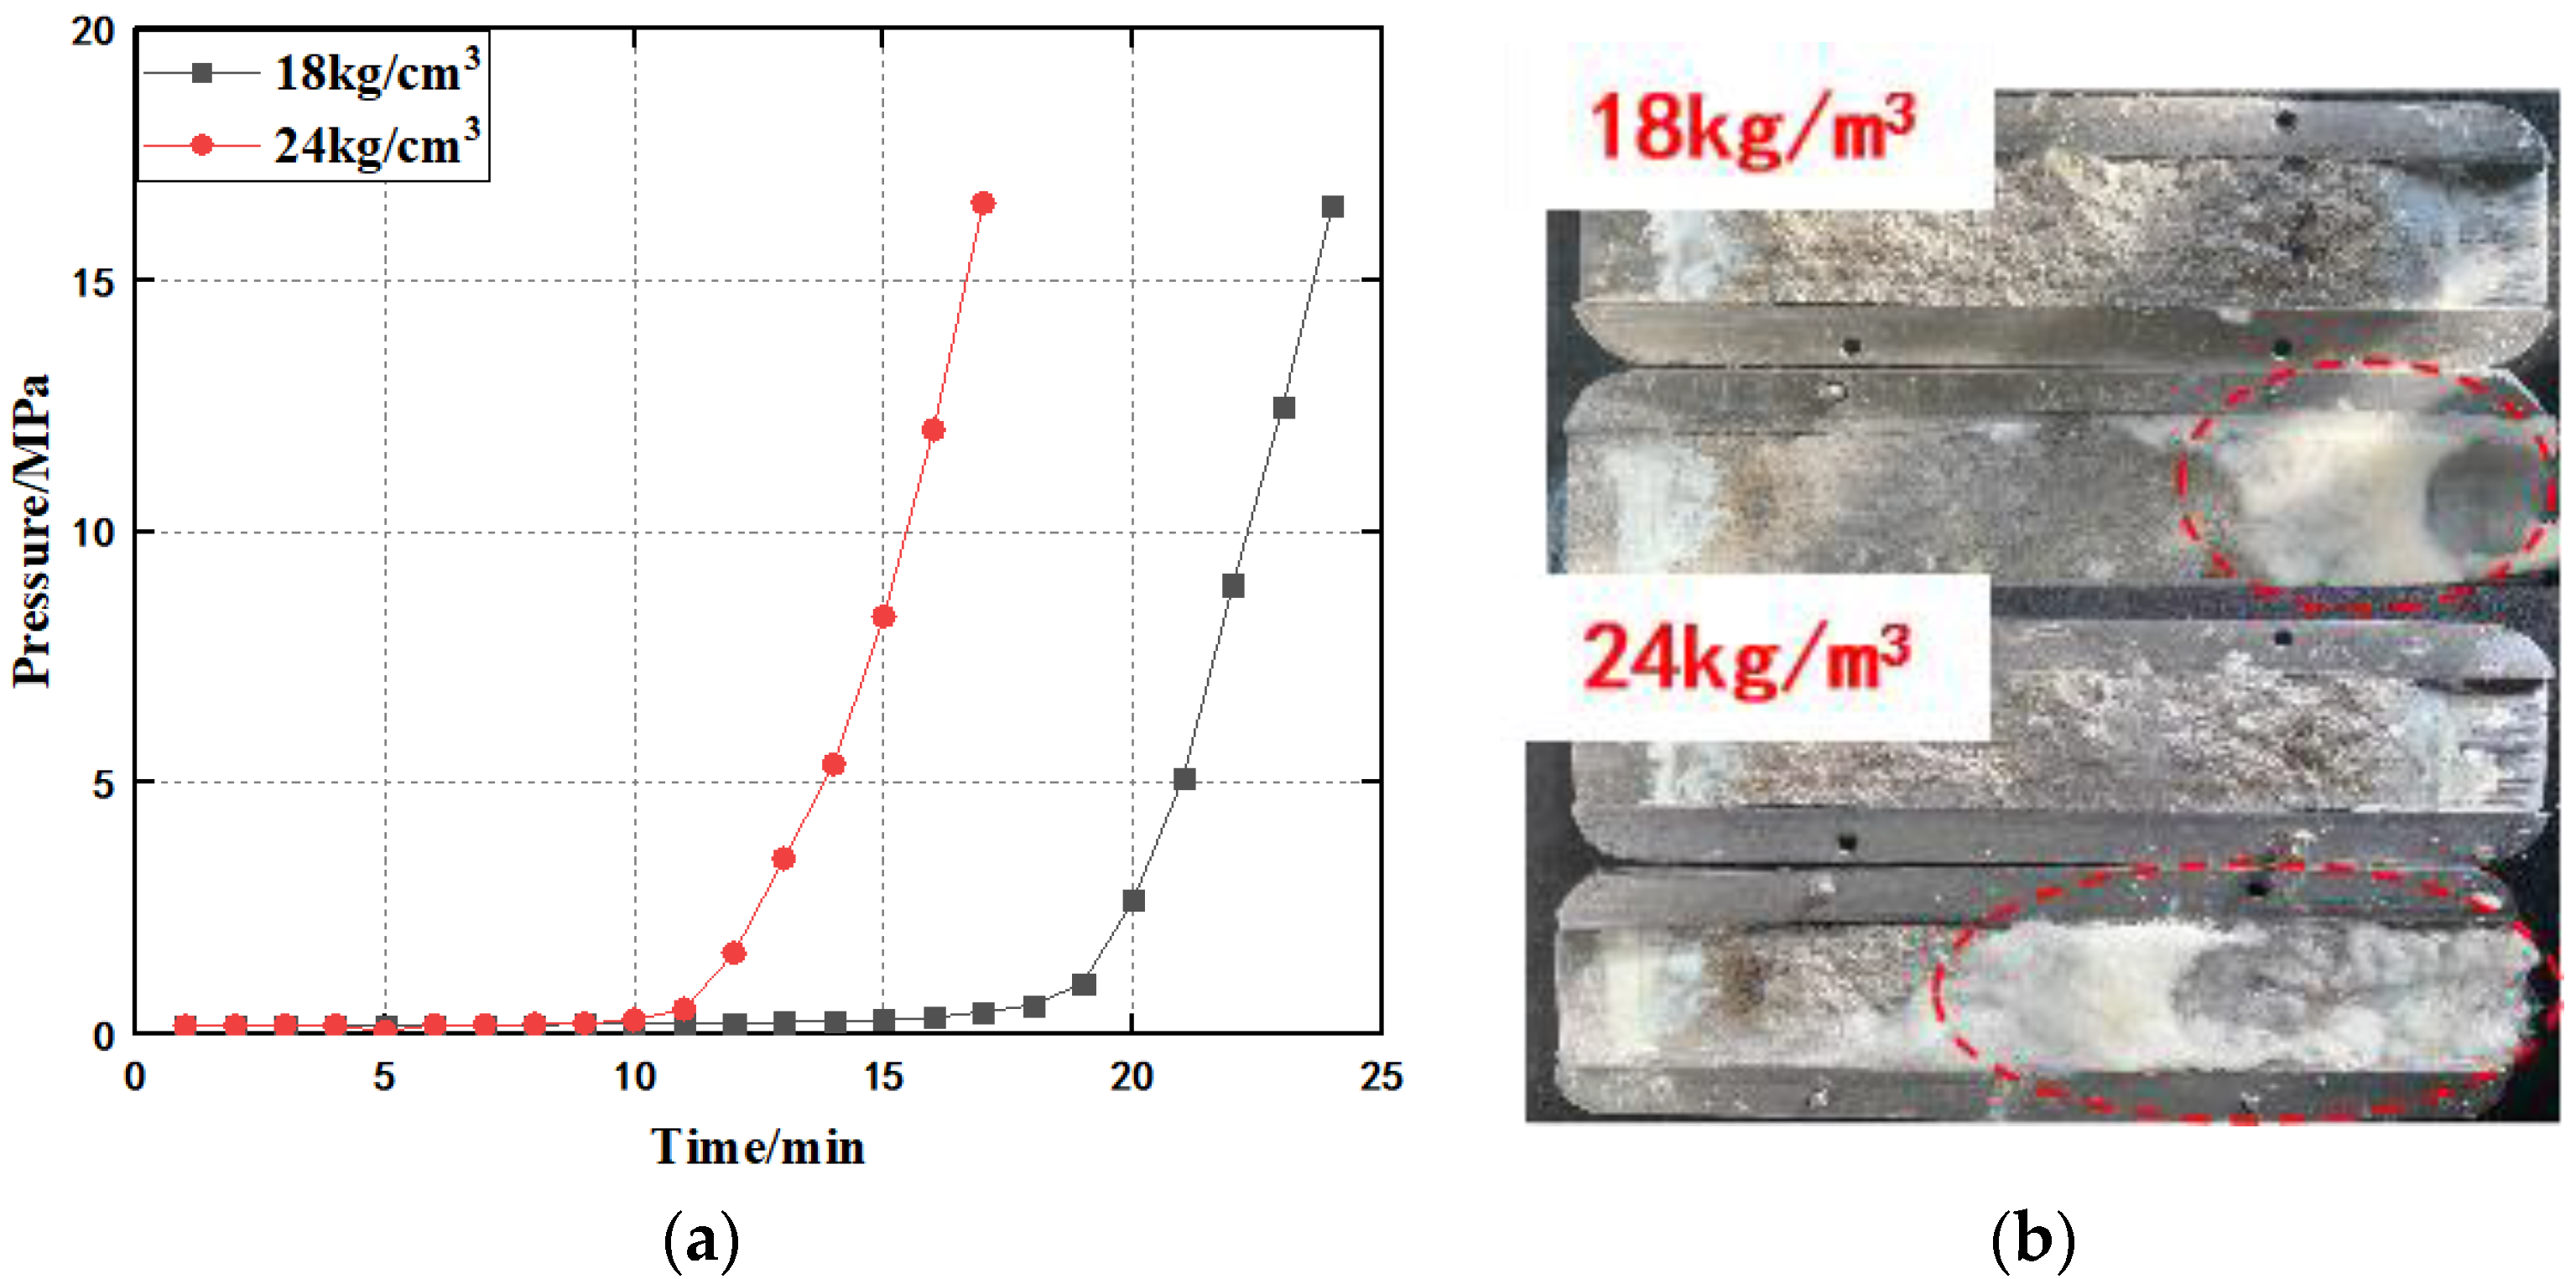
3.1.2. Different Proportions, Same Concentration

As described in Section 3.1.1, the optimal concentration of the corresponding fracture width was obtained, and the temporary plugging experiment of different fracture widths was performed using the experimental conditions of different ratios but the same concentration. It was found that as the proportion increased, the low-proportion temporary plugging agent could not meet the temporary plugging requirements. The aggregation morphology distribution with the proportions of 1:1, 2:1, and 4:1 was thoroughly examined, as shown in Figure 8, Figure 9, Figure 10 and Figure 11.
  • 2.0 mm fracture width
Figure 11 and Figure 12 respectively show the pressure curve and aggregation form of the temporary plugging agent with a concentration of 12 kg/m3 and ratios of 20–70:200–300 mesh = 1:4, 1:2, 1:1, 2:1, and 4:1. When the concentration of temporary plugging agent was 12 kg/m3, an increase in the temporary plugging agent with a low mesh of 20–70 corresponded to a shorter effective plugging formation time. The temporary plugging cake was smaller and denser, indicating that a high-mesh temporary plugging agent filling the gap between a low-mesh temporary plugging agent is more likely to create a plugging effect. Although the ratio of 2:1 was faster than that of 4:1, the bearing capacity was not as good. Considering the experimental results of the temporary plugging agents with the same ratio and different concentrations, we recommend a temporary plugging fracturing fluid system with a low concentration and low mesh number (concentration, 12 kg/m3, ratio, 4:1) for the temporary plugging construction of the 2 mm fracture end.
  • 4.0 mm fracture width
Comparison of temporary plugging agent concentration 18.0 kg/m3, 20–70:200–300 mesh = 1:4, 1:2, 1:1, 2:1, and 4:1 pressure curve (Figure 9a) and temporary plugging agent aggregation morphology (Figure 9b). Similar to the 2.0-mm fracture width results, the high-mesh temporary plugging agent filled the void in the low-mesh crack. In further consideration of the experimental results of the same ratio and different concentrations of the temporary plugging agent, we recommend the medium-concentration (18.0 kg/m3) and low-mesh (ratio 2:1) temporary plugging agent for a temporary plugging fracturing fluid system in the 4.0 mm fracture end.
  • 6.0 mm fracture width
Figure 10a,b respectively show pressure curves and aggregation patterns of the temporary plugging agent with a concentration of 18.0 kg/m3, ratios of 20–70:200–300 mesh = 1:1, 2:1, 4:1. The lower the mesh of the temporary plugging agent was, the shorter the formation time of effective plugging was, the smaller and denser the temporary plugging aggregation was, and the easier the plugging effect formation was. In further consideration of the experimental results of the same ratio and different concentrations of the temporary plugging agent, we recommend the medium-concentration (18.0 kg/m3) and low-mesh (ratio 4:1) temporary plugging agent for a temporary plugging fracturing fluid system at 6 mm fracture end.
In summary, the pressure curves of different fracture widths show that the pressure rise is mainly in three stages. The pressure rise from 0.0 to 1.0 MPa belongs to the formation period of the temporary plugging band, wherein the temporary plugging agent begins to accumulate in the seam, where it is slow. The pressure rise from 1.0 MPa to 5.0 MPa belongs to the temporary plugging growth period, and the pressure rise is accelerated in this period. The temporary plugging agent gradually accumulates in the crack to form the plugging section, which can gradually bear the pressure. Finally, the pressure rise from 5.0 MPa to 10.0 MPa belongs to the later stage of temporary plugging, wherein the tight plugging section is formed in the fracture, resulting in a rapid rise in the injection pressure.

3.2. True Triaxial Large-Scale Model Temporary Plugging Diverting Test

3.2.1. Pumping Pressure Curve

  • Calculation of equivalent width of fractured core
The equivalent width of the simulated fractures under confining pressure was calculated to ensure that the simulated fracture sizes are consistent with the natural fracture size in the actual reservoir. Equation (1) [22] was used for calculating the equivalent fracture width of the fracture matrix system:
b = 3 π d   ( K t K m ) 3
where b is the equivalent fracture width, cm; d is the core diameter, cm; Kt is the measured permeability of the fracture matrix system, cm2; and Km is the measured permeability of the matrix, cm2.
The optimal concentration and ratio scheme of the temporary plugging agent under different fracture widths (Section 3.1) was applied in the experiment of the large physical model of real triaxial temporary plugging steering fracturing. Considering the first two groups of pressure curves in the experiment as an example, the calculated equivalent fracture width was approximately 0.4 cm.
Figure 11 and Figure 12 show the pump injection pressure curves of the repeated experiment of the temporary plugging diversion fracturing. The pressure first rose and then fell, and each of the rising-and-falling processes can be considered as a pseudo-rupture process. The entire first-stage pumping showed evident peak pumping pressure (i.e., fracture pressure). Subsequently, the pumping suddenly decreased and approximately stabilized at a certain pressure value (i.e., the fracture propagation pressure). When a certain amount of temporary plugging agent was pumped in the first pumping stage, the pumping pressure rose rapidly. A drastic fluctuation in the pumping pressure typically indicates a breakthrough of plugging and temporary plugging cake or an alternation of plugging and new fracture. In the second stage of pumping, (i.e., the slickwater stage of the pumping temporary plugging agent pumping), the pumping pressure curve dropped evidently. Typically, a pressure drop indicates the formation of a new fracture (turning fracture) or the breakthrough of an existing temporary plugging body. The small fluctuation in the pumping pressure indicates that the temporary plugging body was filled with pores or was gradually compacted.

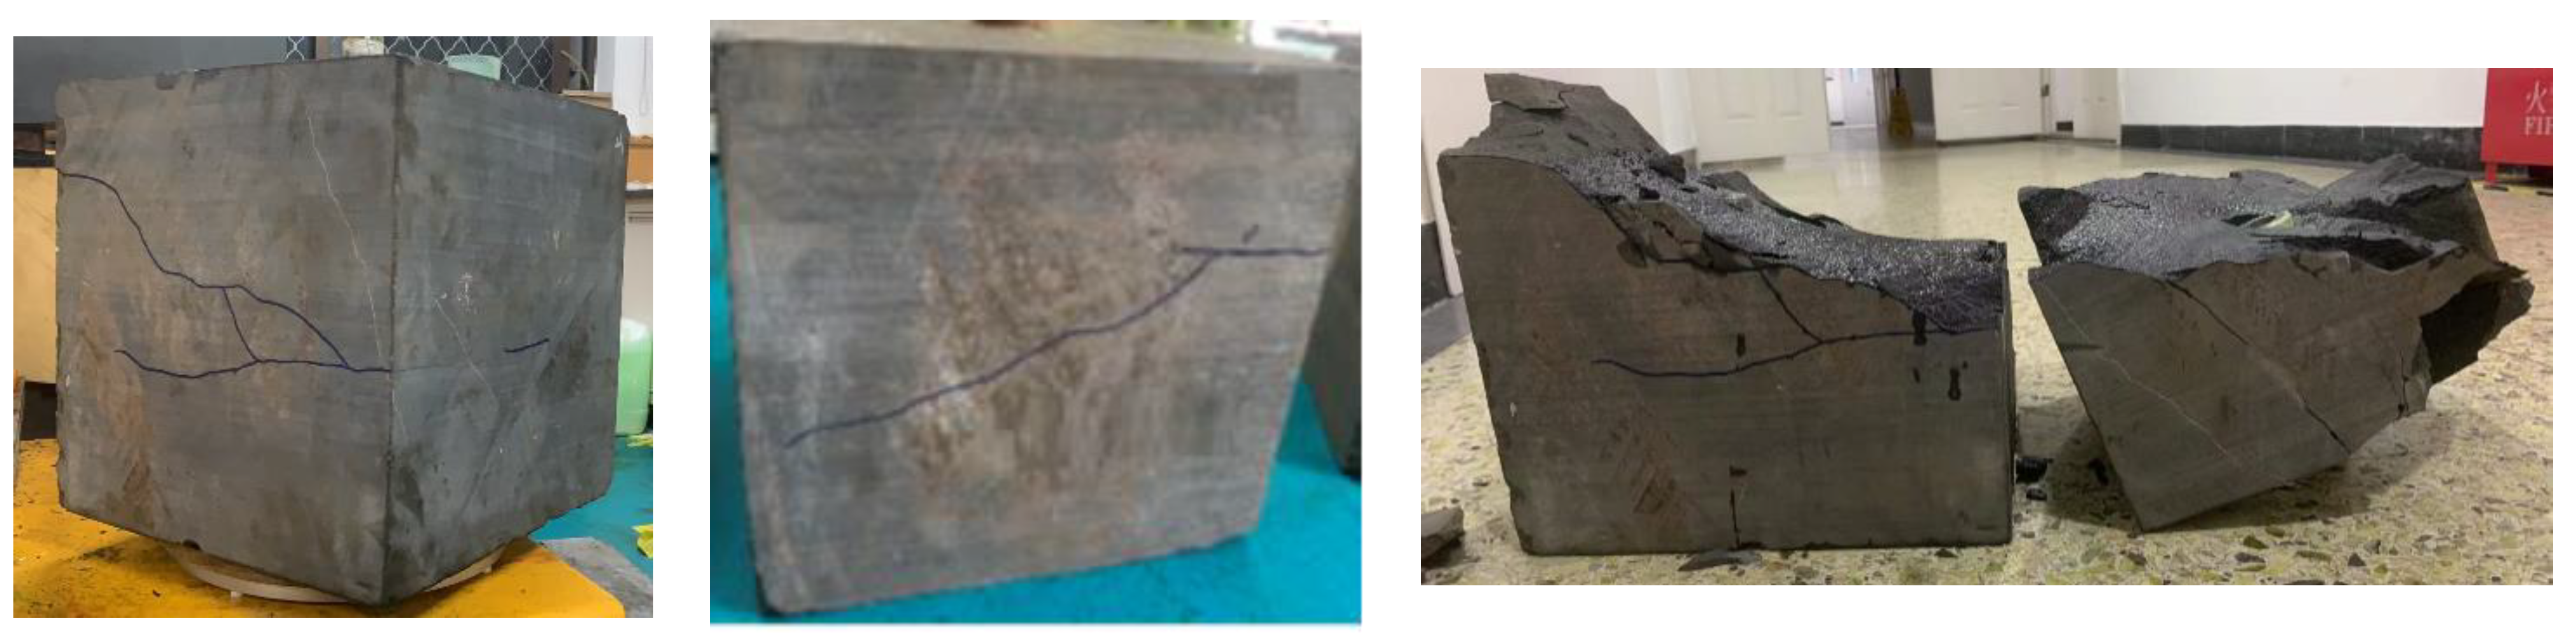
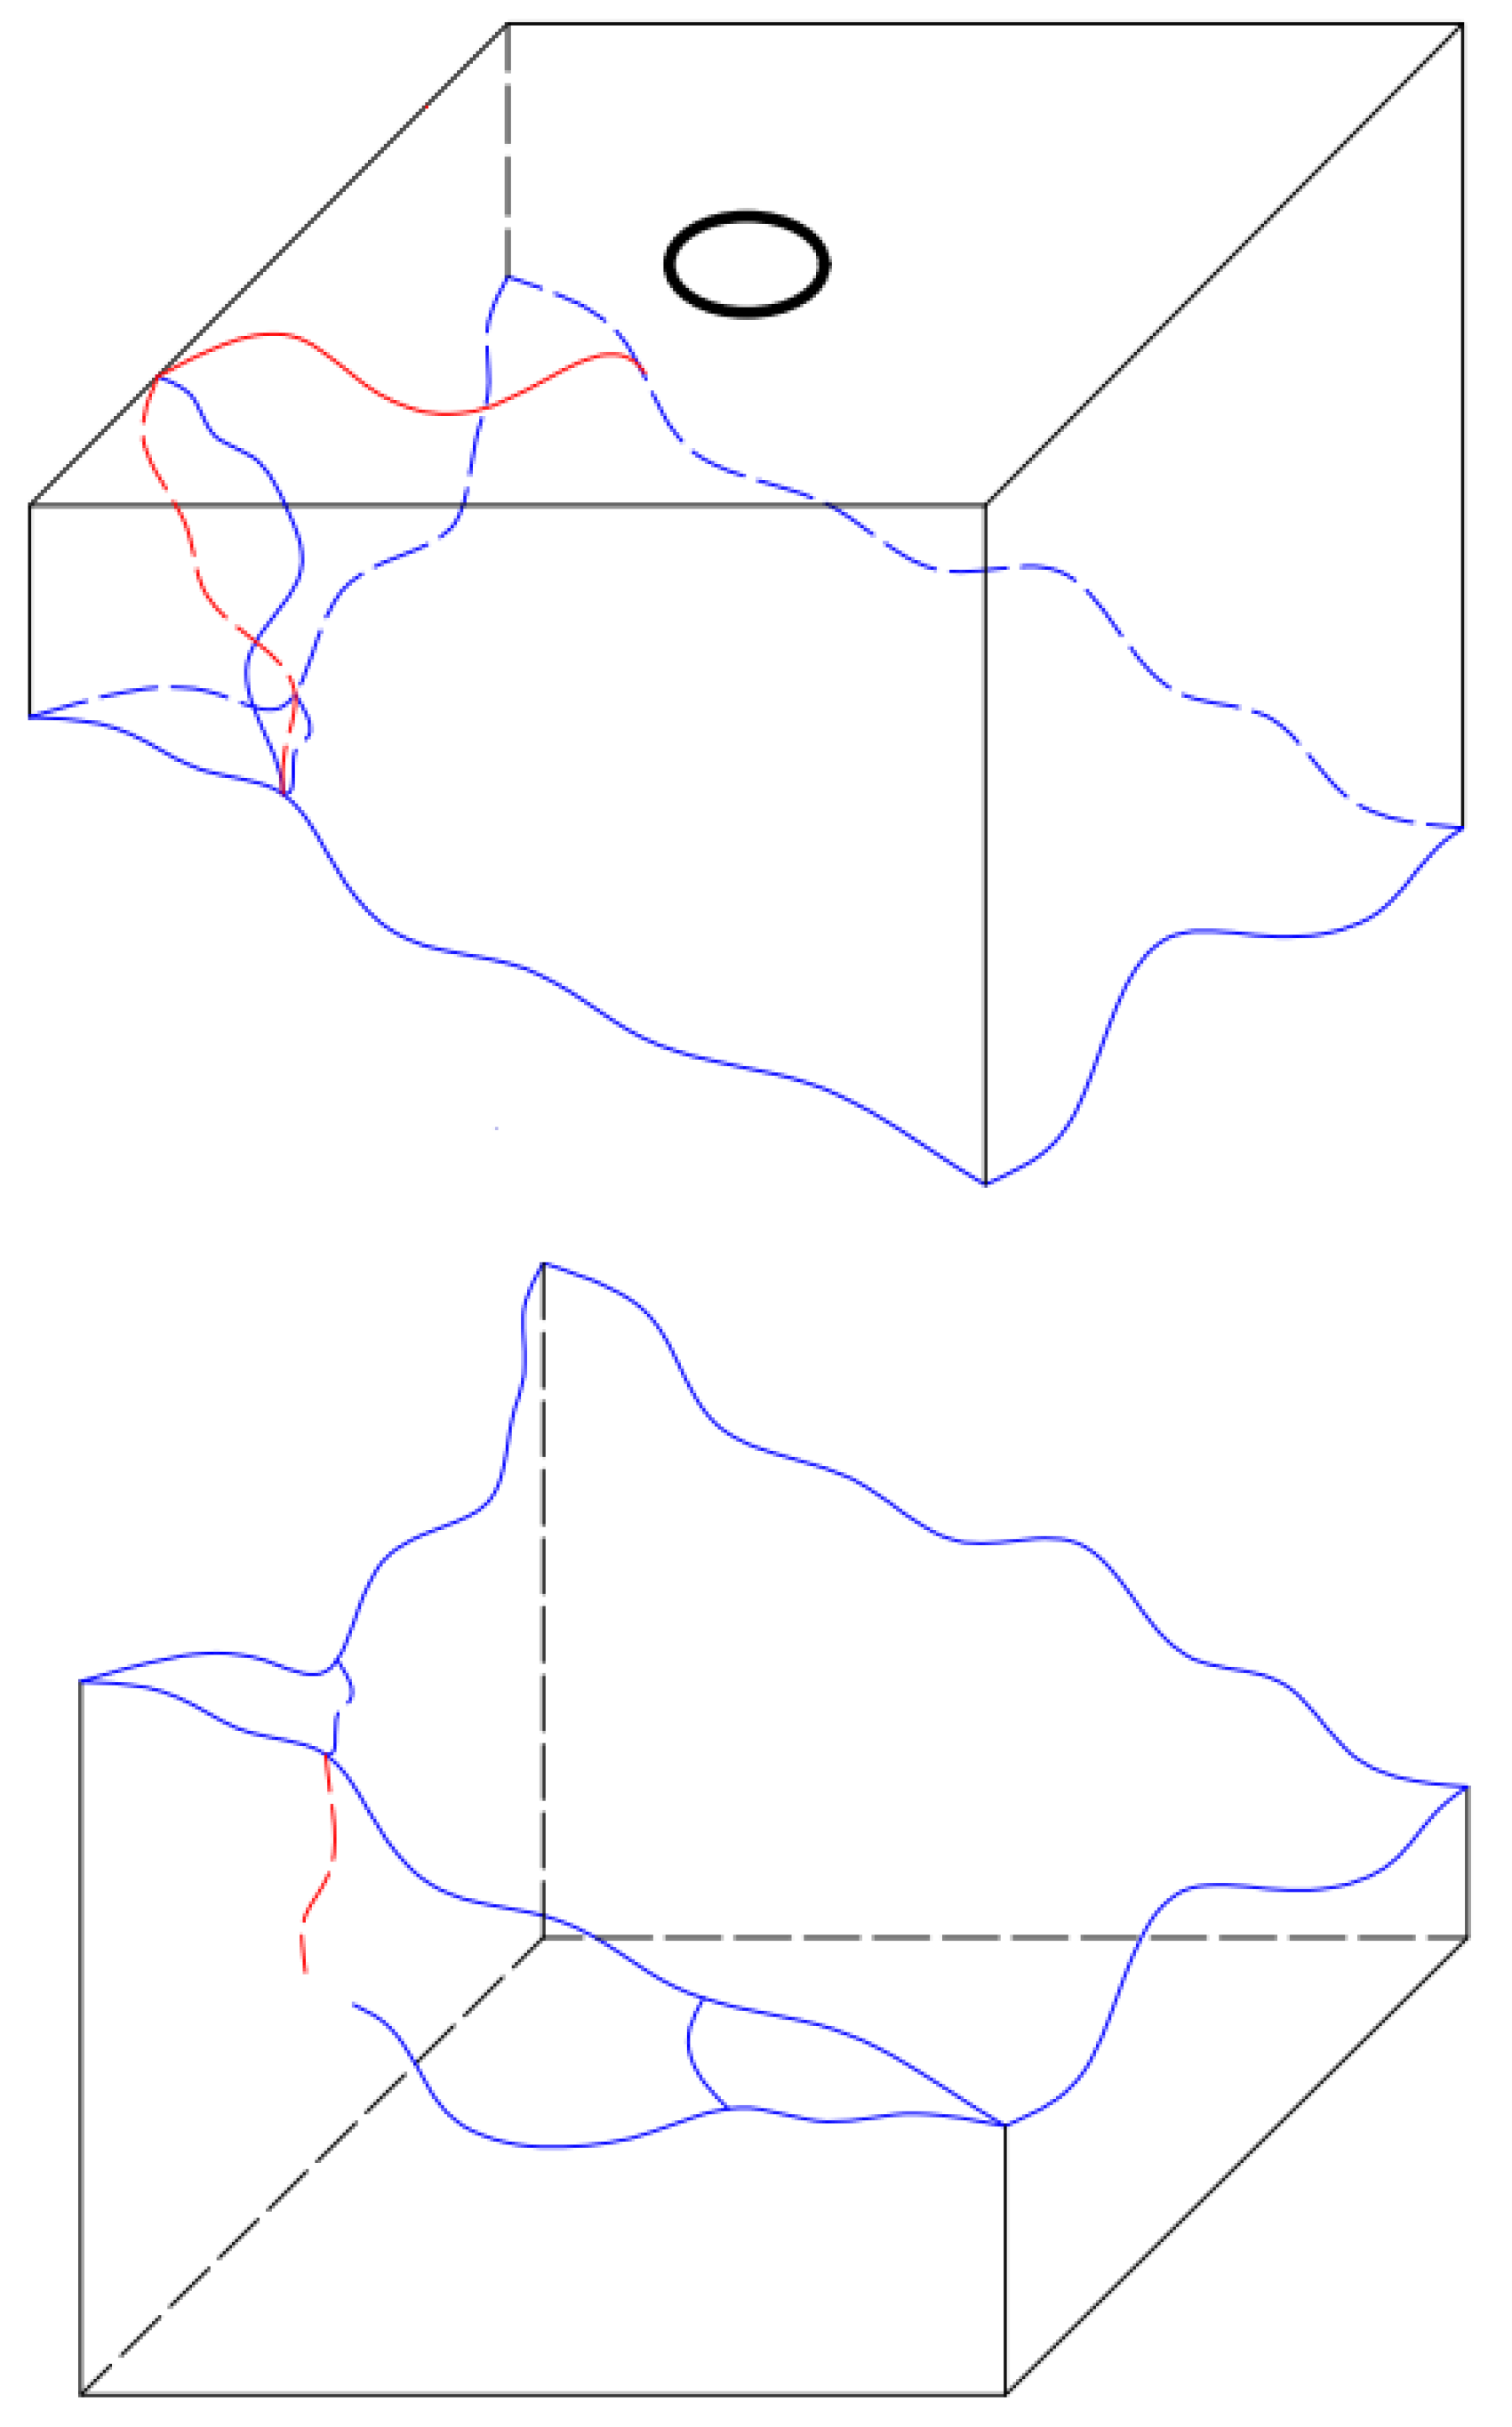
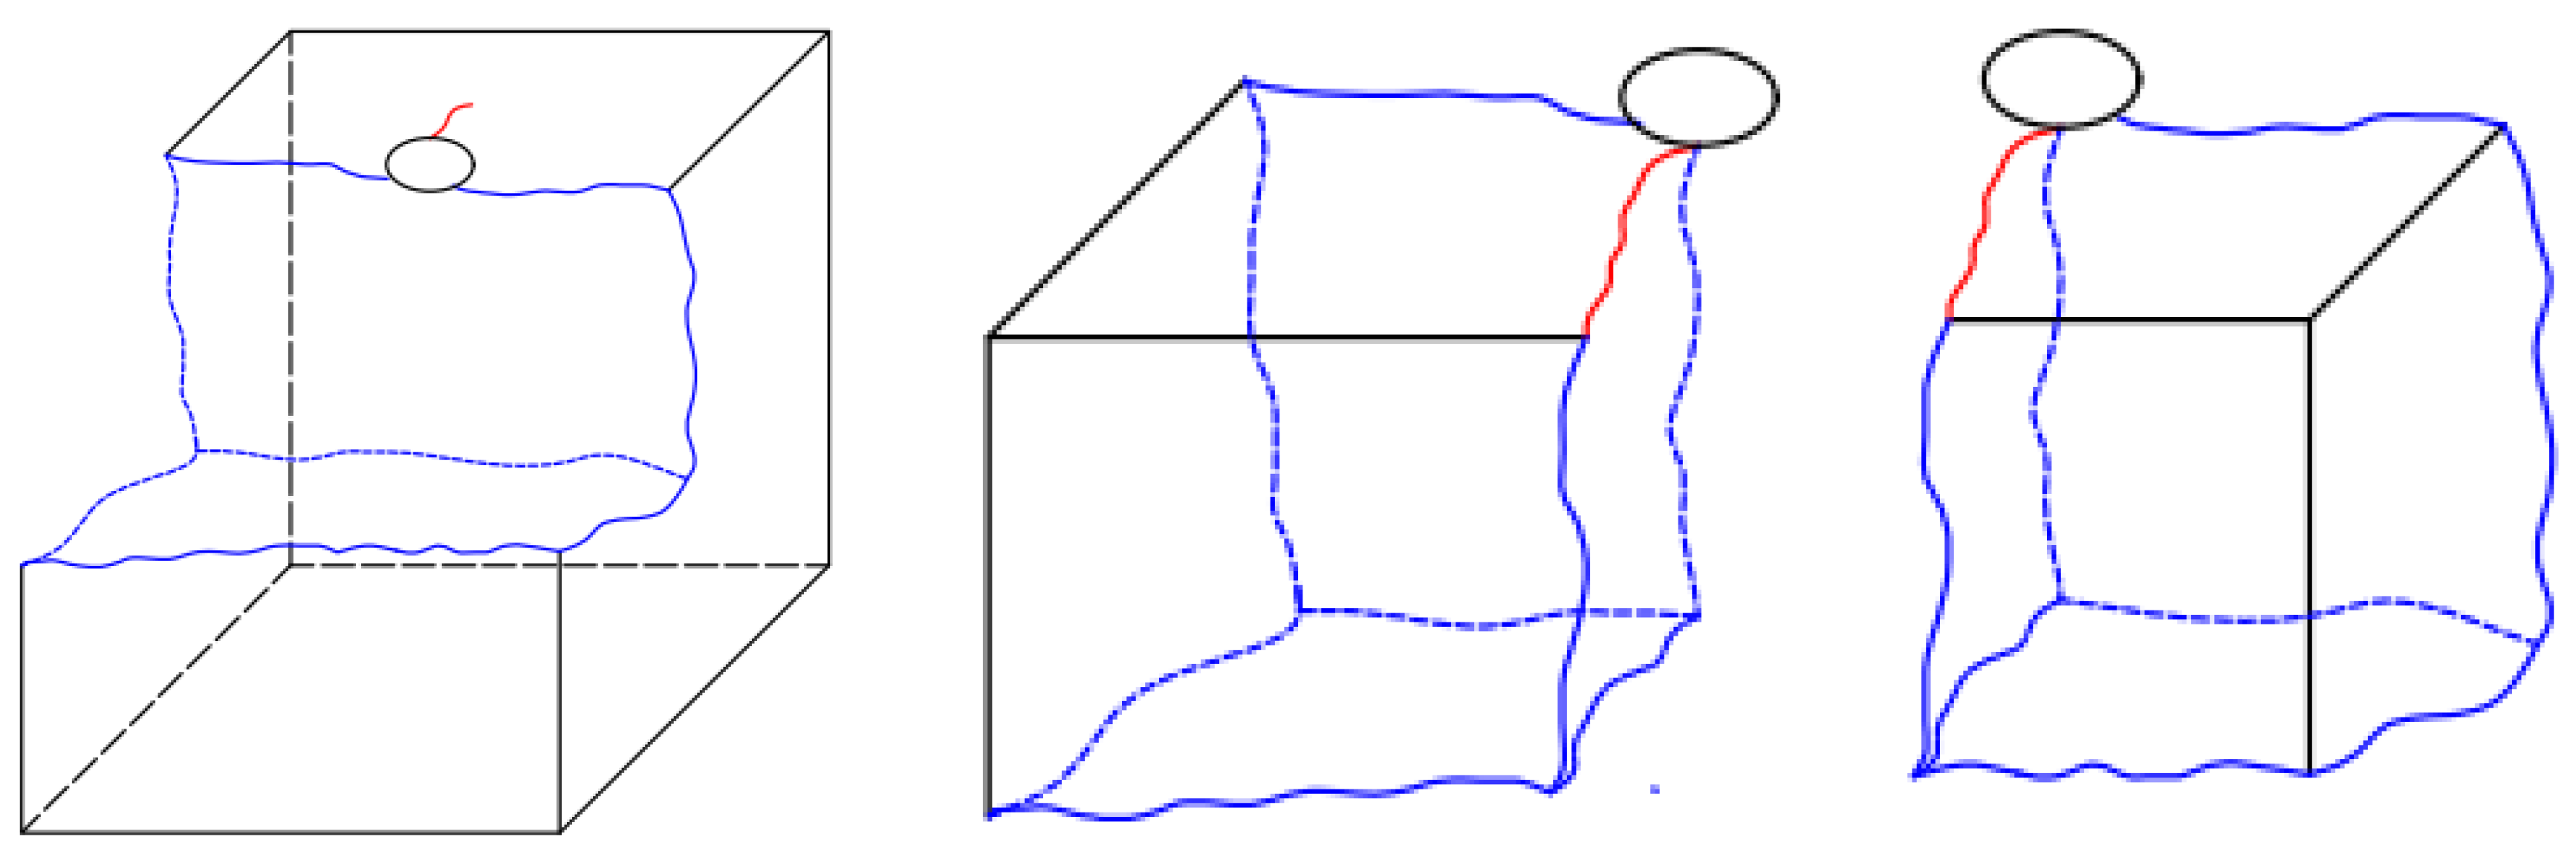
3.2.2. Overall Fracture Morphology

Figure 13, Figure 14, Figure 15 and Figure 16 show the overall fracture morphologies generated in experiments 1 and 2, respectively. The white line represents the initial fracture trajectory, and the blue line represents the turning fracture or subsequent fracture trajectory. Figure 15 and Figure 16 show the fracture diagrams of the rock samples in the experiment. The red line represents the fracture path of the first fracturing; the fracture track of the second fracturing is represented by the blue line. The first fracture was approximately along the horizontal maximum principal stress σH direction; however, the shape of the turning fracture (the subsequent fracture) was different. In Test 1, a network structure of a steering fracture was formed, and it penetrated the rock. In Test 2, two steering fractures were approximately perpendicular to the primary fracture, and the angle between the steering and primary fractures in Test 3 was close to 60°. In Test 4, an approximate transverse steering fracture was produced. In Test 5, an axial crack along σH was initially produced, after the second pumping, two new axial fractures were produced, where one was approximately the same as the initial fracture while the other is crosscut.
These experimental results showed that the fracturing fluid had an evident temporary plugging effect. In the range of a large ground stress difference, the fluid can temporarily plug the old fracture and open a new fracture in the direction of the vertical maximum principal stress. Therefore, the fracturing fluid had a good performance in temporary plugging diversion, and a multifracture interwoven network structure was formed in the actual fracturing operation.

3.2.3. Influence of Triaxial Stress

The underground stress state significantly affects the fracture trajectory of hydraulic fracturing, and a complex fracture morphology can be generated by the multistage pumping temporary plugging agent. Meanwhile, it also affects the fracture pressure. Table 3 presents the fracture pressure corresponding to the five groups of rock sample fracturing experiments.
The fracture pressure of the first rock sample was 7.2 MPa in the first fracture and 11.9 MPa in the second fracture; thereafter, the pressure tended to stabilize. The fracture pressure of the second rock sample was 8.6 MPa at the first fracture, 12.5 MPa at the second fracture, after which it tended to stabilize, and 12.5 MPa at the second fracture after which it tends to stabilize. The fracture pressure of the third rock sample was 13.8 MPa at the first fracture and greater than 40.0 MPa at the second fracture. The fracture pressure of the fourth sample was 8.9 MPa at the first fracture and 15.9 MPa at the second fracture and then tends to stabilize. The breakthrough pressure of the fifth sample was 4.9 MPa at the first fracture, and there were two breakthroughs at the second fracture: the first breakthrough pressure was 13.2 MPa and the second one was 37.3 MPa.
A comparison of Tests 1–4 showed that the higher the axial stress was, the higher the fracture pressure was while the fracture pressure decreased correspondingly. Experiments 3, 4, and 5 showed that when the axial stress was constant, an increase in the horizontal stress difference was accompanied by a decrease in the fracture pressure, fracture deflection degree, and fracture width. This is because when the horizontal stress difference was small, the induced stress had a small influence on the direction of the maximum principal stress. Consequently, the deflection degree was large, increasing the fracture propagation resistance, and subsequently the fluid pressure and fracture propagation in the crack.

4. Conclusions and Recommendations

In this study, we examined the material of the temporary plugging agent used in the temporary plugging diversion at the far end of fractures in the WY, Sichuan, China The proportion of the temporary plugging agent, applied concentration, and injection velocity were selected as parameters for optimizing the temporary plugging construction at the distal end of the fractures. The best scheme was applied to the natural outcrop of large-scale materials to simulate and study the fracture initiation behavior at the fracture end after temporary plugging, providing reference data for the numerical simulation study of temporary plugging at the fracture end. The major findings of the study are as follows.
  • According to the fracture pressure response curve, the process of the temporary plugging experiment was divided into three stages. The formation period of the temporary plugging zone, where the initial pressure of temporary plugging increased from 0.0 MPa to 1.0 MPa, the temporary plugging agent began to accumulate in the fracture, and the pressure in the fracture gradually increased. The second stage was the temporary plugging growth period, where the pressure increased from 1.0 MPa to 5.0 MPa, at a slightly faster rate, and the temporary plugging agent gradually accumulated in the crack to form a plugging section, which gradually bore the pressure. The final stage was the late stage of temporary plugging, where the pressure increased from 5.0 MPa to beyond 10.0 MPa, and rose sharply, forming dense plugging sections.
  • The plugging efficiency of the temporary plugging agent was determined by analyzing the time required for the pressure rise in the three major processes of temporary plugging. Because the constant flow mode was adopted in the experiments, the shorter the time required was, the higher the plugging efficiency and the smaller the liquid production were. The ratio of the temporary plugging agent was found to be the main factor affecting the temporary plugging efficiency. In addition, as the fracture width increases, the concentration should be increased appropriately.
  • A comparison of the different proportions of sliding water and temporary plugging showed that the maximum sliding water system could temporarily plug 6.0 mm fracture widths. Under the same construction conditions, the volume of fracturing fluid with high concentration is larger than that with low concentration, and the corresponding construction cost is relatively high. Considering the economic efficiency of construction, when the fracture widths are 2.0, 4.0, or 6.0 mm, the corresponding optimal plugging scheme should be temporary plugging agent concentrations of 12.0, 18.0, and 18.0 kg/m3.
  • In the true triaxial large-scale model experiment, the pressure increased first and then decreased multiple times, with an overall upward trend. This phenomenon occurred because after the fracturing fluid was injected into the wellbore, the liquid was filtrated along the formed fracture, and the temporary plugging agent gradually accumulated at the beginning of the fracture. Thus, aggregates were formed, and the fluid could not be filtrated into the fracture, forming a pressure rise. When the pressure increased to a certain extent, new fracture formation or old fracture extension made the liquid flow back into the rock, resulting in a rapid decline in the pressure. When the new filtration reached a certain degree, the temporary plugging agent formed a cluster again, resulting in a new round of pressure increase. Repeating this process until all filter points are blocked would continually increase the pressure.
  • When the local stress difference is large, the old cracks can be temporarily blocked, while the new cracks can be opened along the direction of the maximum vertical principal stress. Hence, the fracturing fluid has good temporary plugging and diversion performance and can form a network structure with multiple fractures interwoven in the actual fracturing operation. Compared with the experimental results, it was found that the fracture pressure increased with an increase in axial stress. When the axial stress was constant, an increasing horizontal stress difference was accompanied by a correspondingly decreasing fracture pressure, while the crack deflection gradually decreased, and the crack width slightly decreased.

Author Contributions

Writing—original draft, H.X.; writing—review and editing, J.W.; conceptualization, H.J. and J.W.; methodology, J.W.; validation, H.X. and L.F.; formal analysis, H.X.; investigation, Y.M.; visualization, P.G.; supervision, H.J.; project administration, H.J.; funding acquisition, J.W. All authors have read and agreed to the published version of the manuscript.

Funding

This research was funded by the Cooperative Innovation Center of Unconventional Oil and Gas (Ministry of Education and Hubei Province), Yangtze University (No. UOG2022-01), the Planned Project of Hubei Provincial Department of Science and Technology (second batch) (No. 2021CFB249) and the Project of Science and Technology Research, Education Department of Hubei Province (No. Q20211303). The APC was funded by Jie Wang.

Institutional Review Board Statement

Not applicable.

Informed Consent Statement

Not applicable.

Data Availability Statement

Not applicable.

Acknowledgments

Thank China University of Petroleum (Beijing) for the support of the project experimental equipment. Thank Chuanqing Drilling Company for supporting the experimental materials of the project.

Conflicts of Interest

All data in the article come from the author, without plagiarism and copyright issues.

References

  1. Liu, J.; Sheng, J.J.; Emadibaladehi, H.; Tu, J. Experimental study of the stimulating mechanism of shut-in after hydraulic fracturing in unconventional oil reservoirs. Fuel 2021, 300, 120982. [Google Scholar] [CrossRef]
  2. Zhang, T.; Zhao, J.; Liu, Y.; Yu, F. Evolution and management of thick-hard roof using goaf-based multistage hydraulic fracturing technology—A case study in western Chinese coal field. Arab. J. Geosci. 2021, 14, 876. [Google Scholar]
  3. Zhong, C.; Zolfaghari, A.; Hou, D.; Goss, G.G.; Lanoil, B.D.; Gehman, J.; Tsang, D.C.W.; He, Y.; Alessi, D.S. Comparison of the Hydraulic Fracturing Water Cycle in China and North America: A Critical Review. Environ. Sci. Technol. 2021, 55, 7167–7185. [Google Scholar] [CrossRef] [PubMed]
  4. Zhu, D.; Xu, Z.; Sun, R.; Fang, X.; Gao, D.; Jia, X.; Hu, J.; Weng, J. Laboratory evaluation on temporary plugging performance of degradable preformed particle gels (DPPGs). Fuel 2020, 289, 119743. [Google Scholar] [CrossRef]
  5. Jia, H.; Kang, Z.; Zhu, J.; Ren, L.; Cai, M.; Wang, T.; Li, Z. High density bromide-based nanocomposite gel for temporary plugging in fractured reservoirs with multi-pressure systems. J. Pet. Sci. Eng. 2021, 205, 108778. [Google Scholar] [CrossRef]
  6. Abrams, A. Mud design to minimize rock impairment due to particle invasion. J. Pet. Technol. 2013, 29, 586–592. [Google Scholar] [CrossRef]
  7. Loeppke, G.E.; Glowka, D.A.; Wright, E.K. Design and evaluation of lostcirculation materials for severe environments. J. Pet. Technol. 2013, 42, 328–337. [Google Scholar] [CrossRef]
  8. Carpenter, C. A Novel Completion Method for Sequenced Fracturing in the Eagle Ford Shale. J. Pet. Technol. 2014, 66, 122–125. [Google Scholar] [CrossRef]
  9. Xue, S.; Zhang, Z.; Wu, G.; Wang, Y.; Wu, J.; Xu, J. Application of a Novel Temporary Blocking Agent in Refracturing. In SPE Asia Pacific Unconventional Resources Conference and Exhibition; Society of Petroleum Engineers: Brisbane, Australia, 2015. [Google Scholar]
  10. Wang, D.; Zhou, F.; Ge, H.; Shi, Y.; Yi, X.; Xiong, C.; Liu, X.; Wu, Y.; Li, Y. An experimental study on the mechanism of degradable fiber-assisted diverting fracturing and its influencing factors. J. Nat. Gas Sci. Eng. 2015, 27, 260–273. [Google Scholar] [CrossRef]
  11. Wang, D.; Zhou, F.; Ding, W.; Ge, H.; Jia, X.; Shi, Y.; Wang, X.; Yan, X. A numerical simulation study of fracture reorientation with a degradable fiber-diverting agent. J. Nat. Gas Sci. Eng. 2015, 25, 215–225. [Google Scholar] [CrossRef]
  12. Lichun, I.; Hongyin, X.; Qingming, T. Simulation experimental study on leakage stoppage under triaxial pressure. Drill. Prod. Technol. 2017, 40, 14–17. [Google Scholar]
  13. Gomaa, A.M.; Spurr, N.; Pirogov, A.; McCartney, E. Combining soluble particle diverter with specially engineered proppant to enhance fracture complexity and post-fracture conductivity. In SPE Annual Technical Conference and Exhibition; Society of Petroleum Engineers: Dubai, United Arab Emirates, 2016. [Google Scholar]
  14. Fu, H.; Yan, Y.; Xu, Y.; Liang, T.; Liu, Y.; Guan, B.; Wang, X.; Weng, D.; Feng, J. Experimental Study and Field Application of Fiber Dynamic Diversion in West China Ultra-Deep Fractured Gas Reservoir. In 52nd US Rock Mechanics/Geomechanics Symposium; American Rock Mechanics Association: Washington, DC, USA, 2018. [Google Scholar]
  15. Vidma, K.; Abivin, P.; Dunaeva, A.; Panga, M.; Nikolaev, M.; Usoltsev, D.; Mayo, J.T. Far-Field Diversion Technology to Prevent Fracture Hits in Tightly Spaced Horizontal Wells. In SPE Annual Technical Conference and Exhibition; Society of Petroleum Engineers: Dallas, TX, USA, 2018. [Google Scholar]
  16. Trumble, M.; Sinkey, M.; Meehleib, J. Got Diversion? Real Time Analysis to Identify Success or Failure. In SPE Hydraulic Fracturing Technology Conference and Exhibition; Society of Petroleum Engineers: The Woodlands, TX, USA, 2019. [Google Scholar]
  17. Staff, J. Perforating requirements for fracture stimulations. J. Pet. Technol. 1998, 50, 46. [Google Scholar] [CrossRef]
  18. Zhou, F.; Yi, X.; Yang, X.; Liu, X.; Wang, D. Dynamic fifiltration experiment of fifiber temporary pluggin artifificial fracture. Drill. Prod. Technol. 2014, 37, 83–86. [Google Scholar]
  19. Liu, Z.Y.; Chen, M.; Zhang, G.Q. Analysis of the influence of a natural fracture network on hydraulic fracture propagation in carbonate formations. Rock Mech. Rock Eng. 2014, 47, 575–587. [Google Scholar] [CrossRef]
  20. Zhang, S.; Wu, S.; Duan, K. Study on the deformation and strength characteristics of hard rock under true triaxial stress state using bonded-particle model. Comput. Geotech. 2019, 112, 1–16. [Google Scholar] [CrossRef]
  21. Yang, S.; Fujian, Z.; Xianyou, Y.; Xiongfei, L.; Shengjiang, L.; Xiangdong, L. Laboratory study and field application of fiber-based fracture reorientation technology. In IPTC 2013 International Petroleum Technology Conference; OnePetro: Beijing, China, 2013. [Google Scholar]
  22. Yang, S.; Wei, J. Reservoir Physics; Schlumberger: Houston, TX, USA, 2015; pp. 152–155. [Google Scholar]
Figure 1. (a). 3D scan of fractured rock slabs. (b). Real rock plate for experiment.
Processes 10 01720 g001
Figure 2. (a). Physical diagram of Pressure-bearing capacity test experimental device. (b). Schematic diagram of Pressure-bearing capacity test experimental device. Note: 1—Pressure pump (ISCO single pump); 2—Injection pump (ISCO dual pump); 3—Pressure machine; 4—Diversion chamber; 5—Intermediate container; 6—Pressure sensor; 7—Beaker; 8—Computer.
Processes 10 01720 g002
Figure 3. (a). Physical diagram of true three-axis physical simulation system. (b). Schematic diagram of true three-axis physical simulation system. Note: 1—Pressure plate; 2—Natural outcrop; 3—Intermediate container; 4—Injection pump (ISCO dual pump); 5—Pressure sensor; 6—Computer.
Processes 10 01720 g003
Figure 4. Diagram of experimental rock sample structure diagram.
Processes 10 01720 g004
Figure 5. (a). Pressure curves of different concentrations with 2 mm fracture width. (b). Aggregation patterns of temporary plugging agents with different concentrations in 2.0 mm fracture width.
Processes 10 01720 g005
Figure 6. (a). Pressure curves of different concentrations with 4.0 mm fracture width. (b). Aggregation patterns of temporary plugging agents with different concentrations in 4.0 mm fracture width.
Processes 10 01720 g006
Figure 7. (a). Pressure curves of different concentrations with 6.0 mm fracture width. (b). Aggregation patterns of temporary plugging agents with different concentrations in 6.0 mm fracture width.
Processes 10 01720 g007
Figure 8. (a). Pressure curve with different ratios of fracture width 2.0 mm. (b). Aggregation patterns of temporary plugging agents with different ratios of 2.0 mm fracture width in cracks. Note: Case 1, 20–70:200–300 = 1:4; Case 2, 20–70:200–300 = 1:2; Case 3, 20–70:200–300 = 1:1; Case 4, 20–70:200–300 = 2:1; Case 5, 20–70:200–300 = 4:1.
Processes 10 01720 g008
Figure 9. (a). Pressure curve with different ratios of 4.0 mm fracture width. (b). Aggregation patterns of temporary plugging agents with different ratios of 4.0 mm fracture width in cracks.
Processes 10 01720 g009
Figure 10. (a). Pressure curve with different ratios of 6.0 mm fracture width. (b). Aggregation patterns of temporary plugging agents with different ratios of 6.0 mm fracture width in cracks.
Processes 10 01720 g010
Figure 11. Injection pressure curve of Test 1.
Processes 10 01720 g011
Figure 12. Injection pressure curve of Test 2.
Processes 10 01720 g012
Figure 13. Fracture geometry of Test 1.
Processes 10 01720 g013
Figure 14. Fracture geometry of Test 2. Note: The white line represents the first stage fracture; the blue line represents is the second-stage fracture.
Processes 10 01720 g014
Figure 15. Schematic diagram of fracture in Test 1.
Processes 10 01720 g015
Figure 16. Schematic diagram of fracture in Test 2. Note: The red line represents the first-stage fracture; the blue line represents the second-stage fracture.
Processes 10 01720 g016
Table 1. Experimental condition. (Taking 2.0 mm fracture width as an example).
Fracture Width
(mm)
Temporary Plugging Agent Ratio, Mass Ratio
20–70 Mesh: 200–300 Mesh
Concentration
(kg/m3)
Pump Rate
(mL/min)
2.01:41260
1:2
1:1
2:1
4:1
1:418
1:2
1:1
2:1
4:1
1:424
1:2
1:1
2:1
4:1
Table 2. Triaxial stress table corresponding to five experiments.
Textσh (MPa)σH (MPa)σv (MPa)
15.017.05.0
25.020.05.0
35.017.07.0
45.020.07.0
55.025.07.0
Note: σH—Maximum horizontal principal stress; σh—Minimum horizontal principal stress; σv—Vertical stress.
Table 3. Experimental stress parameters and burst pressure values.
PressureTest 1Test 2Test 3Test 4Test 5
Horizontal stress difference
(MPa)
12.015.012.015.020.0
Axial stress
(MPa)
5.05.07.07.07.0
Burst pressure
(MPa)
7.22/11.98.6/12.513.8/20.08.9/15.94.9/13.2
Publisher’s Note: MDPI stays neutral with regard to jurisdictional claims in published maps and institutional affiliations.

