Article

Analysis of Reservoir Stability during Natural Gas Hydrate Exploitation under Incline Seafloor

1
Research Institute of Petroleum Engineering, Shengli Oilfield, Sinopec, Dongying 257000, China
2
Shengli Oilfield Company, Sinopec, Dongying 257000, China
3
Shengli Oilfield Petroleum Development Center Co., Ltd., Dongying 257000, China
*
Author to whom correspondence should be addressed.
Processes 2022, 10(8), 1614; https://doi.org/10.3390/pr10081614
Submission received: 22 June 2022 / Revised: 27 July 2022 / Accepted: 2 August 2022 / Published: 15 August 2022

Abstract

:
Natural gas hydrates (NGHs) have been recognized as a potential substitute for traditional fossil fuels. Mining NGH reservoirs can decrease the strength of the reservoirs, especially while improving production, and the double-well mining of NGHs also significantly reduces the strength of reservoirs. This study develops a thermofluid-solid multifield coupling model for mining NGHs through depressurization while considering the NGH decomposition kinetics and physical properties of NGH reservoirs. The influence of the formation responses and burial conditions on the slope stability in the depressurization process of NGHs is analyzed by combining it with the finite-element strength-reduction method. Results show that the decomposition zones of NGHs are nonuniformly distributed in space and have an irregular prismatic shape. The pore pressure propagates from the wellbores to the surrounding areas, forming cylindrical high-pressure-drop zones. Plastic zones first appear in the decomposition zones of NGHs; then, they gradually spread to the slope shoulder and toe, eventually coalescing to form a plastic zone. The stability of submarine slopes declines with the increasing slope angle, reservoir thickness, and initial saturation of the reservoir, while it increases with the growing burial depth of the reservoir. The seabed settlement grows with the growing slope angle and initial saturation, and thickness of reservoirs, while it decreases with the rising burial depth of the reservoir.

1. Introduction

Natural gas hydrates (NGHs) are cage compounds composed of water and natural gas under low temperature and high pressure [1]. NGHs have been identified as a potential replacement for fossil fuels because of their large reserve, high energy density, and low pollution [2]. During the drilling and mining process, the strength of NGH reservoirs is heavily weakened, leading to severe geological disasters [3,4,5]. Many examples of NGHs decomposing naturally and causing submarine landslides were discovered owing to seabed detection technologies [6]. However, the impact of the artificial mining of NGHs on the stability of submarine slopes is rarely investigated, so it is necessary to give this issue more attention.
Many factors cause submarine landslides. Hance [7] conducted the statistical analysis of 366 inducements for submarine landslides and found that the decomposition of NGHs is ranked third among submarine landslide causes. Scholars have widely acknowledged the relationship between the dissociation of NGHs and damage to submarine slopes. However, the failure process and mechanism of submarine slopes due to the dissociation of NGHs are still unclear [8]. The Storegga landslide at the coast of Norway is one of the most intensely studied submarine landslides and the largest ever found. Kayen and Lee [9] considered that the Storegga landslide happened due to the decomposition of large amounts of NGHs as a result of the decrease in global sea level. Sultan et al. [10] examined various submarine landslides on the Norwegian margin and supposed that a definite bottom simulating reflector (BSR) was present in the area of the Storegga landslide by analyzing geotechnical data, and that the decomposition of NGHs was one of the causes for the landslide. On the basis of sonar and earthquake data in the Storegga landslide area, Wu et al. [11] analyzed the formation mechanism of the landslide using finite-element numerical simulation. They concluded that earthquakes and the decomposition of NGHs are essential factors that trigger submarine landslides. Paull et al. [12] believed that the decomposition of NGHs was one of the reasons for the Cape Fear landslide in the South Carolina continental rise in the Atlantic at the end of the 1970s. By studying many examples of submarine landslides, Zhou [13] reported that submarine landslides caused by the decomposition of NGHs could occur on slopes with an inclination lower than or equal to 5°. The landslide mass moves along the top of NGH reservoirs, and there is no NGH in the sediment layer beneath the landslide mass. On the basis of the limit equilibrium method, Liu et al. [14] investigated the influence of the decomposition degree of NGHs on the failure of submarine slopes. They applied numerical simulation to reveal that NGHs at the bottom are more likely to generate landslides. In addition, Tan et al. [15] analyzed the impact of mining NGHs through pressurization in horizontal wells and the hot-injection method on the stability of slopes using the TOUGH+HYDRATE thermofluid-chemical coupling model. Ma et al. [16] studied the geometrical deformation characteristics and causes of the submarine landslide in the Qiongdongnan basin north of the South China Sea by utilizing two-dimensional seismic data. An et al. [17] adopted the limit analysis method to test the effect of the decomposition of NGHs on the stability of gentle slopes using the theory of the upper bound of energy. Zhao et al. [18] addressed the influence of different factors on the stability, marginal means, and changes of different factors by the two-step reduction approach. Tang et al. [19] inspected the role of the initial NGHs, and the total decomposition of NGHs on slope stability relied on the strength reduction method. Using the calculation program built by independently developed software GEODYNA, Xu et al. [20] realized the softening and decomposition of NGHs. They also found that the strength reduction and modulus softening of NGHs are the main factors affecting the stability of submarine slopes. Lin et al. [21] reported on the relationship between the saturation and physical parameters of NGHs, and analyzed the depressurization of NGHs by utilizing the finite-element strength-reduction technique. Their research revealed that the depressurization of a single well has no significant effect on slope stability. Chen et al. [22] assumed a two-stage risk evaluation method for mining NGHs, analyzed the probability of the submarine slope’s stability by considering the mining of NGHs, and quantitatively evaluated the human risks of the platform staff. Applying the finite-element strength-reduction method, Song et al. [23,24] built a thermo-hydro-chemical-mechanical coupling model for NGHs, they analyzed the impact of production parameters on slope stability under single-well production, which provides a very helpful direction for designing hydrate production. In summary, numerous researchers have analyzed the reasons for submarine landslides, and conducted simulations of the influence of natural factors such as earthquakes and sea level rise or the single-well mining of NGHs on the stability of submarine slopes. However, the effect of NGHs’ multiwell mining process on the stability of submarine slopes has rarely been studied.
A thermo-flow-solid coupling model was built here for mining NGH reservoirs by considering the decomposition process of NGHs. The influence of burial conditions on the stability of submarine slopes during the double-well mining of NGHs is also investigated by combining it with the strength-reduction method.

2. Model Establishment

NGHs are present in the pores of reservoirs as a solid. By breaking the phase equilibrium conditions of NGH reservoirs, the depressurization method permits NGHs to decompose and produce natural gas and water, which are then extracted. The mining process of NGHs is dynamic and couples multiple fields, including the temperature, seepage, stress, and saturation of NGHs. A multi-field coupling model of hydrate reservoirs has been established by other researchers and provided very useful results for hydrate production [5], which has greatly inspired our research.

2.1. Numerical Model

2.1.1. Kinetic Equation for Decomposing NGHs

Methane hydrates exceed 97% of NGHs, so they play a vital role in existing research, and their decomposition equation is [25]
CH 4 n H 2 O + Heat CH 4 + n H 2 O
where n is a value in the range of 5.5–6.
The phase equilibrium equation of NGHs is [26]
P e q = e a b T
where T is the formation temperature (K), P e q is the phase equilibrium pressure of NGHs (Pa), and a and b are experimental parameters of NGHs (dimensionless). When T > 0 K, then a = 39 and b = 8533.
The decomposition rate of NGHs, the production rate of methane, is [27]
r g = k A s ( f f e q )
where r g and k d represent the production rate of methane (mol·L−1·s−1) and a kinetic constant for the decomposition of NGHs (dimensionless), respectively; A s is the surface area of reaction (m2), which is the interfacial area between hydrate particles and surrounding phases; f is the fugacity of methane at local temperature and pressure (Pa); and f e q is the fugacity of methane under the equilibrium pressure corresponding to the local temperature (Pa).
The production rates of water ( r w , mol·L−1·s−1) and consumption rates of NGHs ( r h ) can be determined using Equation (4):
r h = r g ,   r w = n r g

2.1.2. Physical Parameters of Reservoirs

The presence of NGHs affects the strength and seepage properties of NGH reservoirs. The strength of NGH reservoirs grows linearly with increasing NGH saturation and confining pressure. The bulk modulus, shear modulus, and cohesion of NGH reservoirs are related to NGH saturation in the reservoirs, as shown in the following equation [28].
K = ( K s h 1 K s h 0 ) × S h + K s h 0
G = ( G s h 1 G s h 0 ) × S h + G s h 0
c = ( c s h 1 c s h 0 ) × S h + c s h 0
where K is the bulk modulus of NGH reservoirs (Pa); K s h 1 and K s h 0 represent the bulk moduli of the reservoirs when the NGH saturation is 1 and 0 (Pa), respectively; G is the shear modulus of NGH reservoirs (Pa); G s h 1 and G s h 2 are the shear moduli of the reservoirs when the NGH saturation is 1 and 0 (Pa), respectively; c is the cohesion of the NGH reservoirs (Pa); c s h 1 and c s h 2 denote the cohesion of reservoirs when the NGH saturation is 1 and 0 (Pa), respectively.
The modified Mohr-Coulomb criterion is utilized to describe the plastic yield behaviors of NGH reservoirs. According to the modified Mohr-Coulomb criterion, deviatoric stress is determined by the effective confining pressure, internal friction angle, and cohesion [29]:
σ 1 σ 3 = 2 sin φ ( S h ) 1 sin φ ( S h ) σ 3 + 2 cos φ ( S h ) 1 sin φ ( S h ) c ( S h )
NGHs are present in the pores of porous reservoirs as a solid. Their presence influences the porosity and permeability of reservoirs. After decomposition, NGHs are transformed from a solid into a gas and liquid. Since the total porosity of reservoirs does not change, but the effective porosity increases, the permeability of the reservoir also grows. Hence, the permeability of reservoirs is related to NGH saturation during the mining process.
The relationship between permeability and NGH saturation is [30]:
k = k 0 1 S h n
where k is the permeability of reservoirs (mD), k 0 is the initial permeability of reservoirs (mD), S h is the NGH saturation in the reservoirs, and n is a saturation index of reservoirs.
The relationship between porosity and NGH saturation is [29]:
φ e = φ 0 1 S h
where φ e and φ 0 are the effective porosity and initial porosity, respectively.
The void ratio and permeability coefficient are employed to characterize the fluid parameter of materials. The relationship between the void ratio and porosity of reservoirs can be stated as follows:
e = φ 1 φ
where e and φ are the void ratio and porosity of reservoirs, respectively.
The relationship between the permeability coefficient and the permeability of reservoirs is as follows:
K = γ k μ
where K , k , γ , and μ are the permeability coefficient of reservoirs (m·d−1), the permeability of reservoirs (mD), the unit weight of fluid in pores (N·m−3), and the dynamic viscosity of a fluid in pores (N·s·m−2), respectively.

2.2. Strength Reduction Method

Zienkiewicz et al. [31] defined the concept of the reduction coefficient of shear strength as a ratio of the maximal shear strength that soils can provide in a slope to the actual shear stress produced by external loads in the slope under conditions in which external loads remain constant. After reduction, the shear strength parameter for the Mohr-Coulomb strength criterion can be written as follows [31]:
c m = c / F r
φ m = arctan ( tan φ / F r )
where c m is the cohesion needed to maintain balance or that which is actually provided by soils (Pa), c is the cohesion that can be provided by soils (Pa), φ m is the internal friction angle required to preserve balance or actually given by soils (°), φ is the internal friction angle that can be provided by soils (°), and F r is the strength reduction coefficient.
Strength reduction coefficient F r at the failure of a slope is equal to safety factor F s of the slope. If F s > 1, the slope is stable; if F s = 1, the slope is metastable; and if F s < 1, the slope becomes unstable.
Currently, the evaluation criteria for determining slope instability are: (1) the formation of a continuous plastic penetration zone, (2) the sharp displacement of the characteristic points of the slope changes, and (3) the finite-element calculation does not converge. The formation of a continuous plastic penetration zone and sharp changes in the displacement of the characteristic point as the principle for evaluating instability are artificially judged by the cloud map or the displacement curve, which is subjective and prone to errors. The nonconvergence of numerical calculation was selected here as the instability basis of the submarine slope, and the nonconvergence standard was defined through preprocessing to avoid a subjective-judgment-induced error.

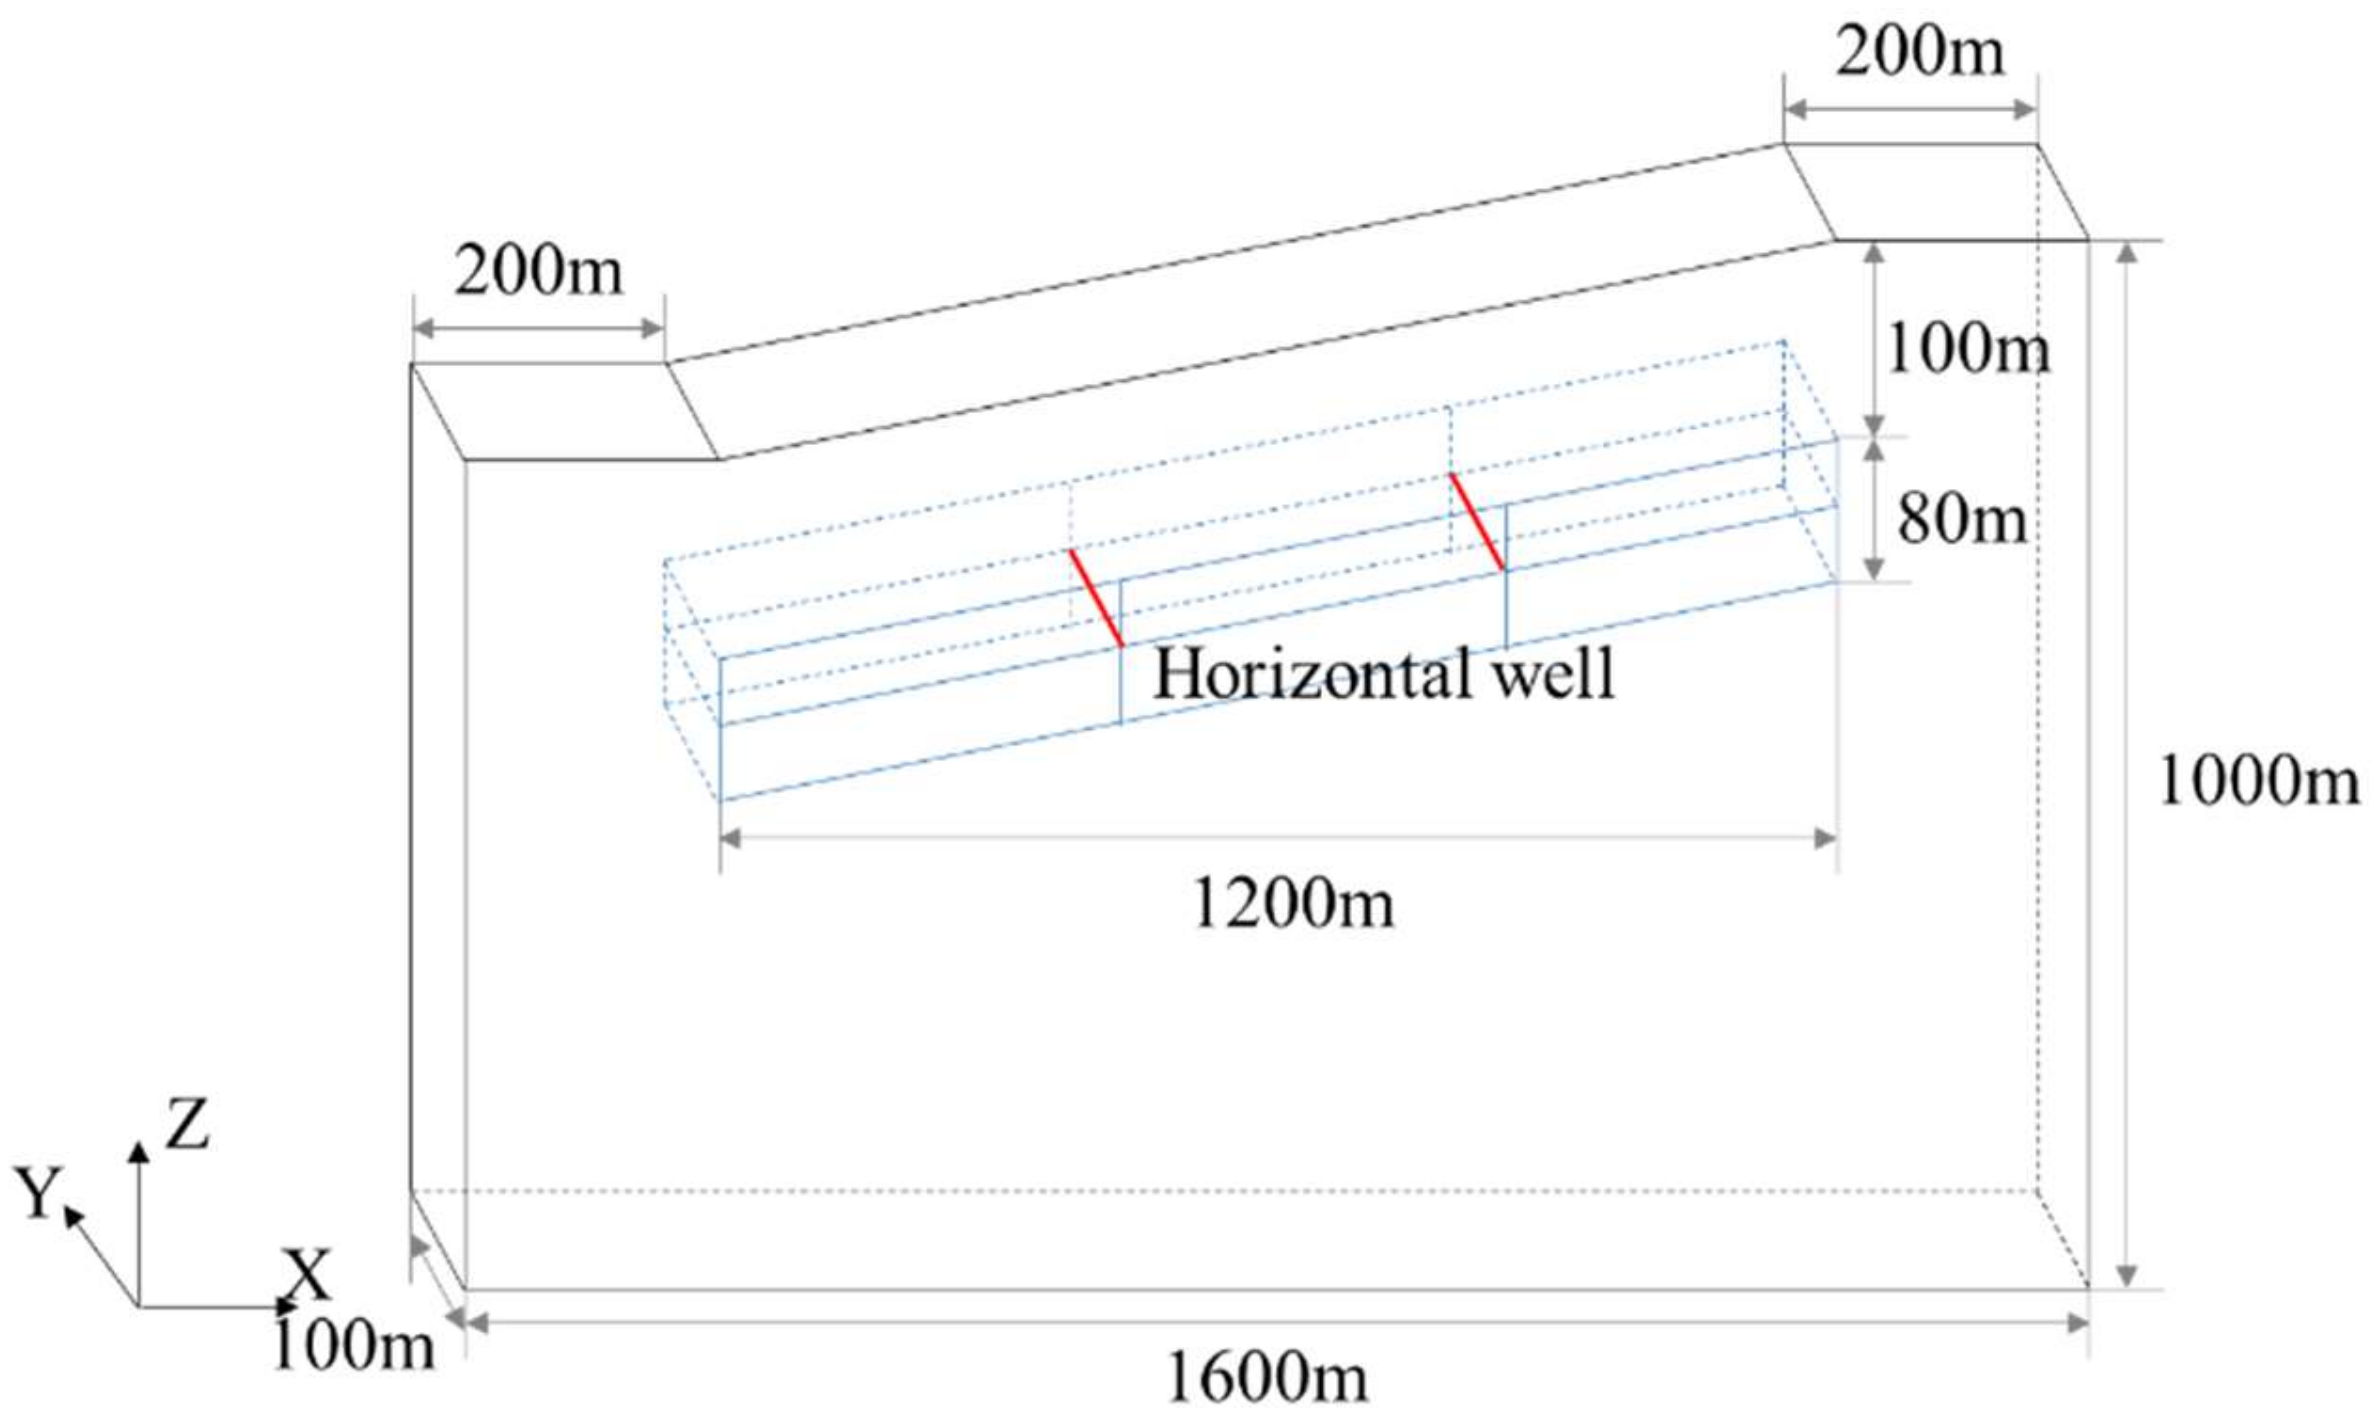
3. Establishment of the Slope Model

Figure 1 shows the schematic diagram of the basic model. The length of the model in the X direction was 1600 m with a thickness of 100 m, and the lengths of the horizontal seabed on the left and right sides were 200 m. On the model’s right-hand side, the height was fixed at 1000 m, while the left-hand side’s height changed with the slope angle, which is 18° in the basic model. The NGH reservoir was 1200 m long in the X direction and ran parallel to the upper surface of the slope. Its thickness and burial depth were 80 and 100 m, respectively. The horizontal seabed on the model’s right-hand side was 1100 m from sea level. The production wells consisted of two horizontal wells at fixed locations. The distance between the right (left) horizontal well and the rightmost (leftmost) boundary of the NGH reservoir was 400 m, and the horizontal wells were placed at half the height of the reservoir. The above model is the basic model, and its parameters, including the burial depth of the reservoir, reservoir thickness, initial saturation of the reservoir, and slope angle, could be modified on the basis of the scheme design. Due to various decomposition rates of NGHs under distinct burial conditions, and to enhance the comparability of different schemes, the decomposition range of NGHs was defined as the maximal range of decomposition front of NGHs around a single well along the slope strike to describe the decomposition degree of NGHs.
Combining the survey data and relevant research on the South China Sea shows that the seabed temperature was 277.15 K and unaffected by water depth. In addition, it was assumed that the geothermal gradient and formation porosity were 35 K·km−1 and 0.4, respectively. Table 1 displays the slope angle, reservoir burial depth and thickness, and initial saturation of the reservoir, while Table 2 reports the remaining parameters [32].
According to the actual occurrence conditions of the submarine slope, the boundary conditions of temperature and pore pressure, and a load of hydrostatic pressure of sea water were applied to the upper surface of the model. The model’s left- and right-hand sides were subjected to displacement boundary conditions and pore pressure. The front and back faces of the model were given displacement boundary conditions. The model’s bottom was exposed to the boundary conditions of displacement, temperature, and pore pressure. Pressure boundary conditions were applied to the horizontal wellbores. Figure 2 illustrates the specific boundary conditions.
A submarine slope model for hydrate mining was built, and subroutines were developed to calculate the dynamic change in the hydrate saturation field during the mining process. Modifying keywords in a simulator enables the dynamic change in reservoir strength parameters with the strength-reduction coefficient and the automatic iteration of the simulator calculation.
Besides the subroutines and modified keywords, the development process for NGH exploitation and slope stability analysis comprises the following steps: (1) the initial hydrate saturation field is passed to subroutines before the hydrate exploitation analysis step is calculated; (2) the subroutine obtains the temperature, pore pressure, and hydrate saturation field of the last time increment step; (3) the phase equilibrium pressure is computed on the basis of the temperature and hydrate phase equilibrium curve; (4) if the phase equilibrium pressure is less than the pore pressure, hydrate formation has occurred, and hydrate saturation is determined at this time; (5) If the phase equilibrium pressure is greater than the pore pressure, hydrate decomposition has occurred, and the hydrate saturation is calculated at this time; (6) the hydrate saturation is updated at the end of the incremental step, the hydrate saturation is assigned to the material parameters, and the hydrate saturation is calculated in the next incremental step.
The solution process for the numerical model of the hydrate mining slope includes three analytical steps. The first step is the initial in situ stress balance. Through the initial in situ stress balance analysis step, a nonmining state with initial stress and no initial strain can be determined, which is consistent with the actual situation. The initial in situ stress balance is required for accurate simulation. On the basis of the initial in situ stress balance, the analytical step of hydrate production was conducted. Reducing the wellbore pressure of the production well destroys the hydrate phase equilibrium conditions and promotes hydrate decomposition for hydrate depressurization production. The third step is to calculate the safety factor of the slope. When the slope is unstable, the safety factor is determined through the continuous increase in the reduction factor, the dynamic change in the reservoir strength factor, and the automatic iteration of the calculation. The impact of various factors on the stability of submarine slope is analyzed using the safety factor as the quantitative index.

4. Formation Responses in the Mining Process of NGHs

The formation responses in the mining process of NGHs are investigated utilizing the basic model as an example.

4.1. Dynamics during Decomposition of NGHs

In the basic model, the depressurization method mines NGHs under production pressure of 10 MPa. Figure 3 shows the cloud illustration of the distribution of NGH saturations corresponding to various decomposition ranges of NGHs. After the pressure propagates to the interior of the reservoir, NGHs are decomposed. The deeper a formation is, the higher the formation temperature and the easier the decomposition of NGHs are, so the decomposition rate of NGHs in the deep part of the formation is greater than that in shallow formation. Therefore, the decomposition range of NGHs is nonuniformly distributed in the space and shown as an irregular triangular prismatic shape. First, NGHs in deep formation are decomposed, followed by those on both sides of the wells. The distribution of NGH saturations in the cloud picture indicates a transitional zone in front of the decomposition front of NGHs, in which NGHs are not completely decomposed. Due to the superposition of pressure drops, NGHs between the two wells decompose at significantly higher degrees than those on other sides of the wells. The saturation of NGHs gradually increases from the wellbores to the distant formation, which is attributed to the effect of the pressure drop transfer. As the decomposition range of NGHs progressively grows, the pressure propagates to a larger range, hindering the pressure drop at the wellbores from reaching the distant formation. The pressure drop at the decomposition front gradually reduces, so the further apart the wells are, the more challenging it is to decompose NGHs.
Figure 4 shows the decomposition ranges of NGHs after different mining durations. The decomposition rate of NGHs first increases and then decreases. It takes 220 days to decompose NGHs at a distance of 50 m. To decompose NGHs in the range of 150 m needs 430 days, and it requires 720 and 1200 days to form decomposition ranges of 250 and 350 m, respectively. Because NGHs are present in the reservoir pores as a solid during the early mining period, the initial and effective porosities of the reservoir are low, and the pressure drop fails to rapidly propagate to the deep reservoir. As the NGHs are decomposed to liquid, the reservoir’s permeability and effective void ratio gradually grow, allowing for the pressure drop to propagate effectively to the deep reservoir. With the constant expansion of the decomposition range, the propagation distance of pressure constantly increases, the pressure drop at the decomposition front of NGHs reduces, and the decomposition rate of NGHs slows down.

4.2. Evolution of the Physical Parameters of the Formation

The pore pressure distribution at different time moments indicates a correlation with the pattern of NGH saturations. When the pore pressure of NGHs dropped below the phase equilibrium pressure, the NGHs began to decompose. As shown in the cloud diagram for pore pressure distribution (Figure 5), the pressure drop propagated around the wellbores and formed cylindrical high-pressure-drop zones, while the saturation of NGHs was distributed in a triangular prismatic shape. Comparing the spatial distribution of pore pressure and NGH saturations reveals that the geothermal gradient influenced the decomposition of NGHs. Accordingly, the pore pressure distribution at various moments when the pressure drop propagated rapidly in the NGH reservoir and gradually transmits to a distant formation. However, due to the low permeability of the overlying and underlying sediment layers, the pressure drop propagated in a small range in the overlying and underlying strata.

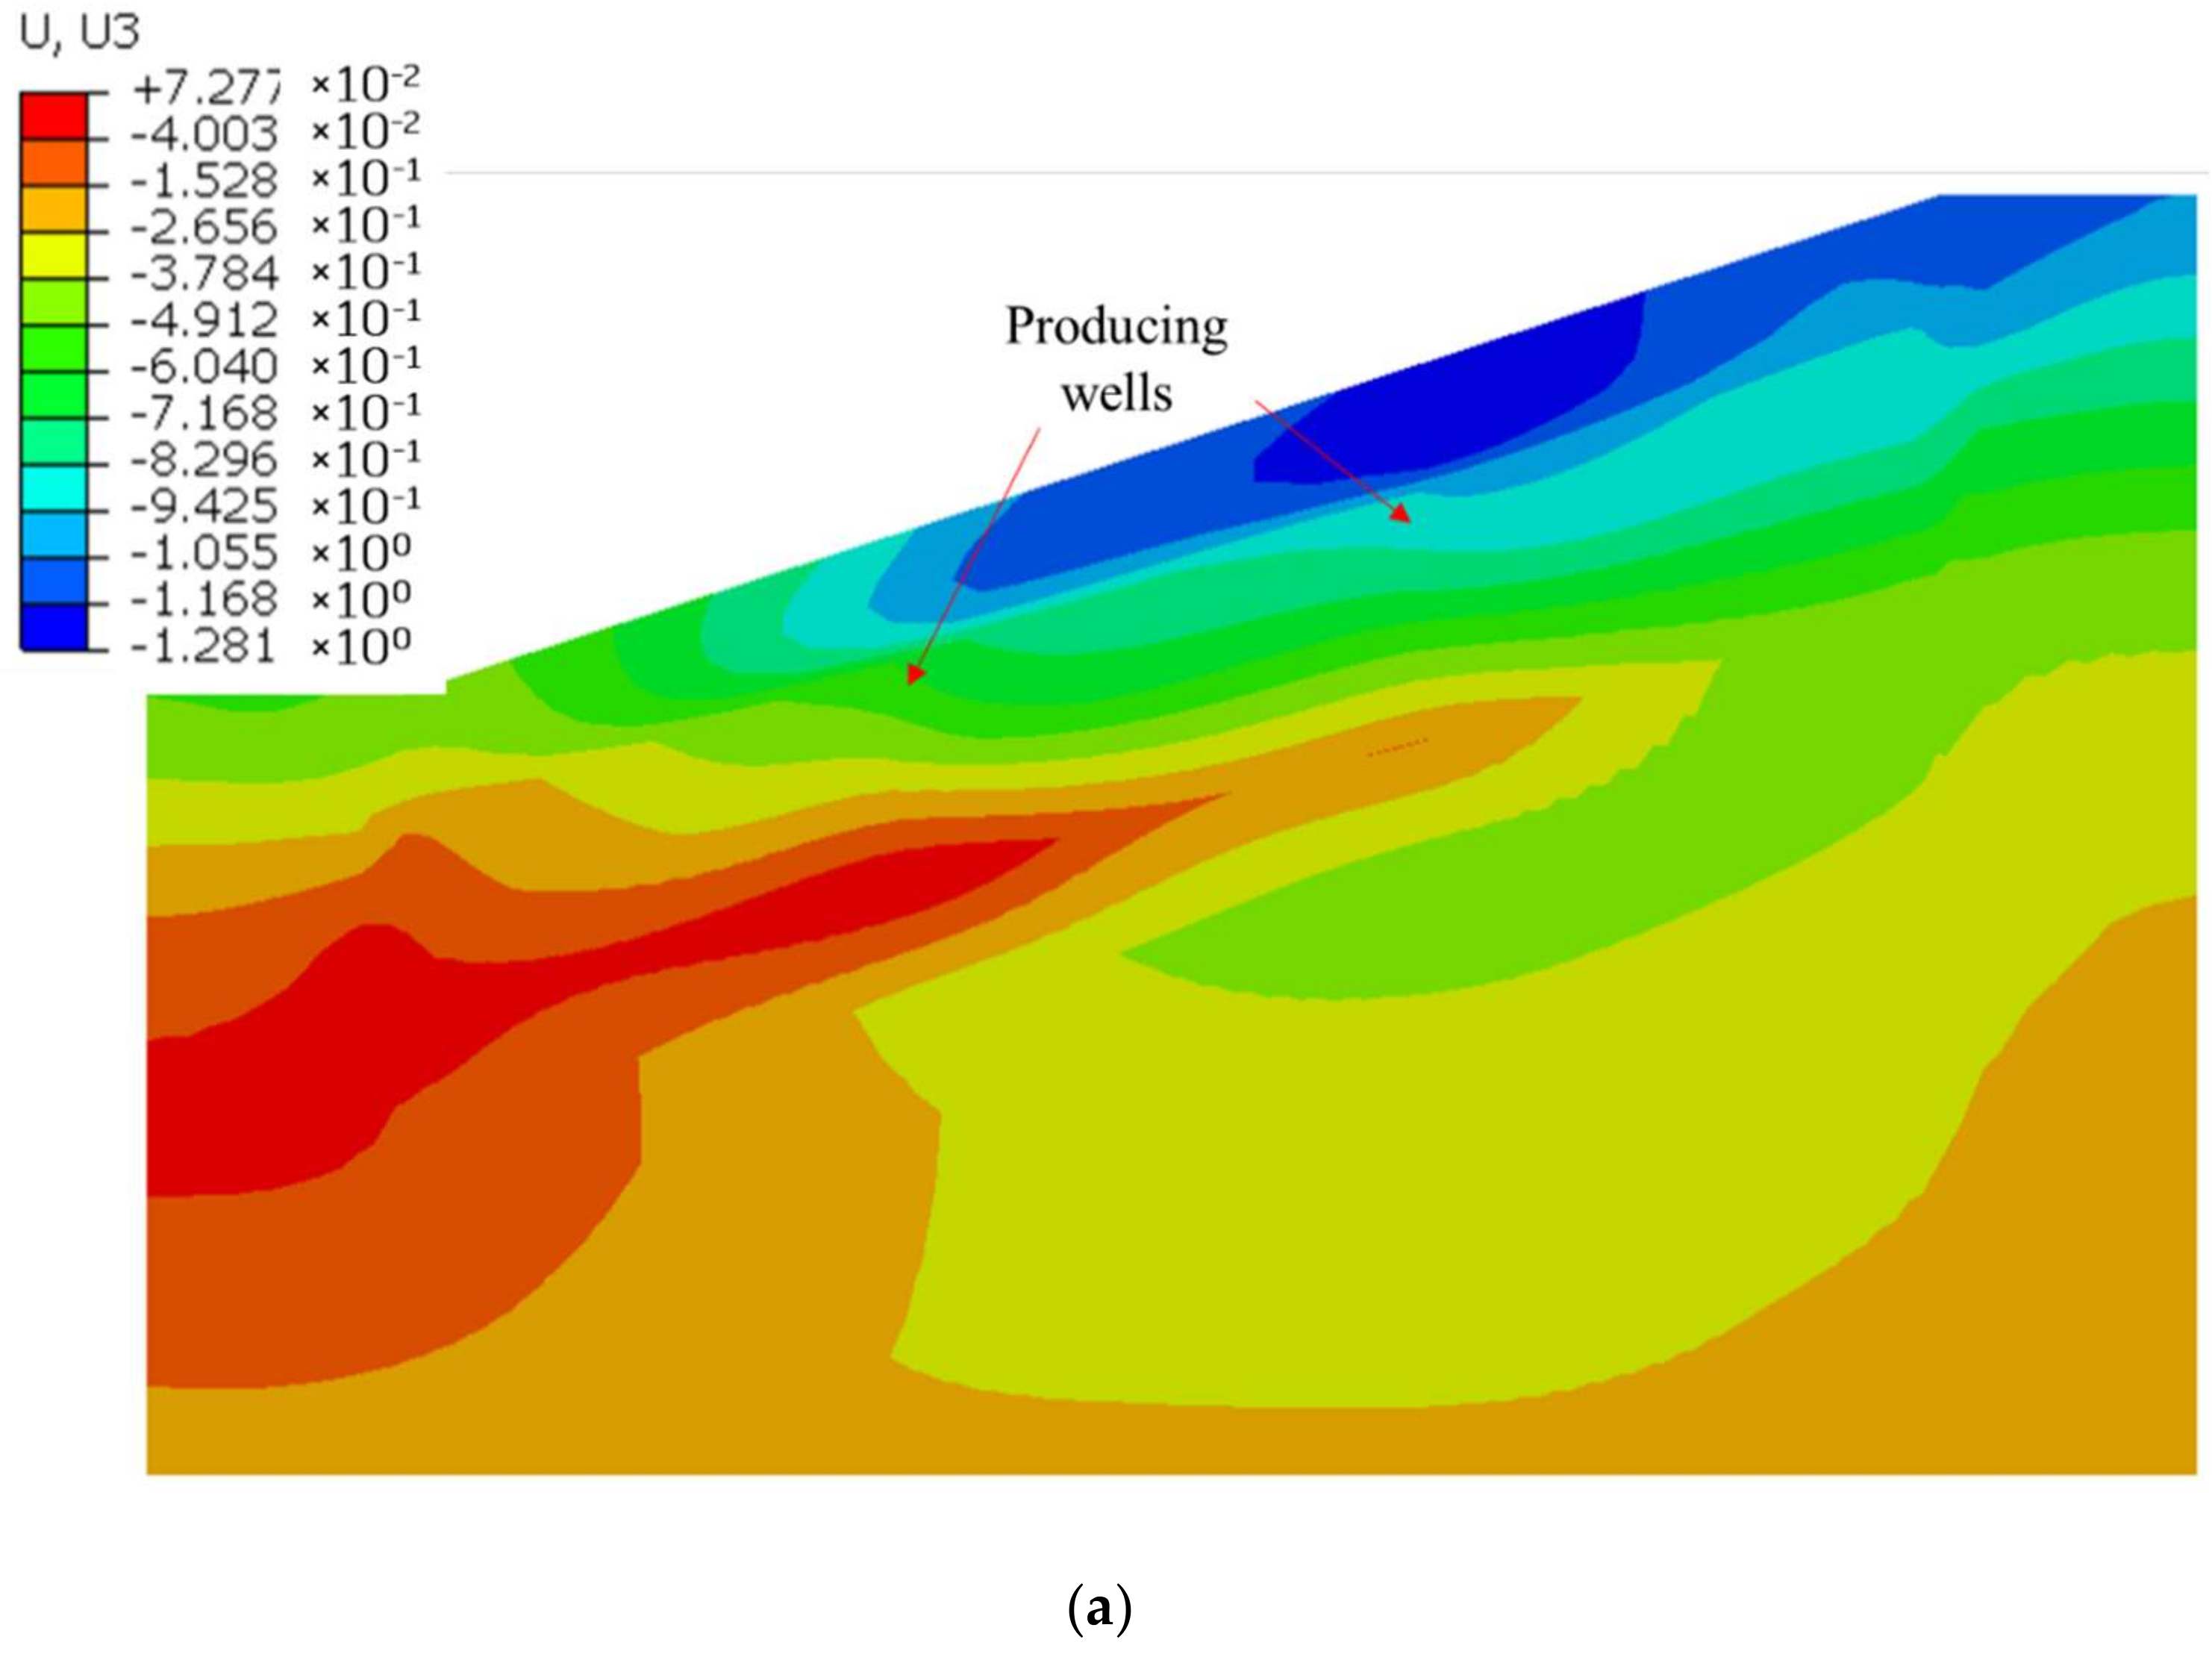
4.3. Deformation Responses of the Formation

After NGHs are decomposed in some areas, stress is concentrated at the decomposition front of NGHs, and effective stress in the decomposition range of NGHs increases due to a decrease in pore pressure. Under high effective stress, the reservoir around the wells is compacted, forming a deformation in the slope, the settlement of the submarine slope, and even submarine landslides.
Figure 6 shows a cloud representation of vertical displacement and the total displacement vector. It reveals that the area above the horizontal wells settled downward, whereas areas diagonally above the horizontal wells slid in the direction of the wells, with a maximal total displacement of 1.308 m and the greatest settlement of 1.281 m. After the decomposition of NGHs, the reservoir’s strength reduces, and the extrusion of horizontal stress lifts the underlying formation. The slope formation settles in the mining process of NGHs, which also triggers the transverse slip of the surrounding formation.

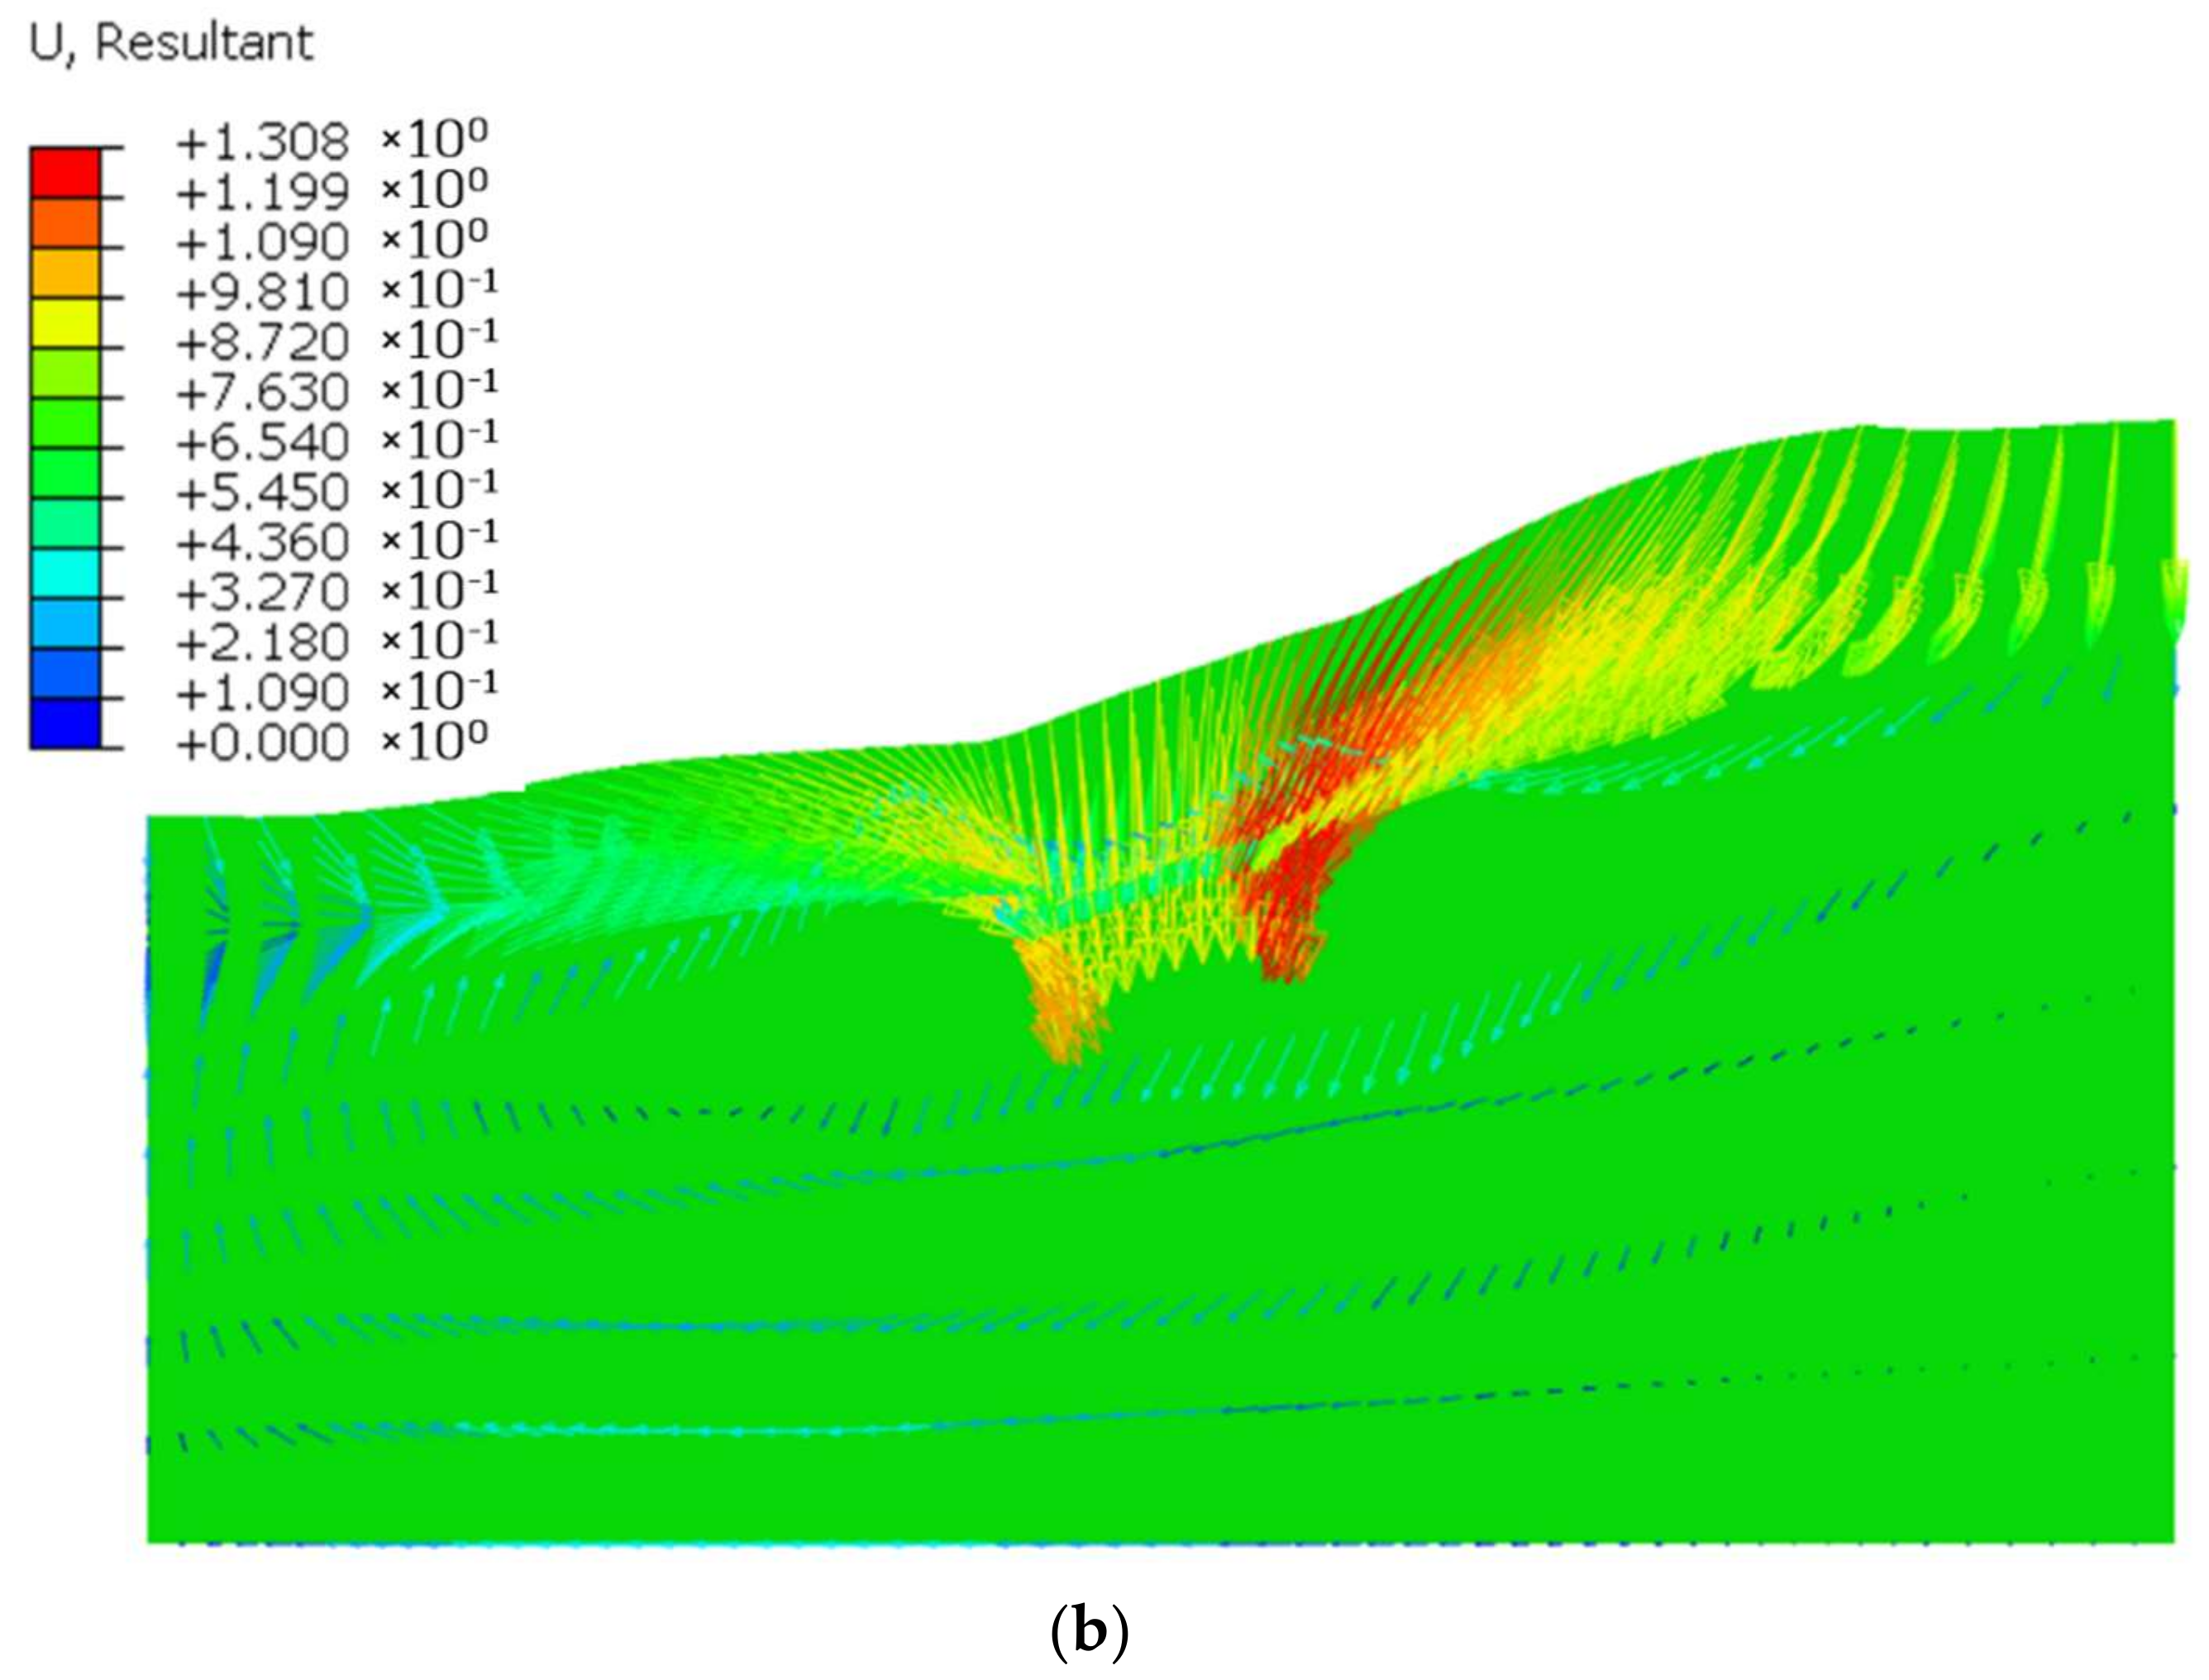
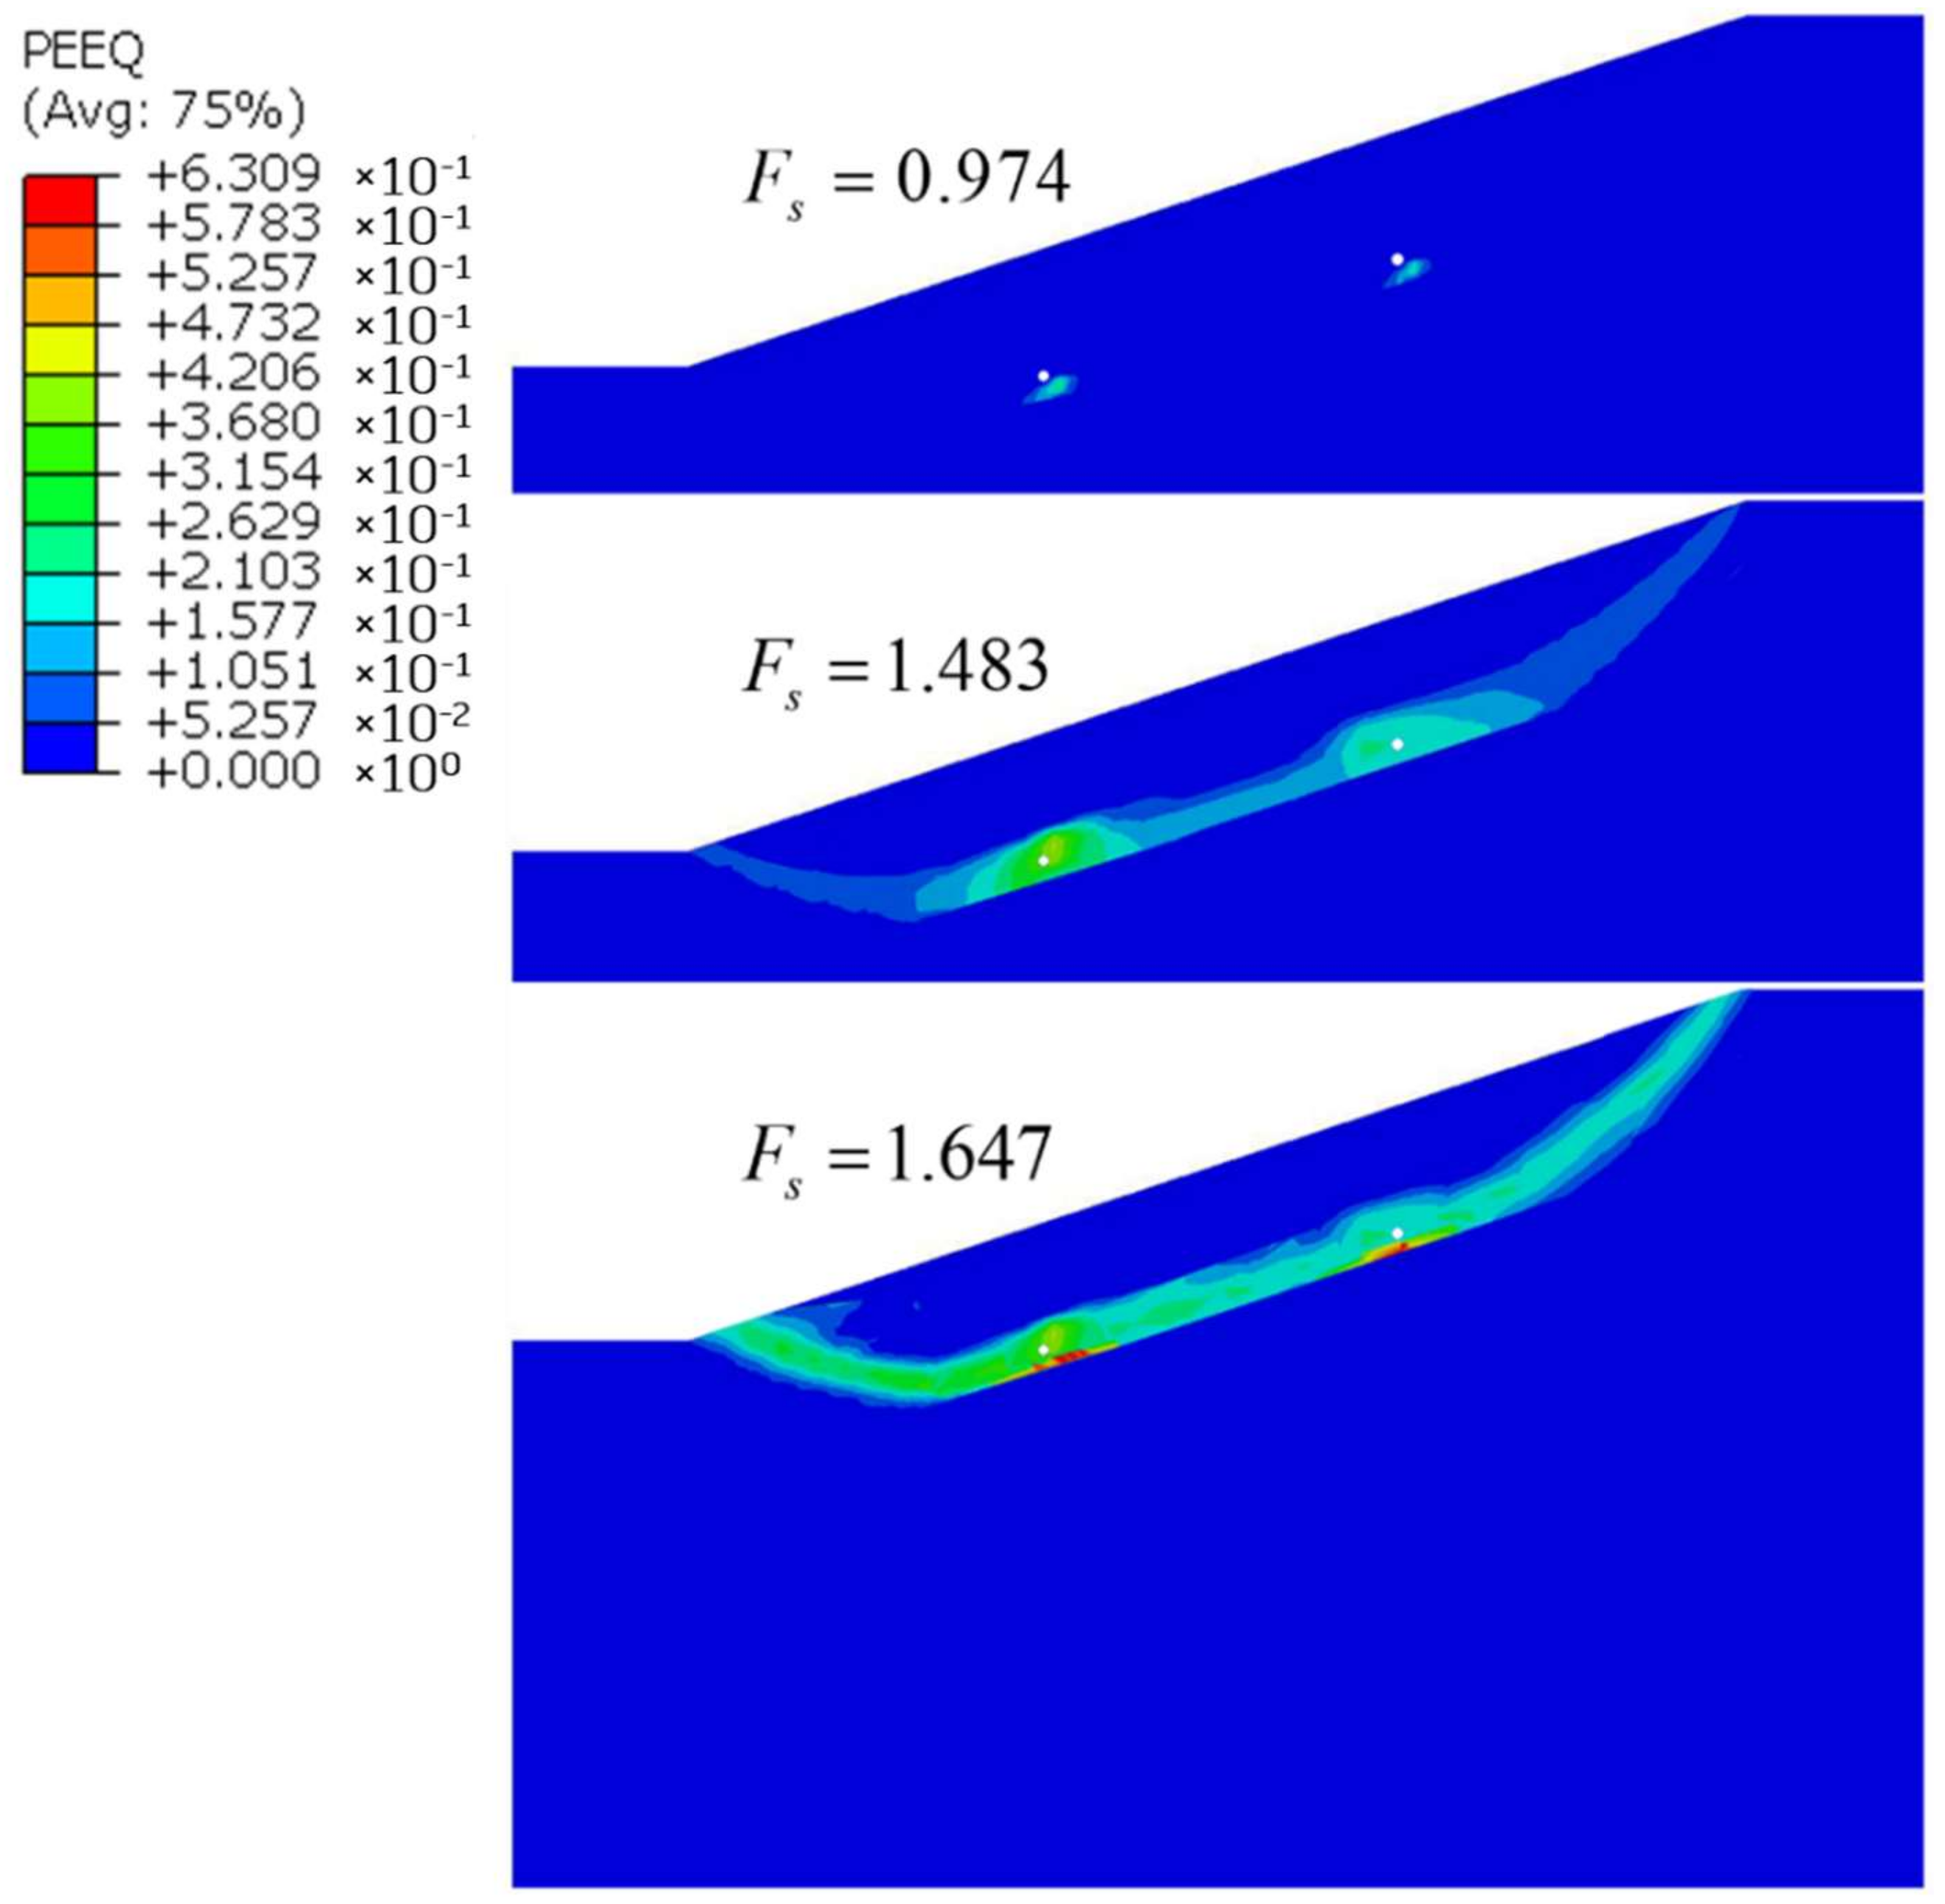
4.4. Failure Process of the Slope

When the pressure applied by loads to the slope surpasses its ultimate bearing capacity, plastic zones indicate that unrecoverable yield zones begin to appear in local slope areas. Under this condition, the slope starts to be damaged, and failure occurs when the plastic zones coalesce. Figure 7 displays the development process of plastic zones corresponding to various reduction coefficients. The strength of the reservoir is reduced significantly after the regional decomposition of NGHs. Therefore, plastic zones first arise in the decomposition zone of NGHs as the strength reduction coefficient grows, and these zones then gradually spread to the slope shoulder and toe, forming a coalesced plastic zone.
When the reduction coefficient was F r = 0.974, plastic zones emerged in the decomposition zone of NGHs, and the slope was not deformed. As the reduction coefficient continued to rise, the shear strength of the slope was reduced, the range of plastic zones expanded, and plastic deformation intensified. When the reduction coefficient was F r = 1.647 the plastic zones centered on the decomposition zone of NGHs progressively developed to the slope shoulder and toe to form a coalesced zone. When the calculation terminated, the coalesced plastic zone ran through the slope shoulder and toe and the NGH zone, and a large submarine landslide occurred throughout the slope shoulder and toe. Under this condition, the strength reduction coefficient equaled the safety factor of the slope.

5. Influences of Burial Conditions on the Stability of the Submarine Slope

The stability of the submarine slope is related to the NGH burial condition. The basic model is proposed to study this relationship in the mining process of NGHs, and reveal the impact of the burial depth, thickness, and initial saturation of the reservoir, and slope angle on the stability of the submarine slope.

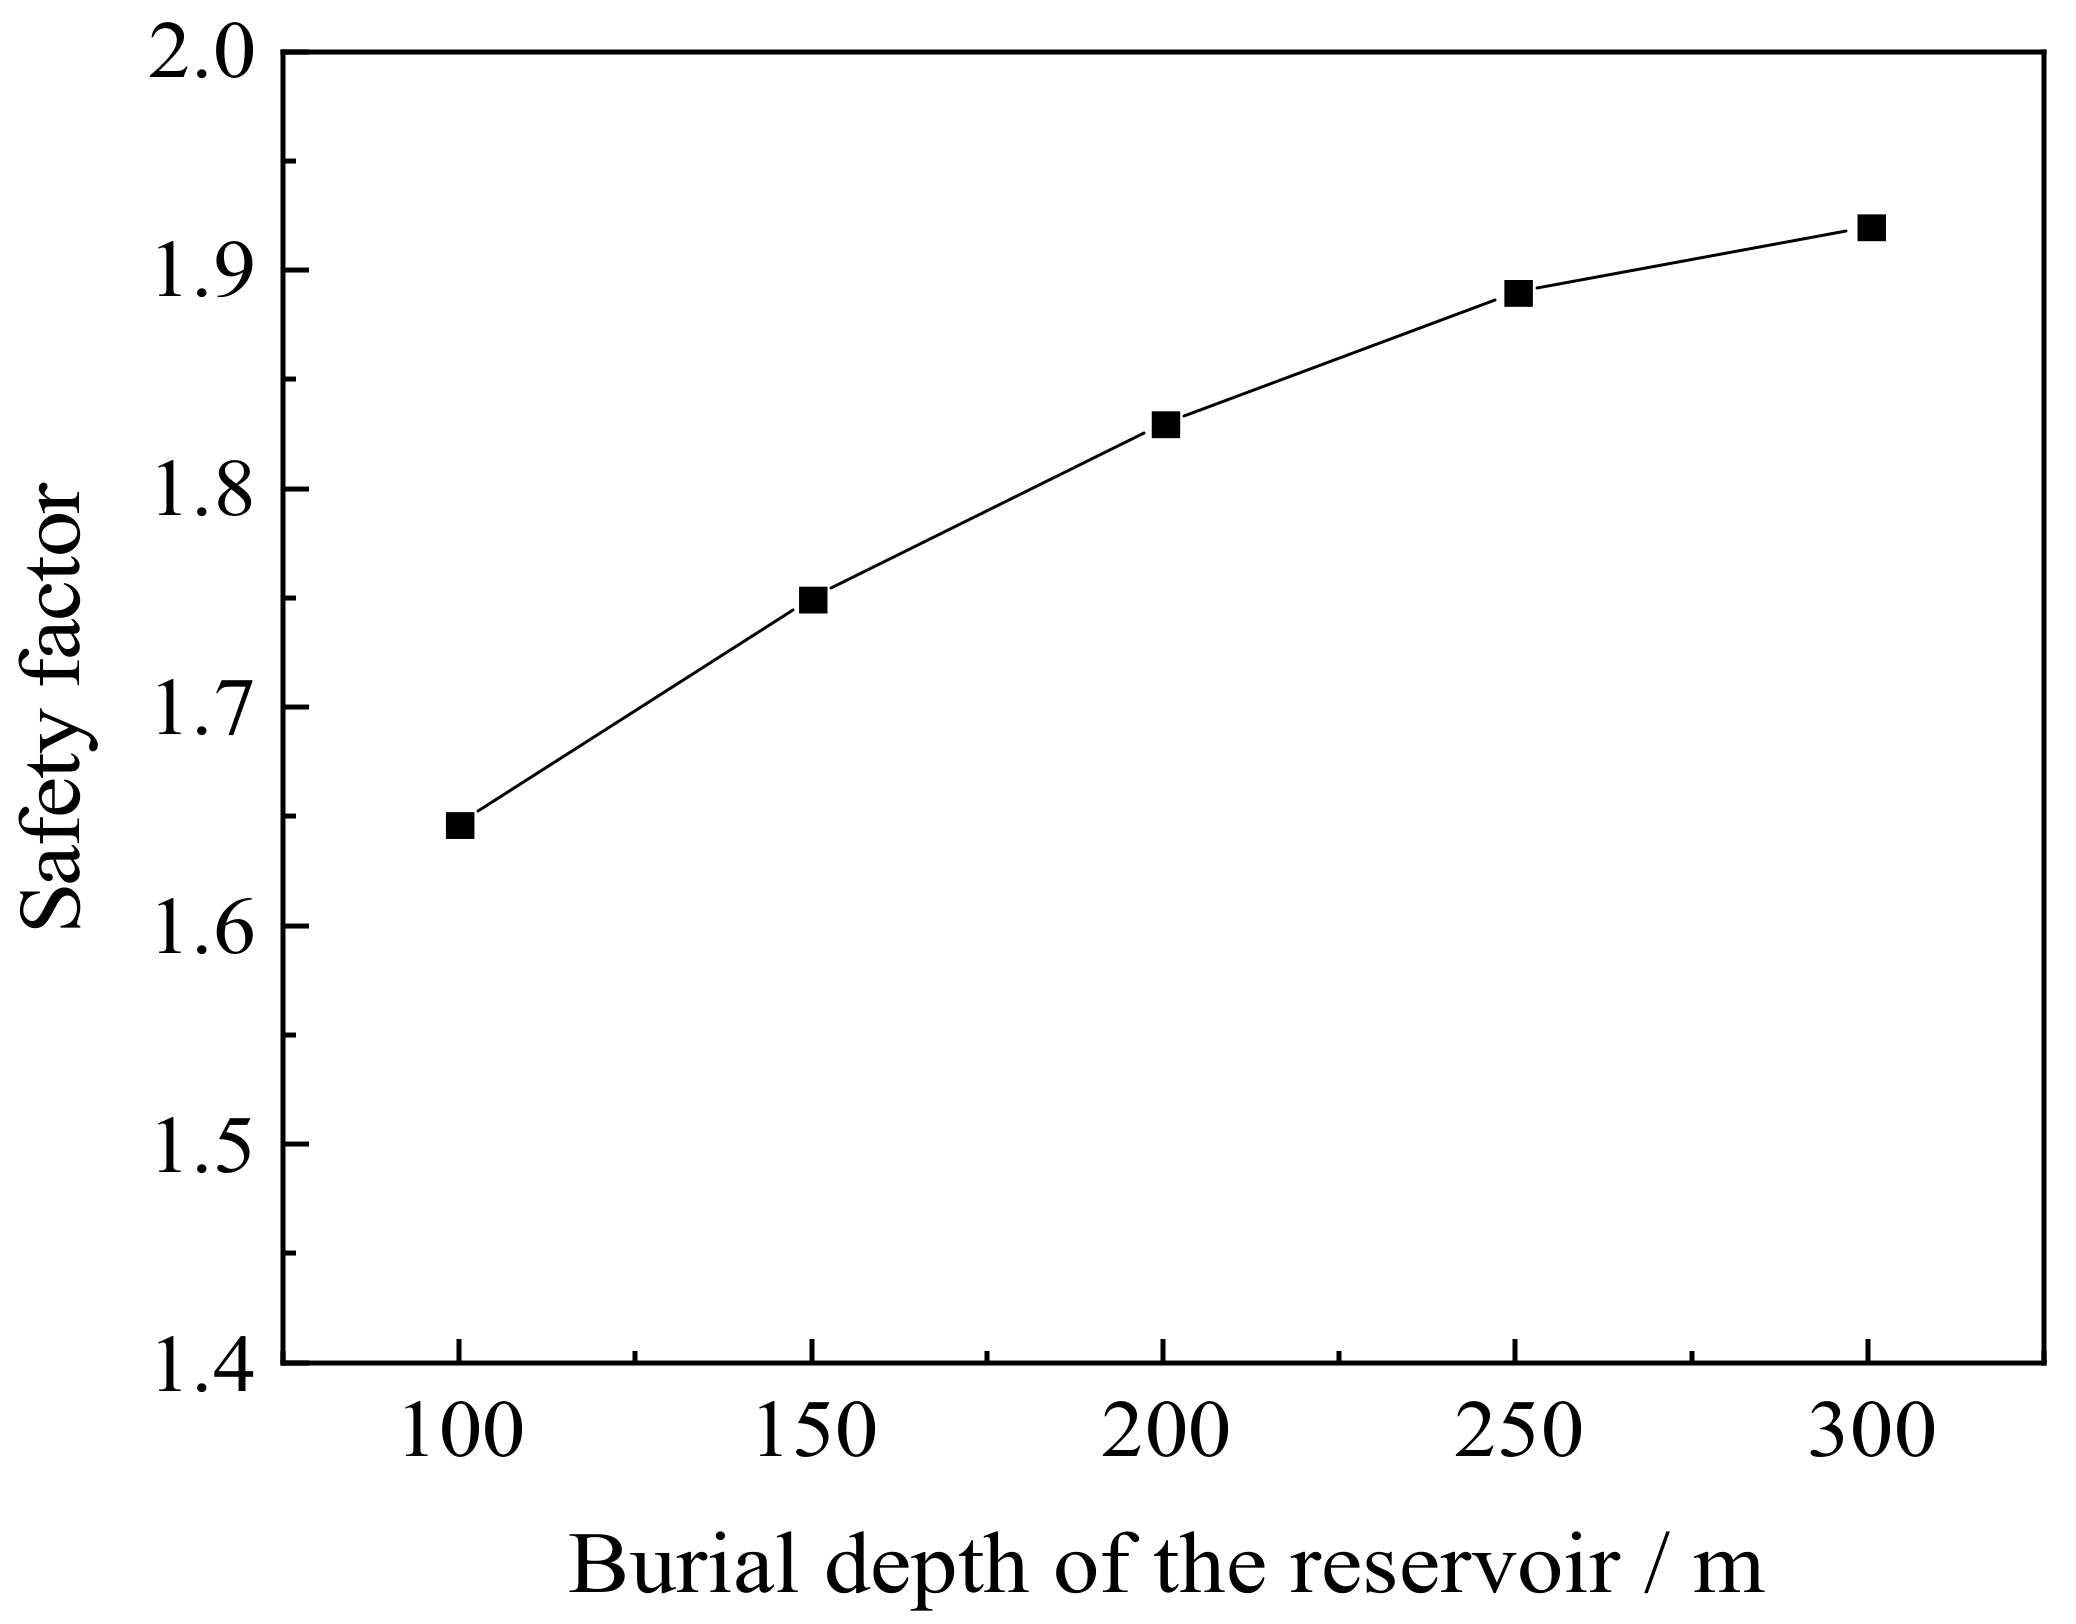
5.1. Burial Depth of the NGH Reservoir

This section investigates the influences of the NGH reservoir burial depth on the stability of the submarine slope on the basis of the depressurization model, and the decomposition range of NGHs was 150 m. Figure 8 depicts the relationship between burial depths and safety factors. The safety factor was the smallest (1.647) when the burial depth of the reservoir was 100 m. On the other hand, when the burial depth increased over 100 to 300 m, the safety factor of the slope increased, while its increase rate gradually dropped. Settlement curves corresponding to different burial depths of the reservoir (Figure 9) show that the settlement curves of the seabed surface are not symmetric about the production wells due to influences of the slope angle. The positions above the production wells had the maximal settlement. The maximal settlement of the seabed was reduced with the increase in the reservoir’s burial depth, and the maximal settlement reached 1.657 m when the burial depth was 100 m.
The area of the submarine landslide caused by the decomposition of NGHs was mainly located in the NGH reservoir and the overlying strata. Plastic zones in the slope first appeared in the NGH reservoir and gradually developed into the NGH reservoir and the overlying strata, causing the landslide. As the burial depth of the NGH reservoir increased, the coalesced plastic zone formation stopped unless the decomposition range of NGHs was enlarged. Thus, the larger the burial depth is, the less prone to failure it is. Nevertheless, a further increase in the burial depth of NGHs does not intensify its impact on slope stability, which is consistent with the research results of Zhang [33]. Accordingly, there was a critical burial depth for NGH reservoirs, and once the critical value had been reached, the decomposition of NGHs exerted slight influences on the safety factor of the slope.

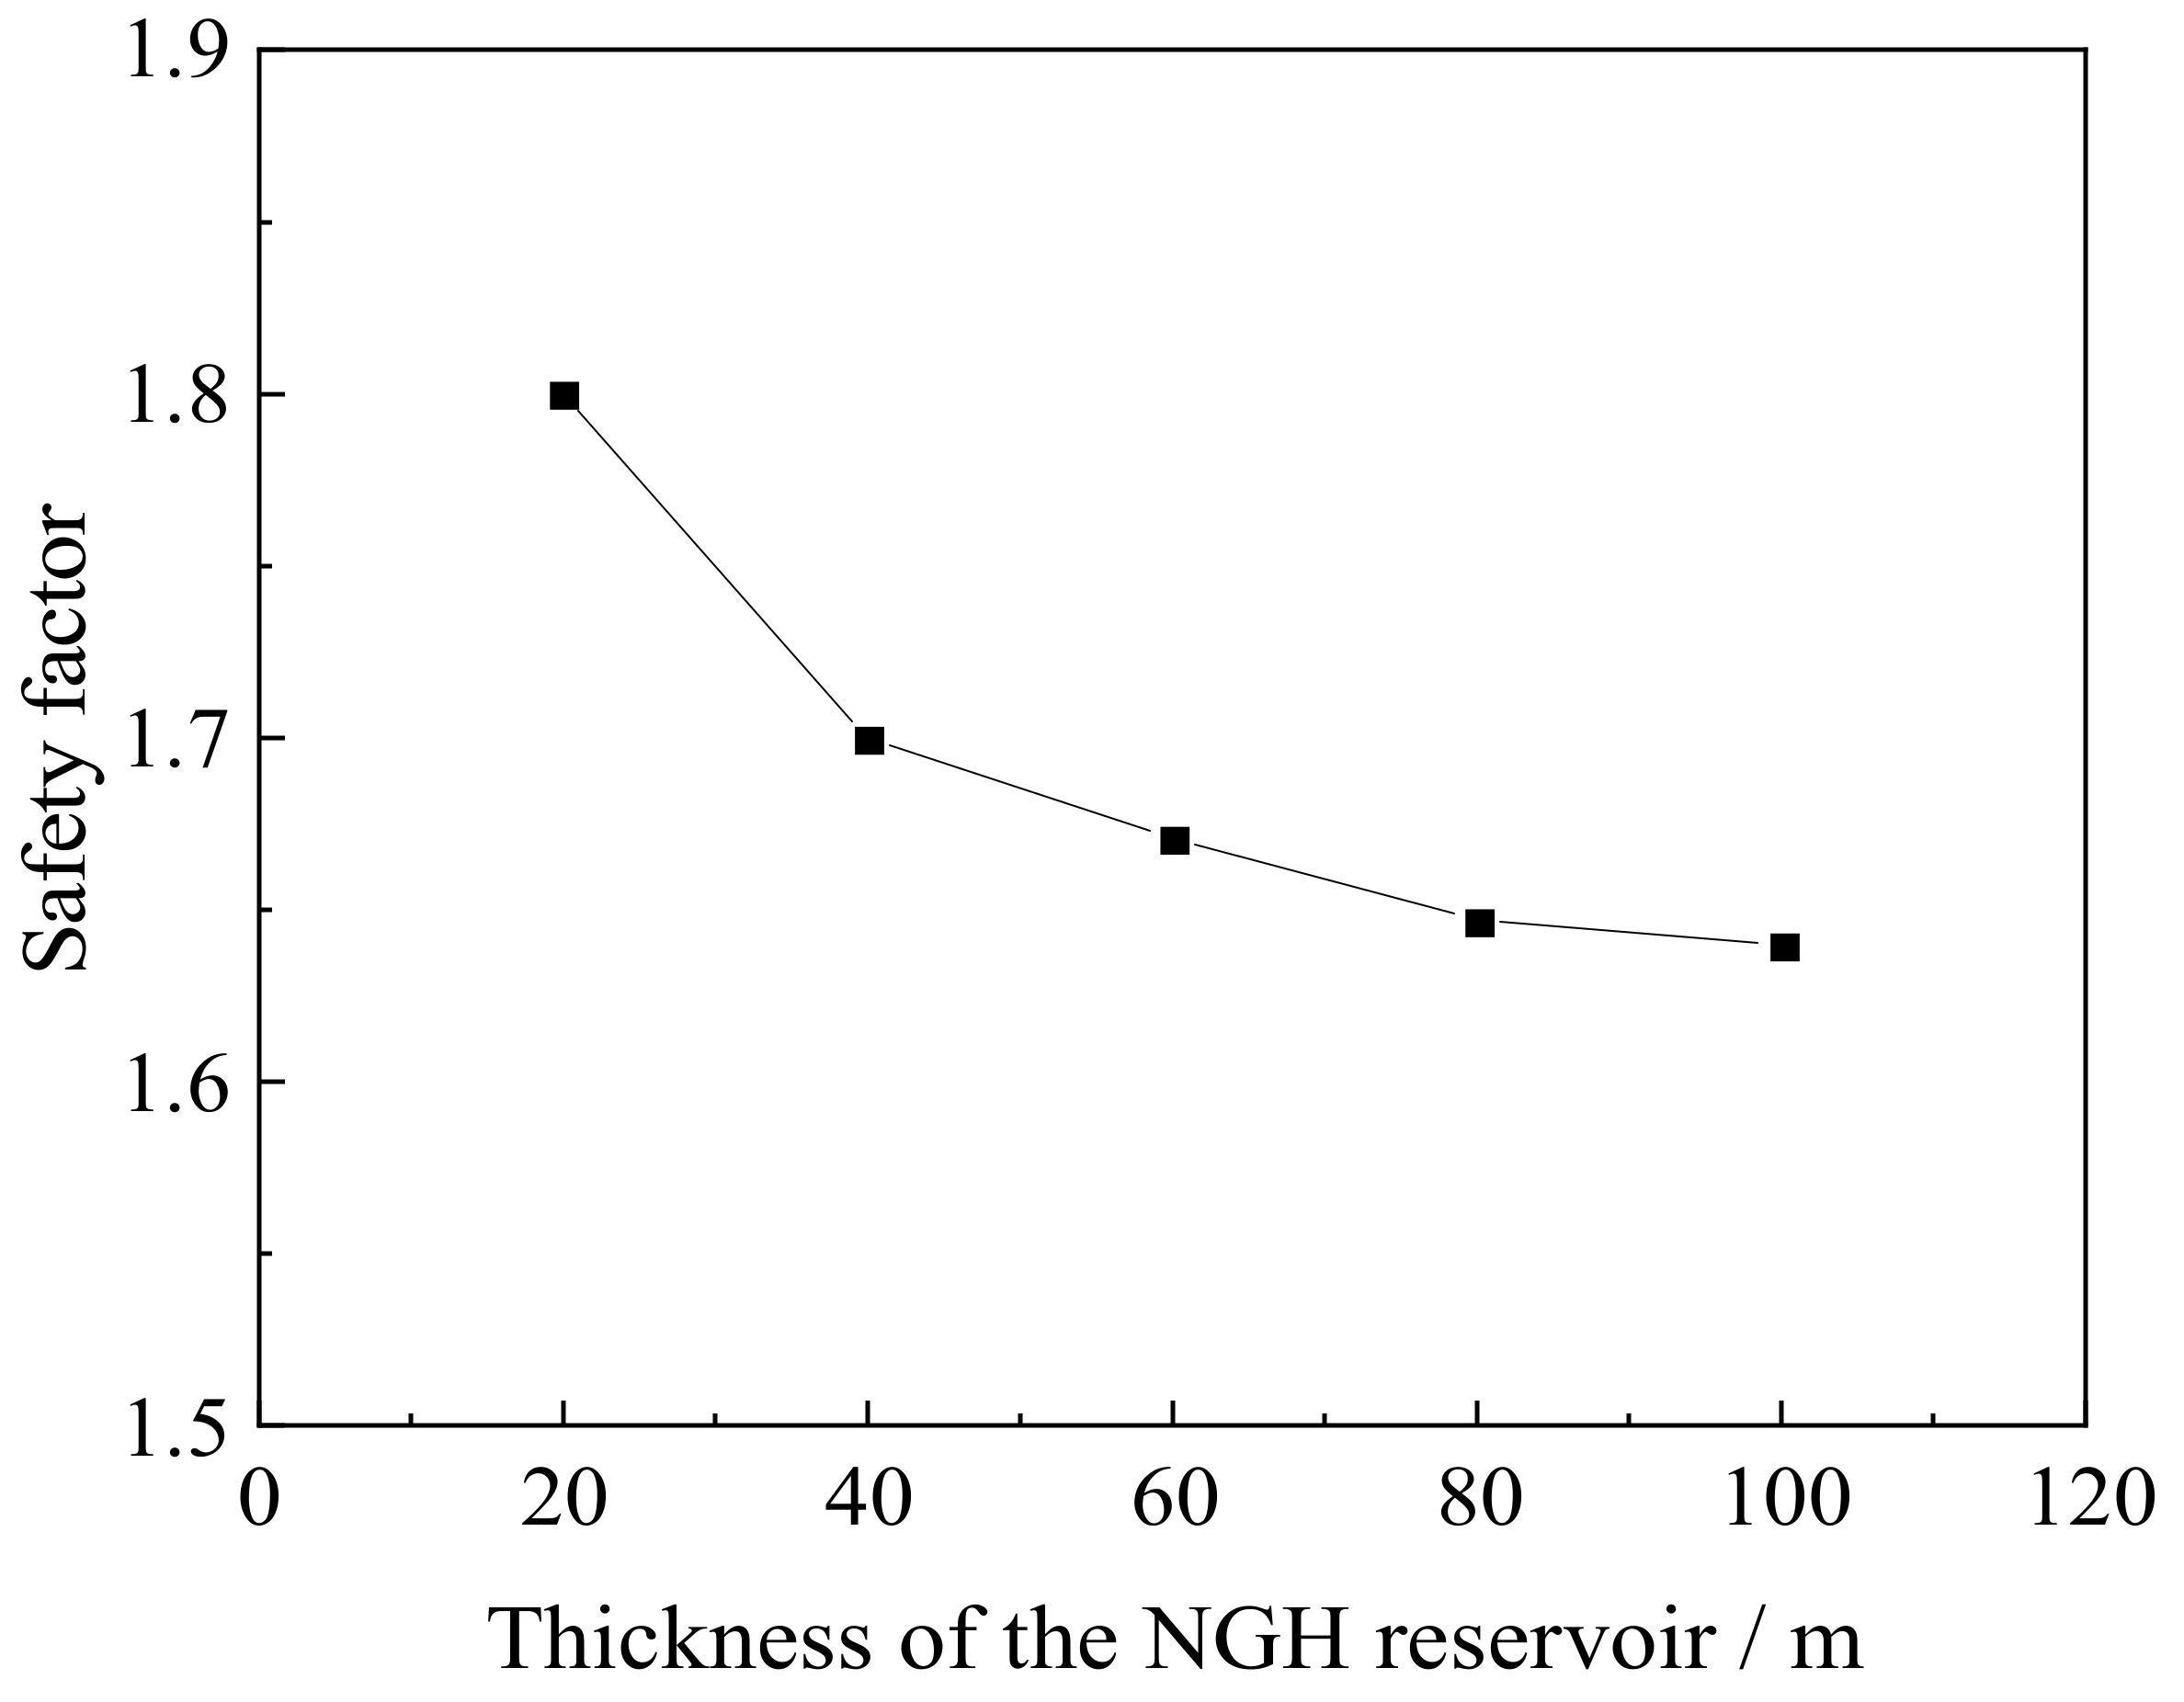
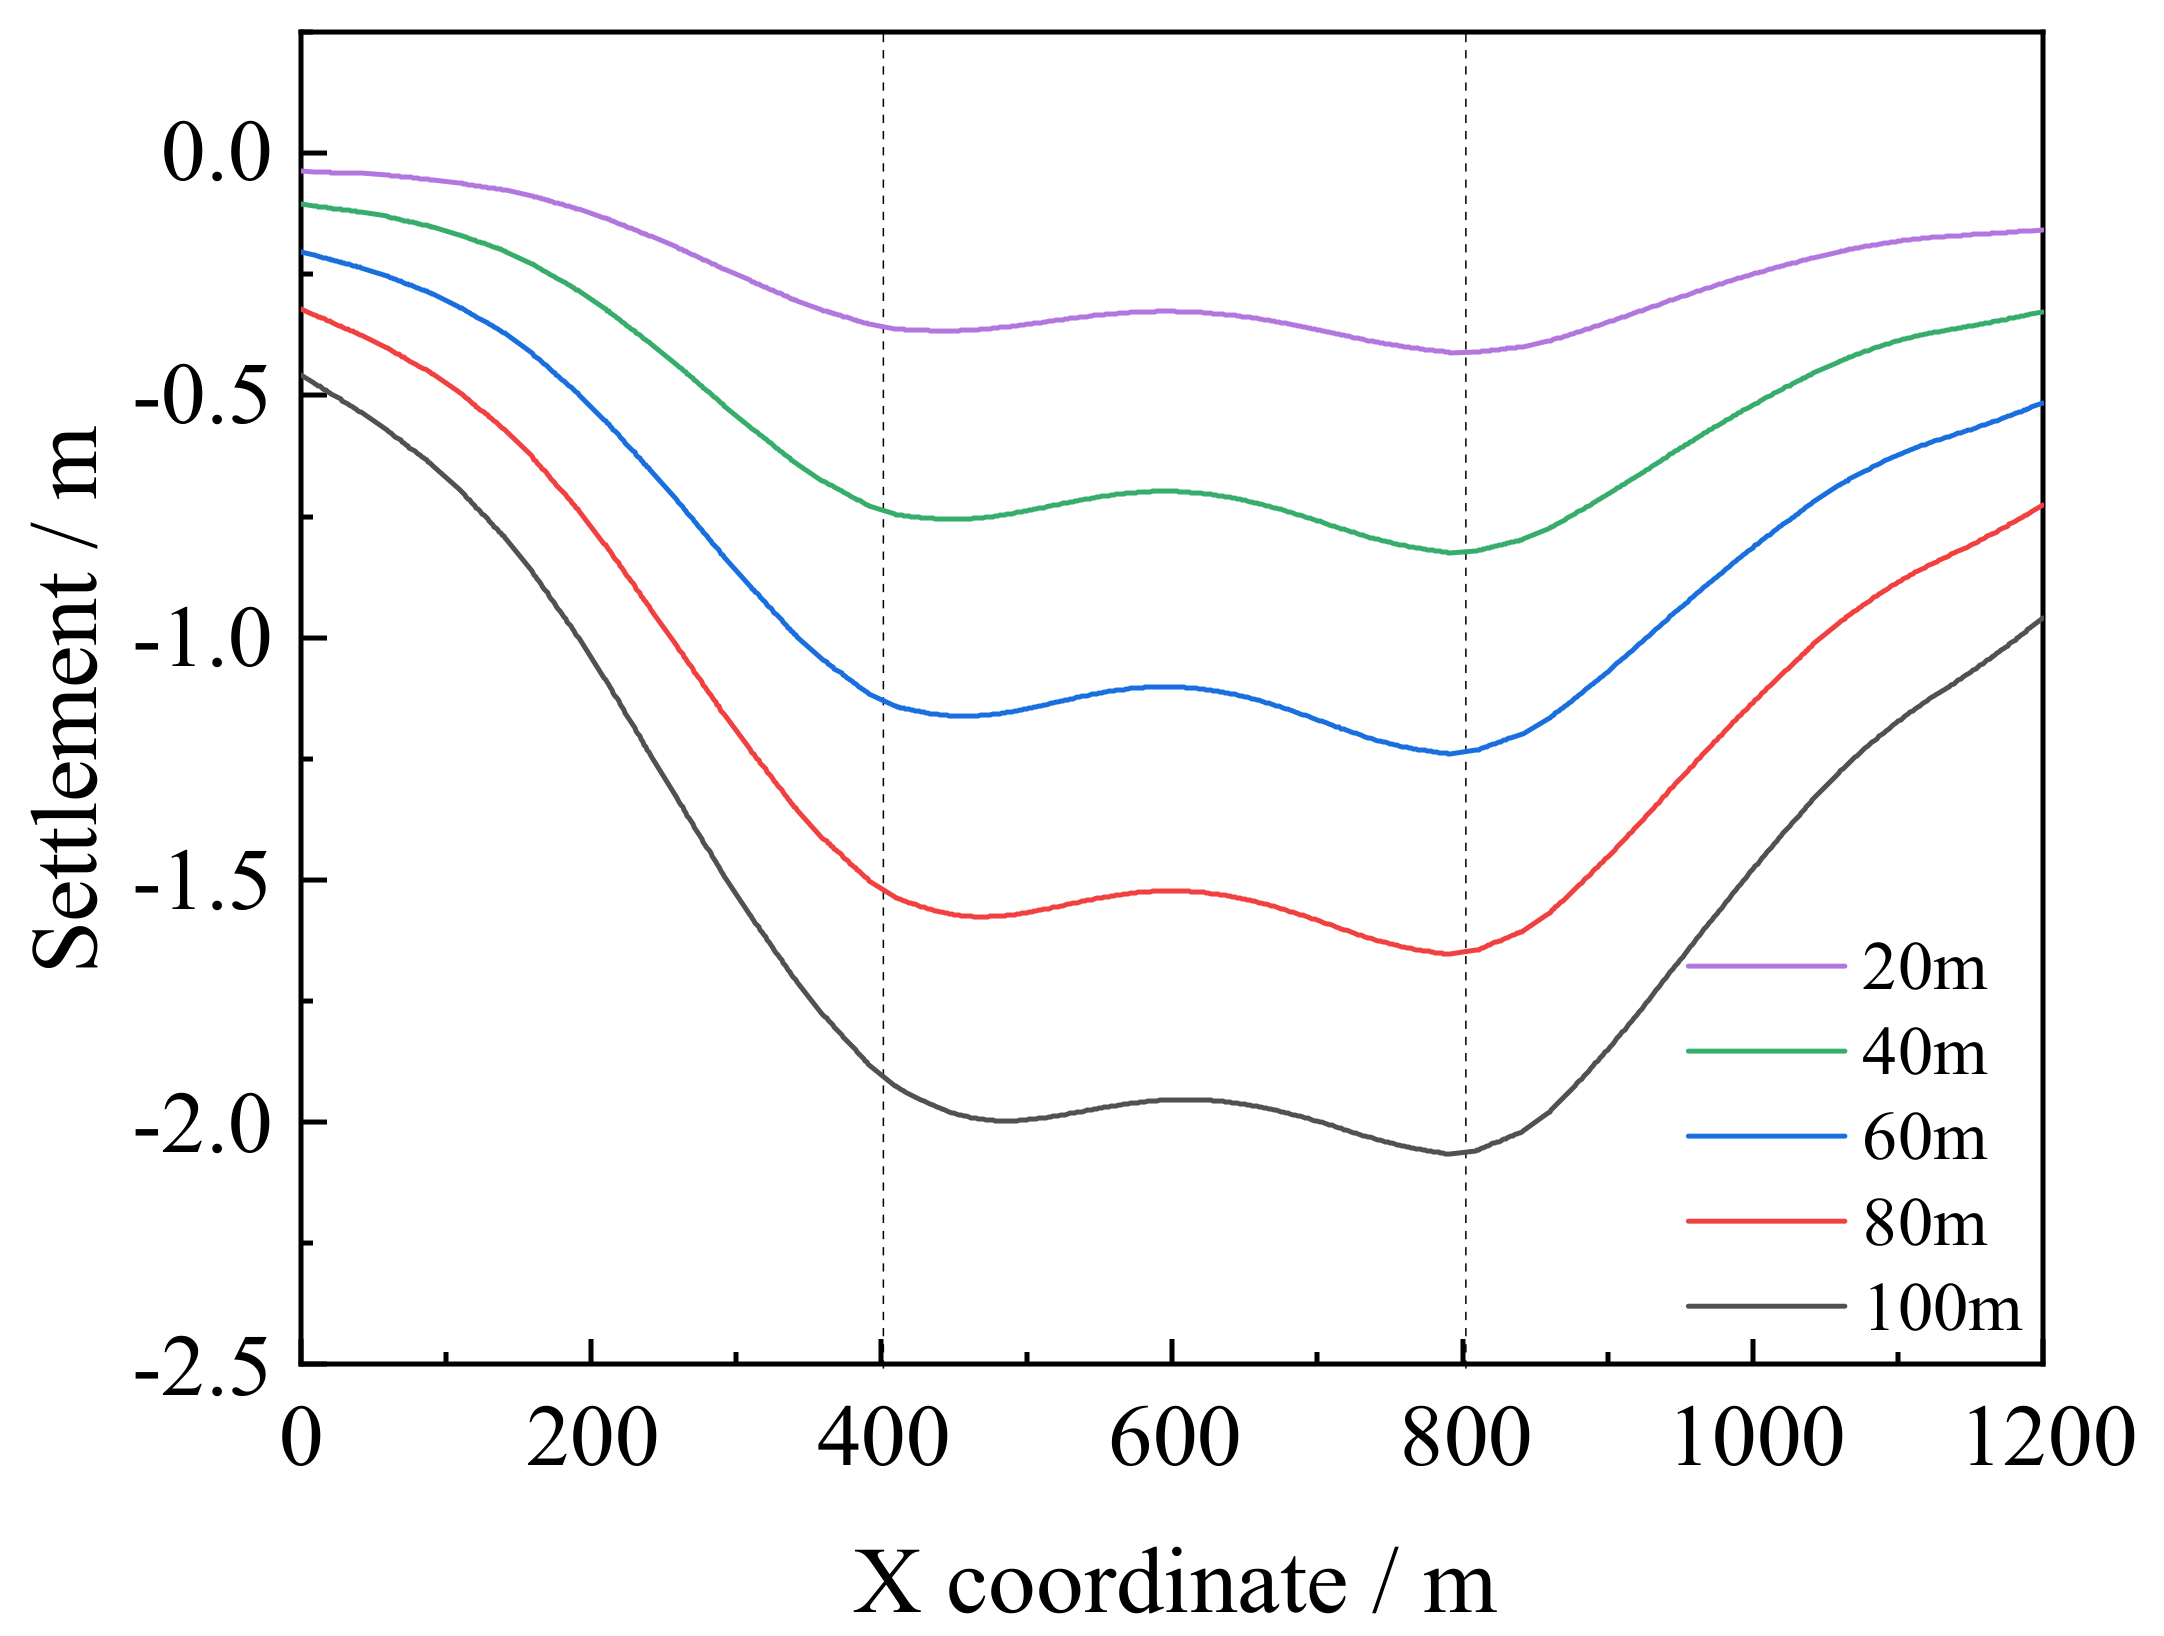
5.2. Thickness of the NGH Reservoir

On the basis of the depressurization model, the influences of the NGH reservoir’s thickness on the slope stability are studied for a decomposition range of NGHs of 150 m. Figure 10 shows that the safety factor was the lowest at 1.64 when the reservoir thickness was 100 m, the safety factor was reduced with an increase in reservoir thickness between 20 and 100 m, and the reduction rate of the safety factor decreased with an increase in thickness. After NGH decomposition, the strength of the NGH reservoir decreased significantly, and the strength of the reservoir’s decomposition range was reduced below the overlying and underlying strata, which was equivalent to the presence of a soft substratum in the slope. The larger the NGH reservoir’s thickness was, the thicker the soft substratum in the slope after NGHs decomposition was, which rendered the range of formation more prone to plastic yield growth, the coalesced plastic zone more likely to appear, and the slope failure risk higher. As the reservoir thickness grew, the slope’s safety factor’s reduction rate slowed down because the more distant the production wells are during depressurization, the smaller the pressure drop and the NGHs decomposition range relative to the whole NGH reservoir are. According to the settlement curves corresponding to different reservoir thicknesses in Figure 11, the maximal settlement of the seabed grew with the increase in reservoir thickness. The maximal settlement reached 2.07 m when the reservoir thickness was 100 m because the thicker the reservoir is, the thicker the decomposition range of NGHs, the larger the height of the extrusion deformation zone, and thereby the larger the maximal settlement are.

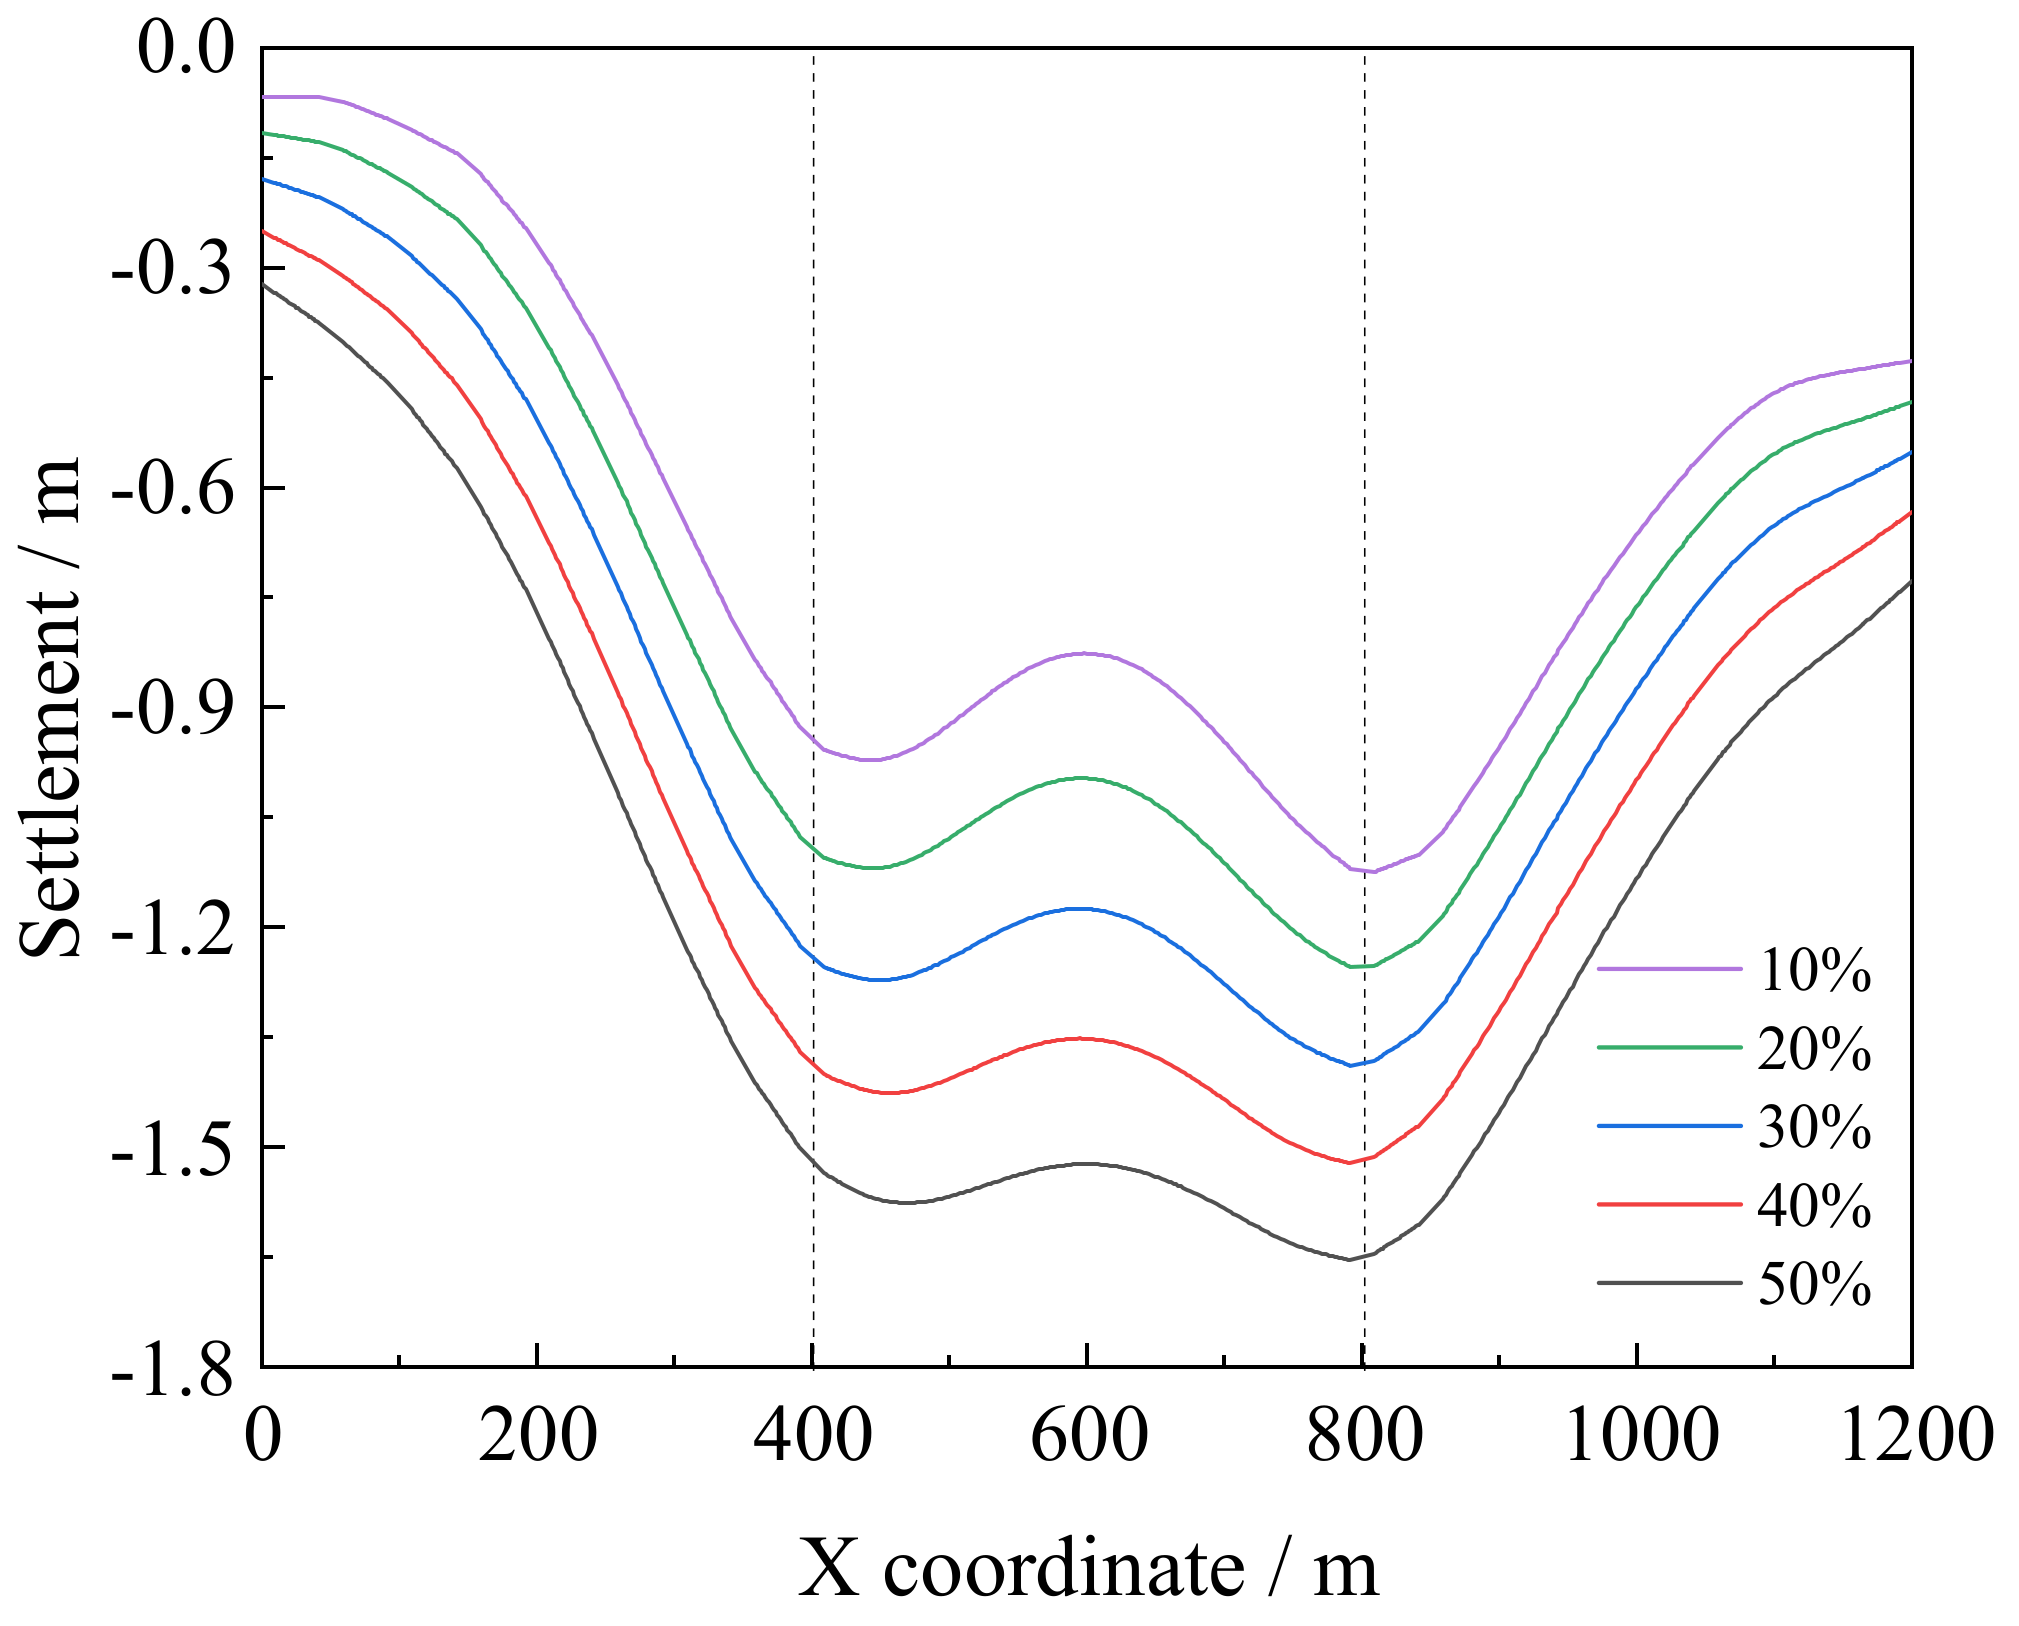
5.3. Initial Saturation of the NGH Reservoir

In this section, the depressurization model with a decomposition range of NGHs of 150 m is analyzed to study the influences of the NGH reservoir’s initial saturation on the stability of the submarine slope. Figure 12 shows the safety factors corresponding to different initial saturations of the reservoir. When the initial saturation was in the range from 10% to 50%, the slope’s safety factor decreased with the rising initial saturation. The decrease rate of the safety factor was not significant. The strength reduction of the reservoir after the decomposition of NGHs is an essential cause of slope failure. The larger the initial saturation of the reservoir is, the more substantial the strength reduction after the decomposition of NGHs is, and the more easily the stress is concentrated at the decomposition front of NGHs. Moreover, the larger the initial saturation of the reservoir is, the greater the volumes of natural gas and water produced in the NGHs production process are. As a result, the more the fluid exits from the formation, the larger the voids present are, rendering the formation more unstable. The settlement curves corresponding to different initial saturations of the reservoir in Figure 13 show that the maximal settlement of the seabed increased with the growing initial saturation of the reservoir. Furthermore, the maximal settlement was 1.657 m when the saturation is 0.5.

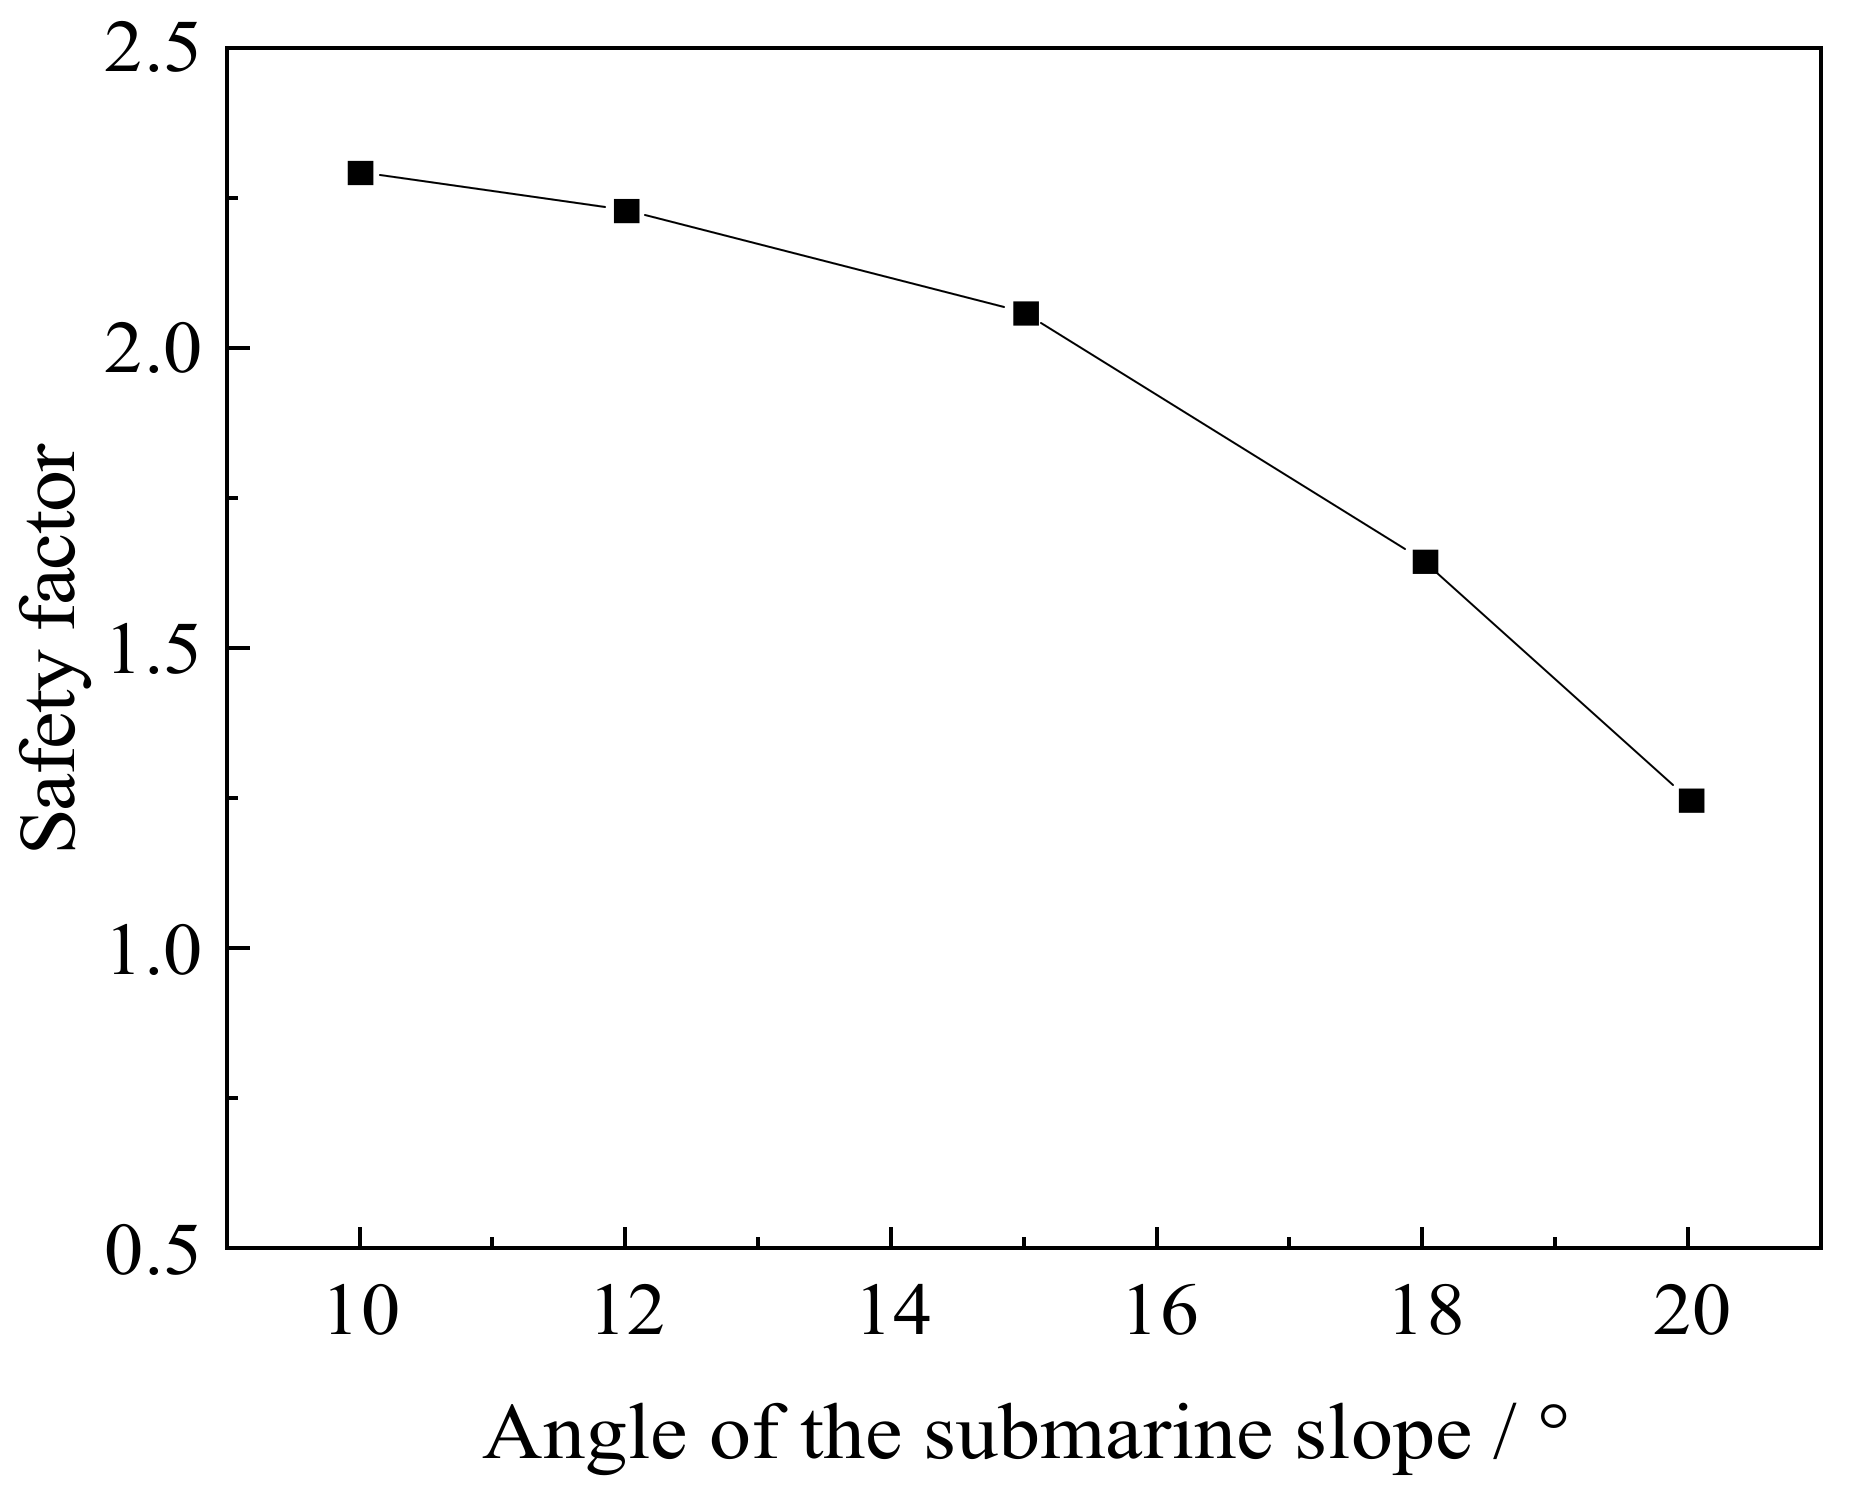
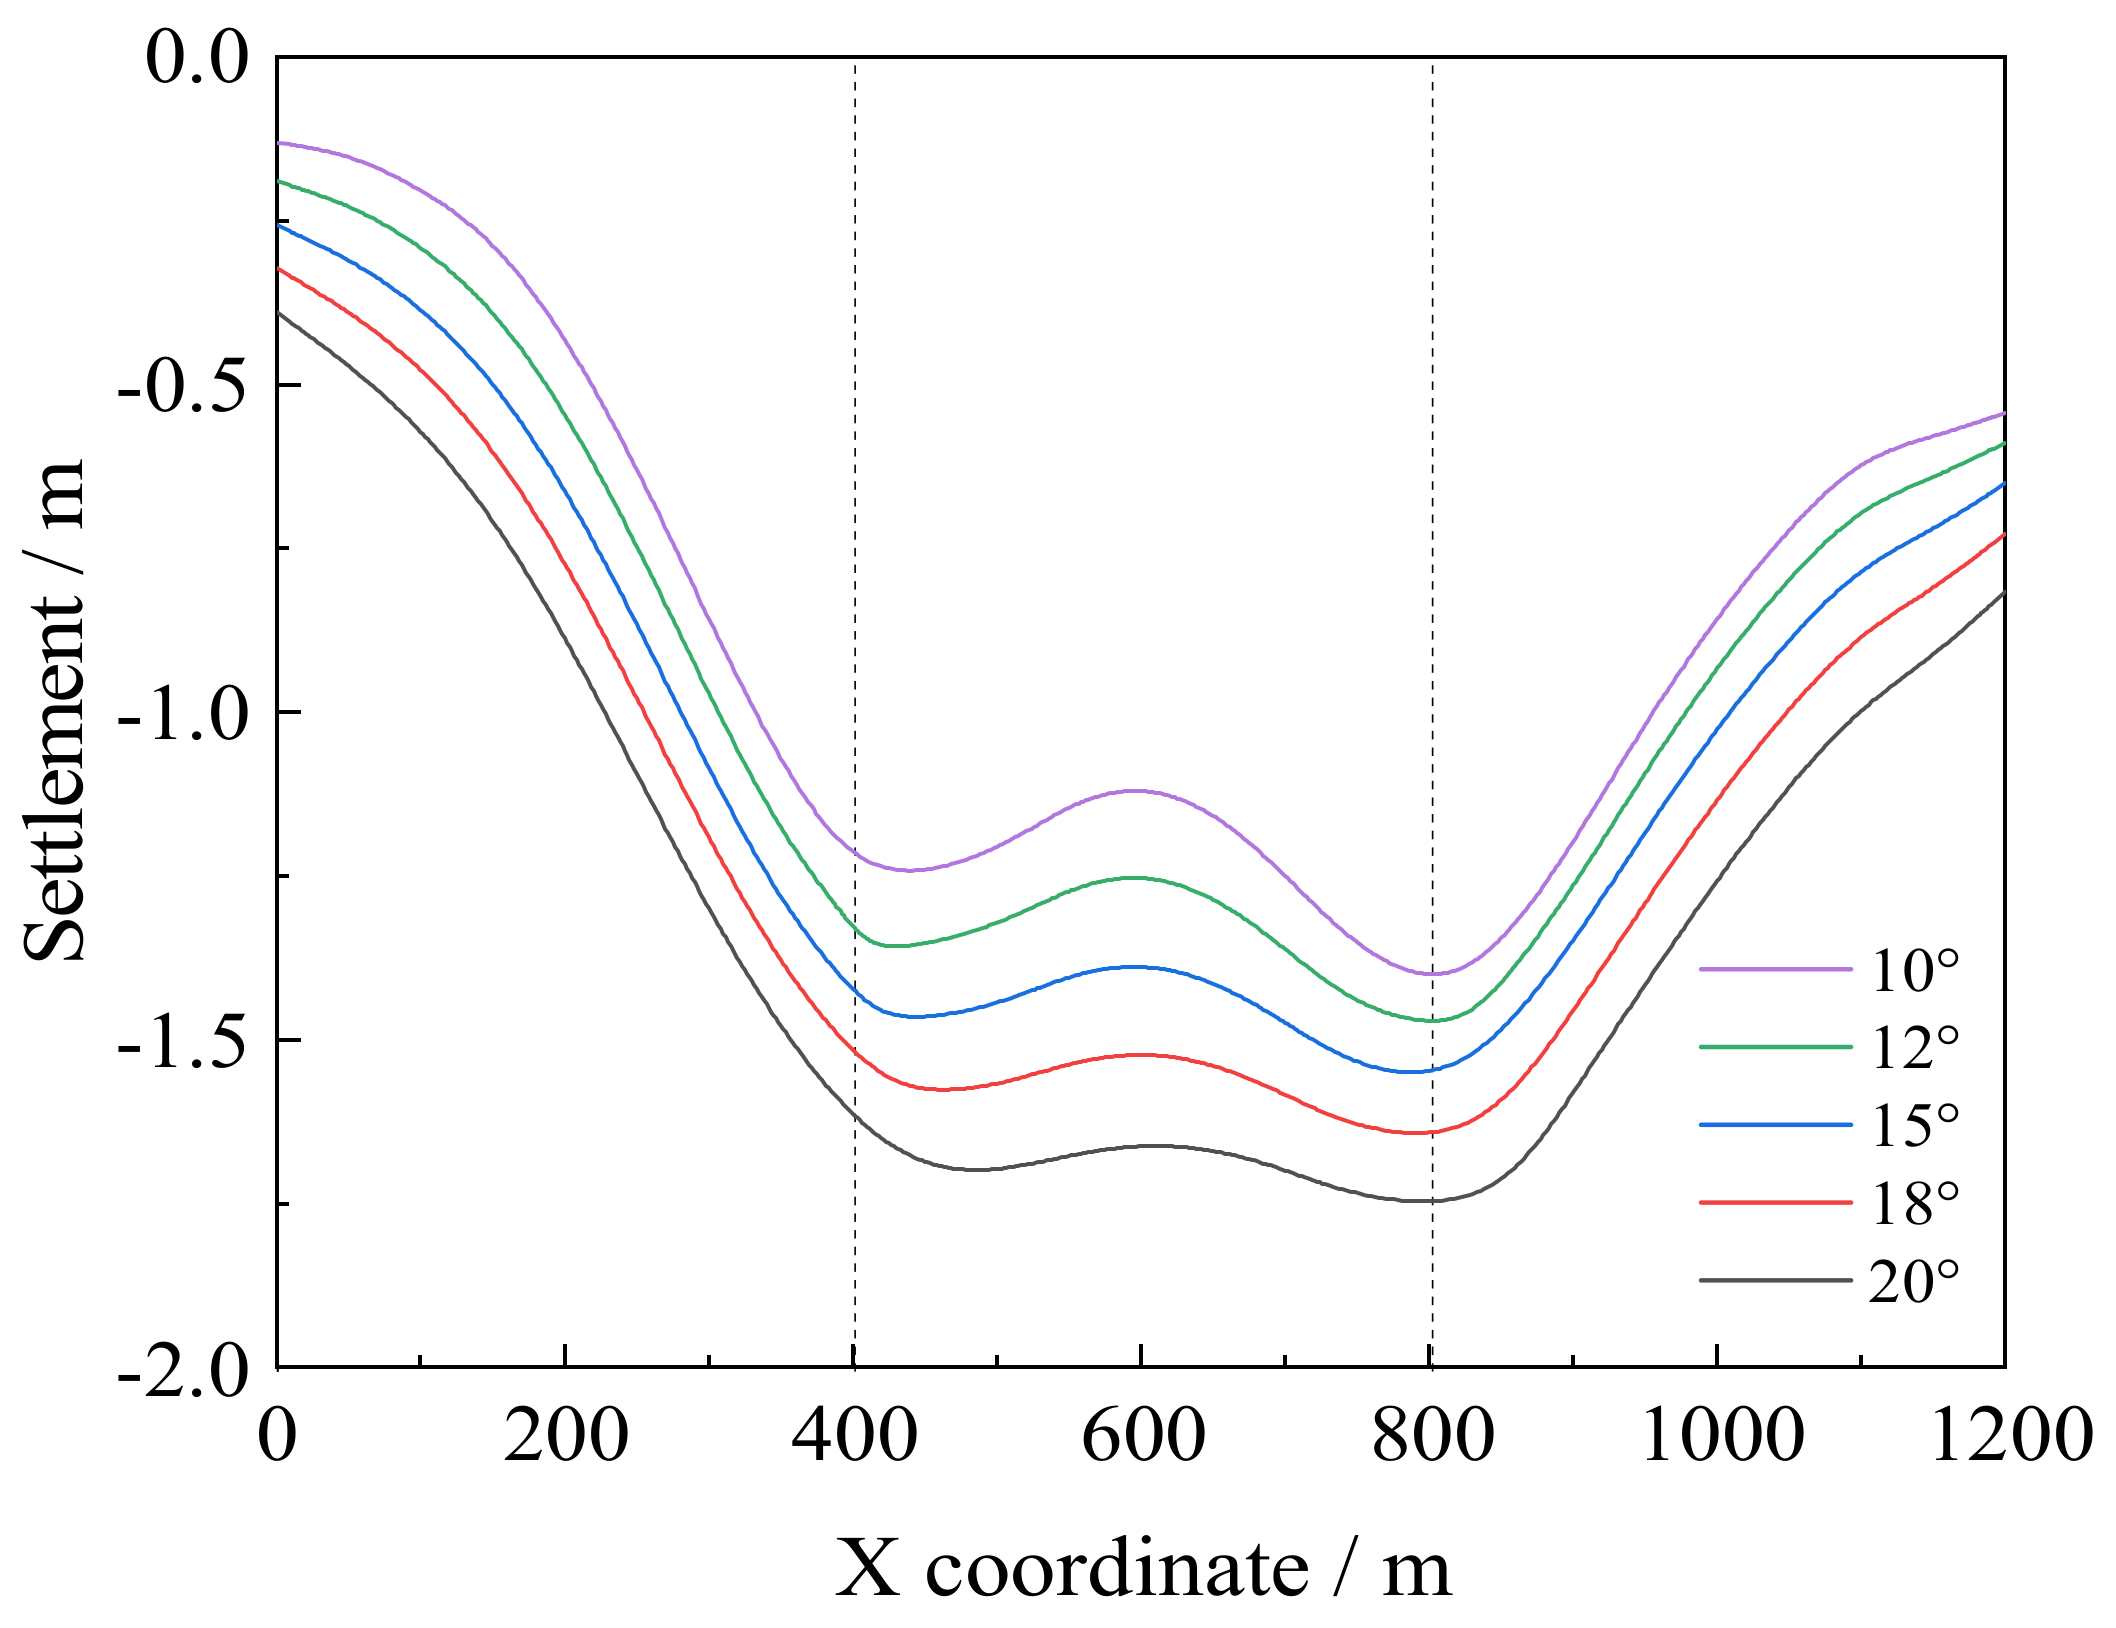
5.4. Angle of the Submarine Slope

In order to study the slope angle effects on slope stability, the depressurization model when the NGHs decomposition was 150 m is analyzed. The relationship between safety factor and slope angle is depicted in Figure 14. The safety factor continued decreasing as the slope angle rose over the range between 10° and 20°, up to a value of 1.25. The reduction rate of the safety factor rose with the increase in slope angle. Indeed, the submarine slope experienced shear damage when the landslide happened, and the slope failed when the shear stress exceeded the shear strength. However, the shear force of the overlying strata on the NGH reservoir grew with the increase in slope angle. As the slope angle increased, the gravity component in the slope’s strike direction increased, and stress at the slope toe grew, so the slope toe was more likely to undergo plastic yield, and the instability of the slope rose. According to settlement curves corresponding to the different slope angles in Figure 15, the highest settlement of the seabed rose with the increasing slope angle, and the maximal settlement was 1.761 m at a slope angle is 20°. The settlement curves of the seabed surface were not symmetrical at the production wells, with the greatest settlement occurring above the wells. In addition, as the slope angle increased, the asymmetry was intensified.

6. Conclusions

The stability of the submarine slope in the mining process of NGHs using depressurization was analyzed on the basis of a multifield coupling model for the double-well mining of NGHs.
(1)
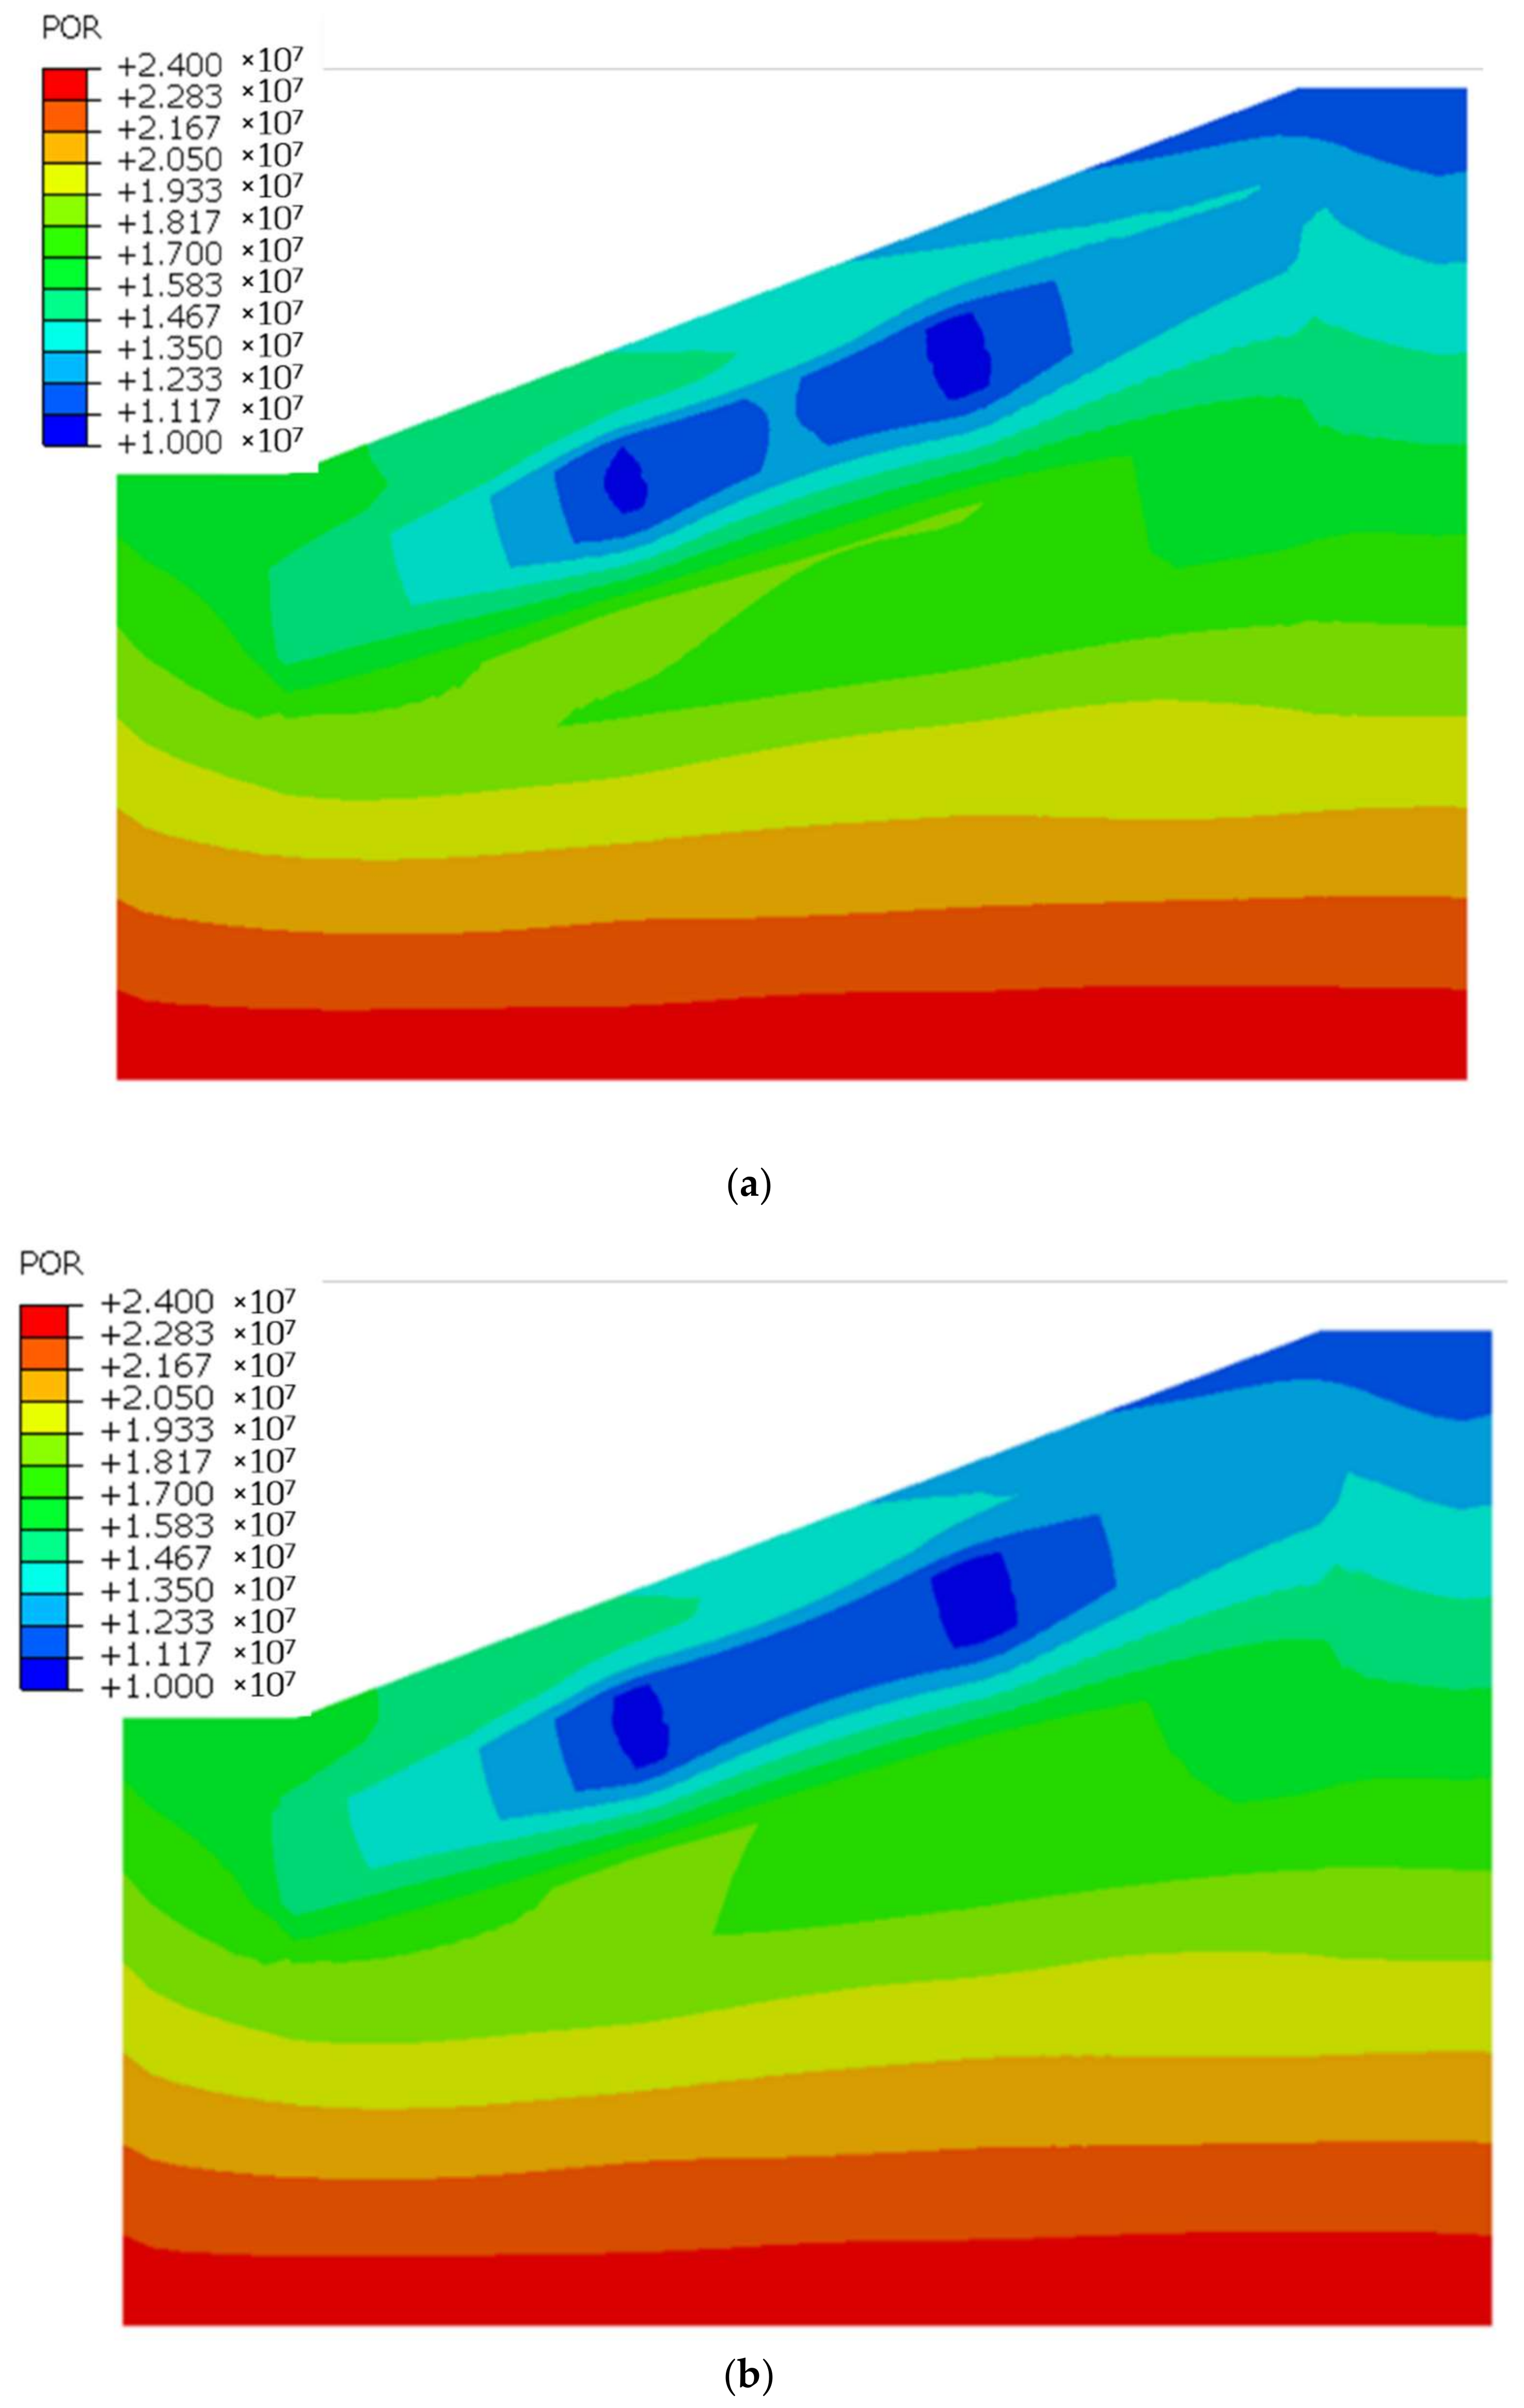
The decomposition range of NGHs was nonuniformly distributed in space and was shaped as an irregular triangular prism. The pressure drop propagated from the wellbores to the surroundings and formed cylindrical high-pressure drop zones, taking wellbores as the cylinder axes.
(2)
Plastic zones first appeared in the decomposition range of NGHs in the failure process of the slope, gradually spread to the slope shoulder and toe, and ultimately coalesced throughout the NGH reservoir.
(3)
The stability of the submarine slope decreased with the increasing slope angle, the thickness of the NGH reservoir, and the initial saturation of the NGH reservoir, while it rose with the burial depth of the NGH reservoir.
(4)
The maximal settlement of the seabed grew with growing slope angle reservoir initial saturation and thickness, and was decreased with the expanding burial depth of the reservoir.

Author Contributions

Conceptualization, X.Z. and Z.W.; methodology, Y.Z.; software, J.Z.; validation, J.Z., G.C. and P.L.; formal analysis, W.L.; investigation, W.J.; resources, B.W.; data curation, X.C.; writing—original draft preparation, X.Z.; writing—review and editing, Z.W.; visualization, Z.W.; supervision, X.Z.; project administration, X.Z.; funding acquisition, X.Z. All authors have read and agreed to the published version of the manuscript.

Funding

This research was funded by the prospective research project of the petroleum and gas development foundation of the science and technology department of Sinopec (P20040-3), postdoctoral program of Shengli Oilfield, Sinopec (YKB2107).

Institutional Review Board Statement

Not applicable.

Informed Consent Statement

Not applicable.

Acknowledgments

The work described in this paper is supported by the prospective research project of the petroleum and gas development foundation of the science and technology department of Sinopec (P20040-3), postdoctoral program of Shengli Oilfield, Sinopec (YKB2107).

Conflicts of Interest

The authors declare no conflict of interest.

References

  1. Sloan, E.D., Jr.; Koh, C.A. Clathrate Hydrates of Natural Gases; CRC Press: Boca Raton, FL, USA, 2007. [Google Scholar]
  2. Yan, C.; Ren, X.; Cheng, Y.; Song, B.; Li, Y.; Tian, W. Geomechanical issues in the exploitation of natural gas hydrate. Gondwana Res. 2020, 81, 403–422. [Google Scholar] [CrossRef]
  3. Yan, C.; Chen, Y.; Chen, T.; Cheng, Y.; Yan, X. Experimental Study of Hydraulic Fracturing for Unconsolidated Reservoirs. Rock Mech. Rock Eng. 2022, 55, 3399–3424. [Google Scholar] [CrossRef]
  4. Yan, C.; Chen, Y.; Tian, W.; Cheng, Y.; Li, Y. Effects of methane-carbon dioxide replacement on the mechanical properties of natural gas hydrate reservoirs. J. Clean. Prod. 2022, 354, 131703. [Google Scholar] [CrossRef]
  5. Yan, C.; Li, Y.; Cheng, Y.; Wei, J.; Tian, W.; Li, S.; Wang, Z. Multifield coupling mechanism in formations around a wellbore during the exploitation of methane hydrate with CO2 replacement. Energy 2022, 245, 123283. [Google Scholar] [CrossRef]
  6. Micallef, A.; Mountjoy, J.J.; Canals, M.; Lastras, G. Deep-Seated Bedrock Landslides and Submarine Canyon Evolution in An Active Tectonic Margin: Cook Strait, New Zealand; Springer: Dordrecht, The Netherlands, 2012. [Google Scholar]
  7. Hance, J.J. Submarine slope stability. Project Report for the Minerals Management Service Under the MMS/OTRC Coop. Research Agreement 1435-01-99-CA-31003, Task Order, 2003, 18217. Available online: https://www.bsee.gov/sites/bsee.gov/files/tap-technical-assessment-program//441ab.pdf (accessed on 21 June 2022).
  8. Li, X.; He, S. Progress in stability analysis of submarine slopes considering dissociation of gas hydrates. Environ. Earth Sci. 2012, 66, 741–747. [Google Scholar] [CrossRef]
  9. Kayen, R.E.; Lee, H.J. Pleistocene slope instability of gas hydrate-laden sediment on the Beaufort Sea margin. Mar. Georesources Geotechnol. 1991, 10, 125–141. [Google Scholar] [CrossRef]
  10. Sultan, N.; Cochonat, P.; Foucher, J.-P.; Mienert, J. Effect of gas hydrates melting on seafloor slope instability. Mar. Geol. 2004, 213, 379–401. [Google Scholar] [CrossRef]
  11. Wu, S.; Chen, S.; Wang, Z.; Li, Q. Submarine landslide and risk evaluation on its instability in the deepwater continental margin. Geology 2008, 22, 430. [Google Scholar]
  12. Paull, C.K.; Buelow, W.J.; Ussler, W., III; Borowski, W.S. Increased continental-margin slumping frequency during sea-level lowstands above gas hydrate-bearing sediments. Geology 1996, 24, 143–146. [Google Scholar] [CrossRef]
  13. Zhou, D. Study on the Influence of the Seabed Structures Stability Due to Natural Gas Hydrate Dissociation. Master’s Thesis, Dalian University of Technology, Dalian, China, June 2012. [Google Scholar]
  14. Liu, F.; Tun, S.; Sun, Y. A quantitative analysis for submarine slope instability of the northern South China Sea due to gas hydrate dissociation. Chin. J. Geophys. 2010, 53, 946–953. [Google Scholar]
  15. Lin, T.; Fang, L. Submarine slope stability during depressurization and thermal stimulation hydrate production with horizontal wells. Chin. J. Theor. Appl. Mech. 2020, 52, 567–577. [Google Scholar]
  16. Ma, Y.; Li, S.Z.; Liang, J.Q.; Suo, Y.H.; Dai, L.M.; Wang, X.F.; Zhang, B.K. Characteristics and mechanism of submarine landslides in the Qiongdongnan Basin, northern South China Sea. J. Jinlin Univ. (Earth Sci. Ed.) 2012, 42 (Suppl. 3), 196–205. [Google Scholar]
  17. An, C.; Zhang, J.; Zhou, M. Limit analysis on mechanism of low-angle submarine landslide based on upper bound energy method. Northwestern Seismol. J. 2011, 33, 105–109. [Google Scholar]
  18. Zhao, Y.; Kong, L.; Liu, L. Stability analysis of submarine slope of hydrate-bearing sediments based on the two-step reduction method. Nat. GasInd. 2021, 41, 141–153. [Google Scholar]
  19. Tang, C.; Xu, X.; Sun, B.; Jiang, R. Influence factors and risk assessment for seabed landslides induced by natural gas hydrate decomposition. Mar. Geol. Front. 2021, 37, 14–21. [Google Scholar]
  20. Xu, B.; Zou, D.; Zhou, D.; Kong, X. Analysis method on stability of the submarine slope due to methane hydrate dissociation. China Civ. Eng. J. 2011, 44 (Suppl. 2), 207–211. [Google Scholar]
  21. Lin, X. Fluid-Solid Coupling Model and Its Numerical Simulation for Submarine Energy Soil under Depressurizing Production. Master’s Thesis, Qingdao University of Technology, Qingdao, China, June 2020. [Google Scholar]
  22. Chen, Y.; Zhang, L.; Liao, C.; Jiang, M.; Peng, M. A two-stage probabilistic approach for the risk assessment of submarine landslides induced by gas hydrate exploitation. Appl. Ocean. Res. 2020, 99, 102158. [Google Scholar] [CrossRef]
  23. Song, B.; Cheng, Y.; Yan, C.; Han, Z.; Ding, J.; Li, Y.; Wei, J. Influences of hydrate decomposition on submarine landslide. Landslides 2019, 16, 2127–2150. [Google Scholar] [CrossRef]
  24. Song, B.; Cheng, Y.; Yan, C.; Lyu, Y.; Wei, J.; Ding, J.; Li, Y. Seafloor subsidence response and submarine slope stability evaluation in response to hydrate dissociation. J. Nat. Gas Sci. Eng. 2019, 65, 197–211. [Google Scholar] [CrossRef]
  25. Moridis, G.J. Numerical studies of gas production from methane hydrates. SPE J. 2003, 8, 359–370. [Google Scholar] [CrossRef]
  26. Kamath, A.R.R. A Methodology for Estimating Failure Rate of Equipment Subject to Unrevealed Failures. Saf. Reliab. 1998, 18, 20–24. [Google Scholar] [CrossRef]
  27. Kim, H.C.; Bishnoi, P.R.; Heidemann, R.A.; Rizvi, S.S.H. Kinetics of methane hydrate decomposition. Chem. Eng. Sci. 1987, 42, 1645–1653. [Google Scholar] [CrossRef]
  28. Rutqvist, J.; Moridis, G.J.; Grover, T.; Silpngarmlert, S.; Collett, T.S.; Holdich, S.A. Coupled multiphase fluid flow and wellbore stability analysis associated with gas production from oceanic hydrate-bearing sediments. J. Pet. Sci. Eng. 2012, 92, 65–81. [Google Scholar] [CrossRef]
  29. Li, Y.; Cheng, Y.F.; Yan, C.L.; Wang, Z.Y.; Song, L.F. Effects of creep characteristics of natural gas hydrate-bearing sediments on wellbore stability. Pet. Sci. 2022, 19, 220–233. [Google Scholar] [CrossRef]
  30. Wan, Y.; Wu, N.; Hu, G.; Xin, X.; Jin, G.; Liu, C.; Chen, Q. Reservoir stability in the process of natural gas hydrate production by depressurization in the Shenhu area of the South China Sea. Nat. Gas Ind. B 2018, 5, 631–643. [Google Scholar] [CrossRef]
  31. Zienkiewicz, O.C.; Humpheson, C.; Lewis, R.W. Associated and non-associated visco-plasticity and plasticity in soil mechanics. Geotechnique 1975, 25, 671–689. [Google Scholar] [CrossRef]
  32. Ye, J.; Qin, X.; Xie, W.; Lu, H.; Ma, B.; Qiu, H.; Liang, J.; Lu, J.; Kuang, Z.; Lu, C.; et al. Main progress of the second gas hydrate trial production in the South China Sea. Geol. China 2020, 47, 557–568. [Google Scholar]
  33. Zhang, Z. Sensitivity Analysis of Influencing Factors on Stability of Submarine Energy Soil Slope. Master’s Thesis, Qingdao University of Technology, Qingdao, China, June 2016. [Google Scholar]
Figure 1. Geometric illustration of the basic model of a slope.
Processes 10 01614 g001
Figure 2. Mesh generation and boundary conditions.
Processes 10 01614 g002
Figure 3. Distribution of NGH saturations corresponding to different decomposition ranges.
Processes 10 01614 g003
Figure 4. Relationship between the depressurization duration and decomposition range of NGHs.
Processes 10 01614 g004
Figure 5. Distribution of pore pressure in the formation after different durations. (a) Pore pressure distribution after 220 days (decomposition range: 50 m). (b) Pore pressure distribution after 430 days (decomposition range: 150 m).
Processes 10 01614 g005
Figure 6. Vertical displacement and total displacement vector. (a) Displacement (decomposition range: 150 m). (b) Displacement vector.
Processes 10 01614 g006aProcesses 10 01614 g006b
Figure 7. Developing plastic zones under conditions of different reduction coefficients.
Processes 10 01614 g007
Figure 8. Safety factors corresponding to different burial depths of the reservoir.
Processes 10 01614 g008
Figure 9. Settlement curves corresponding to different burial depths of the reservoir.
Processes 10 01614 g009
Figure 10. Safety factors corresponding to different reservoir thicknesses.
Processes 10 01614 g010
Figure 11. Settlement curves correspond to different reservoir thicknesses.
Processes 10 01614 g011
Figure 12. Safety factors corresponding to various initial saturations of the reservoir.
Processes 10 01614 g012
Figure 13. Settlement curves corresponding to different initial saturations of the reservoir.
Processes 10 01614 g013
Figure 14. Safety factors corresponding to different slope angles.
Processes 10 01614 g014
Figure 15. Settlement curves corresponding to different slope angles.
Processes 10 01614 g015
Table 1. Analytical factors and values.
Influencing FactorValue
Slope Angle/°1012151820
Burial depth of the reservoir/m100150200250300
Reservoir thickness/m20406080100
Initial hydrate saturation of the reservoir/%1020304050
Table 2. Basic parameters of the formation [32].
ParameterValueUnitParameterValueUnit
Specific heat capacity of formation skeleton1.0kJ·kg−1·K−1Specific heat capacity of NGHs2.1kJ·kg−1·K−1
Heat conductivity of formation skeleton1.0W·m−1·K−1Heat conductivity of NGHs0.5W·m−1·K−1
Density of formation skeleton2200kg·m−3Density of NGHs920kg·m−3
Cohesion of formation under s h = 0 0.1MPaCohesion of formation under s h = 1 2.0MPa
Bulk modulus of formation under s h = 0 2.0MPaBulk modulus of formation under s h = 1 32MPa
Shear modulus of formation under s h = 0 1.5MPaShear modulus of formation under s h = 1 29MPa
Intrinsic permeability of the layer without NGHs0.6mDIntrinsic permeability of NGH reservoir0.2mD
Specific heat capacity of sea water4.2kJ·kg−1·K−1Internal friction angle5°
Heat conductivity of sea water3.0W·m−1·K−1Geothermal gradient0.03K·m−1
Density of sea water1040kg·m−3Porosity0.4-
Publisher’s Note: MDPI stays neutral with regard to jurisdictional claims in published maps and institutional affiliations.

