Abstract
Based on a combination of physical and simulation experiments, a set of basic physical characteristic parameters and contact parameters suitable for granular fungal fertilizers were calibrated, which up to now have received little attention. The physical morphological characteristic parameters (overall dimension, 1000 grain weight, density, and moisture content), mechanical characteristic parameters (Poisson’s ratio, elastic modulus, and shear modulus), and contact parameters (static friction coefficient, rolling friction coefficient and recovery coefficient) of particles were measured through physical experiments. The parameters were screened for significance using the Plackett–Burman test. The results showed that the impact recovery coefficient, static friction coefficient, and rolling friction coefficient for the granular fungal fertilizer particles had a significant effect on the repose angle. The best range for the three parameters was determined using the steepest climbing test. The second-order regression model was optimized using the Box–Behnken design test. The relative error between the simulated repose angle (21.74°) and the physical test repose angle (21.84°) was small (0.50%). These optimal parameters obtained by calibration can provide a basis for the simulation analysis and parameter optimization of variable-rate fertilization systems.
1. Introduction
Fertilizer addition is an important method of crop yield enhancement and has an irreplaceable role in agricultural production. Xinjiang is located in the hinterland of Eurasia, with dry air, good atmospheric transparency, and abundant light and heat resources, which provide favorable conditions for the development of the cotton industry [1]. In 2020, Xinjiang accounted for 74.92% of the Chinese cotton planting area and produced 87.32% of its total cotton [2]. However, the excessive use of chemical fertilizer and the low utilization rate for organic fertilizer resources not only inhibit further increases in cotton production but also increase production costs. At the same time, this situation also leads to a series of environmental problems, such as low fertilizer utilization rate, decline in cotton quality and soil productivity, and destruction of the soil micro-ecological environment [3,4]. The scientific implementation of variable-rate fertilization is not only a necessary requirement for sustainable agricultural development but also the key to the smooth transformation of cotton planting from traditional agriculture to precision agriculture.
Fertilization is not only one of the main solutions for boosting cotton yield but is also a crucial link in cotton planting [5]. In this regard, the balance of soil nutrients plays a vital role in healthy growth and high yields of cotton. Through the prediction of soil nutrients, better-informed decisions about land selection can be made, and the soil nutrient content can be better adjusted with the support of appropriate technical means [6]. However, according to an investigation conducted into the practice of fertilization among those cotton growers in the main cotton-producing areas across Xinjiang, the average application rate for cotton chemical fertilizer only reaches 600 kg/hm2, with the overall application rate being as low as 56.98%. Due to the heavy use of nitrogen and phosphorus fertilizer, and little or even no application of potassic fertilizer, micro-fertilizer, and organic fertilizer, the ratio of nitrogen to phosphorus and potassium in the soil falls within the range of 1:0.14~2.90:0~0.28, which is a significant deviation from the normal ratio of 3:1:3 [7,8]. Consequently, there has not been any significant increase in cotton production, but the production costs have risen. At the same time, this situation leads to a series of problems, such as low fertilizer utilization rate, declining cotton quality and soil productivity, the destruction of the soil micro-ecological environment, and so on [3,4]. Therefore, reducing the input of chemical fertilizer in cotton fields while maintaining the stable and high yield of cotton is an important problem that must urgently be solved.
Studies have shown that the application of organic and biological fertilizers can not only improve soil quality but also improve the overall fertility of the soil, favoring crop growth and fundamentally improving production efficiency [9,10,11]. Granular fungal fertilizer is generally applied at the base fertilizer stage in Xinjiang. During the fertilization process, the interaction between the granular fungal fertilizer, the fertilizer applicator, and the fertilizer outlet is highly complex. Therefore, the discrete element method is often used to simulate the interaction and movement between granular fungal fertilizers. Numerical simulation has been used to reveal the mechanism of interaction between particles and then to optimize the design of the relevant structural parameters of the fertilizer applicator [12]. The calibration of the particle simulation parameters is helpful to improve the accuracy of the discrete element method for studies of the interaction mechanism and the motion of particles [13,14,15]. In the field of agricultural engineering, a large number of scholars have used discrete element models to simulate and calibrate agricultural granular materials [16,17,18,19]. Hou et al. [20] calibrated the simulation parameters through a combination of physical and simulation experiments and obtained the optimal combination of simulation parameters for Agropyron seeds. Yuan et al. [21] established a regression model through simulation testing and calibrated the parameters of an organic fertilizer discrete element model in combination with optimization based on physical testing. Pei and SA Galindo-Torres et al. [22] introduced the effective discrete element lattice Boltzmann model (DE-LBM), which combines particle–particle contact detection and particle grid immersion to reduce calculation time, greatly improving efficiency. Shi Linrong et al. [23] undertook the prediction and calibration of the rolling friction coefficient of flax seeds by changing the rolling friction coefficient of the flax seed simulation model and ensuring that the simulation value of the stacking angle constantly approached the measured value of the stacking. P. Van Liedekerke et al. [24] used the discrete element model to study the sensitivity of the flow of granular fertilizer on the rotating disk and concluded that friction was one of the main fertilizer characteristics affecting the diffusion mode, providing a powerful instrument for manufacturers developing new kinds of spreaders and fertilizers. At present, in the research on the calibration of discrete element simulation parameters, the calibration objects used generally consist of large seeds, chemical fertilizers, soil, and wheat flour. There are no measurements for the physical parameters of granular fungal fertilizer and the calibration of discrete element simulation parameters.
Kamil Roman et al. [25] used the multivariate analysis of variance analysis tool and a statistical computer program to statistically analyze laboratory test results. This research contributed to what is known as “green chemistry”. In the present study, the method of combining physical and simulation experiments was adopted, and the values measured from the physical tests were used as the basis for selecting simulation parameters. The following tests were used (Table 1):

Table 1.
Experimental methods.
Taking the repose angle as the response value, the discrete element simulation parameters for granular fungal fertilizer were calibrated, and the best combination of simulation parameters was obtained. A t-test was used for the repose angle obtained from the physical and simulation experiments to verify and determine the reliability of the simulation experiments. More accurate simulation input parameters can improve the accuracy of simulation results [29,30]. This study provides simulation parameters for the optimization of related parameters in variable-rate fertilization systems and for the selection of fertilization operation modes.
2. Materials and Methods
The materials used in this study were granular fungal fertilizers, which are the most widely used fertilizers in the base fertilizer application stage for cotton planting in Xinjiang; the granular fungal fertilizers used were produced by Woda Agricultural Technology Co., Ltd (No. 19, Youyi Road, Beiquan Town, Shihezi City, Xinjiang, China).
Granular fungal fertilizers with at least 2 × 10⁹ active bacteria per gram, no less than 12% total nutrients, and no less than 20% organic matter content were examined here. The studied physical parameters were the particle size, 1000 grain mass, density, moisture content, friction coefficient, recovery coefficient, Poisson’s ratio, and elastic modulus.
2.1. Determination of Physical Morphology Characteristic Parameters of Granular Fungal Fertilizer
In this study, the basic physical characteristics of granular fungal fertilizer were measured. A thousand pellets of fungal fertilizer were randomly selected, and the weight of 1000 granules was measured with a CP310 digital display electronic balance with a precision of 0.01 g. The 1000 seeds were evenly divided into five groups, the quality of each group was determined, and the average for the five groups was calculated. The particle size of the fertilizer was measured with an AIRAJ digital display vernier caliper with a measuring accuracy of 0.01 mm. By measuring the particle size of 1000 granules, it was found that the granular fertilizer had irregular spheres with a normal distribution of particle size. Acetone reagent and a measuring cylinder with 1 mL precision and a 25 mL measuring range were used to measure the density of the granular fungal fertilizer with the drainage method. The moisture content of the pellet fungal fertilizer was determined using the drying method. The mean values of the 1000-grain mass and particle size, the density, and the moisture content for the granular fungal fertilizer are shown in Table 2.
Table 2.
Basic parameters of granular fungal fertilizer.
Since the selected granular fungal fertilizers were spherical particles with a regular shape, the geological measurement model used for the granular fungal fertilizers was a spherical model, as shown in Figure 1a. The particle size distribution characteristics of the model were parameterized according to the radius distribution of the granular fungal fertilizers in the simulation experiments. The particle size distribution of the granular fungal fertilizer could be derived from the measured particle size, from which the mean and standard deviation were obtained. Figure 1b shows that the particle size distribution of the granular fungal fertilizer was normal, with a mean and standard deviation of 3.20 mm and 0.33 mm, respectively.
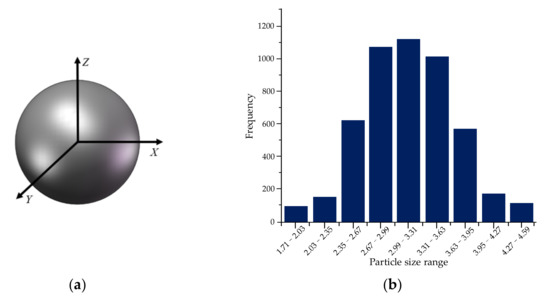
Figure 1.
Geometric model and particle size distribution of granular fungal fertilizer: (a) geometric model; (b) particle size distribution.
2.2. Determination of Mechanical Parameters of Granular Fungal Fertilizer
In this study, a universal material testing machine (model: Instrang E1000, Instron (Shanghai, China) test equipment Trading Co., Ltd., Shanghai, China) was used to conduct a compression test with the granular fungal fertilizer, as shown in Figure 2. Ten granules of fertilizer were randomly selected and their particle sizes were recorded. The particle sizes for each granular fungal fertilizer were measured three times and averaged to obtain the initial size.
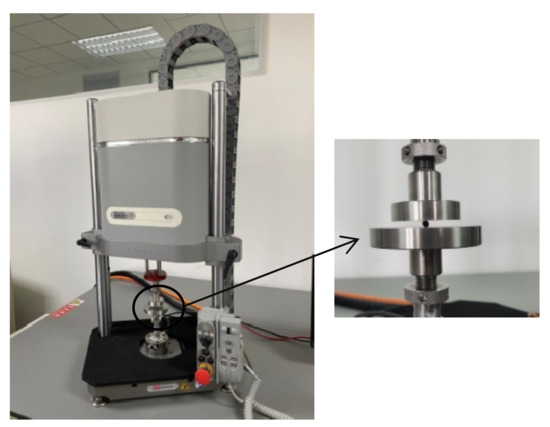
Figure 2.
Compression test for granular fungal fertilizer.
Poisson’s ratio is an important physical parameter in granular fungal fertilizers. In this experiment, the particles of the granular fungal fertilizer were identified as being regular spheroids. It is difficult to determine the Poisson’s ratio and elastic modulus of a cylindrical specimen using conventional compression methods [31]. A pressure deformation test was carried out on the granular fungal fertilizer, and then the Poisson’s ratio was calculated by measuring the axial (z-axis) and transverse (x-axis) deformation at the cracking limit before and after loading the fertilizer sample [32]. During the experiment, granular fungal fertilizer was axially loaded at a speed of 0.1 mm·s−1 until the granular fungal fertilizer pellet cracked. The axial deformation was recorded using the universal material testing machine. Electronic vernier calipers were used to record the transverse deformation of the granular fungal fertilizer at the cracking limit under axial load. The Poisson’s ratio for the granular fungal fertilizer was determined using the definition method. The Poisson’s ratio μ for the granular fungal fertilizer was determined as follows:
where μ is the Poisson’s ratio for granular fungal fertilizer, is the transverse strain of the granular fungal fertilizer, is the axial strain of the granular fungal fertilizer, is the transverse absolute deformation of the granular fungal fertilizer (mm), L is the initial transverse size of the granular fungal fertilizer (mm), is the axial absolute deformation of the granular fungal fertilizer (mm), and H is the initial axial size of the granular fungal fertilizer (mm). The Poisson’s ratio of the granular fungal fertilizer was calculated to be 0.16~0.48.
The elastic modulus of the granular fertilizer was determined using the static method [33]. The sensor range of the Instrang E1000 is from −2.00 to 2.00 kN. The granular fungal fertilizer was placed horizontally on the plate during the compression test. During the experiment, the granular fungal fertilizer was axially loaded at a speed of 0.1 mm·s−1. A circular probe with a diameter of 20 mm was used in the test. The machine was stopped after loading to the cracking limit along the thickness direction. The load–displacement data for the granular fungal fertilizer compression test were obtained using the software post-processing module. The experiment was repeated 10 times and then averaged according to the regulations of the American Society of Agricultural Engineers [34] on compression tests with spherical materials. The elastic modulus of the granular fungal fertilizer was calculated as follows:
where E is the apparent contact elastic modulus (Pa), F is the loading or unloading load (N), D is deformation (m), µ is the Poisson’s ratio, K is the intermediate constant (taken as 1.351 based on a corresponding query in the ASAE S368.4 DEC2000 (R2017) standard), R’ is the minimum curvature radius of the contact point between the granular fungal fertilizer and the pressure plate (m), and R is the maximum curvature radius of the contact point between the granular fungal fertilizer and the pressure plate (m). The elastic modulus of the granular fungal fertilizer was calculated to be 1.93 × 10⁷~5.42 × 10⁷ Pa.
The shear modulus of the granular fungal fertilizer G was calculated as follows:
where G is the shear modulus of the granular fungal fertilizer (Pa). The shear modulus of the granular fungal fertilizer was determined to be 8.30 × 10⁶~1.83 × 10⁷ Pa.
The Poisson’s ratio, elastic modulus, and shear modulus of the granular fungal fertilizer are shown in Table 3.
Table 3.
Physical parameters of the granular fungal fertilizer.
2.3. Determination of Contact Characteristic Parameters of Granular Fungal Fertilizer
2.3.1. Determination of Recovery Coefficient
The recovery coefficient is defined as the ratio of the normal separation velocity after collision to the normal velocity before collision [35,36]. In this study, the recovery coefficient of granular fungal fertilizer was measured during free fall using high-speed camera image acquisition [37]. Utilizing the kinematic principle, a measuring device for the impact recovery coefficient of the granular fungal fertilizer was designed. The installation was constructed using a wire rack, grid paper, a digital angle scale (0.01°), a fasteC-TS4 high speed camera (1280 × 1024 pixels, frame rate 500 frames·s−1), collision plates, lighting equipment, and a buffer box with fine sand. The determination principle for the recovery coefficient is shown in Figure 3.
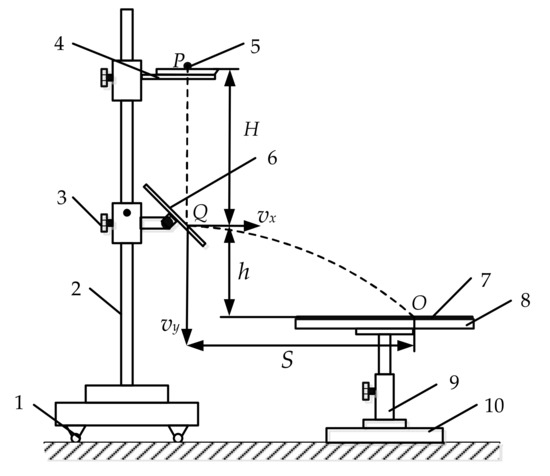
Figure 3.
Schematic diagram of the recovery coefficient test device and test principle. 1. The leg; 2. support bar; 3. tightened screws; 4. the feeding rack; 5. material particles; 6. plate collision; 7. the buffer box; 8. material collection board; 9. retractable column; 10. disk base. Note: P is the feeding reference point, Q is the collision point, O is the point where particles fall on the material collection plate, H is the falling height of particles before collision (m), h is the distance between the collision point Q and the material collecting plate (m), S is the average horizontal projectile distance after particle collision (m), vx is the horizontal partial velocity of particles after collision (m·s−1), vy is the vertical component velocity of particles after collision (m·s−1).
During the test, the granular fungal fertilizer fell freely from the horizontal feeding point P, which was H units away from the inclined plate, colliding with Q on a 45° inclined plane. The granular fungal fertilizer then fell into the buffer sandbox with a parabolic motion. At the same height, the horizontal displacement of the granular fungal fertilizer was S and the vertical displacement was h. The recovery coefficient for the granular fungal fertilizer collision was calculated using the kinematic formulas (Equations (4)–(6)).
In order to reduce the impacts of the measurement error and individual material differences on the results, the test was repeated 10 times for each selected granular fungal fertilizer. A central position of the area with good aggregation of granular fungal fertilizer (>90%) was taken as the test point.
The data for the measured points were collected from three repetitions of the experiment and averaged. The instantaneous velocity of the granular fungal fertilizer before collision and the recovery coefficient were calculated as follows:
According to the recovery coefficient defined by speed [27],
where is the instantaneous velocity of the granular fungal fertilizer before collision (m·s−1), t is the time it takes for the granular fungal fertilizer to fall to the buffer box after collision (s), is the horizontal separation speed of the granular fungal fertilizer after collision (m·s−1), e is the recovery coefficient, is the vertical separation speed of the granular fungal fertilizer after collision (m·s−1), is the normal separation speed of the granular fungal fertilizer after collision (m·s−1), and is the normal velocity of the granular fungal fertilizer before impact (m·s−1).
The higher the value of e is, the stronger the ability of the elasticity to recover from deformation will be.
The average recovery coefficients between the granular fungal fertilizer and the acrylic plate and between the granular fungal fertilizer particles were 0.18~0.55 and 0.16~0.48, respectively.
2.3.2. Coefficient of Friction Measurement
In this research, an MXS-05A friction coefficient tester (Jinan Sanquan Zhongshi Experimental Instrument Co., Ltd., Jinan, China) (Figure 4) was used to measure the static friction coefficients between the granular fungal fertilizer and acrylic plate and between the particles of the granular fungal fertilizer.
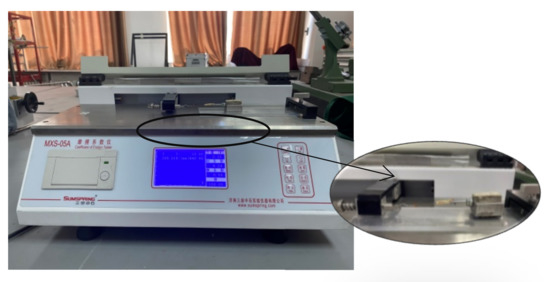
Figure 4.
Static friction coefficient measurement experiment.
The determination principle for the static friction coefficient is shown in Figure 5. When testing the static friction coefficient between granular fungal fertilizer particles, adhesive was used to arrange the tested fungal fertilizer evenly and closely on the test plane. The granular fungal fertilizer adhered to the slide block and external force was slowly applied. The static friction coefficient was recorded when the single pellet of fungal fertilizer slid along the measured plane. The test was then continued according to the method for testing the static friction coefficient between granular fungal fertilizer particles. The static friction coefficient between the granular fungal fertilizer and the acrylic plate was obtained.
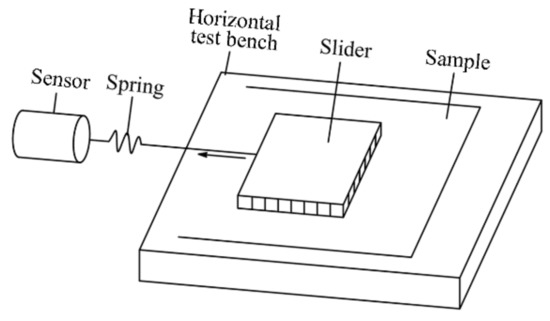
Figure 5.
Schematic diagram of the friction coefficient test for the granular fungal fertilizer.
In this study, the rolling friction coefficient was determined using the ramp method [38,39]. Due to the high degree of sphericity in the selected pellet fungal fertilizer shape, it was ensured that the pellet was in the rolling state in the test. The test device was a CNY-1 inclinometer, and the test materials were selected from acrylic plates and fungal fertilizer pellet plates.
Before the test, the test panel was placed horizontally, so that the angle pointer pointed to 0°. The test involved attaching different materials to the test panel of the inclinometer, placing the fungal fertilizer particles on the surface of the material to be tested, and gradually increasing the angle between the test panel and the horizontal surface. When the fungal fertilizer particles in contact with the surface of the material just began to stop rolling, the pointer indicated the angle φ, and the rolling friction factor of fungal fertilizer particles was calculated.
Ten fungal fertilizer particles were used, the test was repeated three times for each particle, and the results are taken as the average. The average values for the rolling friction coefficients between the fungal fertilizer particles and acrylic plate and between the fungal fertilizer particles were measured as 0.07 and 0.16, respectively.
As the contact parameters, such as the static friction coefficient and rolling friction coefficient, have significant effects on the resting angle [40], to obtain accurate friction coefficients, this study subsequently used the values measured in the physical tests as the basis to select the range of values for the simulation test parameters. The repose angle was used to simulate and calibrate the friction coefficient.
After 10 repeated tests, the average value was recorded, and the measured friction coefficient was calculated (Table 4).
Table 4.
Friction coefficient.
To obtain the accurate rolling friction coefficient, the value measured in the physical test was used as the basis for the selection of the parameter range in the simulation test. The friction coefficient was simulated and calibrated using the angle of repose [41].
2.4. Physical Test to Determine the Angle of Repose of the Granular Fungal Fertilizer
In this study, the plate lifting method was used to carry out the physical experiment [19]. The laboratory temperature was 28 ± 2 °C. The actual measuring device used for the physical accumulation angle was an acrylic plate shell with no cover, with length × width × height of 0.20 m × 0.15 m × 0.15 m (Figure 6). During the test, granular fungal fertilizer was inserted into the open shell of the acrylic plate until the open shell was filled. One side-baffle of the measuring device could be slid upward. During the test, the baffle plate was slowly raised. In this process, the granular fungal fertilizer slipped through the opening under the action of gravity. When the granular fungal fertilizer was stable, the repose angle of the granular fungal fertilizer at rest was taken as the physical angle of repose of the granular fungal fertilizer. The results from each experiment were photographed with a digital camera for further analysis. The average value from the five repeated tests was obtained, and the actual angle of repose of the granular fungal fertilizer was determined to be 21.84°.
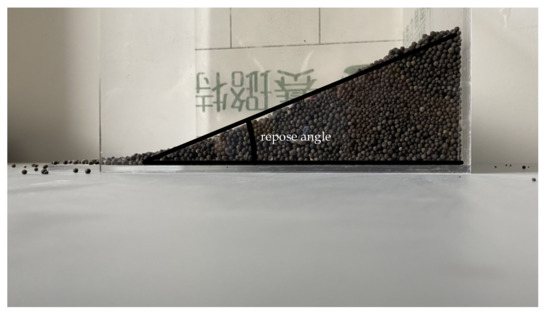
Figure 6.
Test for determination of repose angle of granular fungal fertilizers.
To reduce the error in measuring the angle of repose, the particle accumulation image was processed in MATLAB, as shown in Figure 7. The image was processed using grayscale, binarization, and boundary point extraction. The line on the boundary point was the boundary curve of the particle accumulation. The least-squares method was used to fit the boundary points, and the slope of the fitted line was the tangent of the angle of repose to be measured.
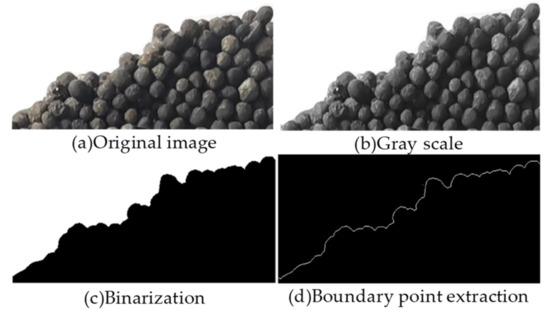
Figure 7.
Measurement of repose angle of the granular fungal fertilizer.
3. Establishment of Discrete Element Model for Granular Fungal Fertilizer and Calibration of Simulation Parameters
3.1. Establishment of Simulation Model for Granular Fungal Fertilizer
The basic physical parameters of the granular fungal fertilizer were determined using preliminary physical tests. The three-dimensional modeling software Solidworks 2019 (SolidWorks, Waltham, MA, USA) was used to establish the geometric model (particle template) according to the actual measured overall dimensions of the granular fungal fertilizer. The granular fungal fertilizer model was then transformed into the STL format and imported into the discrete element simulation software EDEM 2018 (DEM solutions, Edinbourgh, UK). As a result of the establishment of the simulation model, the size and shape of the fertilizer particles had little impact on the simulation results [21,42,43,44], and the interaction between the granular fungal fertilizer and the acrylic plate was the main object of consideration. To ensure the efficiency and the authenticity of the simulation results, the granular fungal fertilizer particles were considered as regular spheroids when the parameters were calibrated. The established simulation model for the granular fungal fertilizer is shown in Figure 8a.
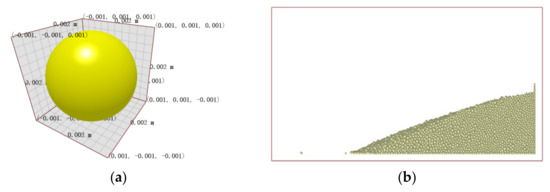
Figure 8.
Measurement model for the simulation test of the repose angle: (a) simulation model of Agropyron seed; (b) test model of repose angle.
In the EDEM simulation test, the repose angle measurement model was produced according to the size of the actual repose angle tester, as shown in Figure 8b.
3.2. Contact Mechanics Model of the Granular Fungal Fertilizer
Assuming that there is no adhesion on the particle surface, the particle motion characteristics depend on the position of the object or the indirect contact of adjacent particles, and a small amount of elastic deformation occurs. Therefore, the Hertz–Mindlin model [45] did not include any sliding contact mechanics for the particle packing process, as shown in Figure 9. The normal and tangential impact forces at the contact point were simplified as the parallel connection of the spring and damper.
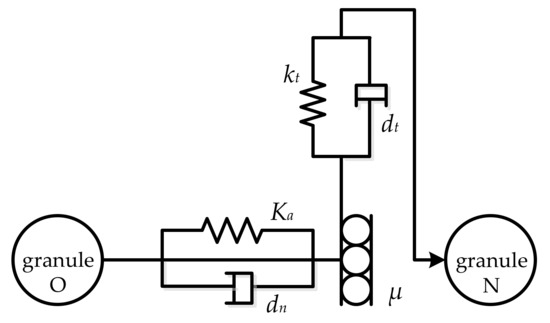
Figure 9.
Model of contact force.
Based on the above model, the particles were subjected to self-gravity, the interparticle normal force Fn, the tangential force Ft, the normal elastic force Fne, the tangential elastic force Fte, the normal damping force Fnd, and the tangential damping force Ftd in the process of stacking, while the coulomb friction Fn limited the tangential force and fs was the static friction coefficient. The specific relationship is as follows:
The model was used to calculate the contact forces between particles and between particles and device, and it was accurate and efficient for the particle calculation.
3.3. Discrete Element Simulation Parameter Calibration
3.3.1. Determination of the Significance of the Impact Parameters
Not all contact parameters have significant effects on the angle of repose and, thus, parameters with no significant effect cannot be calibrated based on the angle of repose. Therefore, a Plackett–Burman experiment was designed for the contact parameters using Design Expert 10.0. Experimental parameters were selected according to physical test results and the Plackett–Burman test was used to screen out parameters with a significant influence on the response value of the angle of repose after the accumulation of granular fungal fertilizer [46]. Eight test parameters were coded as levels +1, 0, and −1, as shown in Table 5.
Table 5.
Plackett–Burman test parameter range table.
The protocol and results of the Plackett–Burman test are shown in Table 6. At the end of each group of simulation experiments, the angle of repose of the granular fungal fertilizer was measured using the same method as in the physical tests.
Table 6.
Plackett–Burman test protocol and results.
Design Expert 10.0 was used to conduct variance analysis on the test results, and the effects of eight parameters on the angle of repose, along with their significance, were obtained, as shown in Table 7.
Table 7.
ANOVA for the results of the Plackett–Burman design test.
It can be seen from Table 6 that the effects of the eight parameters on the angle of repose were all positive. The angle of repose increased with the increase in the parameter values. The parameters that significantly affected the angle of repose (p < 0.05) included the recovery coefficient, the static friction coefficient, and the rolling friction coefficient between the granular fungal fertilizer particles. The influence of other parameters was not significant. The analysis indicated that the recovery coefficient of granular fungal fertilizer particles significantly impacted the angle of repose because of the elastic collision of the granular fungal fertilizer particles in the angle of repose test. The significant influence of the static friction coefficient was due to the static critical state of the granular fungal fertilizer. The significant influence of the rolling friction coefficient occurred because the pellet fungal fertilizer particles were spherical. Compared with non-spherical particles, such as corn, the rolling friction coefficient had a more significant effect than the static friction coefficient on the angle of repose.
3.3.2. Design of Steepest Climbing Test
A response surface analysis was applied to establish a regression model to determine the optimal value, as the optimal value of the factors was within the range of the selected high and low levels. A steepest climbing test can quickly determine the range of the optimal values of factors [41]. Based on the Plackett–Burman experiment, the three selected significant parameters (granular fungal fertilizer particles recovery coefficient, static friction coefficient, and rolling friction coefficient) were gradually increased according to the selected step size (the influence effect of the parameters was positive). The other parameters were selected from the actual measured values, and the relative error between the simulated angle of repose and the measured angle of repose was taken as the evaluation index to determine the optimal range of the simulation test parameters. To quickly and accurately approximate the optimal parameter range, the design scheme and results of the steepest climbing test are shown in Table 8.
Table 8.
Scheme and results of the steepest ascent test.
According to Table 7, the simulation angle of repose of the granular fungal fertilizer increased continuously with the increase in the granular fungal fertilizer particles recovery coefficient (CS), static friction coefficient (DS), and rolling friction coefficient (ES). The relative error between the simulated angle of repose and the actual angle of repose decreased initially and then increased. The relative error of group 4 was the smallest, so the optimal interval for the three significant parameters was near the level selected in group 4. Therefore, the levels selected in groups 3, 4, and 5 were selected for the response surface analysis test, and a regression model was established to determine the optimal value of the significant parameters.
3.3.3. Box–Behnken Test and Analysis of Significant Contact Parameters
The Box–Behnken test was carried out in Design Expert 10.0, with group 4 from the steepest climbing test as the center point (0) and group 3 and group 5 as the low (−1) and high (+1) level, respectively. The design scheme and results are shown in Table 9. A total of 17 tests were conducted, including 5 central-point repeated tests. In the simulation experiments, the values of other non-significant parameters were the same as in the steepest climbing test.
Table 9.
Box–Behnken experiment design scheme and results.
Multiple regression fitting was carried out for the Box–Behnken test results in Design Expert 10.0, and the second-order regression equation of the angle of repose of the simulation test θ was obtained as follows:
The results of the Box–Behnken test are shown in Table 9. The dependent variable (angle of repose) of the model showed extremely high significance with all independent variables (p < 0.0001).
The model’s misfitting term was p = 0.1760 (>0.05) and the coefficient of variation was 0.42%, which was low. Therefore, the fitting degree was good and no misfitting occurred. The regression coefficient (R2) was 0.9926, and the adjusted R2 was 0.9831, both of which were very close to 1.0. This indicates that the regression model was extremely significant, with good reliability and accuracy, and could thus be used for prediction and analysis of the angle of repose.
Table 10 shows that DS and ES had highly significant effects on the angle of repose, while CS had a significant effect on the angle of repose. The quadratic terms and had significant effects on the angle of repose.
Table 10.
ANOVA for the results of the Plackett–Burman design test.
Single factor level analysis indicated that the factors’ order of influence on the angle of repose was as follows: ES (granular fungal fertilizer particles rolling friction coefficient) > DS (granular fungal fertilizer particles static friction coefficient) > CS (granular fungal fertilizer particles recovery coefficient). The levels of influence of the quadratic terms on the angle of repose decreased as follows: .
3.3.4. Simulation Parameter Calibration and Experimental Verification
Using the optimization function in Design Expert 10.0, the regression model was optimized and applied with the measured angle of repose (21.84°) as the target. These optimal solutions were used to verify the angle of repose of the granular fungal fertilizer. The optimal simulation parameter combination for the granular fungal fertilizer was calibrated based on several parameter combinations: a granular fungal fertilizer particles recovery coefficient of 0.34, a granular fungal fertilizer particles static friction coefficient of 0.31, and a granular fungal fertilizer particles rolling friction coefficient of 0.16. The values of the other non-significant simulation parameters were taken as the average values of the measured data in the physical tests.
A comparison of the test results is shown in Figure 10. A t-test was performed for this sample and the angle of repose of the physical test, and p = 0.727 (>0.05) was obtained. The results showed that there was no significant difference between the angle of repose of the physical test and that of the simulation test after the calibration of simulation parameters. The soil angle of repose values obtained from the five repeated simulation experiments were 21.76°, 21.80°, 21.59°, 21.91°, and 21.64°. The mean value was 21.74°, the standard deviation was 0.11°, and the relative error between the measured angle of repose and the simulated angle of repose was only 0.50%, which further validated the simulation test. These findings indicate that this combination of significance analysis with a response surface method is feasible for the optimization of physical parameters in soil particle simulation.
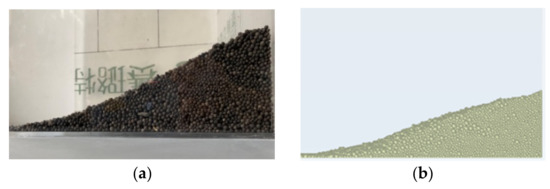
Figure 10.
Calibration of angle of repose for granular fungal fertilizers: (a) actual test; (b) simulation test.
4. Conclusions
In this study, the basic physical parameters of granular fungal fertilizer (external size, 1000 grain mass, density, moisture content, elastic modulus, shear modulus, and Poisson’s ratio) were obtained through physical tests. The average values of the granular fungal fertilizer particles recovery coefficient, static friction coefficient, and rolling friction coefficient were 0.16~0.48, 0.18~0.55, and 0.08~0.24, respectively. The average impact recovery coefficient, static friction coefficient, and rolling friction coefficient between the granular fungal fertilizer and the acrylic plate were 0.18~0.55, 0.07~0.23, and 0.03~0.11, respectively.
The simulation parameters were calibrated based on the angle of repose measured in the drawing plate method and optimized using EDEM software by combining measured test and discrete element simulation. With the angle of repose as the response value, significance analysis and a response surface method were applied for the optimization of simulation parameters in Design Expert 10.0. The physical parameters that significantly affected the angle of repose were selected and the interaction between the parameters that affected the angle of repose was analyzed to determine the optimal parameters. The following conclusions were drawn:
- (1)
- The Plackett–Burman design method is a two-level experimental design method that determines the significance of factors by comparing the differences between the two levels of each factor and the overall difference. Taking the repose angle of the granular fungal fertilizer as the response value, we used the high and low levels of the eight factors in Table 4, and set three virtual parameters for error analysis. A total of 13 tests were carried out. The experimental results showed that, among the simulation physical parameters, the collision recovery coefficient, static friction coefficient, and rolling friction coefficient of the granular biofertilizer had significant effects on the repose angle of the granular biofertilizer. Other physical parameters did not show significant effects on the repose angle of the granular bacterial fertilizer.
- (2)
- The Box–Behnken design is a response-surface design type. According to the Plackett–Burman test results, the Poisson’s ratio of the granular fungal fertilizer was 0.32, the recovery coefficient of the granular fungal fertilizer particles was 0.32, the recovery coefficient of the granular fungal fertilizer acrylic plate was 0.37, the static friction coefficient of the granular fungal fertilizer acrylic plate was 0.15, and the rolling friction coefficient of the granular fungal fertilizer acrylic plate was 0.07. Taking the static friction coefficient (DS), rolling friction coefficient (ES), and recovery coefficient (CS) of the granular fungal fertilizer particles as the test factors and the angle of repose as the response index, the Box–Behnken test was carried out with the high, medium, and low levels of the three factors in Table 7, and a total of 17 simulations were carried out. Through the Box–Behnken test, the second-order regression equation between the angle of repose and the significance parameters was established, and the optimal target value of the angle of repose (21.84°) was optimized to obtain the best simulation parameters: the collision recovery coefficient, static friction coefficient, and rolling friction coefficient of the granular bacterial fertilizer particles were 0.34, 0.31, and 0.16, respectively.
- (3)
- A t-test was applied to examine the significance of the difference between the observed and simulated angles of repose. A significance of p = 0.727 (>0.05) was obtained, indicating no significant difference between the angles of repose in the physical and simulation experiments. The relative error was 0.50%, which further indicated the reliability of the simulation test and the calibrated simulation parameters.
Based on the analysis of the literature and the angles of repose measured in previous tests, this study determined the value ranges of eight factors—coconut bran Poisson’s ratio and shear modulus; coconut bran particles recovery coefficient, static friction coefficient, and rolling friction coefficient; and coconut bran and steel recovery coefficient, static friction coefficient, and rolling friction coefficient—according to the EDEM 2018 material library. Then, the Plackett–Burman experimental design was used to screen out the contact parameters and intrinsic parameters that had significant impacts on the stacking angle of coconut bran. Using the Box–Behnken experimental design, a regression model between the accumulation angle and the significantly influential factors was established. Taking the accumulation angle from the physical test of the granular fungal fertilizer as the goal, the regression equation was optimized and solved. The best combination of significantly influential factors was a recovery coefficient for the granular fungal fertilizer particles of 0.34, a static friction coefficient for the granular fungal fertilizer particles of 0.31, and a granular fungal fertilizer–rolling friction coefficient of granular fungal fertilizer of 0.16. Finally, through the experimental verification of the optimal combination parameters, it was confirmed that the calibrated parameters were accurate and reliable and that the established model was correct and feasible.
The discrete element method can accurately and efficiently analyze the movement of particles, as well as provide visualization. The research results of this paper provide basic data for the research on and development of mechanical equipment, such as for granular fungal fertilizer transportation and mixing. This study explored the method of calibrating and optimizing a physical parameter system for granular bacterial fertilizer discrete element simulation and constructed an accurate discrete element simulation model for Xinjiang universal granular bacterial fertilizer, providing the theoretical basis and technical support for subsequent design of and research on fertilizer ejectors.
Author Contributions
Conceptualization, S.Y. and W.D.; methodology, S.Y.; software, H.B.; formal analysis, Z.J.; resources, Z.J.; data curation, H.B.; writing—original draft preparation, S.Y.; writing—review and editing, L.Z. and Y.X.; funding acquisition, Y.X. All authors have read and agreed to the published version of the manuscript.
Funding
This research was funded by the Science and Technology Bureau of Xinjiang Production and Construction Corps fund for scientific and technological research projects in key areas (2020AB002, “R&D of cotton seeding, fertilization, and film mulching combined operation machine based on Beidou positioning and intelligent control”).
Acknowledgments
We thank Wancheng Dong, Haoran Bu, and Zhen Jiang for their practical measurement work in this physical process. We also thank the key laboratory of Shihezi University for the experimental conditions that allowed us to successfully complete this experiment. Finally, we thank the instructor for his constructive comments on an earlier version of the manuscript.
Conflicts of Interest
The authors declare no conflict of interest.
References
- Yang, L. Characteristics and development of Xinjiang agricultural natural resources. Xinjiang Agric. Sci. 1989, 1, 34–36. [Google Scholar]
- Statistics Bureau of Xinjiang Uygur Autonomous Region. Xinjiang Statistical Yearbook; Xinjiang Yearbook Society: Xinjiang, China, 2020. [Google Scholar]
- Ye, L.; Zhao, X.; Bao, E.; Li, J.; Cao, K. Bio-organic fertilizer with reduced rates of chemical fertilization improves soil fertility and enhances tomato yield and quality. Sci. Rep. 2020, 10, 177. [Google Scholar] [CrossRef] [PubMed] [Green Version]
- Prasuna, R.; Ch, P.R.; Kumari, A.L.; Rao, P.J.; Prasad, P.R.K. Yield and fiber qualities of cotton (Gossypium hirsutum) as influenced by long-term manures and fertilizers on cotton Mono-Cropping. Agric. J. 2017, 64, 120–122. [Google Scholar]
- He, S.; Sun, Y.Y.; Shen, Z.Q.; Wang, K. Advances in coupling big data technique with nutrient site-specific management: Scheme, methods and outlook. Plant Nutr. Fertil. Sci. 2017, 23, 1514–1524. [Google Scholar]
- Lu, F.; Jianlong, D.; Liwen, T.; Huijun, Z.; Weijiang, L.; Dong, H. Review of the technology for high-yielding and efficient cotton cultivation in the northwest inland cotton-growing region of China. Field Crops Res. 2017, 208, 18–26. [Google Scholar]
- Lai, B.; Yang, M.R.; Chai, Z.P.; Chen, B.L.; Li, Q.J.; Dong, J.H.; Wang, F.; Tian, C.Y. Investigation and evaluation of the chemical fertilizer application situation of farmland in Xinjiang. Arid. Zone Res. 2014, 31, 1024–1030. [Google Scholar]
- Song, C.X. Techniques of reducing fertilizer quantity while increasing its efficiency through cotton water–fertilizer integration for cotton in Luntai County. Xinjiang Appl. Eng. Technol. 2021, 41, 38–40. [Google Scholar]
- Tao, R.; Tang, C.; Li, R.; Tan, L.; Chu, G. Effect of partial replacement of chemical fertilizer with organic fertilizer on nitrogen transformation and nitrogen content of different forms in drip irrigated cotton field. Soil Fertil. China 2015, 1, 50–56. [Google Scholar]
- Li, R.; Tao, R.; Wang, D.; Chu, G. Effects of nitrogen reduction and organic fertilizer application on soil biological properties and aggregate properties in cotton field with drip irrigation. J. Appl. Ecol. 2017, 28, 3297–3304. [Google Scholar]
- Li, S.; Liu, X.; He, P. Analyses on nutrient requirements in current agriculture production in China. J. Plant Nutr. Fertil. 2017, 23, 1416–1432. [Google Scholar]
- Liu, C. Performance analysis and test of centrifugal disc spreader based on EDEM. Trans. Chin. Soc. Agric. Eng. 2017, 33, 32–39. [Google Scholar]
- Józef, H.; Molenda, M. Parameters and contact models for DEM simulations of agricultural granular materials: A review. Biosyst. Eng. 2016, 147, 206–225. [Google Scholar]
- Oinonen, A.; Marquis, G. A constitutive model for interface problems with frictional contact and cohesion. Eur. J. Mech.-A/Solids 2015, 49, 205–213. [Google Scholar] [CrossRef]
- Yu, Q.; Liu, Y.; Chen, X.; Sun, K.; Lai, Q. Calibration and experiment of panax notoginseng seed simulation parameters based on DEM. Trans. Chin. Soc. Agric. Mach. 2020, 51, 130–139. [Google Scholar]
- Lucie, J.; Martin, Ž.; Daniel, G.; Barbora, P.; Jiří, Z.; Martin, Č. DEM model calibration based on mechanical physical properties. AIP Conf. Proc. 2019, 2116, 320006. [Google Scholar]
- Zhang, T. The measurement of the physical parameters of the contact between soybean seed and the seed metering device and the discrete element simulation calibration. J. China Agric. Univ. 2017, 22, 86–92. [Google Scholar]
- Xiang, W. Calibration of simulated physical parameters of clay loam based on accumulation test. Trans. Chin. Soc. Agric. Eng. 2019, 35, 116–123. [Google Scholar]
- Lu, F. Simulation calibration and experiment of main contact parameters of rice bud seed discrete element. Trans. Chin. Soc. Agric. Mach. 2018, 49, 93–99. [Google Scholar]
- Hou, Z.; Dai, N.; Chen, Z.; Qiu, Y.; Zhang, X. Determination of physical parameters of wheatgrass seeds and calibration of discrete element simulation parameters. Trans. Chin. Soc. Agric. Eng. 2020, 36, 46–54. [Google Scholar]
- Yuan, Q. Parameter calibration of discrete element model of organic fertilizer particles for mechanical fertilization. Trans. Chin. Soc. Agric. Eng. 2018, 34, 21–27. [Google Scholar]
- Zhang, P. An efficient discrete element lattice boltzmann model for simulation of particle-fluid, article-particle interactions. Comput. Fluids 2017, 147, 63–71. [Google Scholar] [CrossRef] [Green Version]
- Shi, L. Simulation parameters of flaxed seeds using discrete elementmethod and verification of seed-metering test. Trans. Chin. Soc. Agric. Eng. 2019, 35, 25–33. [Google Scholar]
- Liedekerke, P.V.; Tijskens, E.; Ramon, H. Discrete element simulations of the influence of fertiliser physical properties on the spread pattern from spinning disc spreaders. Biosyst. Eng. 2009, 102, 392–405. [Google Scholar] [CrossRef]
- Roman, K.; Roman, M.; Szadkowska, D.; Szadkowski, J.; Grzegorzewska, E. Evaluation of Physical and Chemical Parameters According to Energetic Willow (Salix viminalis L.) Cultivation. Energies 2021, 14, 2968. [Google Scholar] [CrossRef]
- Hao, J.J.; Wei, W.B.; Huang, P.C.; Qing, J.H.; Zhao, J.G. Calibration and experimental verification of discrete element parameters of sunflower seeds. Trans. Chin. Soc. Agric. Eng. 2021, 37, 36–44. [Google Scholar]
- Peng, C.W.; Xu, D.J.; He, X.; Tang, Y.H.; Sun, S.L. Parameter Calibration of Discrete Element Simulation Model for Pig Manure Organic Fertilizer Treated with Hermetia Illucen. Trans. Chin. Soc. Agric. Eng. 2020, 36, 212–218. [Google Scholar]
- Cao, B.; Li, W.H.; Wang, N.; Bai, X.Y.; Wang, W.C. Calibration of Discrete Element Parameters of the Wet Barrel Finishing Abrasive Based on JKR Model. Surf. Technol. 2019, 48, 249–256. [Google Scholar]
- Ma, Z.; Li, Y.M.; Xu, L.Z. Summarize of particle movement research in agricultural engineering realm. Trans. Chin. Soc. Agric. Mach. 2013, 44, 22–29. [Google Scholar]
- Liao, Q.X.; Zhang, P.L.; Liao, Y.T.; Yu, J.J.; Cao, X.Y. Numerical Simulation on Seeding Performance of Centrifugal Rape-seed Metering Device Based on EDEM. Trans. Chin. Soc. Agric. 2014, 45, 109–114. [Google Scholar]
- Song, S.L.; Tang, Z.H.; Zheng, X.; Liu, J.B.; Meng, X.J.; Liang, Y.C. Calibration of the discrete element parameters for the soil model of cotton field after plowing in Xinjiang of China. Trans. Chin. Soc. Agric. Eng. 2021, 37, 63–70. [Google Scholar]
- Khodabakhshian, R. Poisson’s ratio of pumpkin seeds and their kernels as a function of variety, size, moisture content and loading rate. Agric. Eng. Int. CIGR J. 2012, 14, 203–209. [Google Scholar]
- Tian, X.L.; Cong, X.; Qi, J.T.; Guo, H.; Li, M.; Fan, X.H. Parameter Calibration of Discrete Element Model for Corn Straw-Soil Mixture in Black Soil Areas. Trans. Chin. Soc. Agric. Mach. 2021, 52, 100–108, 242. [Google Scholar]
- Josep Amean Society of Agriculture and Biological Engineers. Compress. Test Food Mater. Convex Sxape; ASAE S368 4 DEC2000; Josep Amean Society of Agriculture and Biological Engineers: St. Joseph, MI, USA, 2017. [Google Scholar]
- Han, J.; Dong, M.; Li, S.; Xie, J. Experimental research on fly ash particles impacting planar surface. CIESC J. 2013, 64, 3161–3167. [Google Scholar]
- Ye, Y.; Zeng, Y.; Zeng, C.; Jin, L. Experimental study on the normal restitution coefficient of granite spheres. Chin. J. Rock Mech. Eng. 2017, 36, 633–643. [Google Scholar]
- Zhang, S.W.; Zhang, R.Y.; Chen, T.Y.; Fu, J.; Yuan, H.F. Calibration of Simulation Parameters of Mung Bean Seeds Using Discrete Element Method and Verification of Seed-metering Test. Trans. Chin. Soc. Agric. Mach. 2022, 53, 71–79. [Google Scholar]
- Li, Y.; Qiu, X.; Zhang, X. Different definitions and corresponding applicabilities of the coefficient of restitution. Mech. Eng. 2015, 37, 773–777. [Google Scholar]
- Wang, L. Determination of the coefficient of rolling friction of an irregularly shaped maize particle group using physical experiment and simulations. Particuology 2018, 38, 185–195. [Google Scholar] [CrossRef]
- Ciornei, M.C. A method for the determination of the coefficient of rolling friction using cycloidal pendulum. IOP Conf. Ser. Mater. Sci. Eng. IOP Publ. 2017, 227, 012–027. [Google Scholar] [CrossRef] [Green Version]
- Shi, L. Investigation of interaction effect between static and rolling friction of corn kernels on repose formation by DEM. Int. J. Agric. Biol. Eng. 2021, 14, 238–246. [Google Scholar] [CrossRef]
- Ma, Y. Parameters calibration of discrete element model for alfalfa straw compression simulation. Trans. Chin. Soc. Agric. Eng. 2020, 36, 22–30. [Google Scholar]
- Zhang, R.; Han, D.; Ji, Q.; He, Y.; Li, J. Calibration Methods of Sandy Soil Parameters in Simulation of Discrete Element Method. Trans. Chin. Soc. Agric. Mach. 2017, 48, 49–56. [Google Scholar]
- Wen, X. Test of Suspension Velocity of Granular Fertilizer Based on EDEM-Fluent Coupling. Trans. Chin. Soc. Agric. Eng. 2020, 51, 69–77. [Google Scholar]
- Yao, Z.L.; Ouyang, S.P.; Meng, H.B. Flow characterization of biomass particle straw. Trans. Chin. Soc. Agric. Mach. 2012, 43, 112–116. [Google Scholar]
- Liu, F.; Zhang, J.; Li, B.; Chen, J. Calibration of parameters of wheat required in discrete element method simulation based on repose angle of particle heap. Trans. Chin. Soc. Agric. Eng. 2016, 32, 247–253. [Google Scholar]
Publisher’s Note: MDPI stays neutral with regard to jurisdictional claims in published maps and institutional affiliations. |
© 2022 by the authors. Licensee MDPI, Basel, Switzerland. This article is an open access article distributed under the terms and conditions of the Creative Commons Attribution (CC BY) license (https://creativecommons.org/licenses/by/4.0/).