Article

Temperature-Programmed Reduction of NiO/Al2O3 by Biochar In Situ Generated from Citric Acid

1
Engineering Training Center, Nanjing University of Science and Technology, Nanjing 210094, China
2
School of Energy and Power Engineering, Nanjing University of Science and Technology, Nanjing 210094, China
*
Author to whom correspondence should be addressed.
Processes 2022, 10(8), 1542; https://doi.org/10.3390/pr10081542
Submission received: 23 June 2022 / Revised: 2 August 2022 / Accepted: 3 August 2022 / Published: 5 August 2022
(This article belongs to the Special Issue Biochar-Bioenergy Production Systems)

Abstract

:
The reduction of metal oxides by biochar is an important reaction for many biomass utilization technologies. This work investigated the temperature–programmed reduction (TPR) of NiO/Al2O3 by in situ generated biochar from citric acid pyrolysis. Firstly, NiO/Al2O3 was loaded with citric acid by impregnation and then heated from ambient temperature to 900 °C in a N2 flow. The process was on–line analyzed by the TGA–FTIR technique. Secondly, a series of intermediates was obtained and characterized by XRD, CHNO elemental analysis, and temperature programmed oxidation (TPO). Lastly, a control experiment of unsupported NiO was conducted to show the influence of Al2O3 support on the NiO reduction. Results showed that the whole heating process could be resolved into two parts that is citric acid pyrolysis and NiO reduction at a heating rate of 5 °C/min. The NiO reduction occurred above 400 °C with the biochar from citric acid pyrolysis as reductant. In the temperature–programmed reduction process, the Al2O3–supported NiO exhibited three reduction phases in contrast with only one reduction phase for the unsupported NiO. A hypothesis was proposed to explain this. The presence of Al2O3 support may result in different deposition sites of biochar (on NiO or on Al2O3), and consequently different reduction mechanisms.

1. Introduction

As a renewable energy source and resource, biomass has great potential to be exploited in chemical looping combustion (CLC) [1,2,3,4,5,6,7], green metallurgy [8,9,10,11,12,13], and synthesis of biochar–supported metal catalysts [14,15,16,17,18]. These biomass utilization technologies involve a common reaction that is the reduction of metal oxides by biochar. Taking CLC of biomass as example, in a typical CLC process, metal oxides such as NiO, Fe2O3, and CuO are employed as oxygen carriers to transport oxygen from air to fuels via redox reactions [19,20,21]. In this way, the combustion product is not diluted by atmospheric N2 and thus the capture of CO2 happens readily. The CLC of biomass, which has been successfully demonstrated in the lab [5,6,7,22,23], would make the concept of negative CO2 emission possible since biomass is carbon-neutral fuel. According to the working principle of CLC, the key to an efficient CLC of biomass is the reactivity between biomass and metal oxides at a high temperature in an inert atmosphere [6,22,24,25,26,27,28,29]. Under this condition, biomass is thermally decomposed into volatiles (e.g., CO, H2, and light hydrocarbons) and biochar first, and then these pyrolysis products react with metal oxides. The reduction of metal oxides by these volatiles is easy to occur and has been extensively studied [30,31,32,33,34,35,36,37,38]. In contrast, the investigation of the reaction mechanism between metal oxides and biochar is still in progress [11,25,26,27,28].
Some researchers support a gasification–reduction mechanism (or called ‘gaseous reduction mechanism’), in which the gasification of biochar occurs first, and then metal oxides are reduced by gasification products (such as H2 and CO) [6,12,22,24,39]. Under this mechanism, de Diego et al. [6,22,24] have suggested utilizing CO2 or steam as gasifying agents and fluidizing agents for biomass CLC. Fang He et al. [39] successfully demonstrated the chemical looping conversion of pine sawdust without using any gasifying agents. They believed that once the reduction is initiated by biomass pyrolysis gases, the reduction products CO2 and steam could in turn gasify biochar to produce more CO and H2 for the following reduction, like a chain reaction.
Some have a different point of view. They believe that both solid–state reduction (i.e., the direct reduction of metal oxides by biochar) and gaseous reduction could occur, and which one is dominant depends on reaction conditions. Pan et al. [25,26] have investigated the potential of solid carbon to reduce metal oxides. Their thermodynamic analysis indicates that 99.999% purity of the CO2 stream can be assured in the case of the direct reduction of Cu–, Ni–, and Co–based metal oxides by carbon. Their experimental result has shown that CuO can be reduced either in a direct path by solid fuels such as coal and biochar or in an indirect path by pyrolysis and gasification products of solid fuels. The direct reduction of CuO by solid fuels can start at temperatures as low as approximately 500 °C. The work of El–Guindy and Davenport [40] showed that a solid–state reduction mechanism appears to be dominant for the reduction of ilmenite with graphite until 1020 °C. Above this temperature, gaseous reduction by the regenerated CO turns to be the main path, which causes an increase in the reaction rate. Sharma et al. [41] investigated the interaction of equi–molar micro–sized NiO particles with natural graphite between 900 °C and 1000 °C. In a closed system, the NiO is reduced both by the solid carbon and by the product CO. In vacuo, under which condition the gases evolved are continuously pumped out, the reduction proceeds only in a solid–state mechanism.
Moreover, the solid–state reduction of metal oxides by carbonaceous materials has been specially investigated. Siriwardane et al. [27] reported that the carbon in close contact with CuO could induce Cu–O bond breaking to release oxygen for the combustion of carbon. Based on this, they proposed a “fuel–induced oxygen release” mechanism. They believed that solid–state reduction could be completed at much lower temperatures as long as adequate fuel/metal oxide contact is achieved. Surface melting of metals and wetting of carbon may contribute to the solid–solid contacts necessary for the reaction. Liu et al. [28] investigated the direct solid–solid reaction between coal char and iron oxide in both dynamic and static contact regimes. In a dynamic contact regime, the solid–solid reaction occurred at an appreciable rate without an intermediate gas at the typical operational temperature of CLC (≥950 °C). In a static contact regime, coal char particles continuously exposed fresh carbon surface available to react with the metal oxide. This allowed the direct solid–state reduction to proceed at a high fuel conversion. They also found that the in situ gasification and the solid-state reduction appeared to be in competition with each other in a steam–gasified CLC.
Although the reaction mechanism between metal oxides and solid carbonaceous materials have been studied, there are still some research gaps. As a typical CLC oxygen carrier, metal oxides are normally supported on refractory materials such as Al2O3, TiO2, and yttria–stabilized zirconium (YSZ). These inert supports play a role in dispersing active substances and maintaining mechanical strength. Meanwhile, they may affect the mechanism of metal oxide reduction, which has not attracted much attention until now. Moreover, pre–synthesized biochar is normally applied as biochar samples to react with metal oxides in previous studies, which is not in conformity with the actual situation. In a practical CLC process, biochar is produced on the surface of oxygen carriers just prior to the reduction (i.e., in situ generated biochar). The present work investigated the temperature–programmed reduction of Al2O3–supported NiO (i.e., NiO/Al2O3) by in situ generated biochar from citric acid pyrolysis. For this purpose, NiO/Al2O3 was loaded with citric acid and then heated from ambient temperature to 900 °C in a N2 flow. A slow temperature–rising program was applied to resolve the whole process into citric acid pyrolysis and NiO reduction. The biochar from citric acid pyrolysis was characterized and the influence of the support Al2O3 on the reduction mechanism is discussed.

2. Materials and Methods

2.1. Sample Preparation and Impregnation Experiments

First, 18 wt% NiO supported on Al2O3 (NiO/Al2O3) was supplied by Johnson Matthey Plc. The NiO/Al2O3 had a particle size of 0.85–2 mm and a surface area of 2.5 m2/g. The micro–morphology of the NiO/Al2O3 was characterized by a field-emission scanning electron microscope (SEM, LEO 1530). Citric acid, which naturally exists in a variety of fruits and vegetables, was selected as a biochar precursor. The loading of citric acid to the NiO/Al2O3 was carried out by the following impregnation experiment. A total of 2 g of the NiO/Al2O3 particles were impregnated with citric acid aqueous solution (20 mL, 10 g/L) overnight at room temperature without stirring. Equivalently, the ratio of citric acid and NiO was 1:1.8. The particles were then dried at 80 °C in an oven for 12 h. The NiO/Al2O3 loaded with citric acid is denoted as ‘NA–C’ herein. Blank Al2O3 with a particle size and a surface area approximate to those of the NiO/Al2O3 was used for a control experiment. The Al2O3 was loaded with citric acid by the same impregnation procedure and is referred to as ‘A–C’. The mass ratio of citric acid to Al2O3 in sample A–C was 1:10. For another control experiment, pure NiO powder, purchased from Aladdin, was impregnated with citric acid, and denoted as ‘N–C’. The ratio of citric acid to NiO in sample N–C was 1:1.8, the same as that in sample NA–C.

2.2. TGA–FTIR Experiments

TGA–FTIR experiments were conducted on a thermal gravity analyzer (TGA, Stanton Redcroft TGH1000, London, UK) and a Fourier transform infrared spectroscope (FTIR, Thermo Scientific Nicolet iS10, Madison, IN, USA). The TGA apparatus acted as a micro-reactor that could control temperature–rising programs and monitor mass change. The FTIR apparatus was employed to achieve online FTIR analysis of the gaseous products. Species evolution profile against temperature (i.e., Chemigrams) was created by Nicolet’s OMNIC software. Wavenumber ranges set for creating chemigrams were shown in Table S1. In a typical TGA–FTIR experiment, 200 mg of samples was heated from ambient temperature to 900 °C at 5 °C/min under a N2 flow of 50 mL/min.

2.3. Acquisition of Intermediates

Sample NA–C was heated at 5 °C/min under a N2 flow on the TGA apparatus. The heating was terminated at different temperatures (280, 400, 480, 530, 640, 740, and 900 °C) to collect a series of solid intermediates. These intermediate samples are denoted as ‘NA–C–T’, where ‘T’ is the ultimate temperature in °C. They were crushed to fine powder for the following XRD characterization, CHNO elemental analysis, and TPO tests.

2.4. XRD Characterization and Rietveld Refinement

X-ray diffraction (XRD) characterization was carried out on a PANalytical X’pert MPD instrument with Cu Kα radiation. A voltage of 40 kV and a current of 40 mA were applied to the X-ray generator. The scanning range (2θ) of X-rays was from 20° to 80° with an increment of 0.0332°/step and a speed of 0.7 s/step. In order to determine the reduction degree, Rietveld refinement of XRD data was performed using X’Pert HighScore Plus software (PANalytical B.V., Almelo, The Netherlands).

2.5. CHNO Elemental Analysis

CHNO elemental analysis was conducted on Thermo Scientific Flash EA 2000 from America. A powdered sample of around 15 mg was wrapped by a tin foil and then fed to the analyzer. Each sample was tested twice and mean values were reported in this work.

2.6. Temperature Programmed Oxidation (TPO) Tests

A temperature–programmed oxidation (TPO) test was also carried out on the TGA–FTIR instrument. About 150 mg of powdered samples was heated from ambient temperature to 900 °C at 5 °C/min under an air flow of 50 mL/min. The gaseous products were on–line analyzed by the FTIR instrument.

3. Results and Discussion

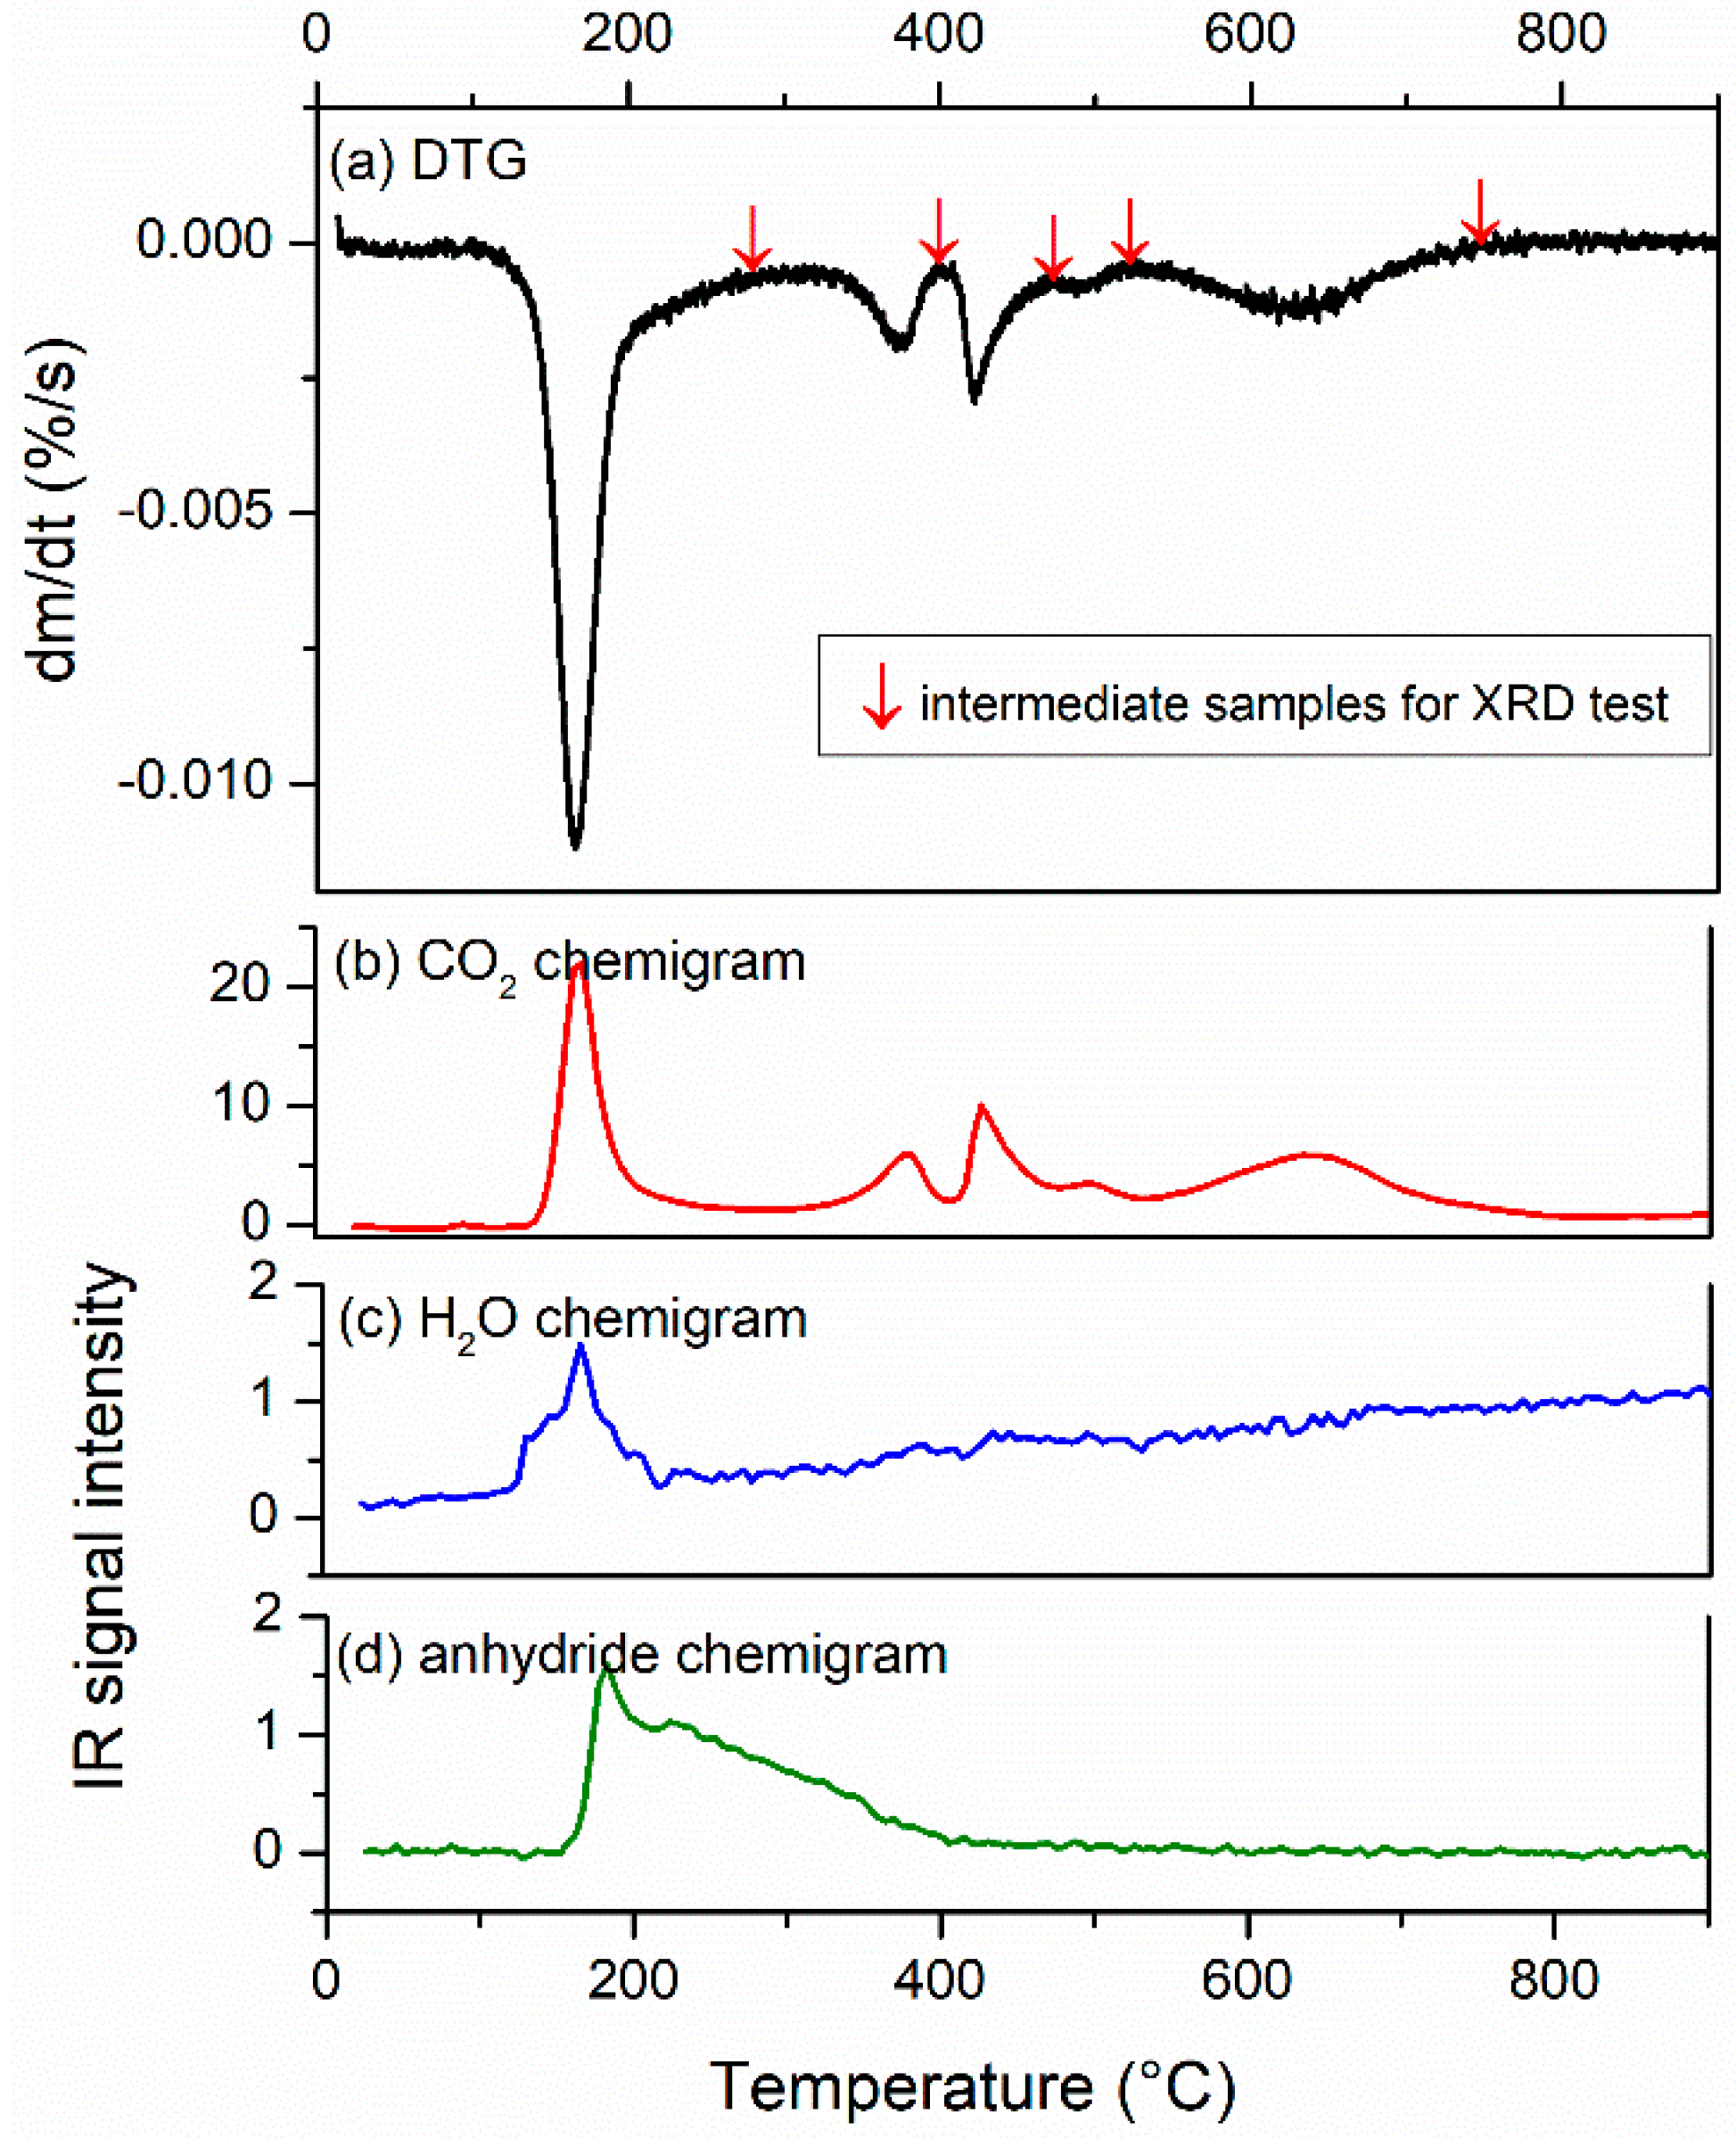
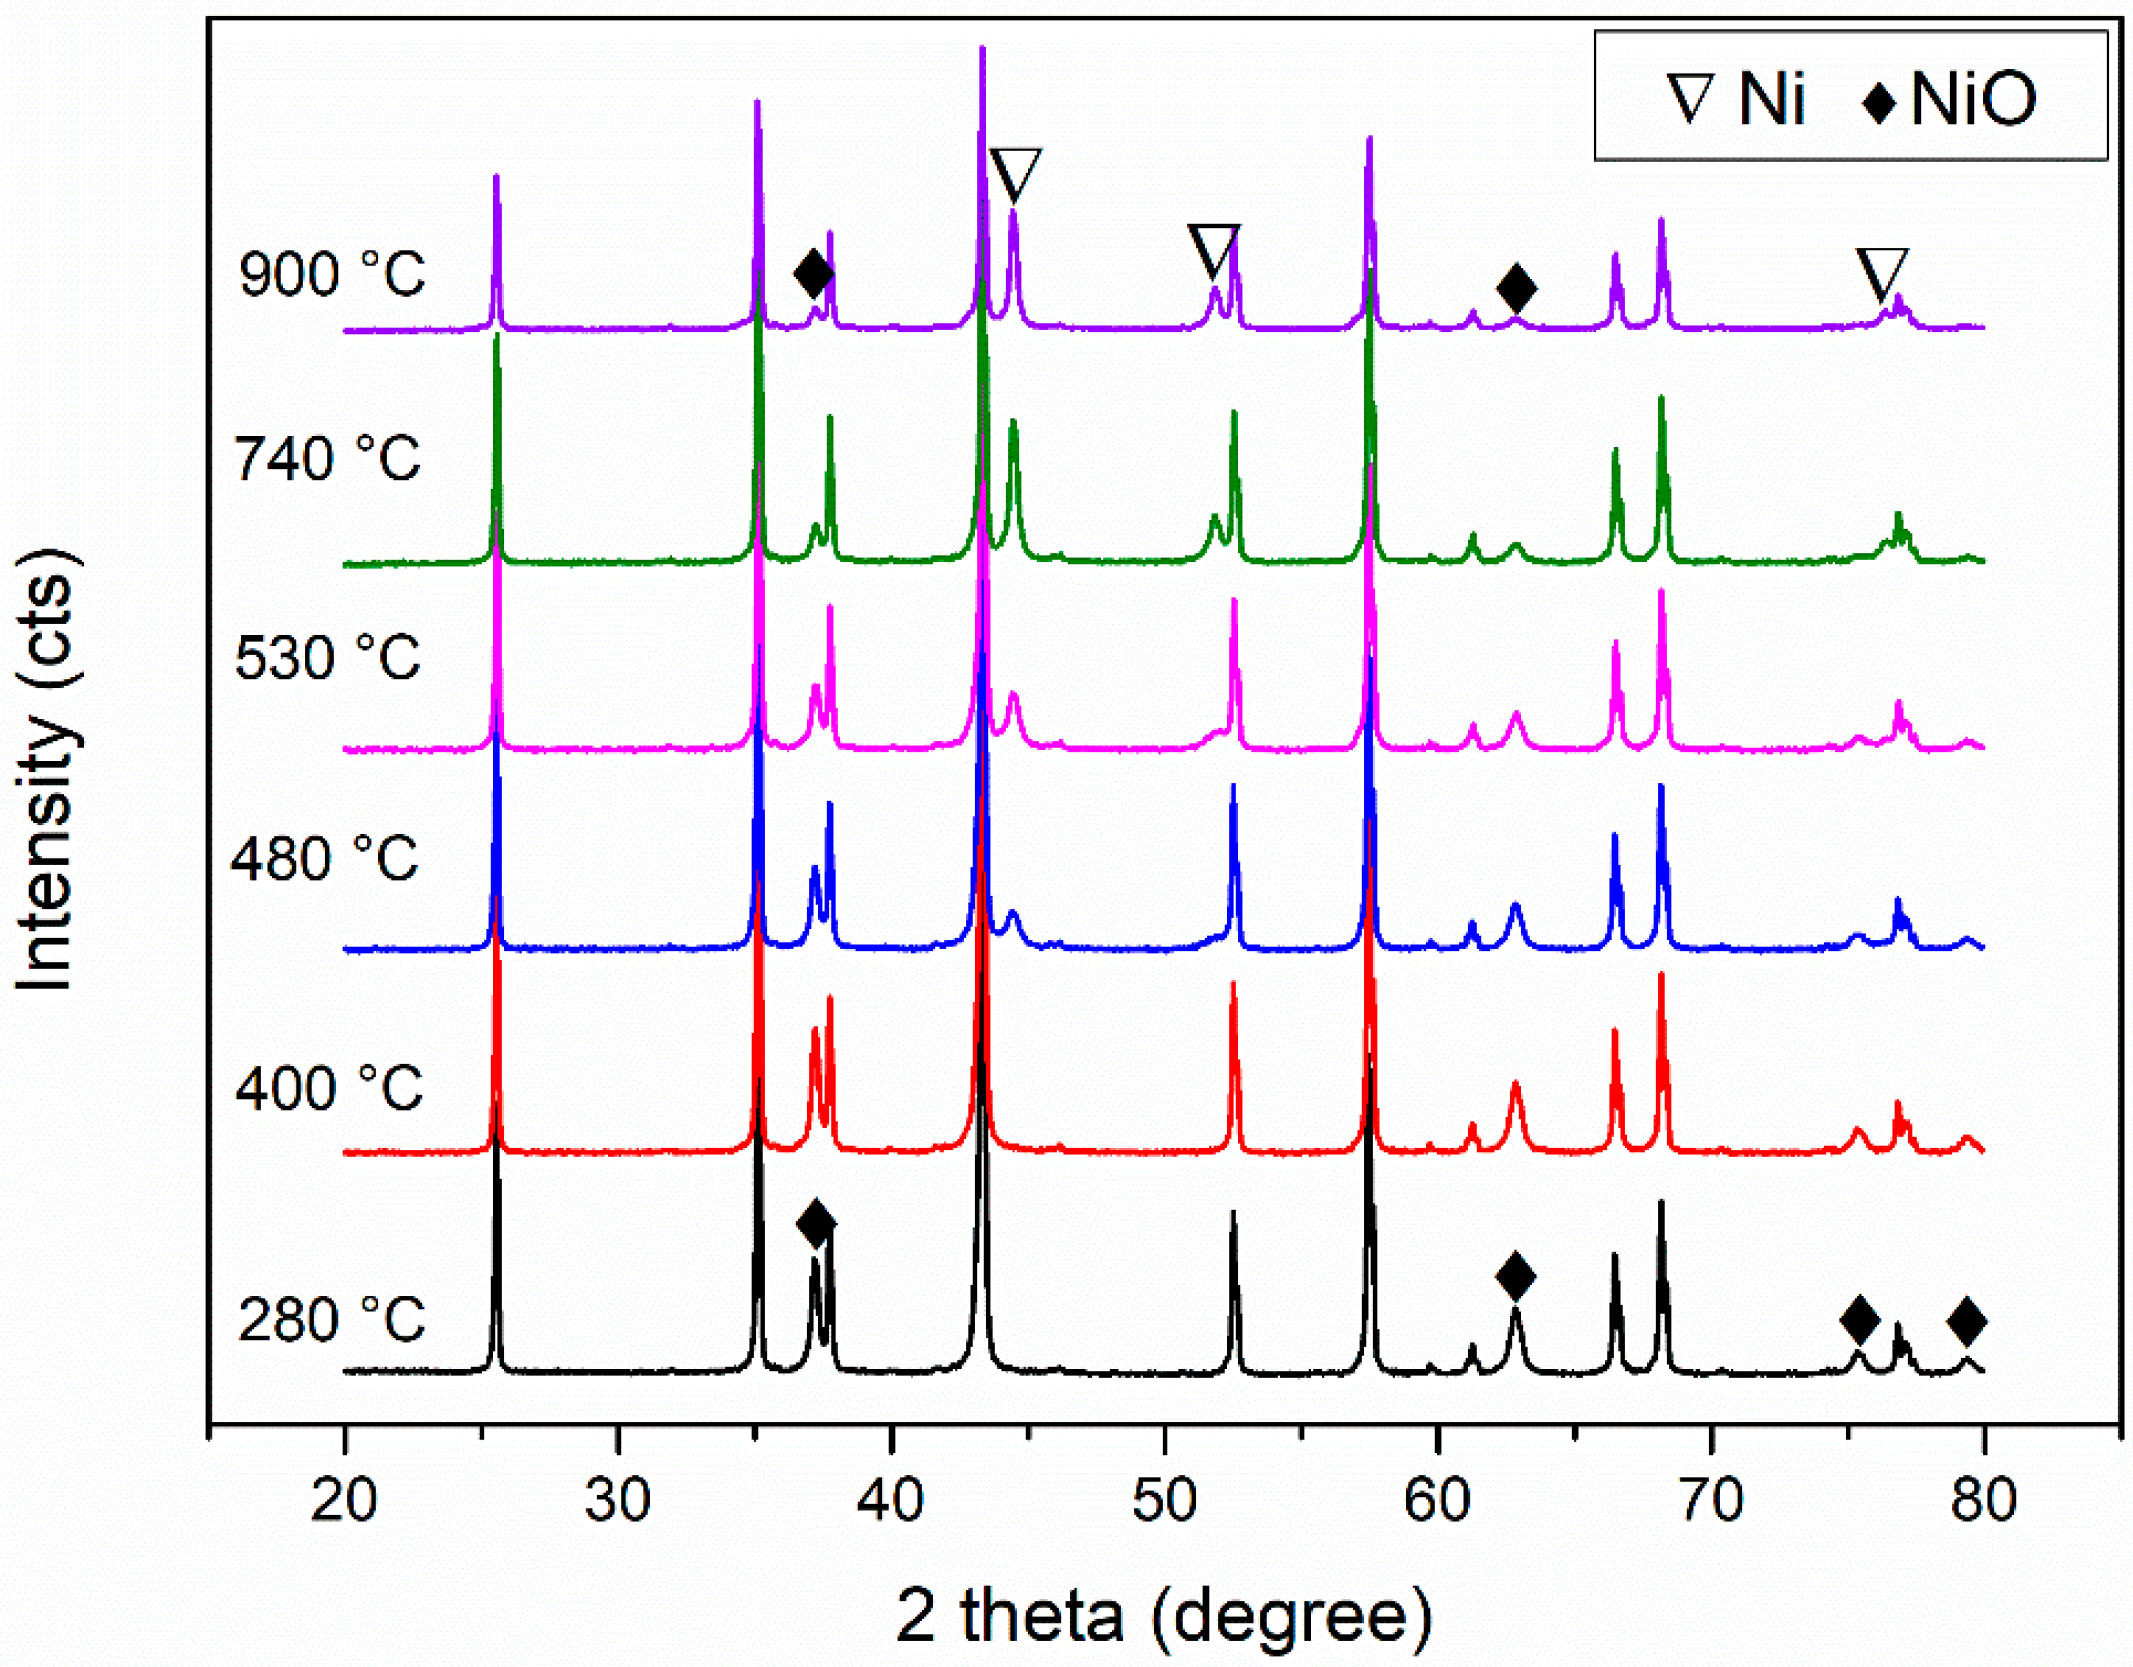
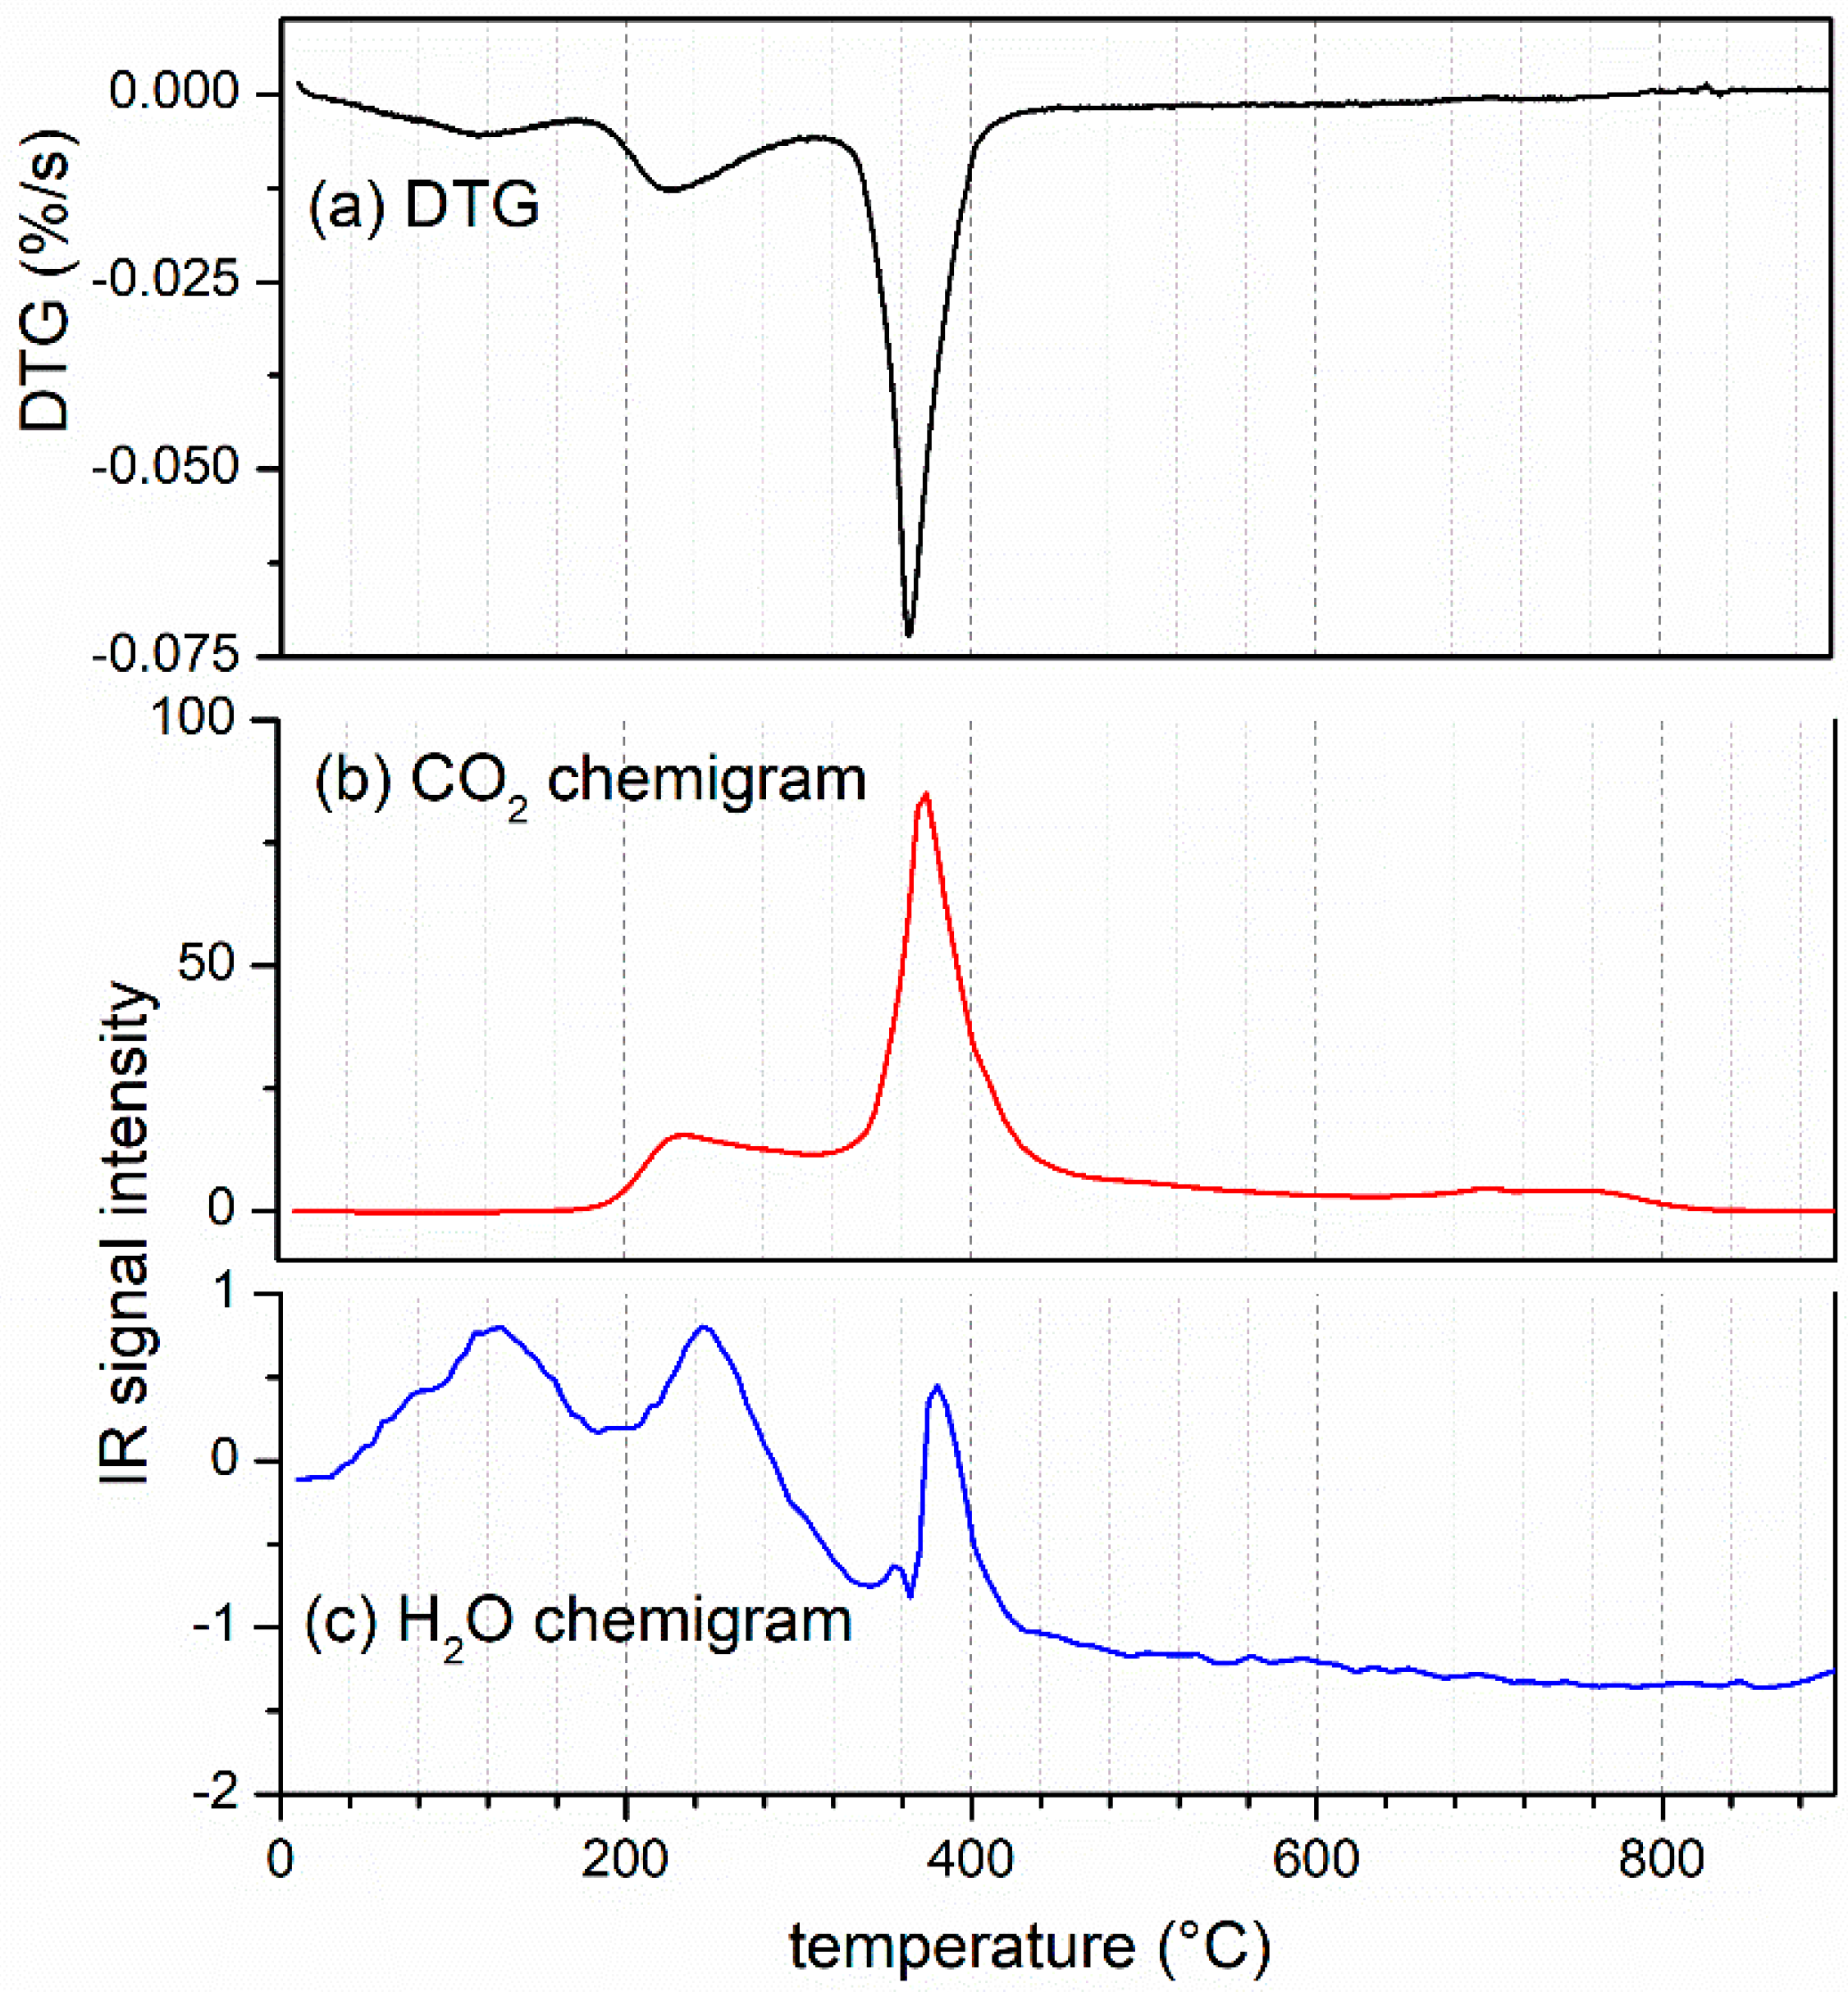
3.1. Process Analysis (TGA–FTIR and XRD Results)

When the NA–C sample (i.e., NiO/Al2O3+citric acid) is subjected to heating from ambient temperature to 900 °C under a N2 flow, a complex reaction network may exist, which includes citric acid pyrolysis and NiO reduction by pyrolysis products (both volatiles and biochar). In order to study solely the reaction between NiO and the in situ generated biochar, it is necessary to isolate the reduction reaction from others. Theoretically, slow heating favors the resolution of successive reactions, and a large flow of sweeping gas can help to eliminate the influence of volatile products on NiO reduction. A heating rate of 5 °C/min and a N2 flow of 50 mL/min were adopted in this study, and the TGA–FTIR result under this condition is presented in Figure 1.
Figure 1a (DTG curve) shows multiple mass loss peaks. Both citric acid pyrolysis and NiO reduction could contribute to the mass loss. In order to identify which mass loss peaks are caused by the reduction process, a series of intermediates at different temperature points (marked by down arrows in Figure 1a) was obtained and characterized by XRD. As the XRD result (Figure 2) shows, metallic Ni was not detected until 480 °C, implying that the onset temperature of NiO reduction was at 400 °C. Moreover, the control experiment of sample A–C (i.e., Al2O3+citric acid) suggested that the pyrolysis of citric acid occurred only below 400 °C (see Figure S1). Therefore, the whole temperature-rise process could be resolved into two parts that were citric acid pyrolysis and TPR of NiO by the in situ generated biochar. These two parts are discussed, respectively, as follows.
Below 400 °C, citric acid was thermally decomposed, releasing CO2, H2O, and anhydrides as indicated by its FTIR spectra (see Figure S2 and Table S2). This result is consistent with previous studies [42,43]. The evolution profiles of these volatiles against temperature (Figure 1b–d) suggested that the volatiles were expelled from the TGA chamber before 400 °C and had little impact on the following reduction.
In the TPR process of NiO above 400 °C, three mass loss peaks were observed at around 420 °C, 500 °C, and 640 °C in Figure 1a, coinciding with three CO2 evolution peaks (Figure 1b). This result indicated that the NiO reduction involved three stages and CO2 was the main product. Figure 2 shows that the intensity of metallic Ni peaks increased while the intensity of NiO peaks decreased as the temperature rose until 740 °C. The Rietveld refinement of the XRD data for the NA–C–740 sample yielded the composition of 84.4 wt% Al2O3, 9.8 wt% Ni, and 5.8 wt% NiO (see Figure S3). The incomplete conversion of NiO to Ni (68.3%) was probably caused by the insufficiency of reductant. This argument was also supported by a negligible carbon content in the NA–C–740 sample (see Figure 3). To achieve a complete reduction, a larger loading of citric acid on the NiO/Al2O3 is necessary.

3.2. Characteristics of the In Situ Generated Biochar

As discussed in Section 3.1, the biochar from citric acid pyrolysis acts as the actual reductant for the NiO reduction since the pyrolysis occurs prior to the reduction and its volatile products are flushed out of the reactor. To better understand the reaction mechanism, the features of the biochar including its elementary composition (H/C ratio), homogeneity and reactivity are discussed in this section.

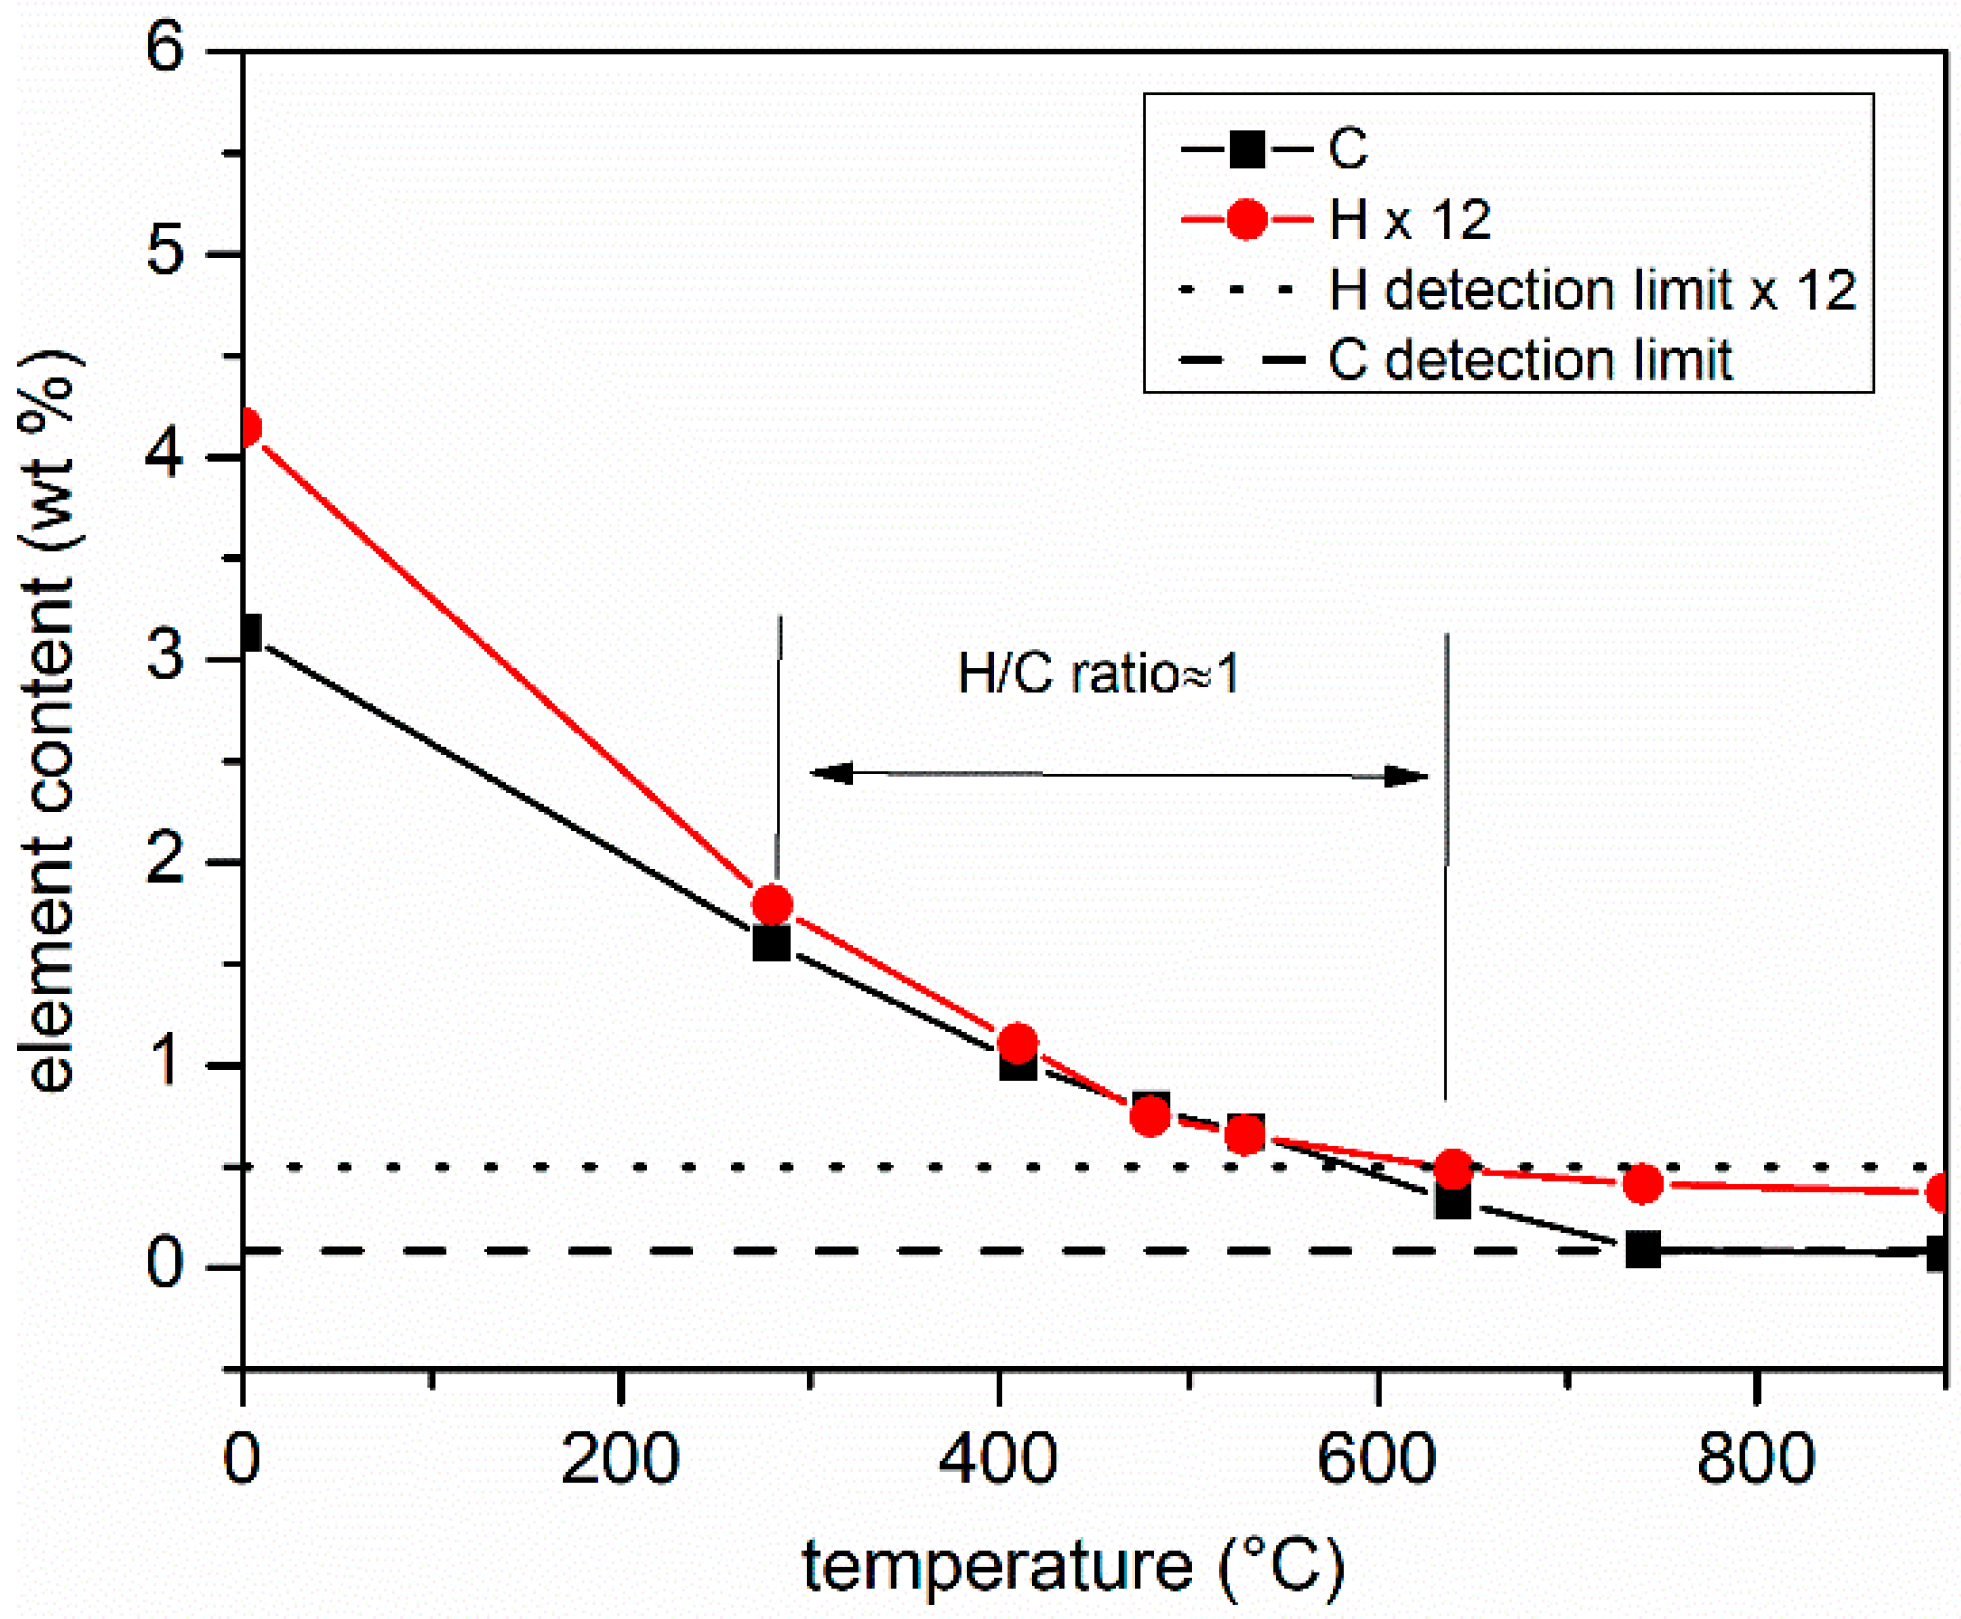
3.2.1. Elementary Composition (CHNO Elemental Analysis Results)

The CHNO elementary analysis of the NA–C–T samples (T = 280, 400, 480, 530, 640, 740, and 900 °C) indicated that the biochar from citric acid pyrolysis was mainly composed of carbon and hydrogen. The carbon and hydrogen contents of these intermediates are displayed in Figure 3. The two horizontal lines in Figure 3 indicate the carbon and hydrogen contents of the raw material NiO/Al2O3, below which the element content could be considered negligible. The far left points (T = 0 °C) in Figure 3 represent the carbon and hydrogen contents of the NA–C sample before thermal treatment. As seen in Figure 3, a carbon loading of 3.13 wt% to the NiO/Al2O3 was achieved by impregnation. As the temperature increased, the amount of carbon on the NA–C sample decreased gradually until carbon was depleted at 740 °C. At the end of citric acid pyrolysis and the beginning of NiO reduction (T = 400 °C), the carbon content was 0.95 wt%. This was the actual amount of carbon available for NiO reduction.
Figure 3. Carbon and hydrogen contents (wt%) of sample NA–C–T (T = 280, 400, 480, 530, 640, 740, and 900 °C) and sample NA–C (T = 0).
Processes 10 01542 g003
The term ‘carbon deposition efficiency’ (CDE) was introduced to quantify the charring properties of a carbon source [44]. It was defined as the mass ratio of the carbon deposited via pyrolysis to the carbon initially existing in carbon sources. A pyrolysis experiment of pure citric acid indicated that the carbon deposition efficiency of pure citric acid was 15.3%. The citric acid supported on the NiO/Al2O3 (i.e., the NA–C sample) had a carbon deposition efficiency of 30%, almost twice that of pure citric acid. This result suggested that presence of solid support significantly enhanced the carbon deposition efficiency of citric acid.
The molar ratio of hydrogen to carbon (H/C ratio) is an important parameter to indicate the crystallinity and the reactivity of carbonaceous materials [45,46]. In this study, the H/C ratio is presented by comparing 12 times the weight percentage of hydrogen with the weight percentage of carbon in Figure 3. The fresh NA–C sample (at T = ‘0’ in Figure 3) had a H/C ratio of 1.32, in good agreement with the expected values of 1.33 for pure citric acid. As the temperature rose, the H/C ratio decreased until 400 °C. Throughout the reduction process (above 400 °C), the H/C ratio was maintained at around 1.

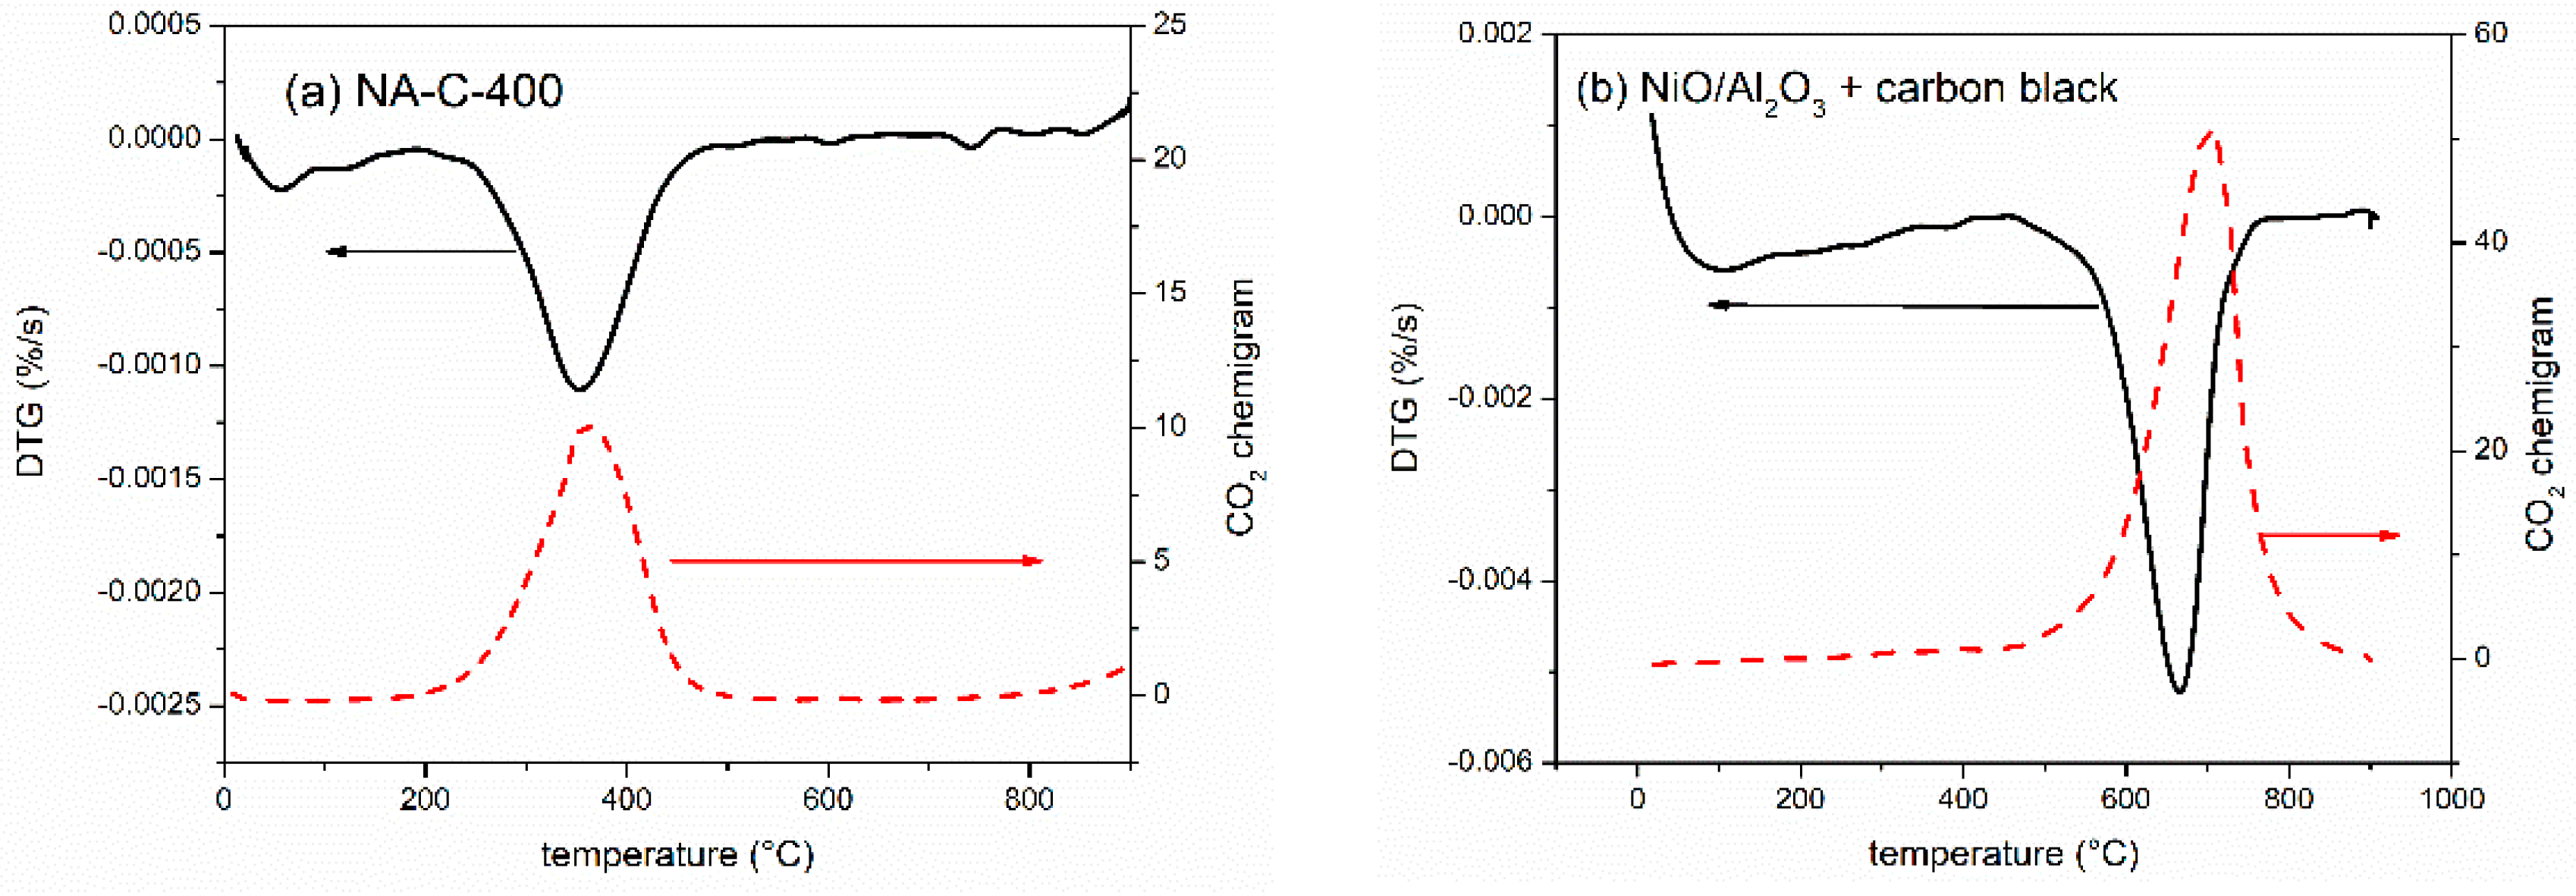
3.2.2. Reactivity and Homogeneity (TPO Results)

TPO results of the NA–C–400 sample and the NiO/Al2O3 mixed with carbon black are shown in Figure 4. The first mass loss peak occurring at around 100 °C in both Figure 4a,b was caused by moisture evaporation. The second mass loss peak accompanied by one CO2 evolution peak could be attributed to the oxidation of carbonaceous materials. The citric acid biochar in the NC–A–400 sample showed a considerably lower oxidation temperature than the carbon black (360 °C vs. 670 °C), probably because of different H/C ratios. The H/C ratio of the citric acid biochar was around 1 while the carbon black contained more than 97% elemental carbon. It seems that a carbonaceous material with a larger H/C ratio exhibits a higher reactivity. This point of view was also supported by comparing the reduction reactivity of the citric acid biochar and a glucose biochar. Previous studies [44] prepared a glucose biochar with a H/C ratio of 0.6 and reported its reducibility on the NiO/Al2O3. Compared with the glucose biochar, the citric acid biochar showed a larger H/C ratio as well as a lower NiO reduction temperature (see Figure 1a in this study and Figure 2b in [44]). Further work is required to verify and quantify the correlation between the H/C ratio and the reactivity in future.
In addition to the reactivity, the homogeneity of the citric acid biochar could also be reflected by the TPO results. As seen in Figure 4a, only one oxidation peak was observed for the NA–C–400 sample, implying that only one type of biochar was formed on the NiO/Al2O3.

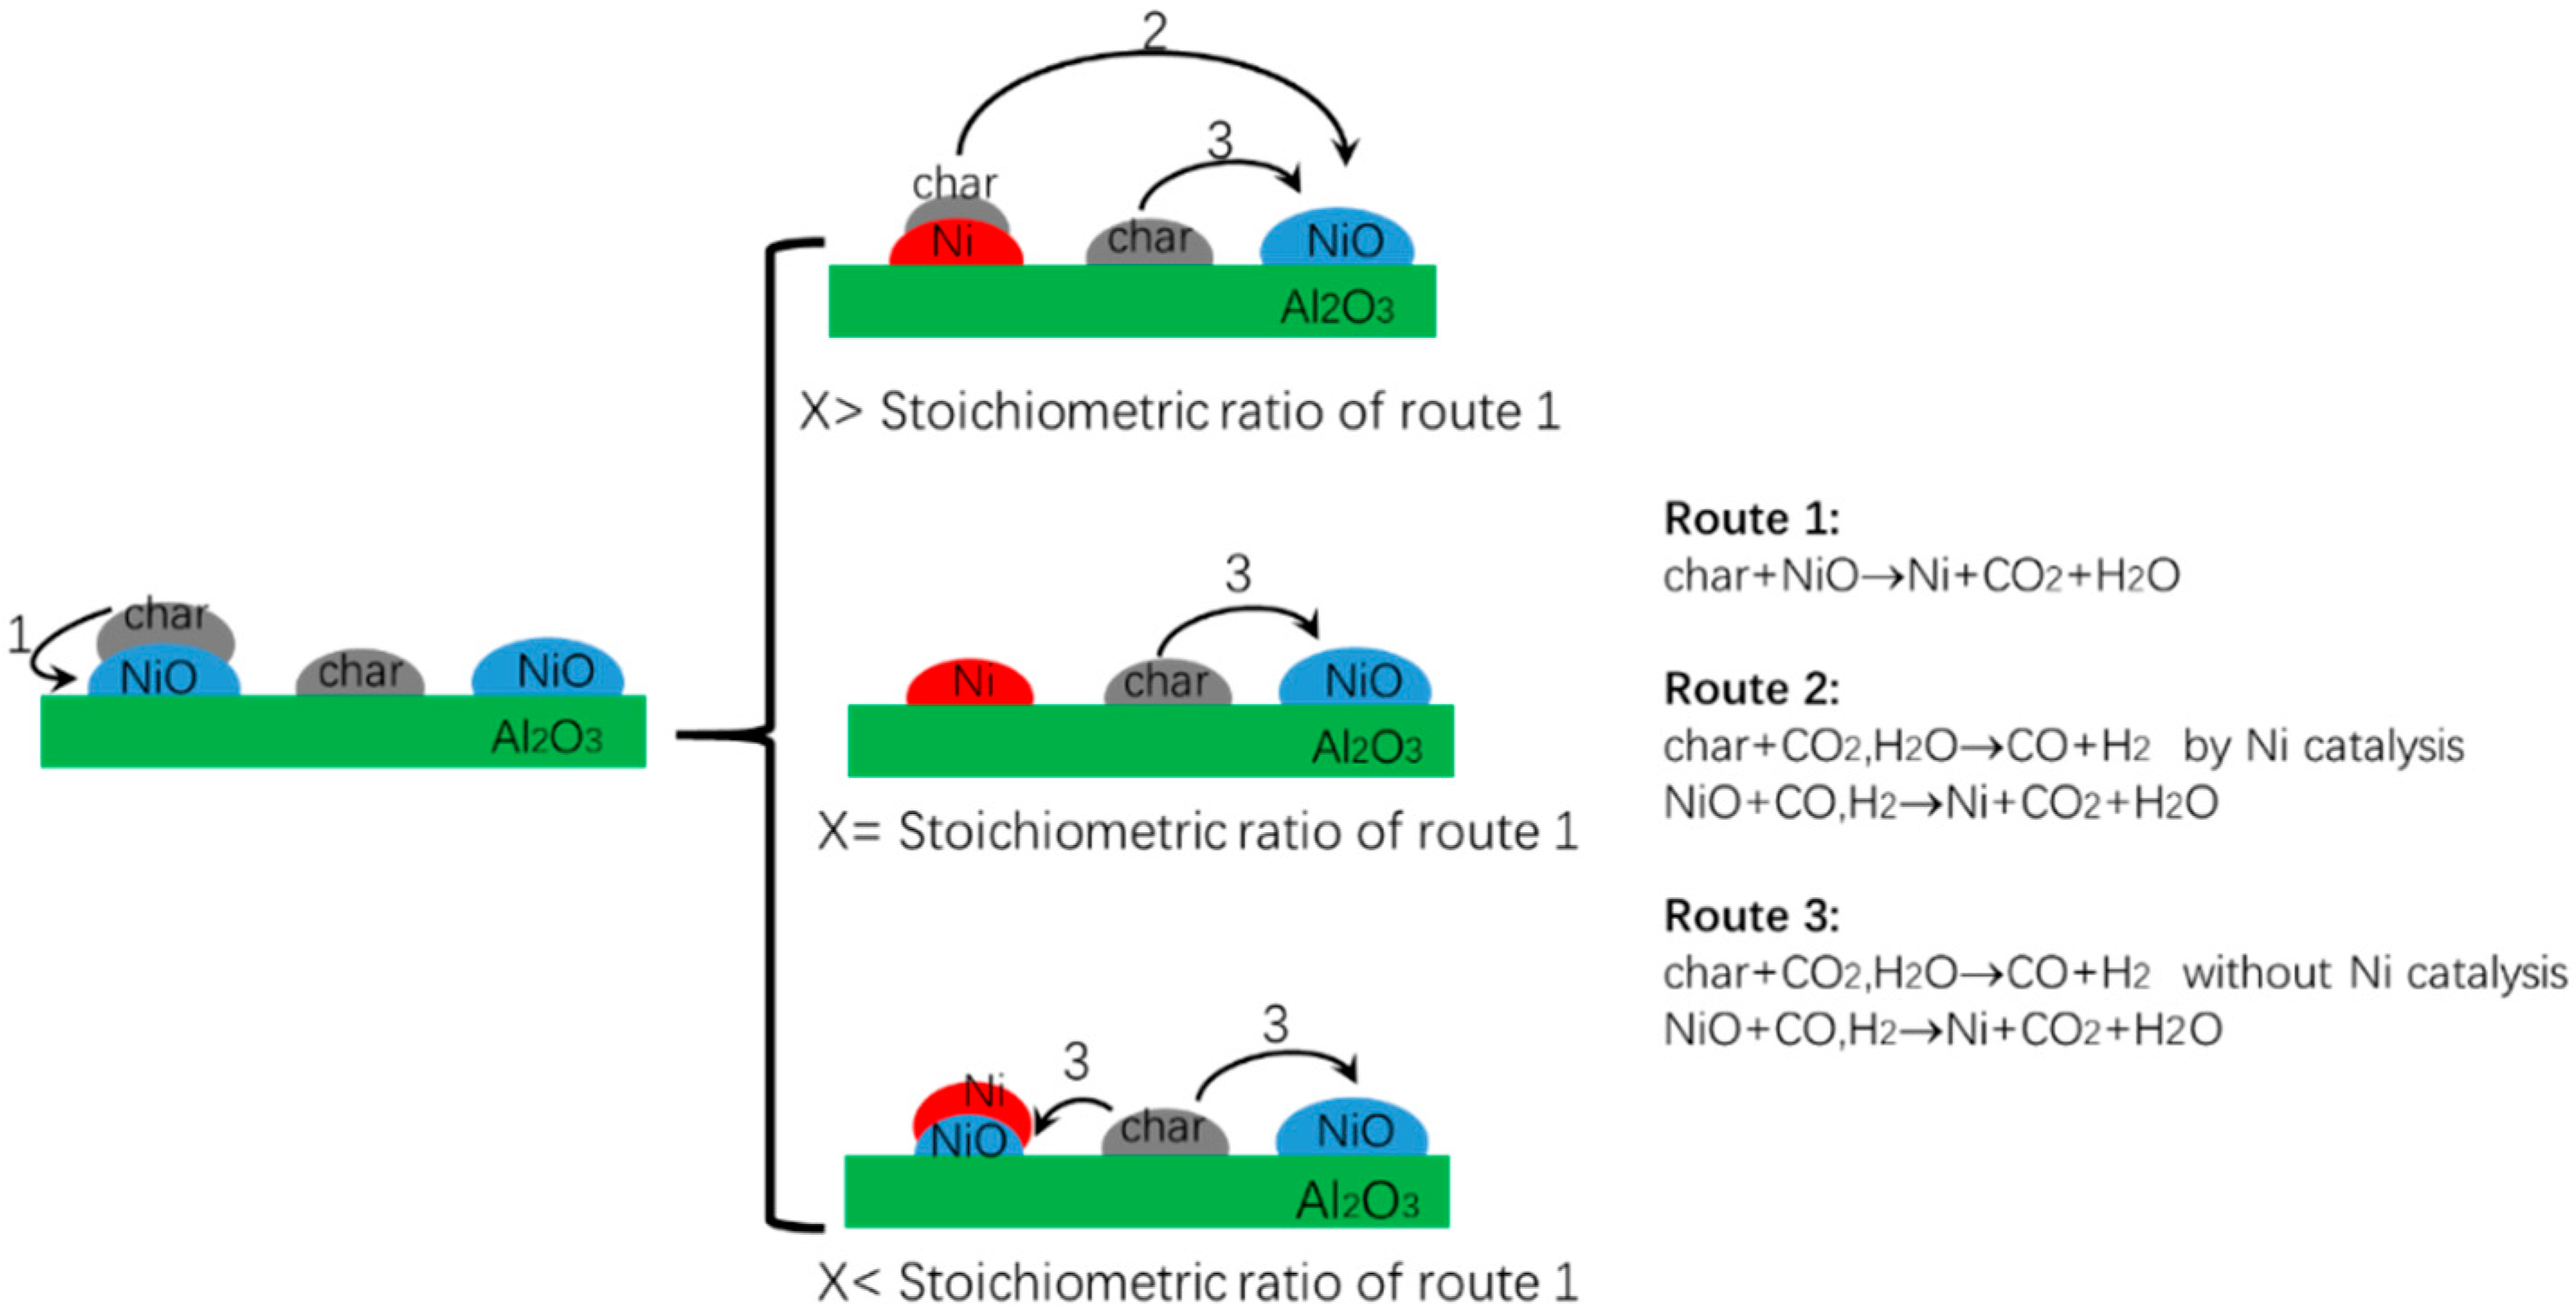
3.3. Influences of Al2O3 Support on Reduction Mechanism

In order to find out the influence of Al2O3 support on the NiO reduction, a comparative experiment of the N–C sample (i.e., unsupported NiO + citric acid) was carried out, and the TGA–FTIR result is shown in Figure 5. The three mass loss peaks observed in Figure 5a could be attributed to moisture evaporation, citric acid pyrolysis, and NiO reduction based on the evolution profiles of volatile products (Figure 5b,c). By comparing the TGA–FTIR results of the NA–C sample (Figure 1) and the N–C sample (Figure 5), it was found that the existence of Al2O3 support affected NiO reduction from the following aspects. First, the reduction of the Al2O3–supported NiO occurred at a higher temperature than the unsupported NiO probably due to the interaction between the NiO and the Al2O3. For example, the onset temperature for the reduction of the supported NiO was 400 °C (Figure 1a) while the reduction of unsupported NiO started at 320 °C (Figure 5a). Second, the Al2O3–supported NiO exhibited three reduction stages in contrast with only one reduction stage for the unsupported NiO. The occurrence of multiple reduction stages has been reported in the literature [47,48] and is usually ascribed to (1) the existence of different oxidized Ni species and (2) heterogeneity of the reductant. These two possibilities, however, were excluded in this work. XRD characterization of the NiO/Al2O3 showed that there was no oxidized Ni species other than NiO. The TPO test (Figure 4) indicated that the reductant biochar was homogenous.
The multiple reduction stages observed in this study may be related with the presence of Al2O3 support, which results in different deposition sites of the biochar. Figure 6 shows the SEM image of the NiO/Al2O3 used in this study. The EDX mapping of this material can be found in our previous study [44]. As these results indicate, the particles with a wide size distribution from tens to hundreds of nanometers in Figure 6 can be assigned to NiO while the particles on a micrometer scale are the Al2O3 support. In brief, the NiO/Al2O3 had a micro–morphology of NiO particles scattering over the Al2O3 support. Thus, it is reasonable to suppose that the biochar from citric acid pyrolysis was randomly deposited on the NiO particles as well as the Al2O3 support, and some NiO particles were not covered. Different deposition sites may lead to different reaction routes. A schematic diagram of possible reaction routes is shown in Figure 7. The first reduction stage observed in Figure 1a could be attributed to the solid–state reduction of NiO by the biochar in contact (i.e., route 1 in Figure 7), which usually occurs at a lower temperature than the gaseous reduction [25,26,40,44]. The solid–state reduction comes to an end once either the biochar on NiO particles or the NiO covered by biochar is depleted. The ratio of the biochar and the NiO in contact with each other (termed as X) is crucial to determine the reaction route following the solid-state reduction. As shown in Figure 7, when the ratio X is larger than the stoichiometric ratio of route 1, the extra biochar remains on the product Ni after the solid–state reduction. The biochar on the metallic Ni shows a higher gasification activity than that on the support due to the catalytic effect of metallic Ni. Correspondingly, there are two gaseous reduction phases (route 2 and route 3) and three reduction phases in total. If the ratio X is equal to or smaller than the stoichiometric ratio of route 1, the biochar on NiO particles is completely consumed by the solid–state reduction. Following this, the biochar on the support is gasified and the NiO is reduced by the gasification products CO and H2 (route 3). As a result, two reduction stages are shown. Actually, a two–stage reduction mechanism was proposed in [44] to explain the two TPR peaks observed for NiO/Al2O3 reduction with glucose. Different from the two–stage reduction mechanism, the hypothesis proposed in this study took into consideration the catalytic effect of product Ni on biochar gasification, which splits one gaseous reduction stage into two. Therefore, the hypothesis proposed in this study is more advanced than the two-stage reduction mechanism.
In order to prove this hypothesis, the following confirmatory experiments will be carried out in the future. (a) The intermediates during the TPR process (at 400 °C, 480 °C, 530 °C, and 740 °C) will be characterized by TEM–EDX. If the hypothesis is correct, the following results are expected. The TEM–EDX result of the intermediate at 400 °C will show that some NiO particles are covered by biochar and some are not. For the intermediate at 480 °C, its TEM–EDX result will show the disappearance of the NiO covered by biochar and the appearance of the metallic Ni covered by biochar. For the intermediate at 530 °C, its TEM–EDX result will show that the metallic Ni is uncovered and all biochar is located on Al2O3. The TEM–EDX result of the intermediate at 740 °C will show that all biochar are depleted. (b) A series of NA–C samples (i.e., NiO/Al2O3 + citric acid) with different ratios of citric acid to NiO will be prepared and subjected to a TGA–FTIR experiment. In the present study, the ratio of citric acid to NiO was 1:1.8 and three TPR peaks were observed. If the hypothesis is correct, the following results are expected. When the ratio of citric acid to NiO is decreased from 1:1.8 to some extent, for example, 1:2 or 1:2.5, only two TPR peaks will be observed, corresponding to the case of when X is less or equal to the stoichiometric ratio in Figure 7. When the ratio gradually increases from 1:1.8 (for example, to 1:1.5, 1:1, and 1:0.5), more and more NiO will be covered by biochar and thus can be directly reduced by biochar. As a result, the proportion of the first TPR peak (i.e., the solid–state reduction) will be enhanced until the other two TPR peaks (i.e., the gaseous reduction) disappear.

4. Conclusions

The reduction of metal oxides by biochar is involved in many biomass utilization technologies such as chemical looping combustion and direct reduction of iron ore. This work investigated the temperature–programmed reduction of NiO/Al2O3 by in situ generated biochar from citric acid pyrolysis. The NiO/Al2O3 loaded with citric acid underwent two reactive processes that is citric acid pyrolysis and NiO reduction in the course of heating from ambient temperature to 900 °C under a N2 flow. The two processes could be separated from each other at a heating rate of 5 °C/min. The pyrolysis of citric acid occurred below 400 °C and produced homogenous biochar with a H/C ratio of around 1. The in situ generated biochar acted as a reductant for the following NiO reduction above 400 °C. The Al2O3–supported NiO exhibited three reduction phases in contrast with only one reduction phase for unsupported NiO during the same heating process. A hypothesis was proposed to explain this. The existence of Al2O3 support may result in different deposition sites of biochar (on NiO or on Al2O3), and consequently different reduction mechanisms. The biochar deposited on NiO particles could directly reduce NiO via solid–state reduction, which usually starts at a lower temperature than gaseous reduction. The biochar without contacting NiO follows a gaseous reduction mechanism, under which NiO is reduced by syngas generated via biochar gasification. The gasification activity of the biochar on product Ni is higher than that on support Al2O3 due to the catalytic effect of metallic Ni. Therefore, three reduction phases are possible. In order to further prove this hypothesis, TEM–EDX characterization of intermediates during the TPR process and TGA–FTIR experiments with different ratios of citric acid to NiO/Al2O3 will be carried out in the future.

Supplementary Materials

The following supporting information can be downloaded at: https://www.mdpi.com/article/10.3390/pr10081542/s1, Figure S1: TGA–FTIR results of Al2O3 + citric acid at a heating rate of 5 °C/min under a N2 flow: (a) DTG curve, (b) CO2 evolution profile, (c) H2O evolution profile, and (d) anhydride evolution profile; Figure S2: IR transmittance spectra of volatile products in the TGA–FTIR experiments (a heat ramp of 5 °C/min under N2 flow): (a) pure citric acid at 213 °C, (b) Al2O3 + citric acid at 188 °C, and (c) NiO/Al2O3 + citric acid at 208 °C; Figure S3: XRD profile of the NA–C–740 sample and its Rietveld refinement result: 84.4% α-Al2O3, 9.8% Ni, and 5.8% NiO; weighted R profile was 4.10 and goodness of fit was 4.34. (ICDD reference code for α-Al2O3: 04–005–4505, for NiO: 04–013–0890, and for Ni: 04–010–6148). Table S1: Wavenumber ranges set for collecting chemigrams of volatile products in the TGA–FTIR experiments. Table S2: IR bands in the above FTIR spectra and their assignment.

Author Contributions

Conceptualization, X.L. and F.C.; methodology, F.C.; validation, X.L. and F.C.; formal analysis, F.C.; investigation, F.C.; resources, X.L.; data curation, F.C.; writing—original draft preparation, F.C.; writing—review and editing, X.L.; supervision, X.L.; project administration, X.L.; funding acquisition, X.L. All authors have read and agreed to the published version of the manuscript.

Funding

This research was funded by Natural Science Foundation of Jiangsu Province, grant number BK20170095 and the Fundamental Research Funds for the Central Universities, No. 30917011327. The APC was funded by the Fundamental Research Funds for the Central Universities.

Data Availability Statement

Not applicable.

Conflicts of Interest

The authors declare no conflict of interest. The funders had no role in the design of the study; in the collection, analyses, or interpretation of data; in the writing of the manuscript; or in the decision to publish the results.

References

  1. Krzywanski, J.; Czakiert, T.; Nowak, W.; Shimizu, T.; Zylka, A.; Idziak, K.; Sosnowski, M.; Grabowska, K. Gaseous emissions from advanced CLC and oxyfuel fluidized bed combustion of coal and biomass in a complex geometry facility: A comprehensive model. Energy 2022, 251, 123896. [Google Scholar] [CrossRef]
  2. Xu, D.; Tong, A.; Fan, L.-S. State of Scale-Up Development in Chemical Looping Technology for Biomass Conversions: A Review and Perspectives. Waste Biomass Valorization 2022, 13, 1363–1383. [Google Scholar] [CrossRef]
  3. Coppola, A.; Scala, F. Chemical Looping for Combustion of Solid Biomass: A Review. Energy Fuels 2021, 35, 19248–19265. [Google Scholar] [CrossRef]
  4. Shahbaz, M.; AlNouss, A.; Ghiat, I.; McKay, G.; Mackey, H.; Elkhalifa, S.; Al-Ansari, T. A comprehensive review of biomass based thermochemical conversion technologies integrated with CO2 capture and utilisation within BECCS networks. Resour. Conserv. Recycl. 2021, 173, 105734. [Google Scholar] [CrossRef]
  5. Wang, X.; Chen, Z.; Hu, M.; Tian, Y.; Jin, X.; Ma, S.; Xu, T.; Hu, Z.; Liu, S.; Guo, D.; et al. Chemical looping combustion of biomass using metal ferrites as oxygen carriers. Chem. Eng. J. 2017, 312, 252–262. [Google Scholar] [CrossRef]
  6. Mendiara, T.; Adanez-Rubio, I.; Gayan, P.; Abad, A.; de Diego, L.F.; Garcia-Labiano, F.; Adanez, J. Process Comparison for Biomass Combustion: InSitu Gasification-Chemical Looping Combustion (iG-CLC) versus Chemical Looping with Oxygen Uncoupling (CLOU). Energy Technol. 2016, 4, 1130–1136. [Google Scholar] [CrossRef]
  7. Wu, H.-C.; Ku, Y.; Tsai, H.-H.; Kuo, Y.-L.; Tseng, Y.-H. Rice husk as solid fuel for chemical looping combustion in an annular dual-tube moving bed reactor. Chem. Eng. J. 2015, 280, 82–89. [Google Scholar] [CrossRef]
  8. Zhang, J.; Fu, H.; Liu, Y.; Dang, H.; Ye, L.; Conejio, A.N.; Xu, R. Review on biomass metallurgy: Pretreatment technology, metallurgical mechanism and process design. Int. J. Miner. Metall. Mater. 2022, 29, 1133–1149. [Google Scholar] [CrossRef]
  9. Murakami, T.; Higashi, R.; Maruoka, D.; Kasai, E. Reduction of Iron Ore by Uncarbonized Biomass in a Rotary Kiln Type Furnace. Isij Int. 2021, 61, 2971–2978. [Google Scholar] [CrossRef]
  10. Wei, R.; Zhang, L.; Cang, D.; Li, J.; Li, X.; Xu, C.C. Current status and potential of biomass utilization in ferrous metallurgical industry. Renew. Sustain. Energy Rev. 2017, 68, 511–524. [Google Scholar] [CrossRef]
  11. Ye, Q.; Peng, Z.; Li, G.; Liu, Y.; Liu, M.; Ye, L.; Wang, L.; Rao, M.; Jiang, T. Rapid microwave-assisted reduction of ferromanganese spinel with biochar: Correlation between phase transformation and heating mechanism. J. Clean. Prod. 2021, 286, 124919. [Google Scholar] [CrossRef]
  12. Abd Rashid, R.Z.; Salleh, H.M.; Ani, M.H.; Yunus, N.A.; Akiyama, T.; Purwanto, H. Reduction of low grade iron ore pellet using palm kernel shell. Renew. Energy 2014, 63, 617–623. [Google Scholar] [CrossRef]
  13. Strezov, V. Iron ore reduction using sawdust: Experimental analysis and kinetic modelling. Renew. Energy 2006, 31, 1892–1905. [Google Scholar] [CrossRef]
  14. Lee, J.; Kim, K.-H.; Kwon, E.E. Biochar as a Catalyst. Renew. Sustain. Energy Rev. 2017, 77, 70–79. [Google Scholar] [CrossRef]
  15. Nguyen, H.K.D.; Pham, V.V.; Do, H.T. Preparation of Ni/biochar Catalyst for Hydrotreating of Bio-Oil from Microalgae Biomass. Catal. Lett. 2016, 146, 2381–2391. [Google Scholar] [CrossRef]
  16. Xiong, X.; Yu, I.K.M.; Cao, L.; Tsang, D.C.W.; Zhang, S.; Ok, Y.S. A review of biochar-based catalysts for chemical synthesis, biofuel production, and pollution control. Bioresour. Technol. 2017, 246, 254–270. [Google Scholar] [CrossRef] [PubMed]
  17. Yan, Q.; Wan, C.; Liu, J.; Gao, J.; Yu, F.; Zhang, J.; Cai, Z. Iron nanoparticles in situ encapsulated in biochar-based carbon as an effective catalyst for the conversion of biomass-derived syngas to liquid hydrocarbons. Green Chem. 2013, 15, 1631–1640. [Google Scholar] [CrossRef]
  18. Yao, D.; Hu, Q.; Wang, D.; Yang, H.; Wu, C.; Wang, X.; Chen, H. Hydrogen production from biomass gasification using biochar as a catalyst/support. Bioresour. Technol. 2016, 216, 159–164. [Google Scholar] [CrossRef]
  19. Lyon, R.K.; Cole, J.A. Unmixed combustion: An alternative to fire. Combust. Flame 2000, 121, 249–261. [Google Scholar] [CrossRef]
  20. Ishida, M.; Jin, H. A new advanced power-generation system using chemical-looping combustion. Energy 1994, 19, 415–422. [Google Scholar] [CrossRef]
  21. Hossain, M.M.; de Lasa, H.I. Chemical-looping combustion (CLC) for inherent separations—A review. Chem. Eng. Sci. 2008, 63, 4433–4451. [Google Scholar] [CrossRef]
  22. Mendiara, T.; Abad, A.; de Diego, L.F.; Garcia-Labiano, F.; Gayan, P.; Adanez, J. Biomass combustion in a CLC system using an iron ore as an oxygen carrier. Int. J. Greenh. Gas Control 2013, 19, 322–330. [Google Scholar] [CrossRef]
  23. Niu, X.; Shen, L.; Gu, H.; Song, T.; Xiao, J. Sewage sludge combustion in a CLC process using nickel-based oxygen carrier. Chem. Eng. J. 2015, 260, 631–641. [Google Scholar] [CrossRef]
  24. Adanez, J.; Abad, A.; Garcia-Labiano, F.; Gayan, P.; de Diego, L.F. Progress in Chemical-Looping Combustion and Reforming technologies. Prog. Energy Combust. Sci. 2012, 38, 215–282. [Google Scholar] [CrossRef]
  25. Cao, Y.; Pan, W.-P. Investigation of chemical looping combustion by solid fuels. 1. Process analysis. Energy Fuels 2006, 20, 1836–1844. [Google Scholar] [CrossRef]
  26. Cao, Y.; Casenas, B.; Pan, W.-P. Investigation of chemical looping combustion by solid fuels. 2. Redox reaction kinetics and product characterization with coal, biomass, and solid waste as solid fuels and CuO as an oxygen carrier. Energy Fuels 2006, 20, 1845–1854. [Google Scholar] [CrossRef]
  27. Siriwardane, R.; Tian, H.; Miller, D.; Richards, G.; Simonyi, T.; Poston, J. Evaluation of reaction mechanism of coal–metal oxide interactions in chemical-looping combustion. Combust. Flame 2010, 157, 2198–2208. [Google Scholar] [CrossRef]
  28. Chen, L.; Bao, J.; Kong, L.; Combs, M.; Nikolic, H.S.; Fan, Z.; Liu, K. The direct solid-solid reaction between coal char and iron-based oxygen carrier and its contribution to solid-fueled chemical looping combustion. Appl. Energy 2016, 184, 9–18. [Google Scholar] [CrossRef]
  29. Lyngfelt, A. Chemical-looping combustion of solid fuels—Status of development. Appl. Energy 2014, 113, 1869–1873. [Google Scholar] [CrossRef]
  30. Kung, H.H. Transition Metal Oxides: Surface Chemistry and Catalysis; Elsevier: Amsterdam, The Netherlands, 1989. [Google Scholar]
  31. Sharma, S.; Vastola, F.; Walker, P., Jr. Reduction of nickel oxide by carbon: II. Interaction between nickel oxide and natural graphite. Carbon 1997, 35, 529–533. [Google Scholar] [CrossRef]
  32. Richardson, J.T.; Scates, R.; Twigg, M.V. X-ray diffraction study of nickel oxide reduction by hydrogen. Appl. Catal. A Gen. 2003, 246, 137–150. [Google Scholar] [CrossRef]
  33. Richardson, J.; Lei, M.; Turk, B.; Forster, K.; Twigg, M.V. Reduction of model steam reforming catalysts: NiO/α-Al2O3. Appl. Catal. A Gen. 1994, 110, 217–237. [Google Scholar] [CrossRef]
  34. Ostrovski, O.; Zhang, G.Q. Reduction and carburization of metal oxides by methane-containing gas. Aiche J. 2006, 52, 300–310. [Google Scholar] [CrossRef]
  35. Syed-Hassan, S.S.A.; Li, C.-Z. NiO reduction with hydrogen and light hydrocarbons: Contrast between SiO2-supported and unsupported NiO nanoparticles. Appl. Catal. A Gen. 2011, 398, 187–194. [Google Scholar] [CrossRef]
  36. Quah, E.B.H.; Li, C.-Z. Roles of desorbed radicals and reaction products during the oxidation of methane using a nickel mesh catalyst. Appl. Catal. A Gen. 2004, 258, 63–71. [Google Scholar] [CrossRef]
  37. Lee, W.J.; Li, C.-Z. Coke formation and reaction pathways of catalyst-surface-generated radicals during the pyrolysis of ethane using Ni mesh catalyst. Appl. Catal. A Gen. 2007, 316, 90–99. [Google Scholar] [CrossRef]
  38. Syed-Hassan, S.S.A.; Lee, W.J.; Li, C.-Z. Positive and negative catalytic effects of a nickel mesh catalyst for the partial oxidation of ethane. Chem. Eng. J. 2009, 147, 307–315. [Google Scholar] [CrossRef]
  39. Huang, Z.; He, F.; Feng, Y.; Liu, R.; Zhao, K.; Zheng, A.; Chang, S.; Zhao, Z.; Li, H. Characteristics of biomass gasification using chemical looping with iron ore as an oxygen carrier. Int. J. Hydrogen Energy 2013, 38, 14568–14575. [Google Scholar] [CrossRef]
  40. El-Guindy, M.I.; Davenport, W.G. Kinetics and mechanism of llmenite reduction with graphite. Metall. Trans. 1970, 1, 1729–1734. [Google Scholar] [CrossRef]
  41. Sharma, S.; Vastola, F.; Walker, P., Jr. Reduction of nickel oxide by carbon: III. Kinetic studies of the interaction between nickel oxide and natural graphite. Carbon 1997, 35, 535–541. [Google Scholar] [CrossRef]
  42. Barbooti, M.M.; Alsammerrai, D.A. Thermal-Decomposition of Citric-Acid. Thermochim. Acta 1986, 98, 119–126. [Google Scholar] [CrossRef]
  43. Wyrzykowski, D.; Hebanowska, E.; Nowak-Wiczk, G.; Makowski, M.; Chmurzynski, L. Thermal behaviour of citric acid and isomeric aconitic acids. J. Therm. Anal. Calorim. 2011, 104, 731–735. [Google Scholar] [CrossRef]
  44. Cheng, F.; Dupont, V.; Twigg, M.V. Temperature-programmed reduction of nickel steam reforming catalyst with glucose. Appl. Catal. A Gen. 2016, 527, 1–8. [Google Scholar] [CrossRef]
  45. Yaman, S. Pyrolysis of biomass to produce fuels and chemical feedstocks. Energy Convers. Manag. 2004, 45, 651–671. [Google Scholar] [CrossRef]
  46. Xiao, X.; Chen, Z.; Chen, B. H/C atomic ratio as a smart linkage between pyrolytic temperatures, aromatic clusters and sorption properties of biochars derived from diverse precursory materials. Sci. Rep. 2016, 6, 22644. [Google Scholar] [CrossRef] [PubMed]
  47. Hossain, M.M.; de Lasa, H.I. Reactivity and stability of Co-Ni/Al2O3 oxygen carrier in multicycle CLC. AIChE J. 2007, 53, 1817–1829. [Google Scholar] [CrossRef]
  48. Hu, X.; Lu, G. Inhibition of methane formation in steam reforming reactions through modification of Ni catalyst and the reactants. Green Chem. 2009, 11, 724–732. [Google Scholar] [CrossRef]
Figure 1. TGA–FTIR results of NA–C under N2 at the heating rate of 5 °C/min: (a) DTG curve, (b) CO2 evolution profile, (c) H2O evolution profile, and (d) anhydride evolution profile.
Processes 10 01542 g001
Figure 2. XRD profiles of the NA–C–T samples (T = 280, 400, 480, 530, 740, and 900, ♦ characteristic peaks of NiO, ∇ characteristic peaks of metallic Ni, and unmarked peaks are attributed to Al2O3).
Processes 10 01542 g002
Figure 4. TPO results of (a) NA–C–400 and (b) fresh NiO/Al2O3 mixed with carbon black in an air flow at a heating rate 5 °C/min.
Processes 10 01542 g004
Figure 5. TGA–FTIR results of the N–C sample under N2 at the heating rate of 5 °C/min: (a) DTG curve, (b) CO2 evolution profile, and (c) H2O evolution profile.
Processes 10 01542 g005
Figure 6. SEM image of the NiO/Al2O3 used in this work.
Processes 10 01542 g006
Figure 7. Schematic diagram of possible routes for the reduction of the NiO/Al2O3 by the in situ generated biochar from citric acid pyrolysis (X is the ratio of the biochar and the NiO in contact with each other).
Processes 10 01542 g007
Publisher’s Note: MDPI stays neutral with regard to jurisdictional claims in published maps and institutional affiliations.

