Abstract
The rate-controlled production (RCP) inflow control devices (ICDs) are valves placed in the lower completion of oil and gas wells, capable of autonomously controlling the reservoir inflow. This completion technology self-regulates the inflow of undesired phases, such as water, by choking the flow after the breakthrough event, thus improving the recovery factor and reducing water production. In this context, this article presents a numerical study that describes the working principle of RCP valves based on a computational fluid dynamics (CFD) analysis. The numerical models are based on the conservation equations of fluid flow, the volume of fluid (VOF) multiphase flow model, and the dynamic fluid body interaction (DFBI) model to simulate the valve’s movement caused by its interaction with the flow. This study demonstrates the possibility of studying RCP valves alone or coupled with the whole completion assembly and reservoir rock. The difference in the valve efficiency after considering the entire completion assembly and reservoir rock is less compared with the stand-alone analysis of the valve. Finally, this study provides a deep understanding of the fluid dynamics near the wellbore, the completion assembly, and the RCP valves, along with its chocking, which could be helpful to future researchers interested in improving multiphase flow efficiency in subsurface processes.
Keywords:
ICD; RCP; completion technologies; CFD; heavy oil; fluid–solid interaction; porous media flow 1. Introduction
The oil industry faces high water production issues, especially in heavy oils and mature wells undergoing waterflooding. The problem related to water production is that high water cuts exponentially increase the lifting costs and energy consumption, reflecting their operations’ inefficiency. Several technologies have been developed to mitigate this issue. One of them is inflow control devices (ICD). These are valves designed to control the inflow to the wellbore, choking the flow of unwanted phases such as water, improving oil recovery, and balancing the pressure drop along the wellbore and the fluid influx, mitigating water conning [1,2].
These devices are recommended for horizontal wells affected by uneven inflows, which favors earlier breakthroughs caused by nonuniform inflow pressures [3]. They must be implemented in horizontal wells with a wellbore pressure drop relevant to the reservoir drawdown to enhance production. In addition, this can create the desired pressure drop between the well and the reservoir. These two conditions are accomplished if the ratio between the pressure drop along the well and the pressure drop between the well and the reservoir is above [2].
One of the most innovative designs is the autonomous inflow control device (AICD) that use specially designed nozzles to choke the flow of the undesired phases [2,4]. There are two main designs of AICDs. The first uses autonomous moving parts, such as the rate-controlled production (RCP) valves [5,6]. The second is a fluidic diode AICD [7], where the fluid enters high- or low-resistance paths, depending on its properties.
The relatively fast development of this technology can be attributed to computer-aided engineering. For example, advanced tools such as computational fluid dynamics (CFD) have helped improve this technology’s comprehension and improvement. One of the earliest studies was conducted by Crow et al. [8] and Garcia et al. [9]. They studied the hydrodynamics of the ICD assembly for different designs by comparing the pressure and velocity fields. A further use for the design of AICDs was presented by Zeng et al. [10] and Zhao et al. [11].
On the one hand, Zeng et al. proposed a new design of two parts, a splitter and a restrictor. Moreover, the design was tested for several flow rates and oils with promising results. On the other hand, Zhao et al. conducted a numerical study on using swelling rubbers to restrict the flow and improve the efficiency of the inflow devices. Finally, Corona et al. [12] conducted a CFD study to compare different ICD designs for reducing erosion–corrosion issues caused by wall shear stress.
Furthermore, the CFD technology has been extensively used to study the diode type AICD. One of the first studies was conducted by Fripp et al., who compared the differences in the hydrodynamic profile of oil and water caused by the contrasts in their physical properties [7]. Yang et al. [13] characterized the hydrodynamic profile on diode AICDs for different oils, comparing different densities and viscosities. Moreover, an erosion study was conducted to determine the most affected zones. Zhang et al. proposed an improved design to handle solid particles [14], validating the CFD model against experimental data. Additionally, the model was optimized after evaluating several parameters such as the number of inlets, the slope of the inner funnel chamber, and even the installation position. Chochua et al. [15] and Gurses et al. [16] proposed an optimized diode AICD design with CFD. The hydrodynamic profile was characterized for oil, gas, and water and even tested for different oils, and the performance curve was obtained by numerical means. Finally, Cui et al. [17] proposed a new diode AICD, named automatic inflow-regulating valve, based on a parametric CFD study to, for example, find the optimal number of inlets and sizes to reduce excessive water production.
Unfortunately, not many extensive numerical studies of RCP valves are available, especially explaining their working principle, lagging their development compared with other AICD technologies. In this context, this study presents, to our knowledge for the first time in a scientific publication format, the numerical study of AICDs of the RCP type, modeling the choking disk’s movement caused by the interaction with the multiphase flow. Moreover, this study shows a methodology for modeling the valve and its coupling with the completion assembly and a small section of the reservoir rock to fully consider the hydrodynamic effects upstream and downstream of the valve. The methodology proposed in this study aims to guide other researchers and scientists who want to exploit the multidesign capabilities of CFD codes to improve RCP valves’ design to achieve greater efficiencies.
2. Methodology
This study considered heavy oil and water and was divided into three parts. The first one focused on modeling the RCP alone. The second part was extrapolating to more realistic conditions, considering the full completion, adapting a similar design from Miersma [18], and the near-wellbore formation. Finally, the third part conducted a sensitivity analysis on the influence of the oil’s physical properties on the efficiency of the valves. The numerical model was implemented in the commercial CFD software Star-CCM+ v2021. Additionally, all the simulations were run on a computer with an eight-core Intel Xeon E5-2690 processor and 64 GB of RAM.
The numerical model was based on the conservation equations of fluid flow. Additionally, the Eulerian–Eulerian volume of fluid (VOF) physical model was considered to simulate the immiscible displacement of heavy oil and water in the RCP valves, completion, and reservoir rock. This model uses the high-resolution interface capturing scheme to resolve the interface tracking in the domain. The - model simulated the turbulent flow regime. Gravity was considered an external body force because of its influence on phase segregation phases and its possible effect on the disks’ movement in the RCPs in the vertical direction. Finally, the dynamic fluid body interaction model simulated the valve’s motion in response to the fluid dynamics.
2.1. Modeling the RCP Valve
2.1.1. Domain and Fluid Properties
There are different types of AICD. The RCP type has a levitating disk that opens or closes depending on the phase flowing through the valve [5,6]. The simplified design presented in Figure 1 was used in this study. This design consists of the valve body, which encloses the flow, and the disk, the only moving part.
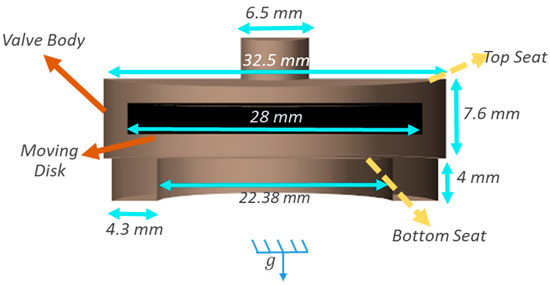
Figure 1.
General representation of the RCP valve considered for this study.
The disk remains open when oil flows through and closes with water. However, because of the working principle of this RCP valve, it never fully closes. Instead, the disk oscillates when water flows through, choking the flow. In this study, it was considered the biphasic flow of heavy oil and water. Table 1. presents the physical properties of each phase.

Table 1.
Physical properties of the fluids considered in this study.
2.1.2. Spatial Discretization and Boundary Conditions
One of the primary purposes was to predict the oscillation of the disk. Therefore, the mesh must be dynamic and change during the simulation. The morphing mesh method was used to update the mesh position with the disk movement. A static mesh deforms according to the disk’s motion. A general view of the mesh used for the RCP valve modeling is presented in Figure 2.
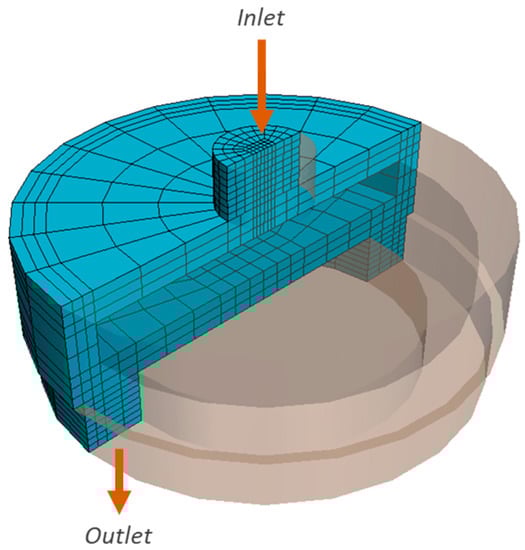
Figure 2.
General view of the mesh and boundary conditions implemented in the study of the RCP.
The dynamic fluid body interaction (DFBI) physical model simulates the fluid–structure interaction between the disk and the flow. The forces considered to act on the disk were the moments of inertia, fluid pressure, and weight. Two assumptions were made to reduce the computational cost: the motion was restricted to the vertical direction (the y-axis). The rotation and the motion in other directions were not allowed. Second, the disk was limited to moving above water cuts of 90%.
Figure 2 presents the boundary conditions, where the inlet had constant pressure of . The outlet remained at . These boundary conditions conditioned a pressure drop of , assuring an oil production of . As initial conditions, the valve was initially filled with oil while the disk rested at the open position. Finally, the production scheme, or cycle, consisted of s of producing oil followed by s of water inflow.
2.2. Modeling of the Complete the AICD Assembly
2.2.1. Domain and Boundary Conditions
One of the primary purposes of this study was to determine the level of detail with which it is possible to simulate the complete AICD assembly. Therefore, it considered the RCP valve, the completion assembly, and a small portion of the reservoir rock. The purpose of including the near-wellbore formation was to simulate the unstable displacement in the porous media. The complete domain is presented in Figure 3. In this case, the completion uses 2 RCP valves located at the top and the bottom. Additionally, the completion assembly is inspired by the design proposed by Miersma [18], with the following modifications, while Table 2. summarizes the rock and sand screen physical properties considered for the near-wellbore region:
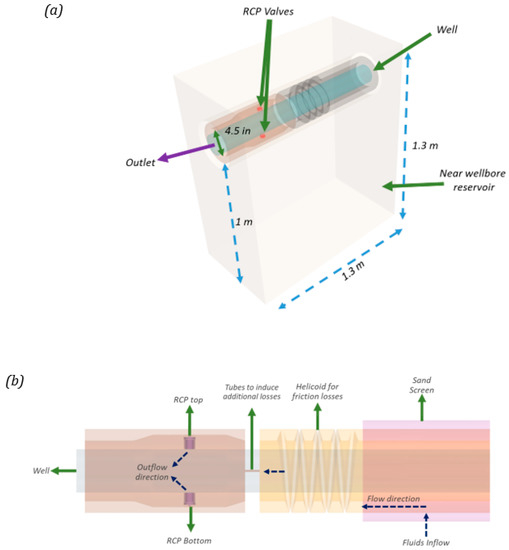
Figure 3.
General view of (a) the geometry and boundary conditions for the complete AICD assembly and (b) a detailed explanation of the main parts of the AICD assembly.
Table 2.
Porous media physical properties and initial conditions.
- A sand screen was included, simulated as a porous media with the concentric flow;
- A helicoidal channel was included for additional friction losses, similar to the design proposed by Qudaihy et al. [19];
- The ring-shaped exit of the RCP valves was extended to the inner diameter of the liner.
2.2.2. Spatial Discretization in the Porous Media and Completion
An adaptive unstructured polyhedral mesh was considered for the reservoir rock and the completion. Adaptive mesh refinements were implemented at the heavy oil–water flow interface, especially at the reservoir rock, to capture the unstable displacement and fingering patterns properly. A general view of the mesh is presented in Figure 4. Finally, Table 3 summarizes the number of elements considered in the spatial discretization of the numerical models.
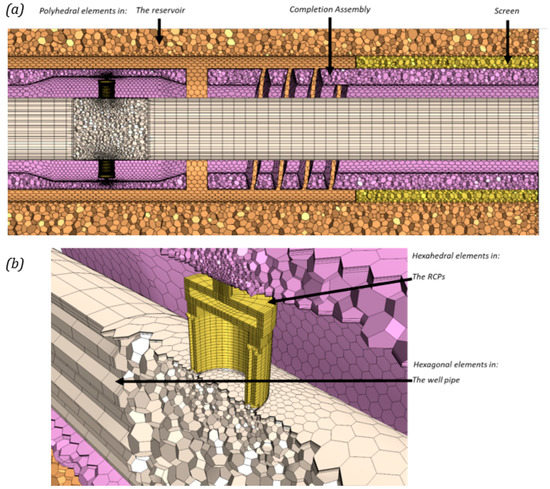
Figure 4.
General view of the mesh used on the complete AICD assembly modeling: (a) General view and (b) the detailed view at the top RCP valve.
Table 3.
The number of elements implemented in the spatial discretization of the different RCP completion models.
2.3. Sensitivity Analysis of the Oil’s Physical Properties
Finally, a sensitivity analysis was conducted on the influence of the oil properties on the RCPs. It considered three different densities and viscosities, presented in Table 4. Finally, it must be mentioned that for the viscosity sensibility analysis, the density of the oil was the same used in the base case, i.e., . On the other hand, for the density sensibility analysis, the oil viscosity used was the same as the base case too, i.e., .
Table 4.
Oil physical properties considered in the sensitivity analysis.
Finally, the efficiency of the RCP valve was calculated for each case. The accumulated water production was calculated during the choking of the valve and divided by the accumulated amount of water that would have been produced in the fully open position. In other words, the efficiency of the valve was calculated according to Equation (1), where . is the accumulated amount of water produced during the choking of the valve’s disk, while . refers to the accumulated amount of water produced if the disk remained in the fully open position.
2.4. Frequency Spectrum Experimental Data
To validate the numerical model, the experimental work of Askvik & Leander [20] was used to compare the data related to the oscillation of the RCP disk during the choking of the valve. These researchers conducted an experimental study of a commercial RCP valve designed by Halvorsen et al. [5,6]—a different valve from the one considered in the present study.
In the work of Askvik & Leander [20], the experiments consisted in imposing a flow (oil and water or gas) through the RCP valve and measuring the oscillations of the disk with a pressure transducer to characterize the frequency spectrum. The experimental loop had a constant pressure inflow of . The fluids were stored in tanks connected by hoses, while the flow and fluids were regulated by a series of valves. The experimental facility had sensors to monitor the pressure (manometers and transducers) and a flowmeter.
Finally, the frequency spectrum was characterized with a LabVIEW application. The vibrations of the RCP disk were measured from the pressure transducer, and those pressure pulses were analyzed with a fast Fourier transform algorithm to obtain the frequency spectrum of the valve.
3. Results
3.1. RCP Valve
3.1.1. Hydrodynamic Profile
One of the most important results of this study is the characterization of the RCP dynamic behavior, specifically the disk movement. Figure 5 presents the hydrodynamic profile results (pressure contour and streamlines depicting velocity magnitude) in a cross section of the valve at different disk positions. For example, the disk remains at the bottom when oil flows through the valve. In contrast, two bottom positions were identified with water: “bottom before ascends” when the disk reaches the bottom seat position and “bottom at ascending” when the disk moves upwards.
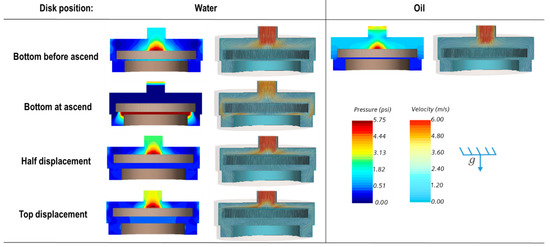
Figure 5.
Hydrodynamic profile of the RCP valve described with velocity and pressure contours.
At “the bottom before ascend,” the velocity profiles for oil and water differ significantly. Water exhibits velocity magnitudes approximately four times higher than oil at the top of the disk because of the inlet stream (red color contours). Additionally, two vortices are formed at the top edges of the disk. In contrast, the streamlines of oil indicate a more uniform flow pattern. These differences are attributed to the fluids’ viscosity contrasts. Water’s lower viscosity allows higher velocities and vorticities, presumably because of the flow separation from surfaces. Finally, the pressure field at this position shows higher values than oil. This behavior is attributed to a lower velocity field, a consequence of the Bernoulli effect.
During “bottom at ascend,” the velocities remained high at the disk’s top face while the vorticities at the edge of the disk were minimized. Thus, the streamlines indicate a more uniform flow path on the top of the disk. Because of the uniformization of the flow, the pressure on the disk’s top decreases to the lowest level while the pressure under the disk reaches its highest. This inversion causes an upward-acting force on the disk moving upwards toward the closing position—behavior in agreement with previous analytical descriptions [5,6].
In the “half displacement” position, the disk is in the middle of its ascend. The flow patterns are characterized by presenting strong vorticities at the edges of the disk. The pressure at the top of the disk increases again, deaccelerating. In fact, because of this behavior, the disk always stopped before reaching the upper no-go shoulder, i.e., at the “top displacement” position shown in Figure 5.
Finally, strong vorticities appear below the disk at the “top displacement” position, causing additional losses and decreasing the pressure below the disk. Consequently, the resulting force pushed down the disk again. For example, in this position, the inlet pressure increased 1.2 times more than the “half displacement” position, pushing the disk downwards. Finally, this behavior is continuously repeated, showing an oscillatory behavior suggested by other analytical and experimental studies [5,6,20].
3.1.2. Production and Oscillation Profiles
The production profiles for the RCP valve are presented in Figure 6. for two continuous production cycles. The pressure drop set as a boundary condition was set to ensure an initial oil production of , as shown in the green curve presented in Figure 6. Initially, the disk remained in the open position as only oil was produced. Once the water inflow occurred (blue curves), the maximum rates reached . and strongly oscillated through time. A higher water flow rate for the same pressure drop than oil was expected. This difference is attributed to the viscosity contrast, where oil is . times more viscous than water. The total water production was computed for two timespans (5 to 10 s and 15 to 20 s) and compared with the amount of water that would have been produced if the disk remained fully open, with a constant flow rate of . In conclusion, the RCP reduced water production by about on average.
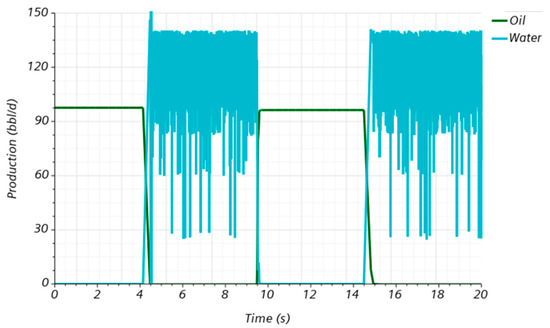
Figure 6.
Production profile for the RCP analysis.
As observed in Figure 6, the disk’s oscillation is not uniform. Instead, several lower peaks were predicted. To explore this further, a fast Fourier transform was applied to the disk position’s time series during water inflow. The results of the frequency spectrum and the disk displacement versus time are presented in Figure 7. The and values correspond to the bottom-seat and top-seat positions, respectively.
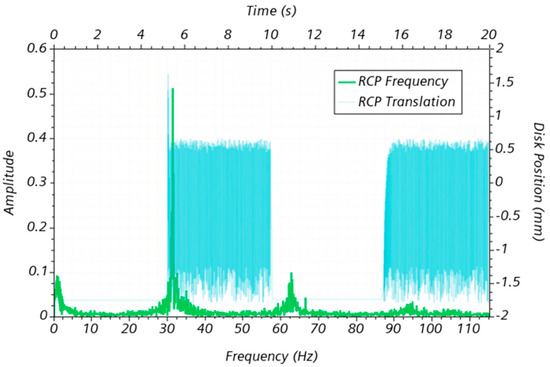
Figure 7.
Results of the oscillation and frequency profile obtained for the RCP valve analysis.
The frequency spectrum exhibits similar characteristics to those previously reported in Askvik & Leander’s experiments [20]. The dominant frequency is between , which is somewhat similar to the value reported by Askvik & Leander [20]. There are other oscillation peaks at higher frequencies, i.e., between and around to a lesser extent. Additionally, there is some “noise” in the frequency spectrum.
3.2. AICD Assembly and Reservoir Rock
3.2.1. Multiphase Flow in Porous Media and Hydrodynamic Profile
Understanding the AICD completion assembly’s interactions with the reservoir rock is essential, particularly the unstable displacement of heavy oil and water that occurs in a breakthrough event.
Figure 8 presents snapshots of the results, including the completion assembly (upstream and downstream of the RCP valve) and a small section of the near-wellbore formation. The snapshots depict in transparent colors the main surfaces of the domain (initially filled with oil) and in solid colors (blue and red) the location and evolution of the waterfront. The inflow begins through the screen, located at the top right (light pink color), passes through the helical channel, and hits the two RCP valves before entering the liner.
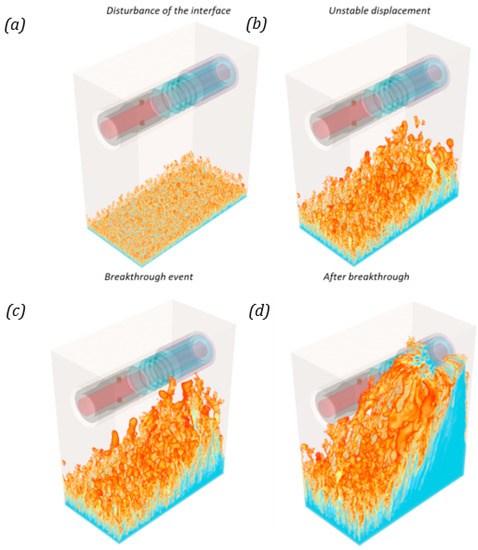
Figure 8.
Rendering of viscous fingering during the breakthrough in the completion assembly, (a) Initial displacement or disturbance of the interface, (b) Viscous Fingering and unstable displacement, (c) The breakthrough event, and (d) Water production after the breakthrough.
The displacement is unstable, characterized by presenting a viscous fingering pattern. The high viscous forces cause this phenomenon because of the high viscosity ratio between oil and water. First, tiny “fingers” appear at the bottom boundary, as shown in Figure 8a. Later, Figure 8b,c show that the fingers located below the screen, where the highest pressure gradient is, are thicker and longer. Finally, Figure 8d shows how fingers still advance towards the screen after the breakthrough, which is the only location to enter the completion assembly.
Simulation results show that when the produced water cut reaches , reservoir flow enters the completion using less than of the screen’s surface area. In addition, at this point, significant amounts of oil are left behind (46.78% of the original oil in place), significantly below the AICD assembly. This behavior results from viscous fingering, which channels the water affecting the oil sweep significantly below the AICD.
3.2.2. Production and Oscillation Profiles
The production profiles are presented in Figure 9. Constant oil production of is set initially. After a short time (approx. ), water is produced and increases sharply. The production of oil and water per RCP is not equal, indicating that the valves’ spatial location affects their initial production. For example, in this case, the RCP at the bottom produces more water.
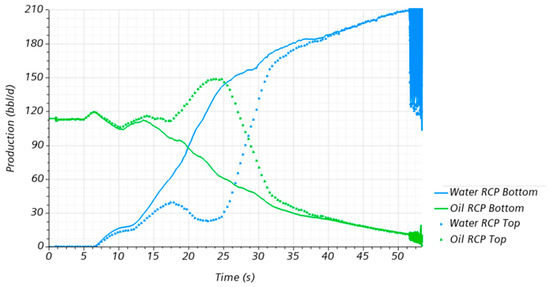
Figure 9.
Production profiles obtained for the two RCP valves implemented in the AICD assembly.
On the contrary, the RCP at the top had a higher oil production for a longer time span. However, after a while (approx. ), oil and water flow rates per RCP converged to the same rate. When the water reached per valve (and oil decreased to , at an approximate water cut of ), the disks started oscillating.
The total water production was computed during the oscillation of the disks, for each valve, until the end of the simulation. These values were compared with the total water production with the disks at the open position, with a constant flow rate of . Reductions in water production of and for the bottom and top RCP, respectively, were calculated. A reduction in the effectiveness of around was noticed compared with the results obtained for the valves alone. These results were found to have a comparable trend to other numerical experiments reported in the literature. For example, a reduction of 15% (Gurses et al., 2019) or 90% (Eltaher et al., 2014) has been reported for gas production. Alternatively, with water, there have been reported reductions of [21] or [13].
Nevertheless, it must be pointed out that these numerical experiments were conducted under somewhat different conditions than those presented in this study. Figure 10 shows the hydrodynamic profile (pressure contour and streamline depicting velocity magnitude) of the AICD assembly. These results were taken at the end of the simulation time.
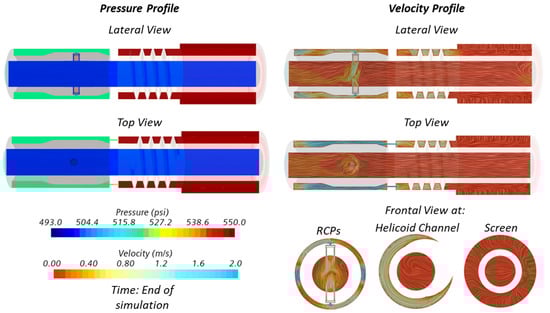
Figure 10.
Hydrodynamic profile obtained for the complete AICD assembly at the end of the simulation time.
The highest pressure drop occurs in the two capillary tubes (as described in Figure 3b), creating a high-pressure region in the helicoidal channel. A medium pressure region is located upstream of the two RCPs, where the average pressure is times less than in the helicoidal channel. Finally, the inside of the liner is the region with the lowest pressure.
The following features can be highlighted from the velocity profiles presented in Figure 10. First, the screen induces a radial flow, which is later redirected towards the axial direction. Then, the flow accelerates in the helicoidal channel because of the reduction in the cross section area. Later, the flow accelerates in the capillary tubes. Finally, after the flow passes through the valves, it falls into the liner’s inside, forming a characteristic plume-type flow pattern.
The computation and study of the hydrodynamic profiles are presented in Figure 10. They could help engineers optimize the design of AICDs completions by reducing energy losses (e.g., identifying zones with high vorticity that are due to flow separation) and flagging erosion-prone regions, among others. For example, the studied design has high vorticity in the annular region between the helicoidal channel and the capillary tubes. Moreover, the flow plumes could cause considerable energy losses in the RCP valves and their outlet. In this case, design improvements could be made to orient the RCP’s exit towards the liner’s axial direction reducing the vorticity and turbulence and preventing the emulsification of oil droplets.
Figure 11 shows the frequency spectra and the profile of disk position in time for both RCPs. They exhibit similar behavior to the previously presented in the RCP alone analysis. However, the previous analysis presented three distinctive peaks. The analysis considering the whole completion showed up to five different peaks. The dominant frequency was higher (approx. ). This could be attributed to a higher water flow rate, instead of . Finally, both RCPs showed a similar behavior despite their spatial location on the completion.
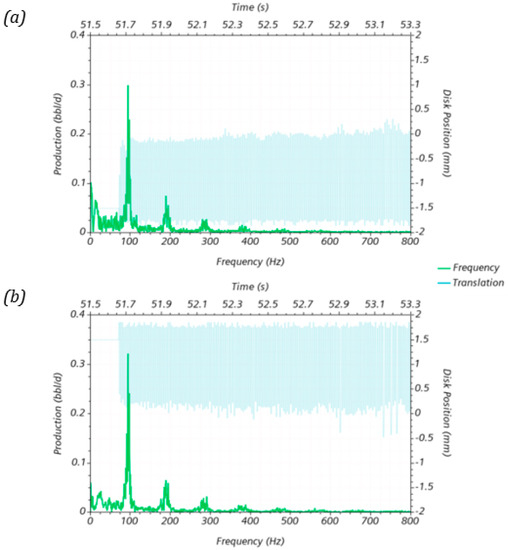
Figure 11.
Results of the oscillation and frequency profiles for the two RCP valves. Case considering only the vertical movement of the levitating disk (a) bottom valve and (b) top valve.
For the top valve, Figure 11 shows that the disk did not close as much as it did in the stand-alone simulation (on average, less). This could be attributed to a higher water flow rate, which could explain the reduced valve RCP efficiency discussed earlier.
3.3. Sensitivity Analysis
3.3.1. Production Profiles
A sensitivity analysis was conducted on the influence of the oil’s physical properties (density and viscosity) on the completion assembly, especially on the RCPs’ functioning. As a result, the production profiles are presented in Figure 12. The initial oil production shifts downwards with increasing viscosities. Here, less viscous oils have less viscous losses, thus achieving higher flows for the same pressure gradient.
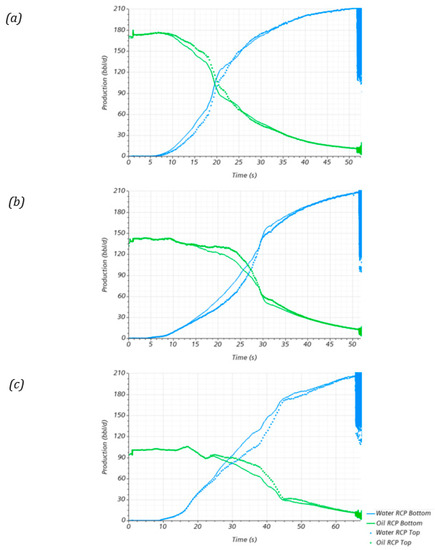
Figure 12.
Production profiles obtained for the two RCP valves for the oil viscosity sensitivity analysis: (a), (b) , and (c) .
Minor differences in the reduction in water production were due to the influence of oil viscosity. The average reduction in water production is presented in Table 5 for different oil viscosities and densities for the top and bottom valves. According to these results, the valve’s efficiency remains invariant. Only a slight difference was noticed for the top valve for the oil viscosity case, which had a reduction of in performance compared with the other two viscosities. Additionally, there was no significant difference between the valves’ locations. In this case, the top valve had a marginally better performance, a difference from the bottom valve.
Table 5.
Oil physical properties considered in the sensitivity analysis.
On the other hand, the density of the oil had a more significant influence. Figure 13 shows the production profiles obtained for the oil density sensitivity analysis. Contrary to the results presented in Figure 12, the production profiles between oil and water are different per valve between . The valve at the top achieves higher oil production than the valve at the bottom. Moreover, at increasing oil densities, oil production in the top valve tends to decrease. For example, while the oil production peak for the case was about , the peak production for the case was . Therefore, an increase in the oil density of caused a decrease in the peak oil production in the top valve of .
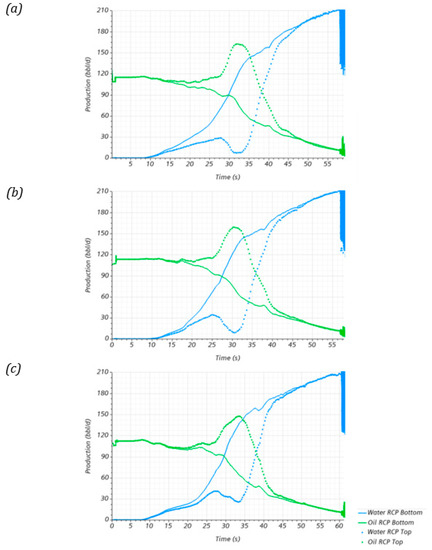
Figure 13.
Production profiles obtained for the two RCP valves for the oil density sensitivity analysis: (a), (b), and (c).
The valve’s location affected its efficiency. For example, the bottom valve worked better than the top valve, with an average difference of and a maximum of . Additionally, after comparing the valve at the bottom for the and cases, it was found that an increase of in the oil density reduced water production by . However, it is worth mentioning that further study is needed in this regard as the numerical model was constrained to simulate the disk’s oscillation at water cuts above . Possibly, the mixture density at water cuts below this threshold could affect the functioning of the RCP valves.
3.3.2. Oscillation Profiles
An analysis of the oscillation profiles and the frequency spectrum was conducted. The results for both RCPs oscillation profiles on the viscosity sensitivity analysis are presented in Figure 14. The dominant frequencies seem to increase at increasing oil viscosities. For example, while the dominant frequency for the bottom valve in the case was , for the case, it was . However, other features such as the translation profiles and the other dominant frequencies remained invariant. These findings support the values previously presented in Table 4, where a significant difference in the valves’ efficiency caused by the oil viscosity was not noticed.
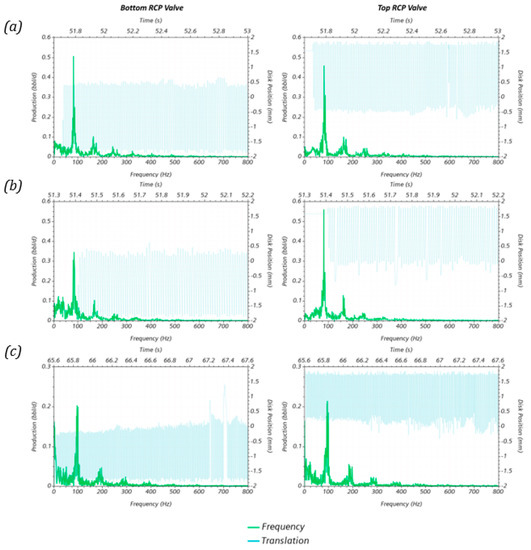
Figure 14.
Results of the oscillation and frequency profile for the two RCP valves for the oil viscosity sensitivity analysis, (a), (b) , and (c) .
The density sensitivity analysis presented in Figure 15 showed similar behavior for the frequency spectrum. The dominant frequency tends to shift to the right at increasing oil densities. In this case, while the dominant frequency for the bottom valve in the case was for the case, it was .
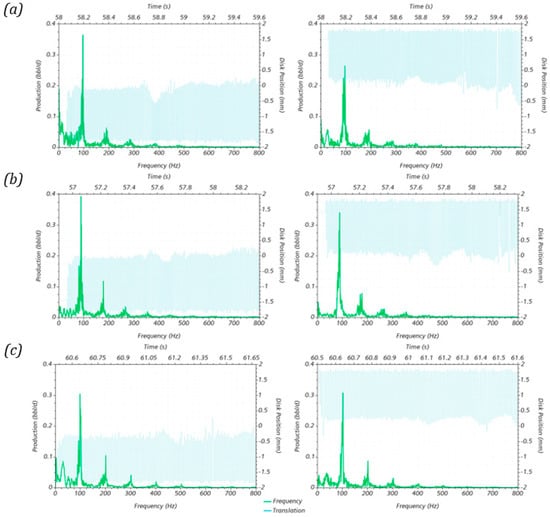
Figure 15.
Results of the oscillation and frequency profile for the two RCP valves for the oil density sensitivity analysis: (a), (b) , and (c) .
To conclude, some limitations are pointed out, and some suggestions for further studies are provided. To reduce the computational cost, the disk movement was constrained to water cuts above , as mentioned before. Therefore, some critical dynamic results and unique features of RCP valves’ functioning may have been overlooked. For example, determining the water cut thresholds when the disk starts its movement and how long it takes to achieve a steady-state oscillation if it does. As shown in Figure 14c, the disk stroke’s amplitude might change with time and be affected by the water cut. Understanding this behavior may help to improve RCP designs.
4. Conclusions
- A methodology to conduct CFD numerical studies of RCP valves has been proposed. A 3D VOF-FSI formulation can describe the hydrodynamics and chocking of the valve in great detail. The pressure inversion phenomenon that explains the choking of the valve was fully characterized;
- These valves could be analyzed up to the reservoir scale, even considering the viscous fingering. Simplifying the study of RCP valves separated from the completion assembly and the near-wellbore formation could affect the prediction of the efficiency of the valves. In this study, the whole system predicted a lower valve efficiency than the valve alone, about less;
- The density of the fluids was the parameter that most affected the efficiency of the valves. The valves were more efficient at higher oil/mixture densities. In the studied conditions, the RCP valves were times more efficient for oils times denser than the lightest oil considered, ;
- The numerical model was validated against experimental data found in the literature. The frequency spectrum of the choking valve was characterized, showing fair agreement in terms of the peak frequency and oscillation peaks.
Author Contributions
Conceptualization: M.A. and M.S.; Methodology: N.R. and A.P.; Formal Analysis: A.P. and M.S.; Resources: N.R. and M.A.; Writing—review and editing: A.P. and M.S. All authors have read and agreed to the published version of the manuscript.
Funding
This research received no external funding.
Institutional Review Board Statement
Not applicable.
Informed Consent Statement
Not applicable.
Data Availability Statement
Data will be available upon request to the authors.
Acknowledgments
The authors gratefully acknowledge the Information and Technology Department of the University of Los Andes (DSIT) for supplying the hardware to conduct this research.
Conflicts of Interest
The authors declare no conflict of interest.
References
- Al-Khelaiwi, F.T.; Davies, D.R. Inflow Control Devices: Application and Value Quantification of a Developing Technology. In Proceedings of the International Oil Conference and Exhibition in Mexico, Veracruz, Mexico, 27–30 June 2007. [Google Scholar] [CrossRef]
- Fernandes, P.; Li, Z.; Zhu, D. Understanding the Roles of Inflow-Control Devices in Optimizing Horizontal-Well Performance. In Proceedings of the SPE Annual Technical Conference and Exhibition, New Orleans, LA, USA, 4–7 October 2009. [Google Scholar] [CrossRef]
- Archibong, C.; Erhiaganoma, E.; Ikehi, E. Optimization Study on Inflow Control Devices for Horizontal Wells in Thin Oil Column Reservoirs: A Case Study of a Well in Niger Delta. In Proceedings of the SPE Nigeria Annual International Conference and Exhibition, Lagos, Nigeria, 31 July–2 August 2017. [Google Scholar] [CrossRef]
- Eltaher, E.K.; Muradov, K.; Davies, D.R.; Grebenkin, I.M. Autonomous Inflow Control Valves-their Modelling and “Added Value”. In Proceedings of the SPE Annual Technical Conference and Exhibition, Amsterdam, The Netherlands, 27–29 October 2014. [Google Scholar] [CrossRef]
- Halvorsen, M.; Elseth, G.; Naevdal, O.M. Increased oil production at Troll by autonomous inflow control with RCP valves. In Proceedings of the SPE Annual Technical Conference and Exhibition, San Antonio, TX, USA, 8–10 October 2012. [Google Scholar] [CrossRef]
- Halvorsen, M.; Madsen, M.; Mo, M.V.; Mohd, I.I.; Green, A. Enhanced Oil Recovery On Troll Field By Implementing Autonomous Inflow Control Device. In Proceedings of the SPE Bergen One Day Seminar, Bergen, Norway, 20 April 2016. [Google Scholar] [CrossRef]
- Fripp, M.; Zhao, L.; Least, B. The Theory of a Fluidic Diode Autonomous Inflow Control Device. In Proceedings of the SPE Middle East Intelligent Energy Conference and Exhibition, Manama, Bahrain, 28–30 October 2013. [Google Scholar] [CrossRef]
- Crow, S.L.; Coronado, M.P.; Mody, R.K. Means for Passive Inflow Control Upon Gas Breakthrough. In Proceedings of the SPE Annual Technical Conference and Exhibition, San Antonio, TX, USA, 24–27 September 2006. [Google Scholar] [CrossRef]
- Garcia, L.; Coronado, M.P.; Russell, R.D.; Garcia, G.A.; Peterson, E.R. The First Passive Inflow Control Device That Maximizes Productivity During Every Phase of a Well’s Life. In Proceedings of the International Petroleum Technology Conference, Doha, Qatar, 7–9 December 2009. [Google Scholar] [CrossRef]
- Zeng, Q.; Wang, Z.; Wang, X.; Wei, J.; Zhang, Q.; Yang, G. A novel autonomous inflow control device design and its performance prediction. J. Pet. Sci. Eng. 2015, 126, 35–47. [Google Scholar] [CrossRef]
- Zhao, L.; Zeng, Q.; Wang, Z. Design and Performance of a Novel Autonomous Inflow Control Device. Energy Fuels 2018, 32, 125–131. [Google Scholar] [CrossRef]
- Corona, G.; Yin, W.; Felten, F. Enhanced Nozzle Inflow Control Device Development for Wall Shear Stress Minimization in High-Production Application. In Proceedings of the Offshore Technology Conference, Houston, TX, USA, 2–5 May 2016. [Google Scholar] [CrossRef]
- Yang, M.; Li, H.; Xie, J.; Wang, Y.; Jiang, R.; Zhu, S.; Li, Y. The theory of the automatic phase selection controller and its performance analysis. J. Pet. Sci. Eng. 2016, 144, 28–38. [Google Scholar] [CrossRef]
- Zhang, N.; Li, H.; Liu, Y.; Shan, J.; Tan, Y.; Li, Y. A new autonomous inflow control device designed for a loose sand oil reservoir with bottom water. J. Pet. Sci. Eng. 2019, 178, 344–355. [Google Scholar] [CrossRef]
- Chochua, G.; Rudic, A.; Kumar, A.; Mainy, A.; Woiceshyn, G. Cyclone Type Autonomous Inflow Control Device for Water and Gas Control: Simulation-Driven Design. In Proceedings of the Abu Dhabi International Petroleum Exhibition & Conference, Abu Dhabi, United Arab Emirates, 12–15 November 2018. [Google Scholar] [CrossRef]
- Gurses, S.; Chochua, G.; Rudic, A.; Kumar, A. Dynamic Modeling and Design Optimization of Cyclonic Autonomous Inflow Control Devices. In Proceedings of the SPE Reservoir Simulation Conference, Galveston, TX, USA, 10–11 April 2019. [Google Scholar] [CrossRef]
- Cui, X.; Li, Y.; Li, H.; Luo, H.; Zhang, J.; Liu, Q. A Novel Automatic Inflow-Regulating Valve for Water Control in Horizontal Wells. ACS Omega 2020, 5, 28056–28072. [Google Scholar] [CrossRef]
- Miersma, M. Analysis of Inflow Control Devices for Steam Assisted Gravity Drainage Using Computational Fluid Dynamics. Master’s Thesis, University of Alberta, Edmonton, AB, Canada, 2018. [Google Scholar] [CrossRef]
- Qudaihy, D.S.; Nughaimish, F.N.; Sunbul, A.H.; Ansari, A.A.; Hembling, D.E.; Faraj, O.A.; Voll, B.A. New-Technology Application to Extend The Life of Horizontal Wells By Creating Uniform-Flow-Profiles: Production Completion System: Case Study. In Proceedings of the SPE/IADC Middle East Drilling Technology Conference and Exhibition, Abu Dhabi, United Arab Emirates, 20–22 October 2003. [Google Scholar] [CrossRef]
- Askvik, S.M.; Johannessen, I.L. Dynamic Autonomous Inflow Control Device: Performance Prediction and Experimental Investigation of a Specific Rate Controlled Production Valve Design. Master’s Thesis, Norwegian University of Science and Technology, Trondheim, Norway, 2017. [Google Scholar]
- Timsina, R.; Furuvik, N.C.I.; Moldestad, B.M.E. Modeling and simulation of light oil production using inflow control devices. Linköping Electron. Conf. Proc. 2017, 180–187. [Google Scholar] [CrossRef] [Green Version]
Publisher’s Note: MDPI stays neutral with regard to jurisdictional claims in published maps and institutional affiliations. |
© 2022 by the authors. Licensee MDPI, Basel, Switzerland. This article is an open access article distributed under the terms and conditions of the Creative Commons Attribution (CC BY) license (https://creativecommons.org/licenses/by/4.0/).