
Developing an Anomaly Detection System for Automatic Defective Products’ Inspection


Abstract
:1. Introduction
2. Related Work
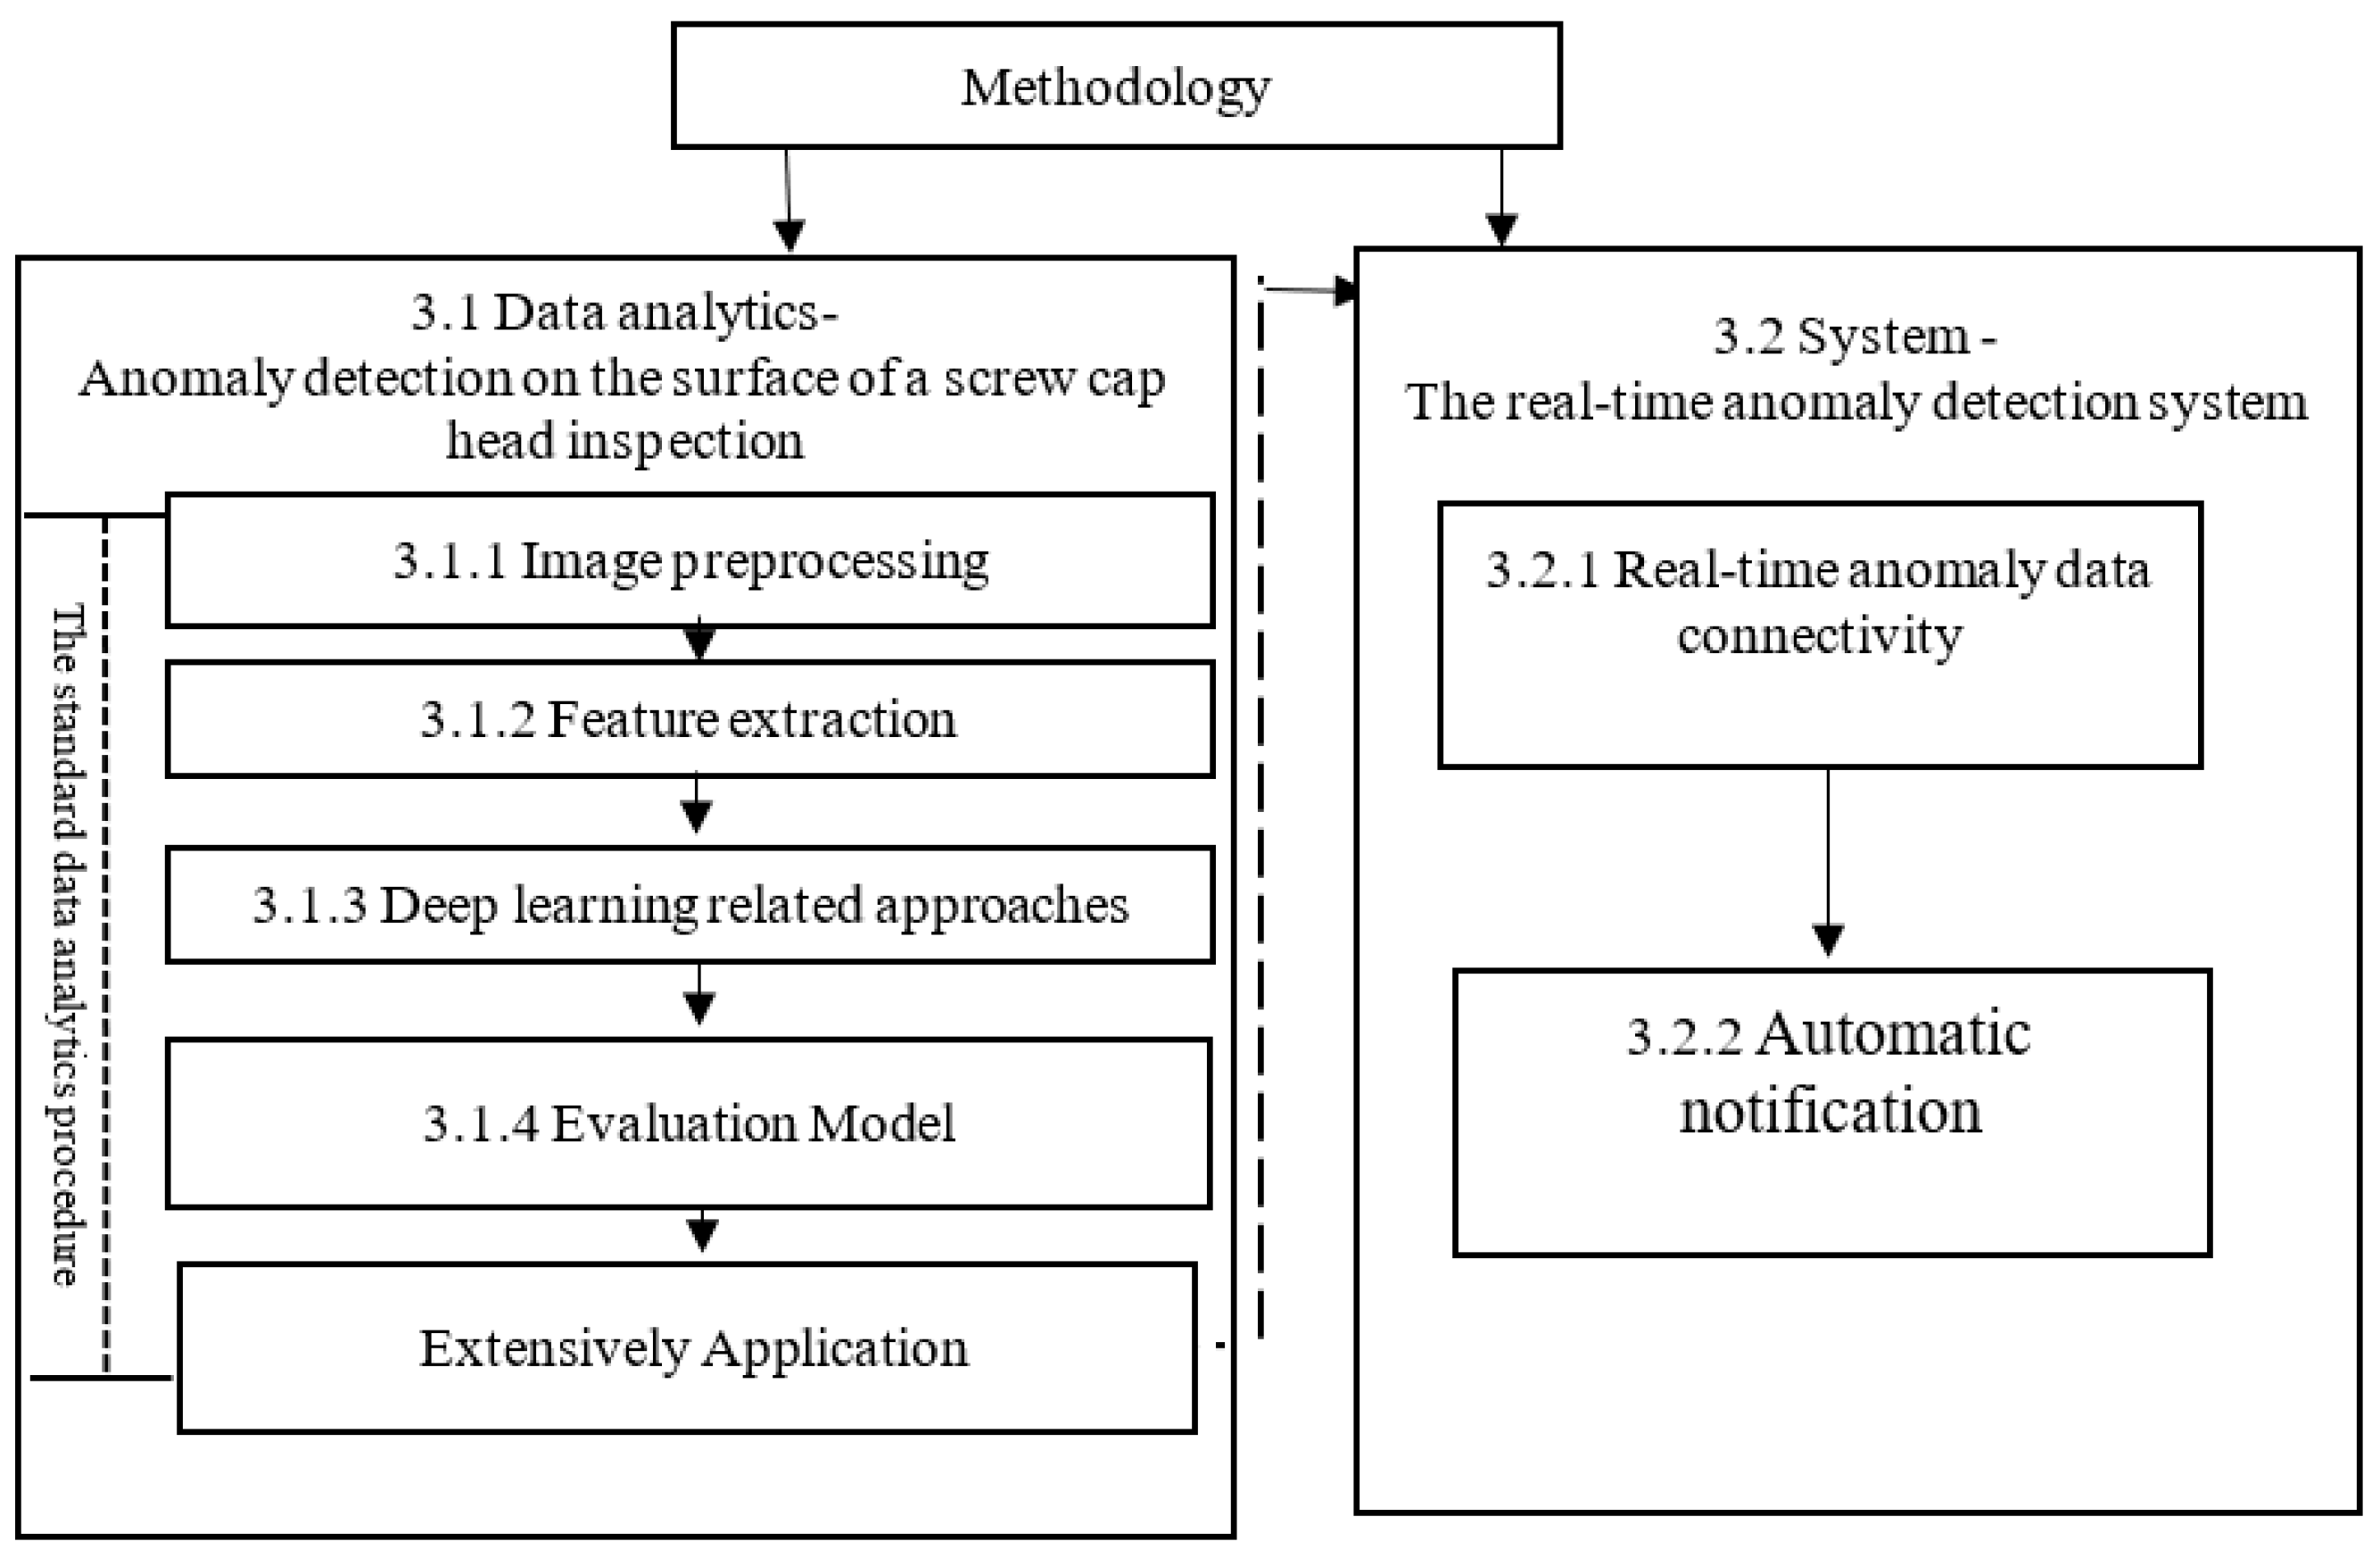
3. Methodology
3.1. Data Analytics for Anomaly Detection
3.1.1. Image Preprocessing
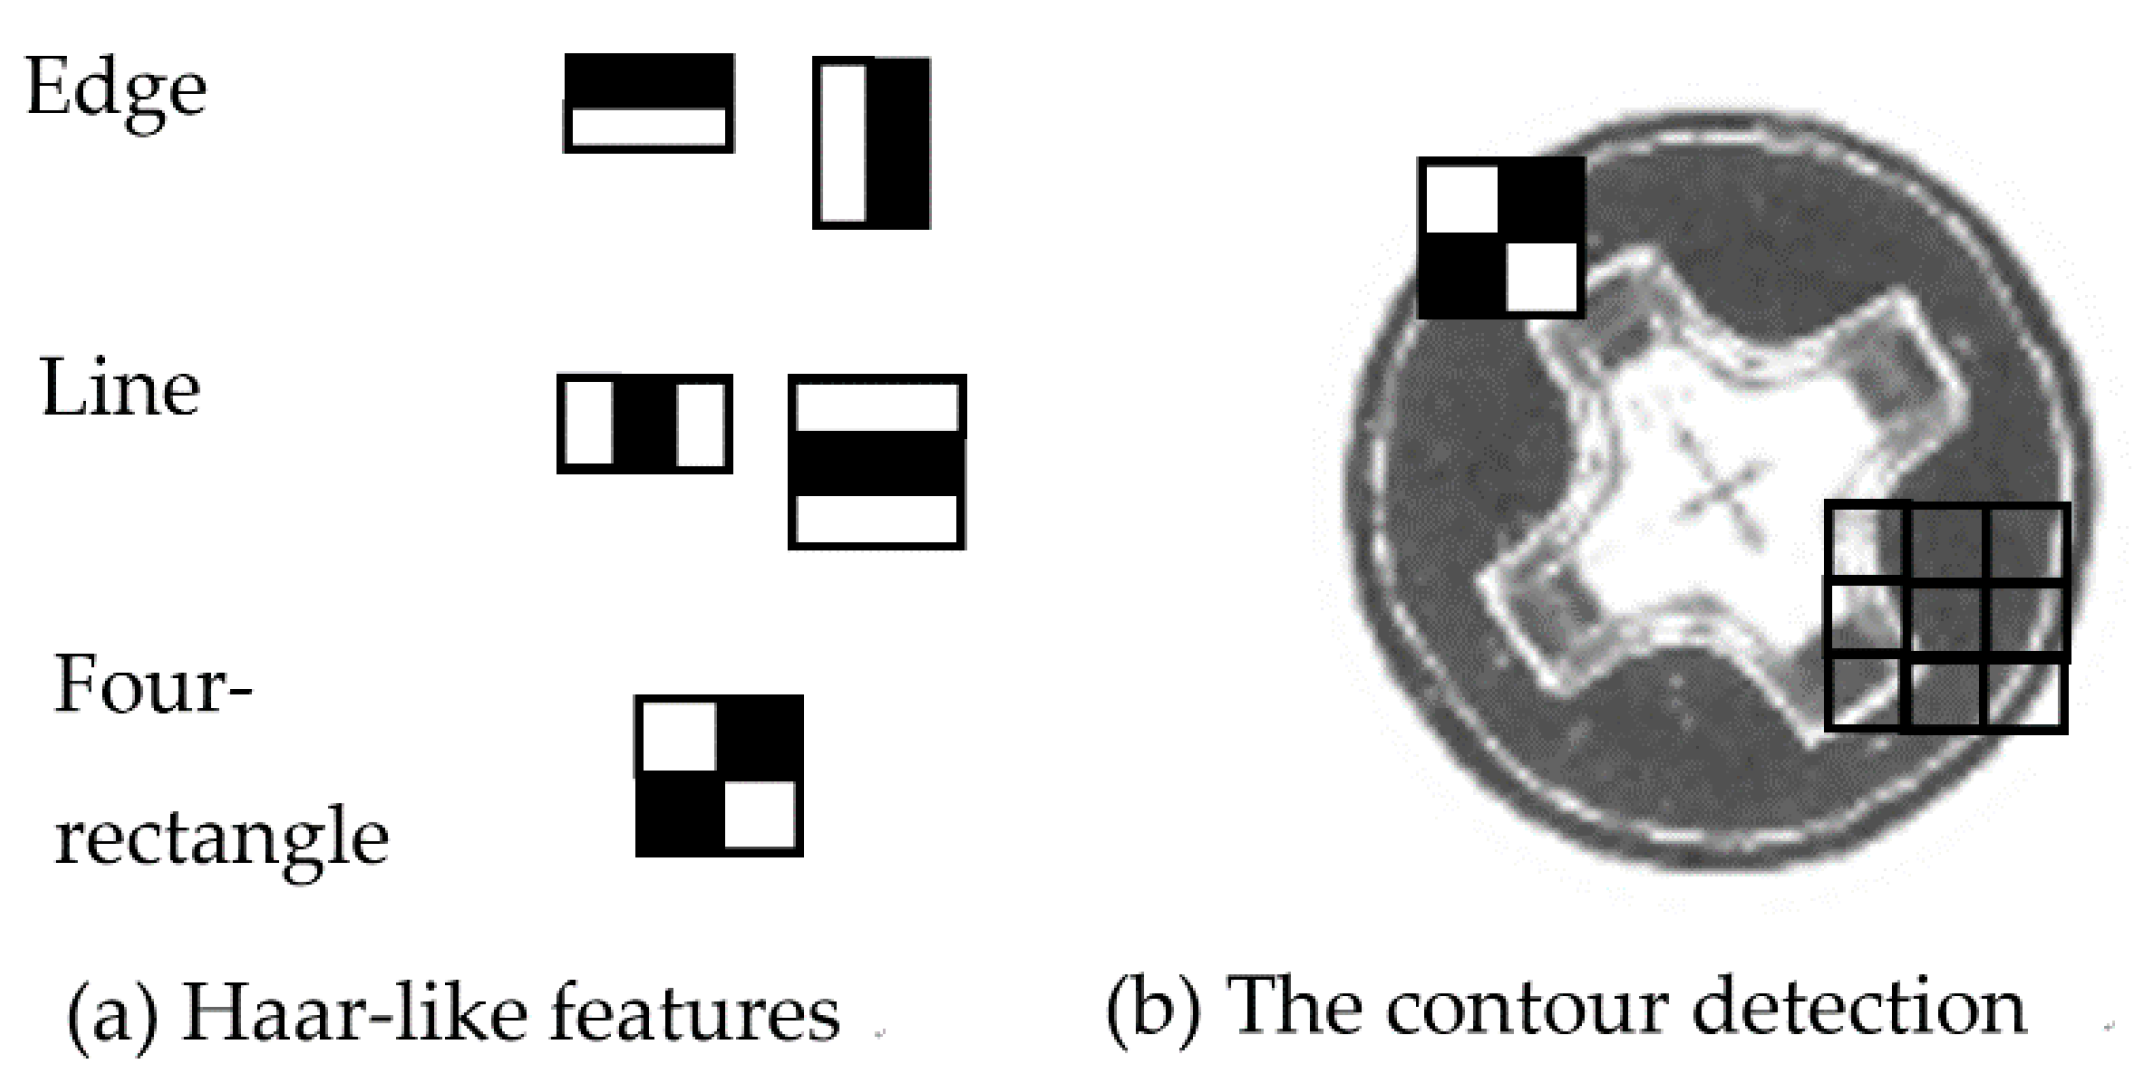
3.1.2. Feature Extraction
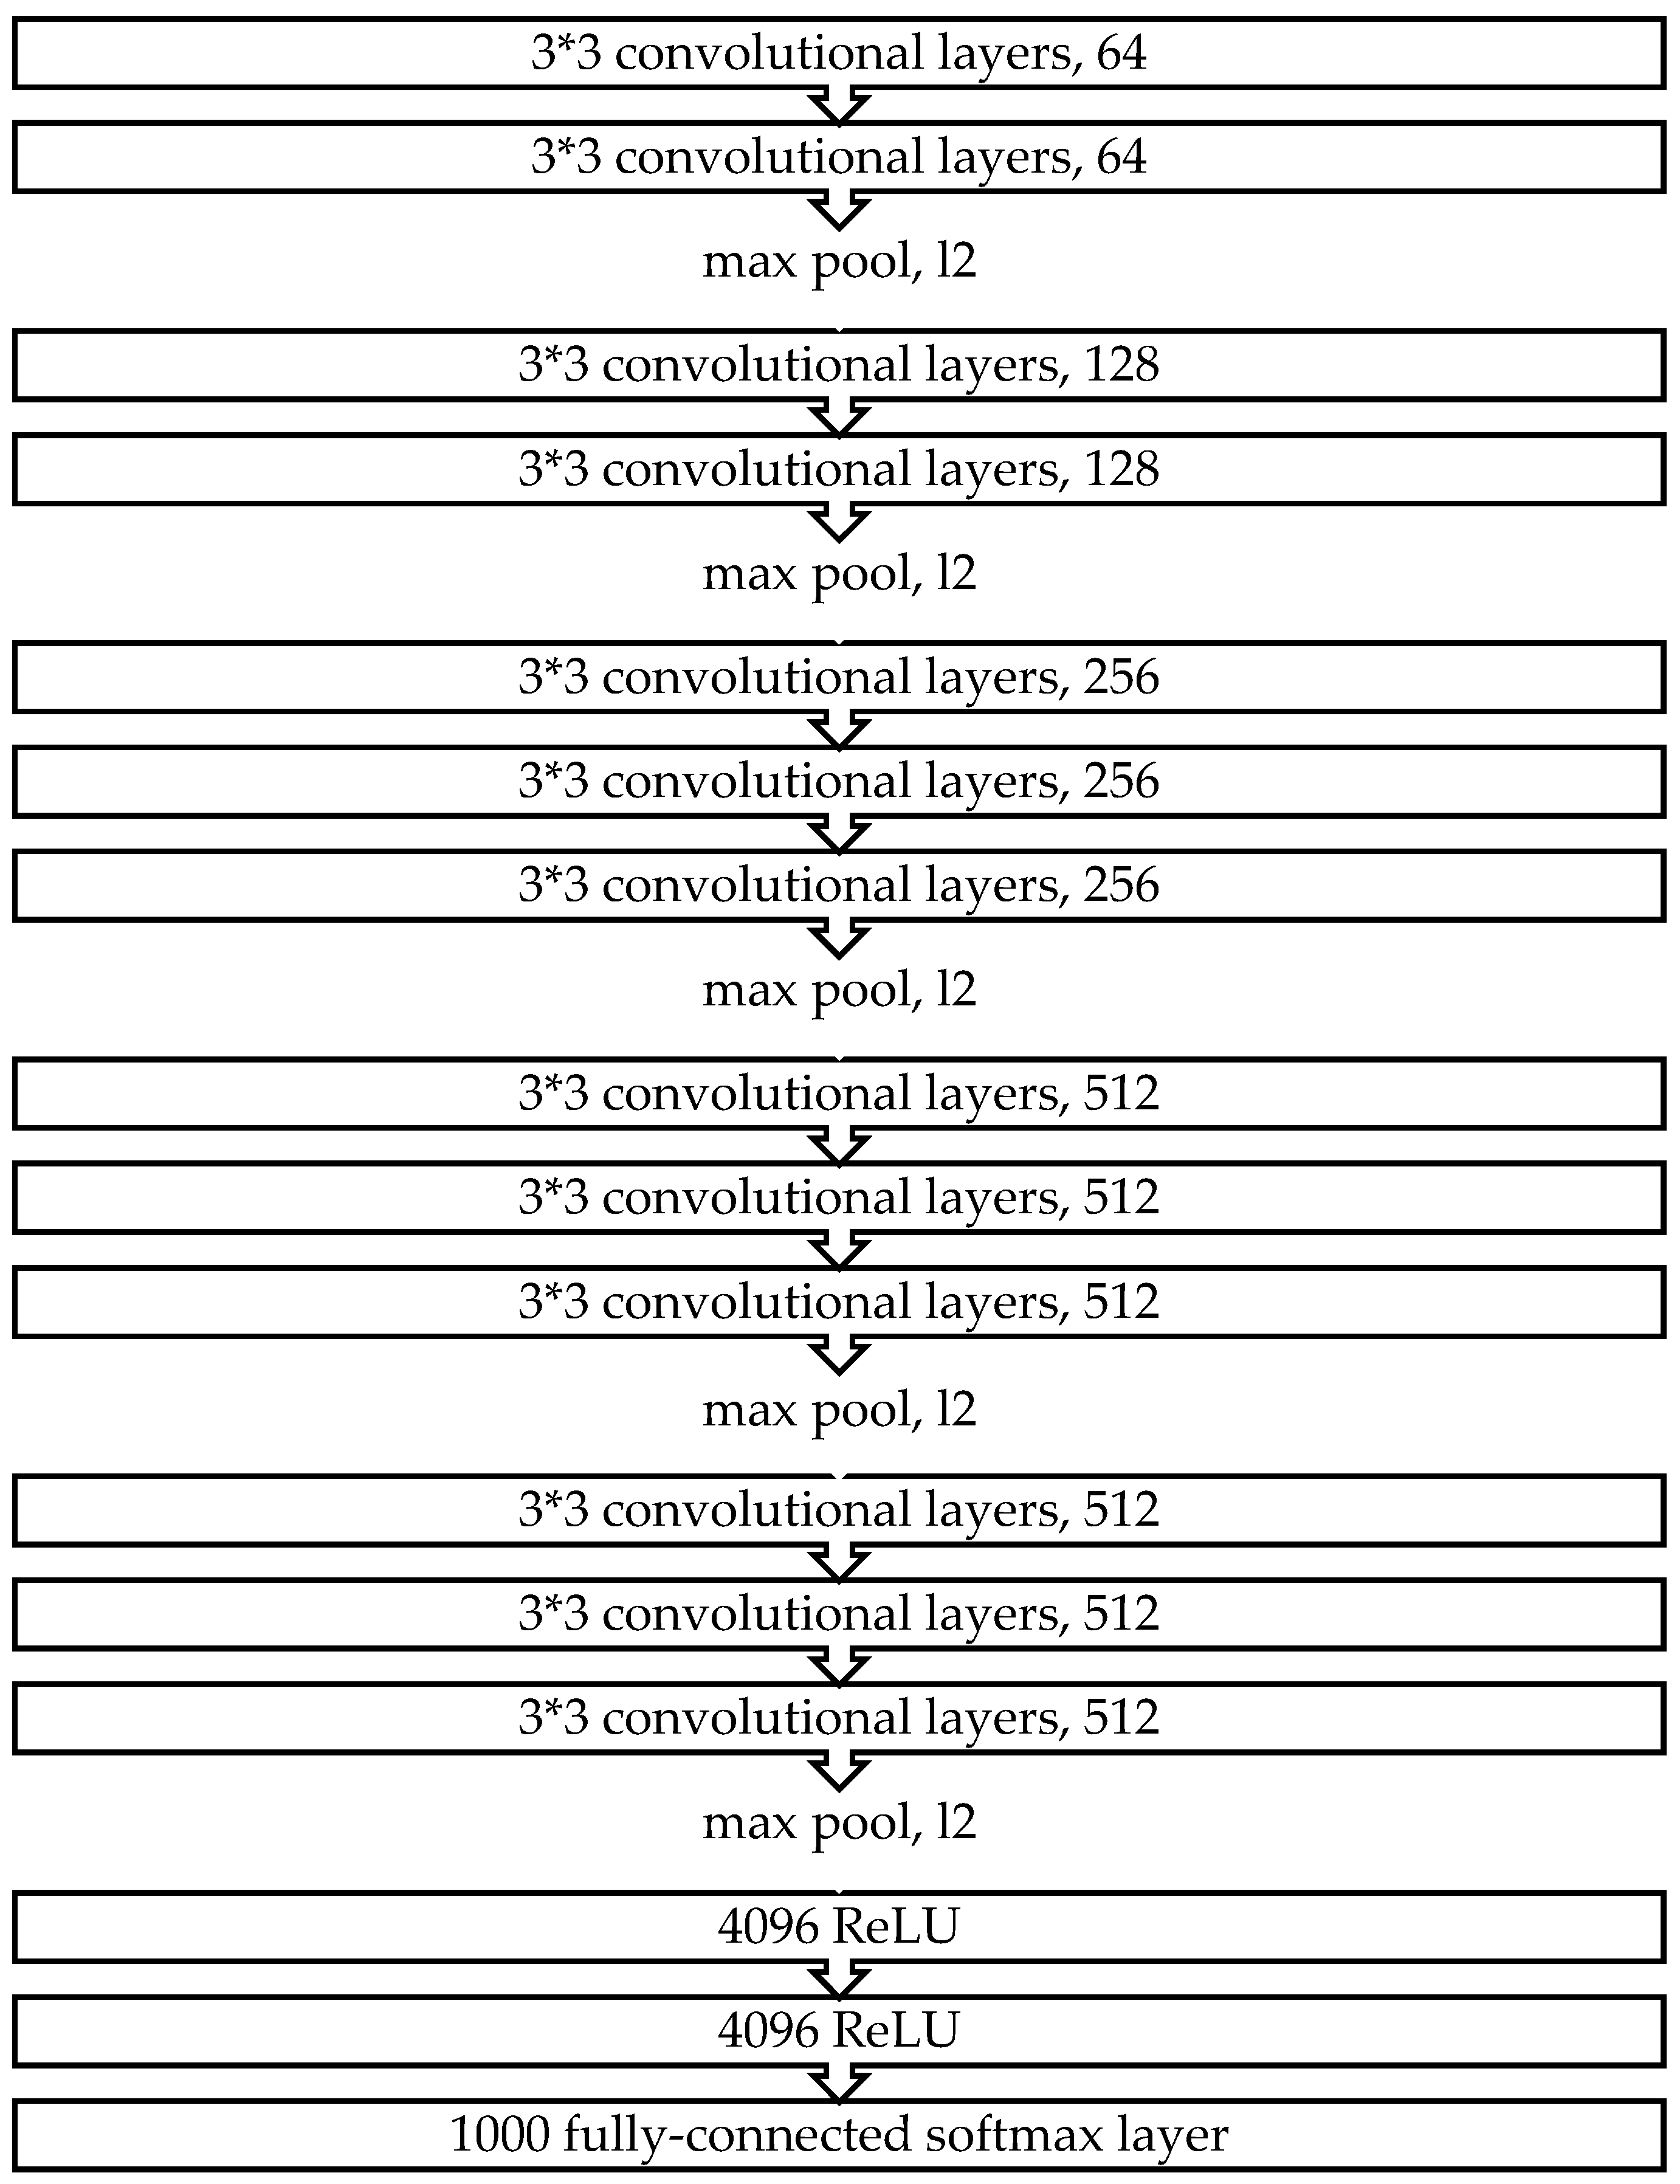
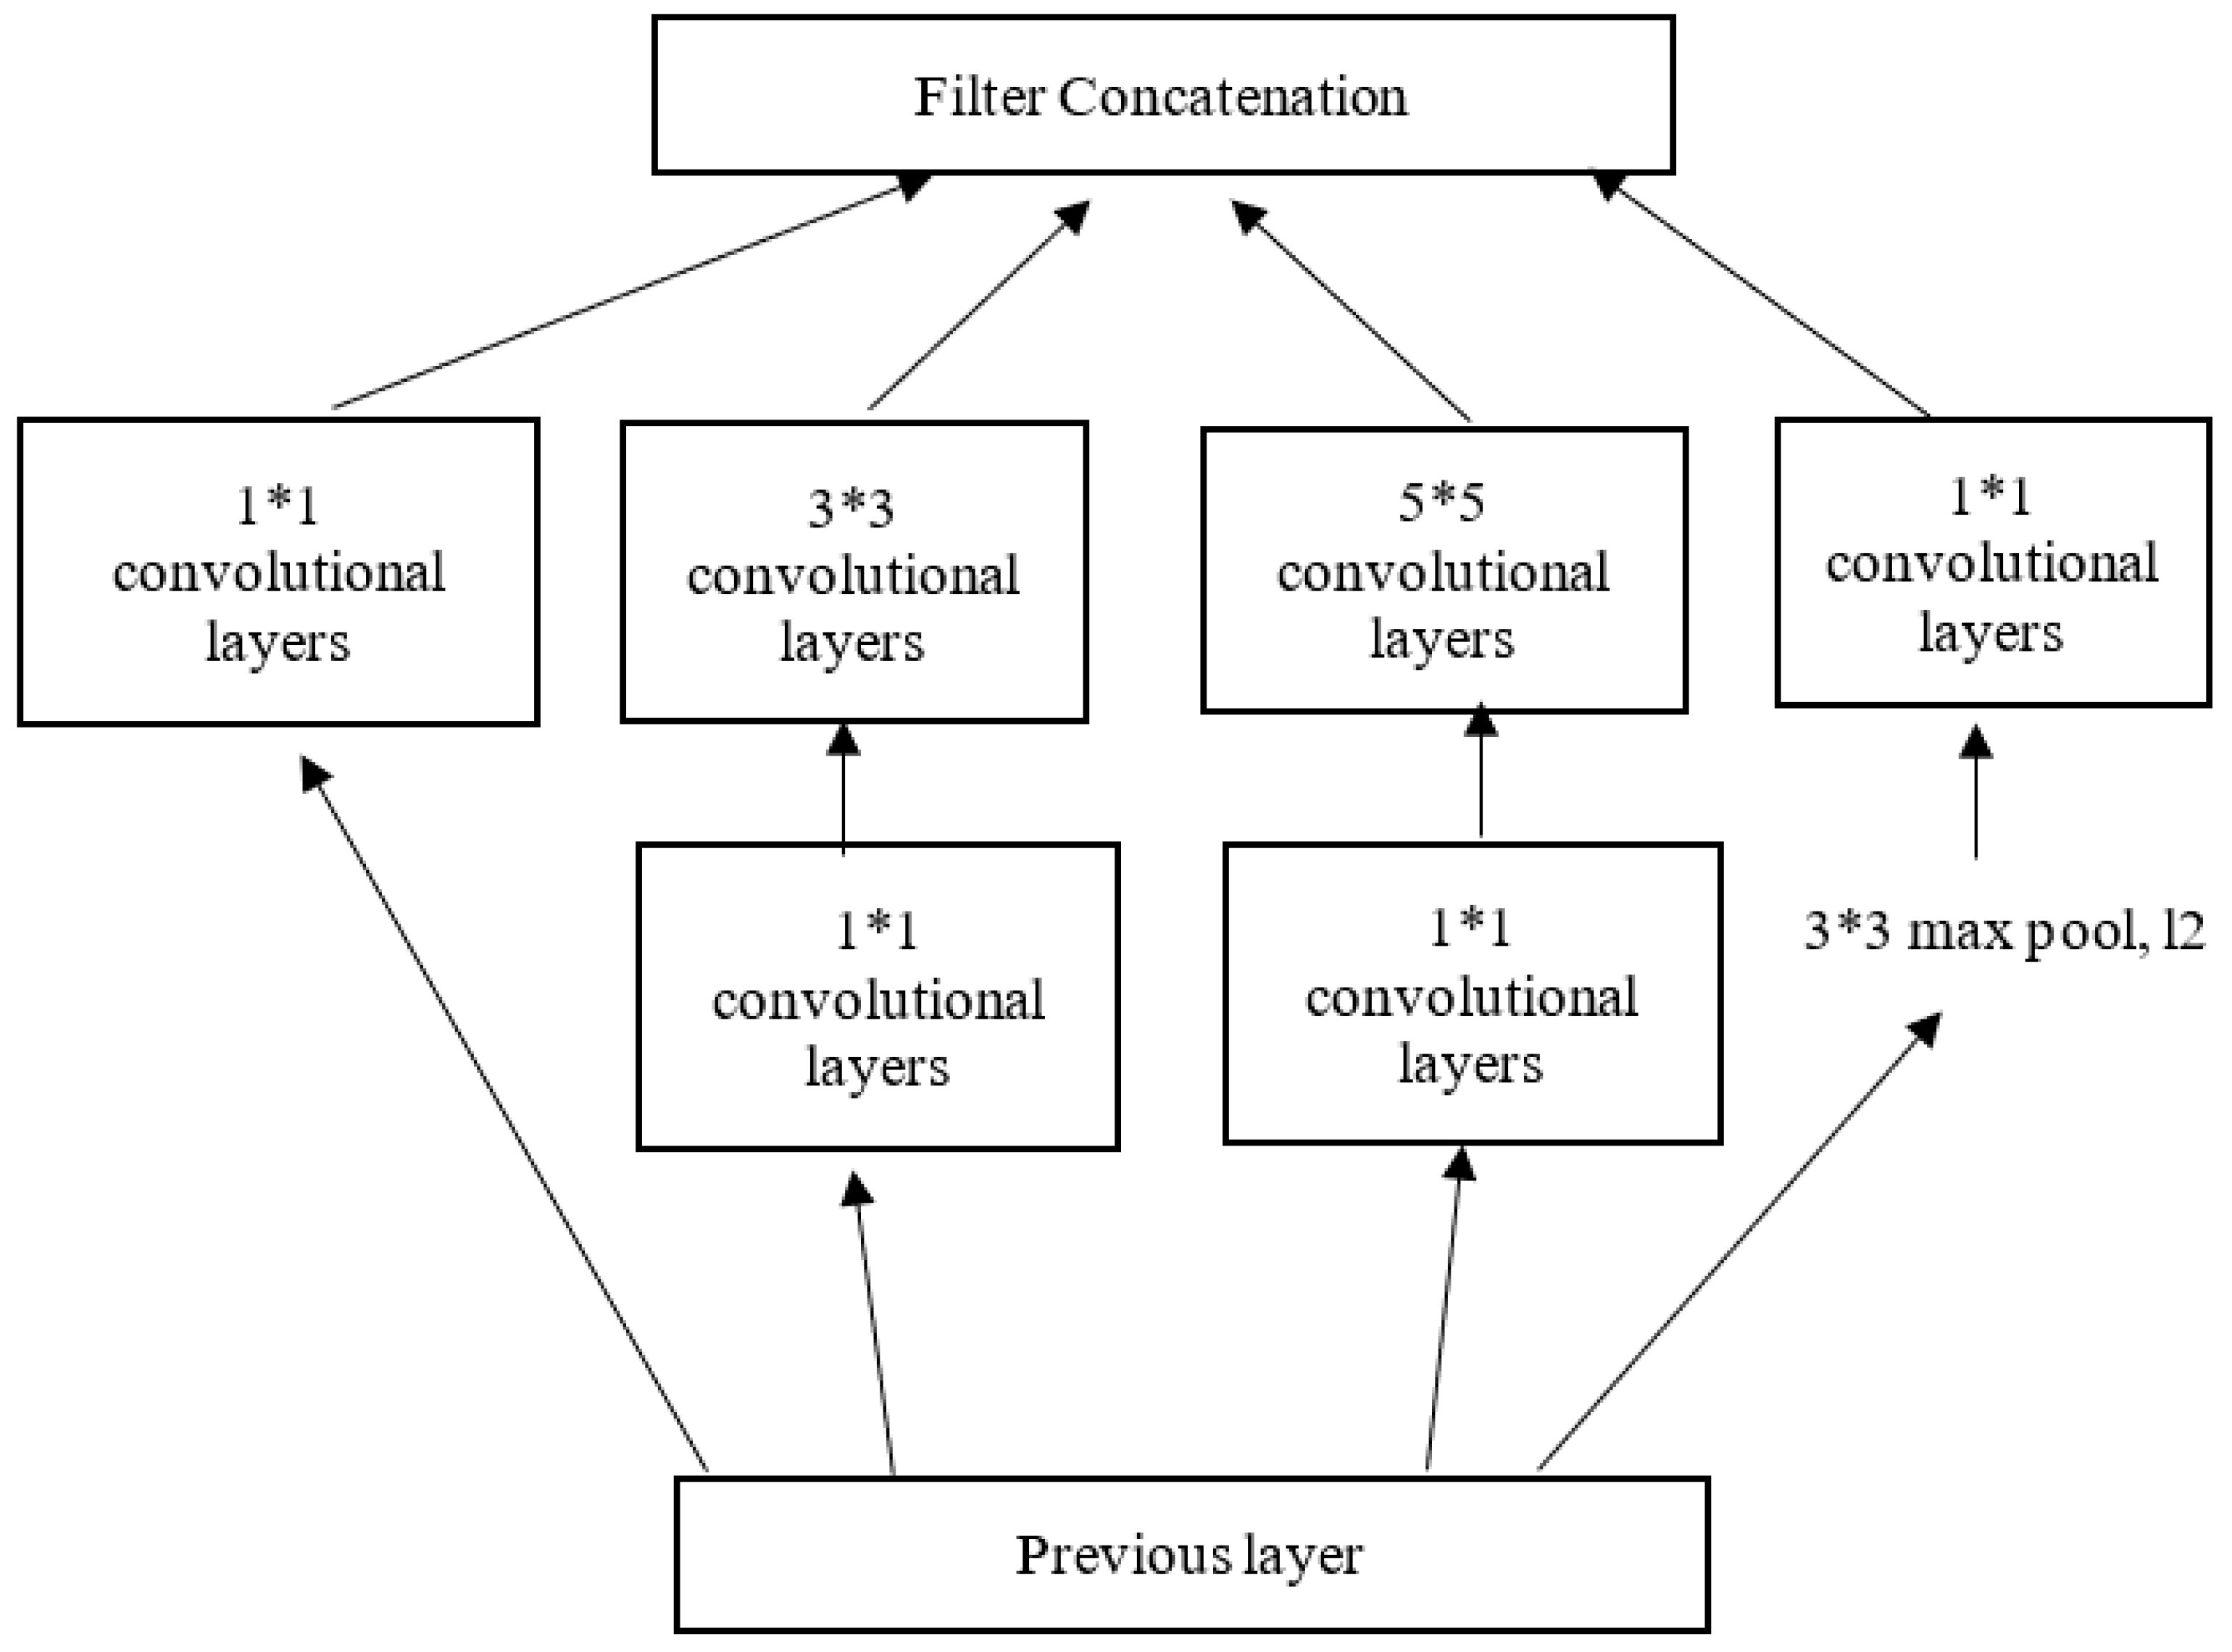
3.1.3. Preliminaries Model-Deep Learning Neural Network
- (1)
- VGG-16
- (2)
- Inception V3
- (3)
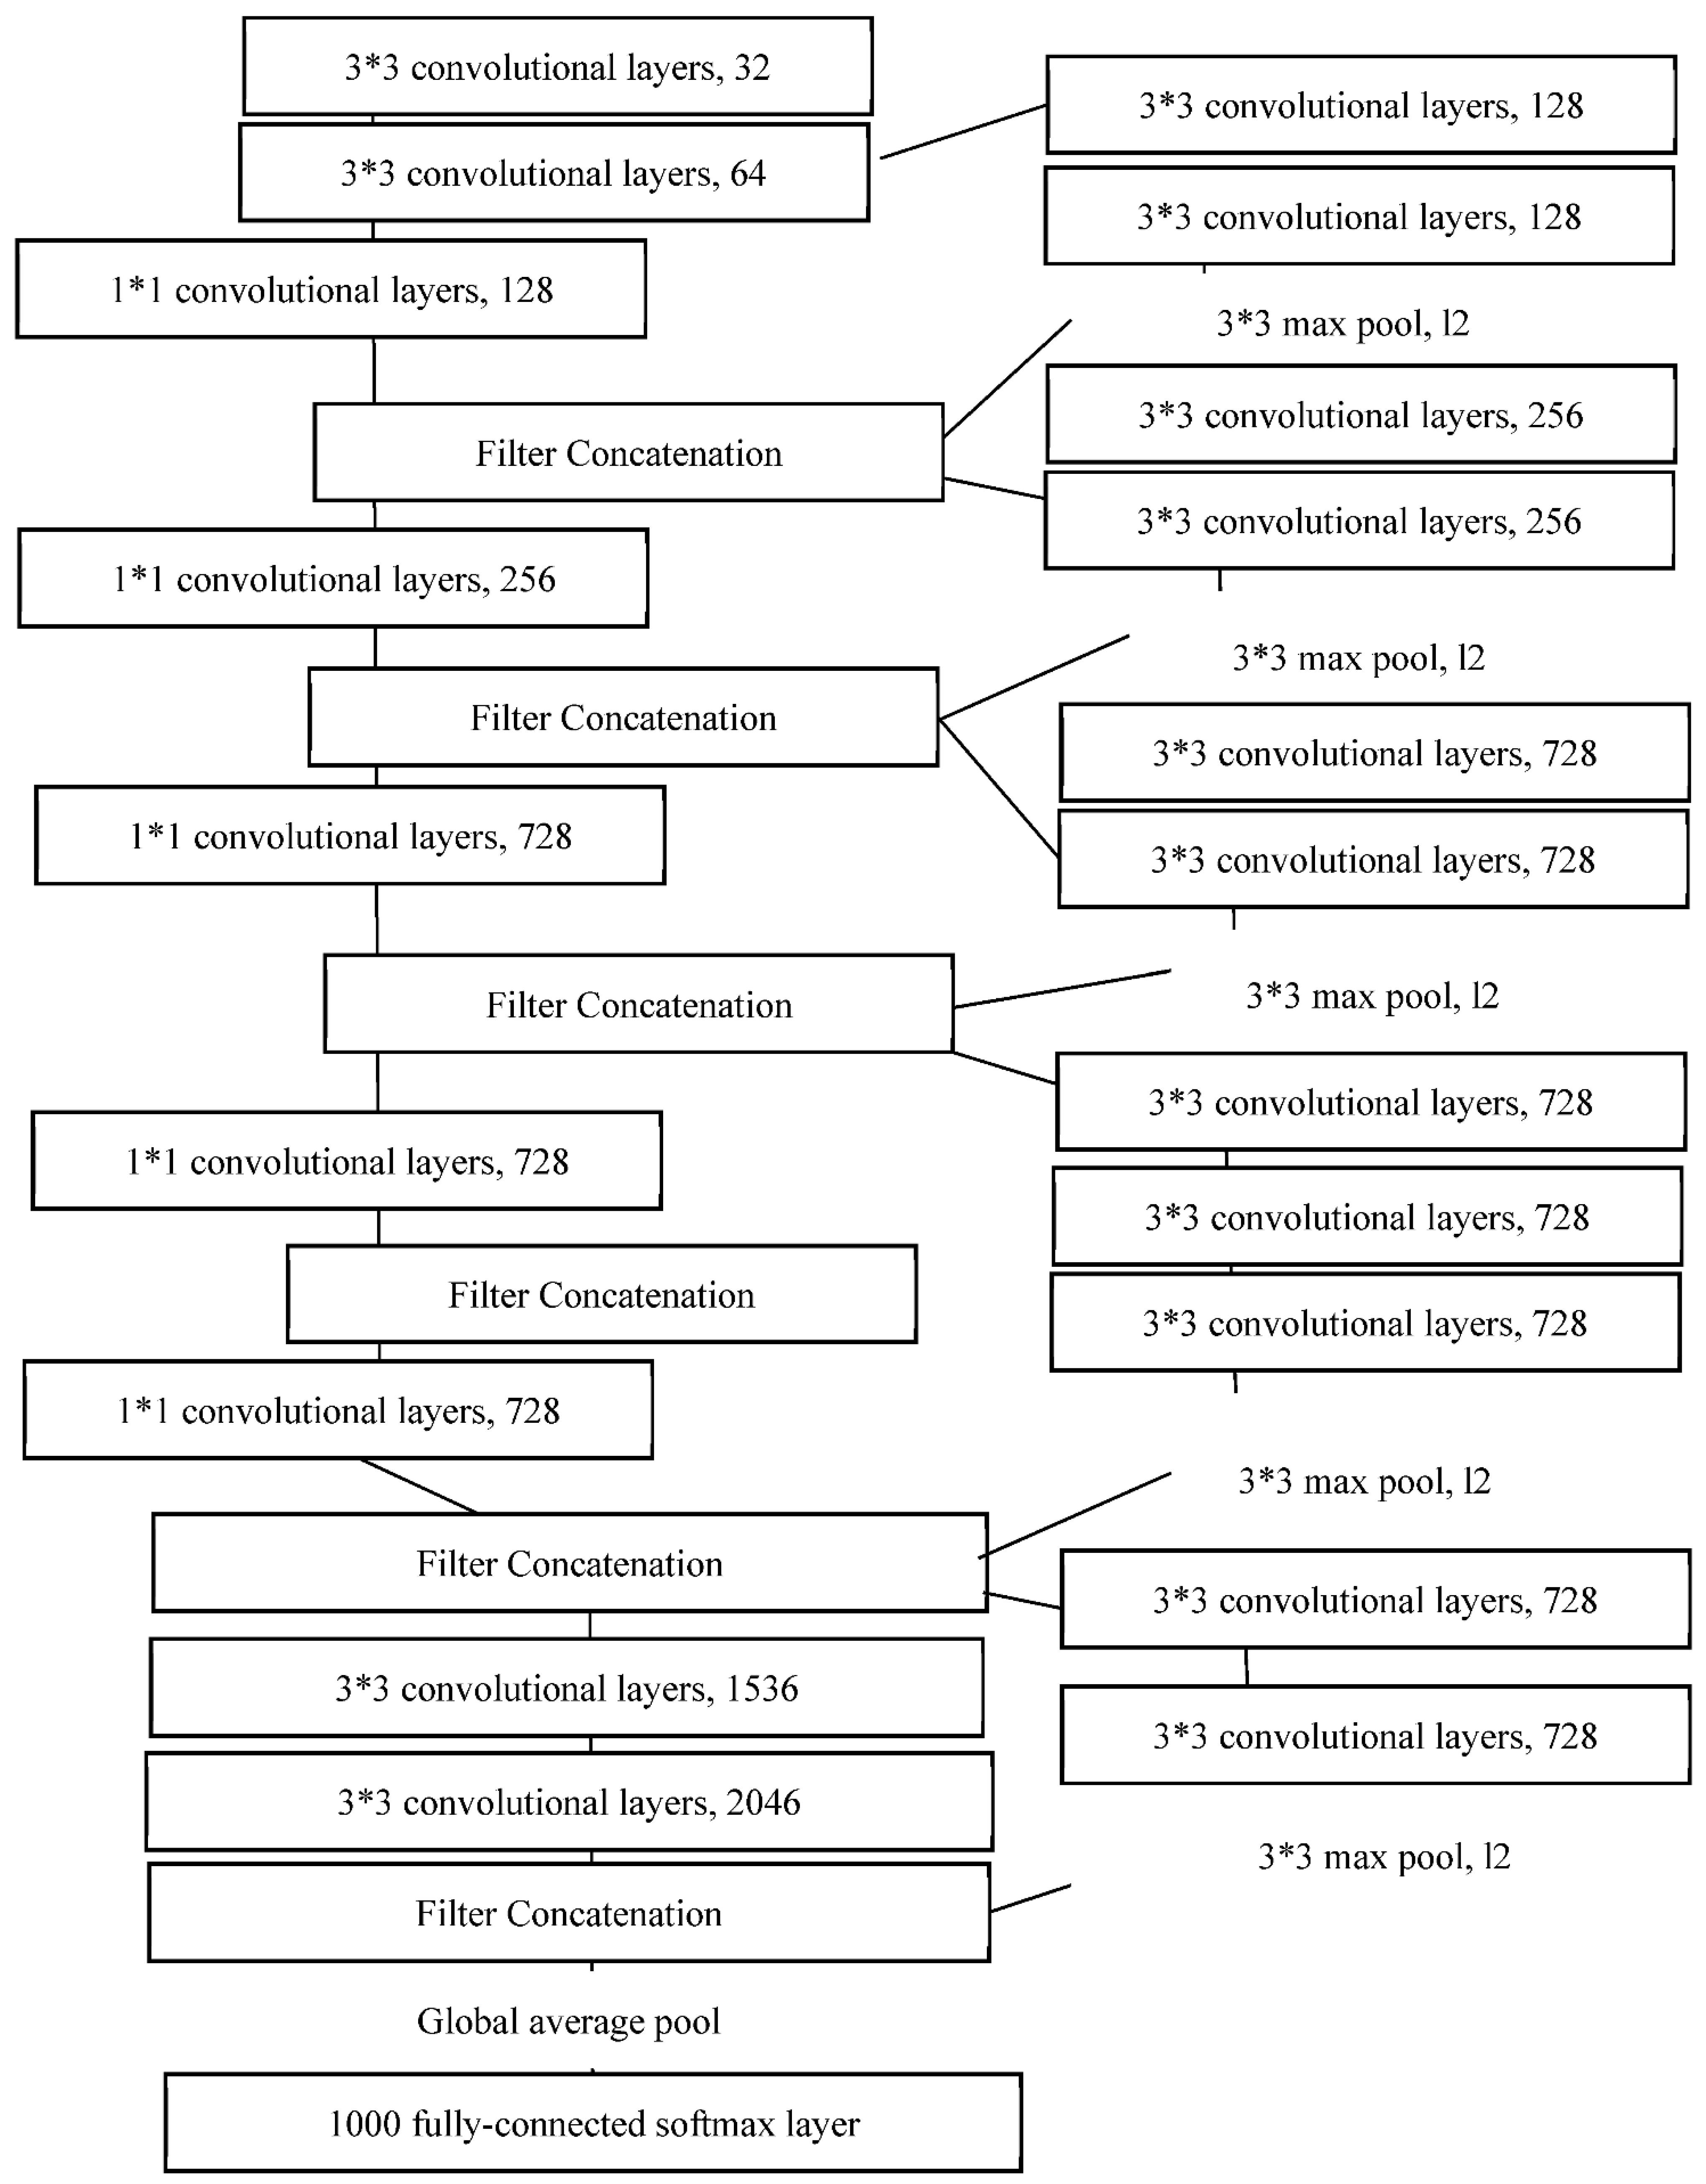
- Xception
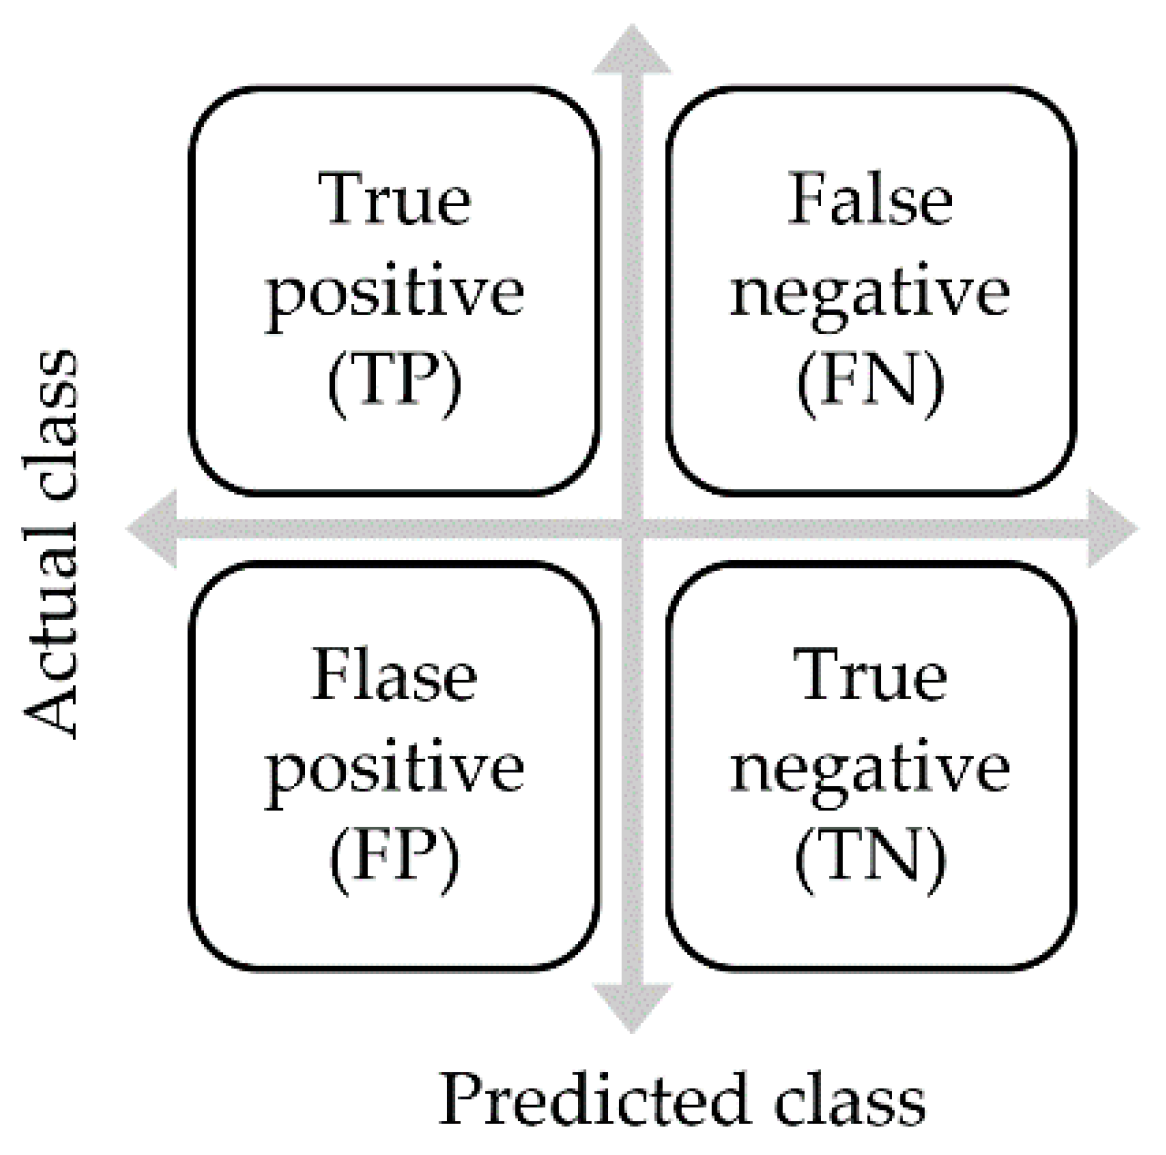
3.1.4. Evaluation Criteria for a Model
- Accuracy rate
- Precision rate (positive predictive value)
- Recall rate (true positive rate)
- F1-score
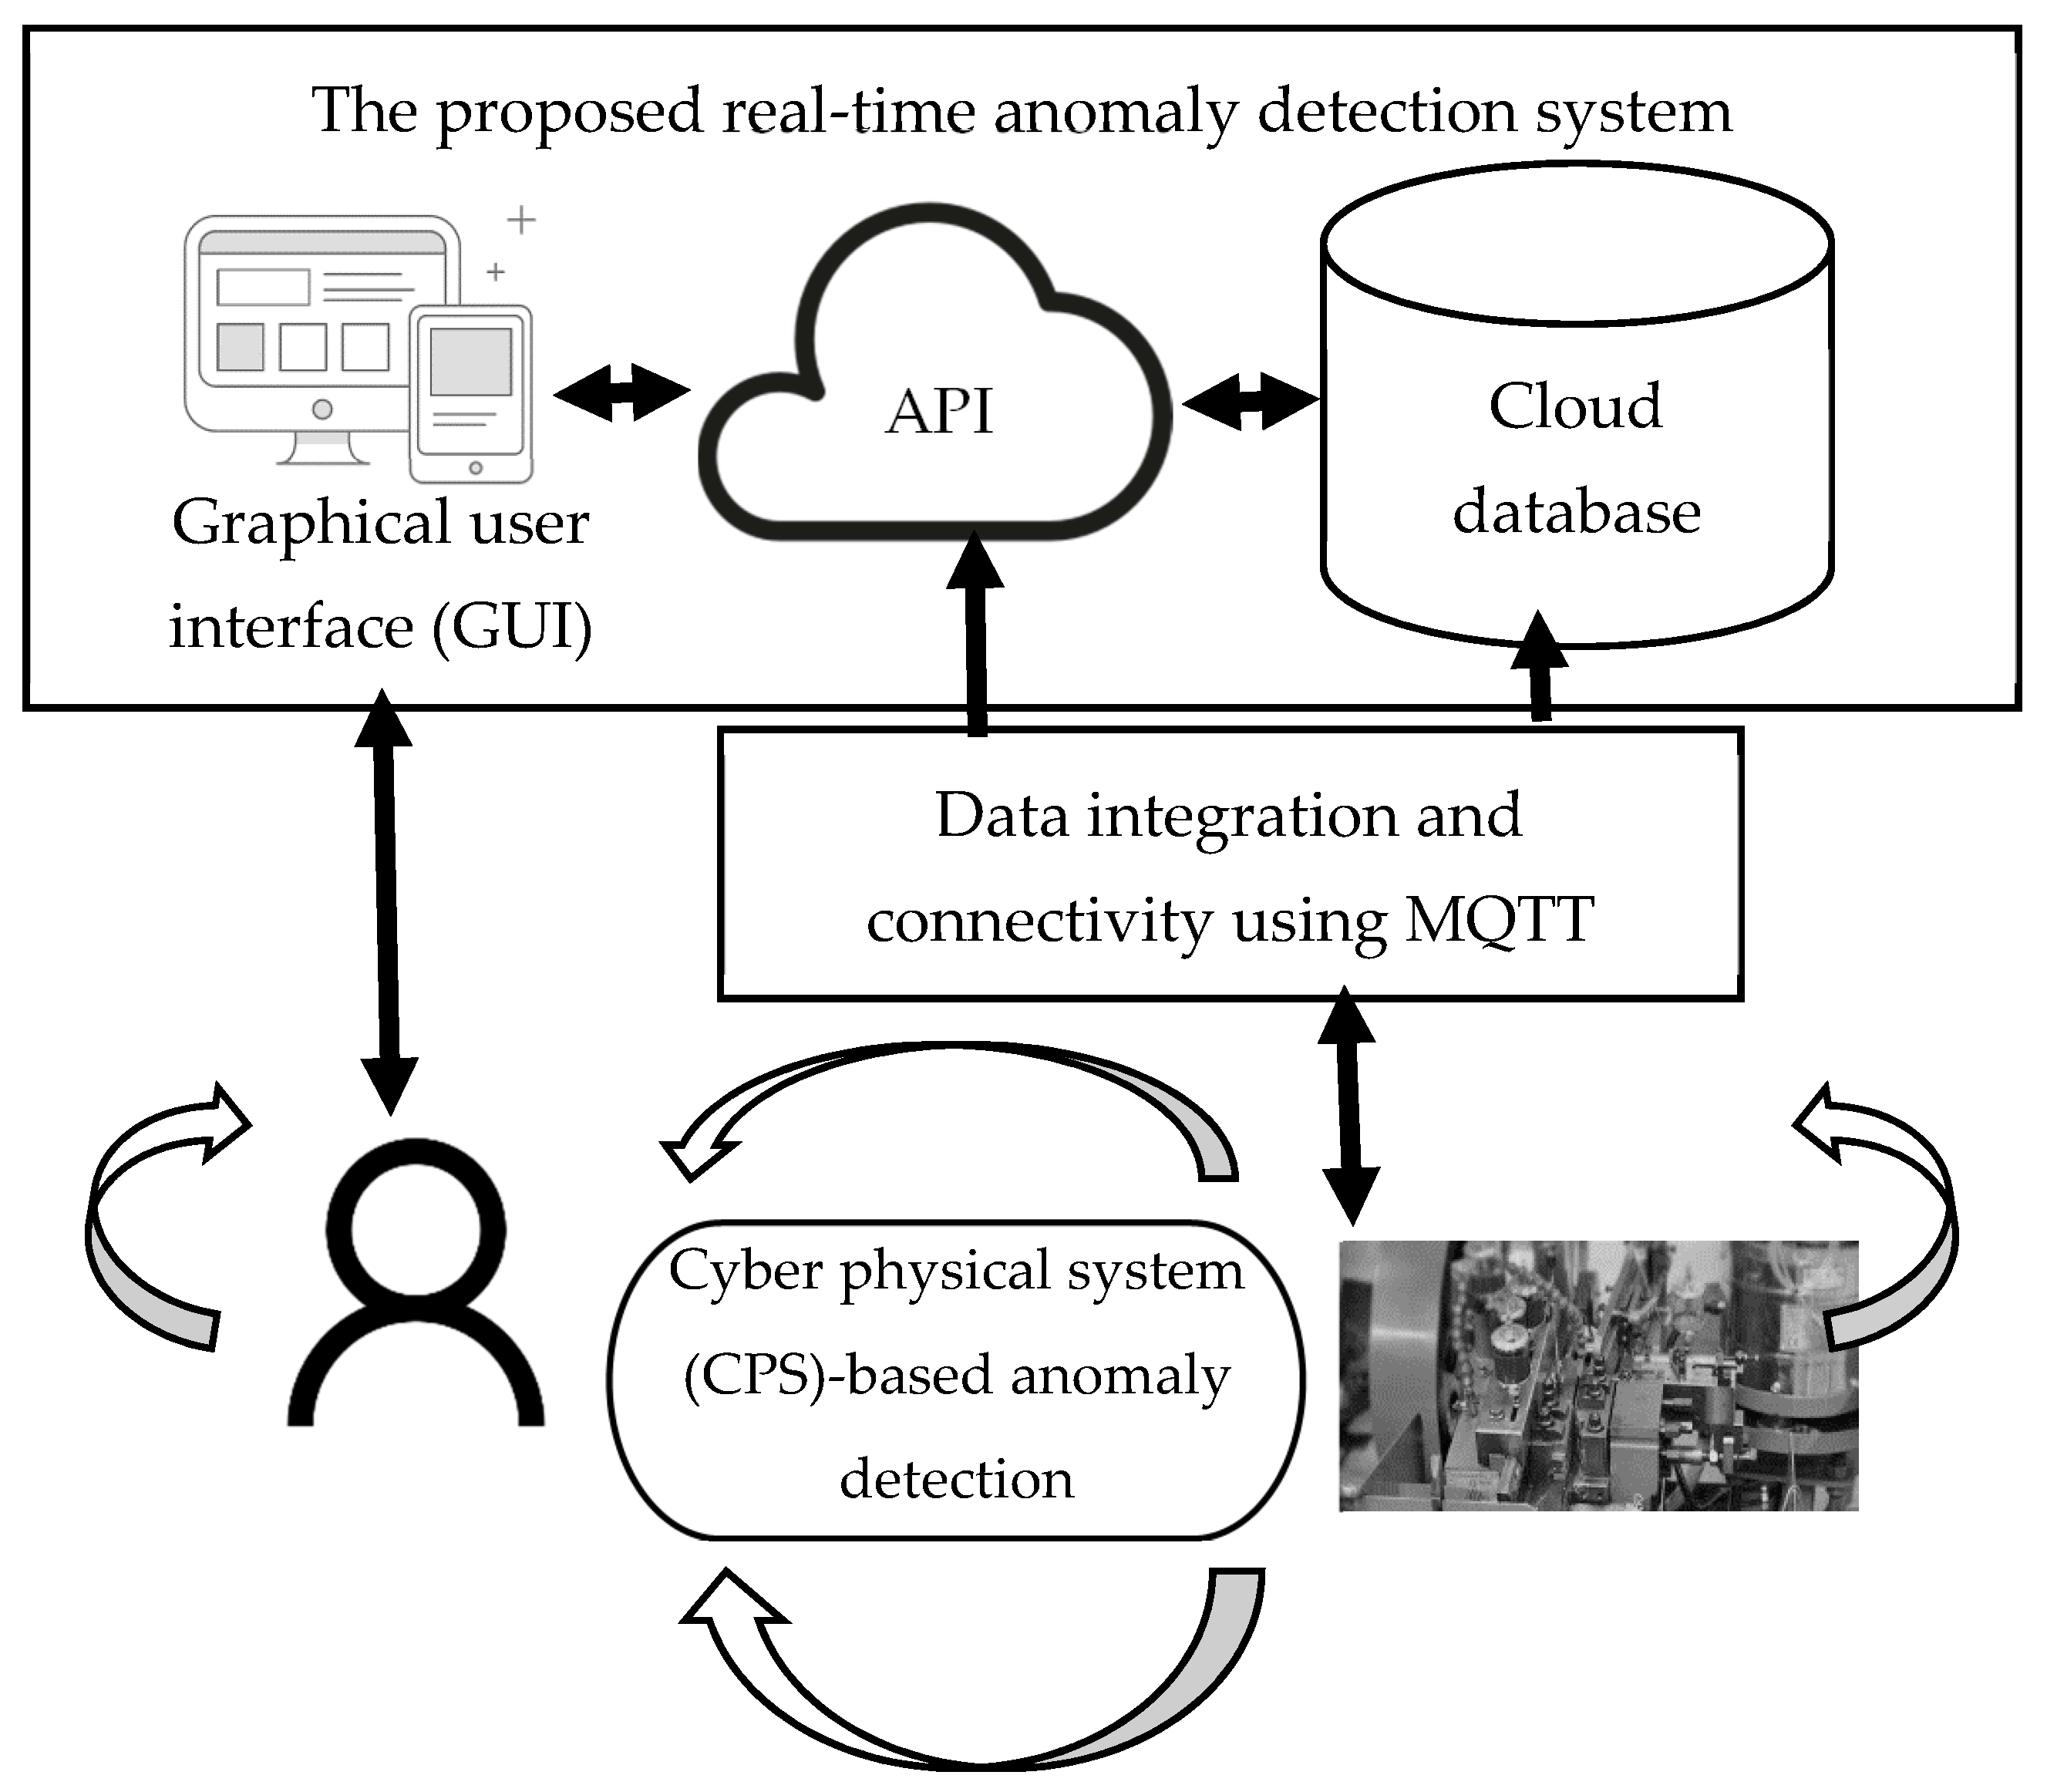
3.2. Proposed Real-Time Anomaly Detection System
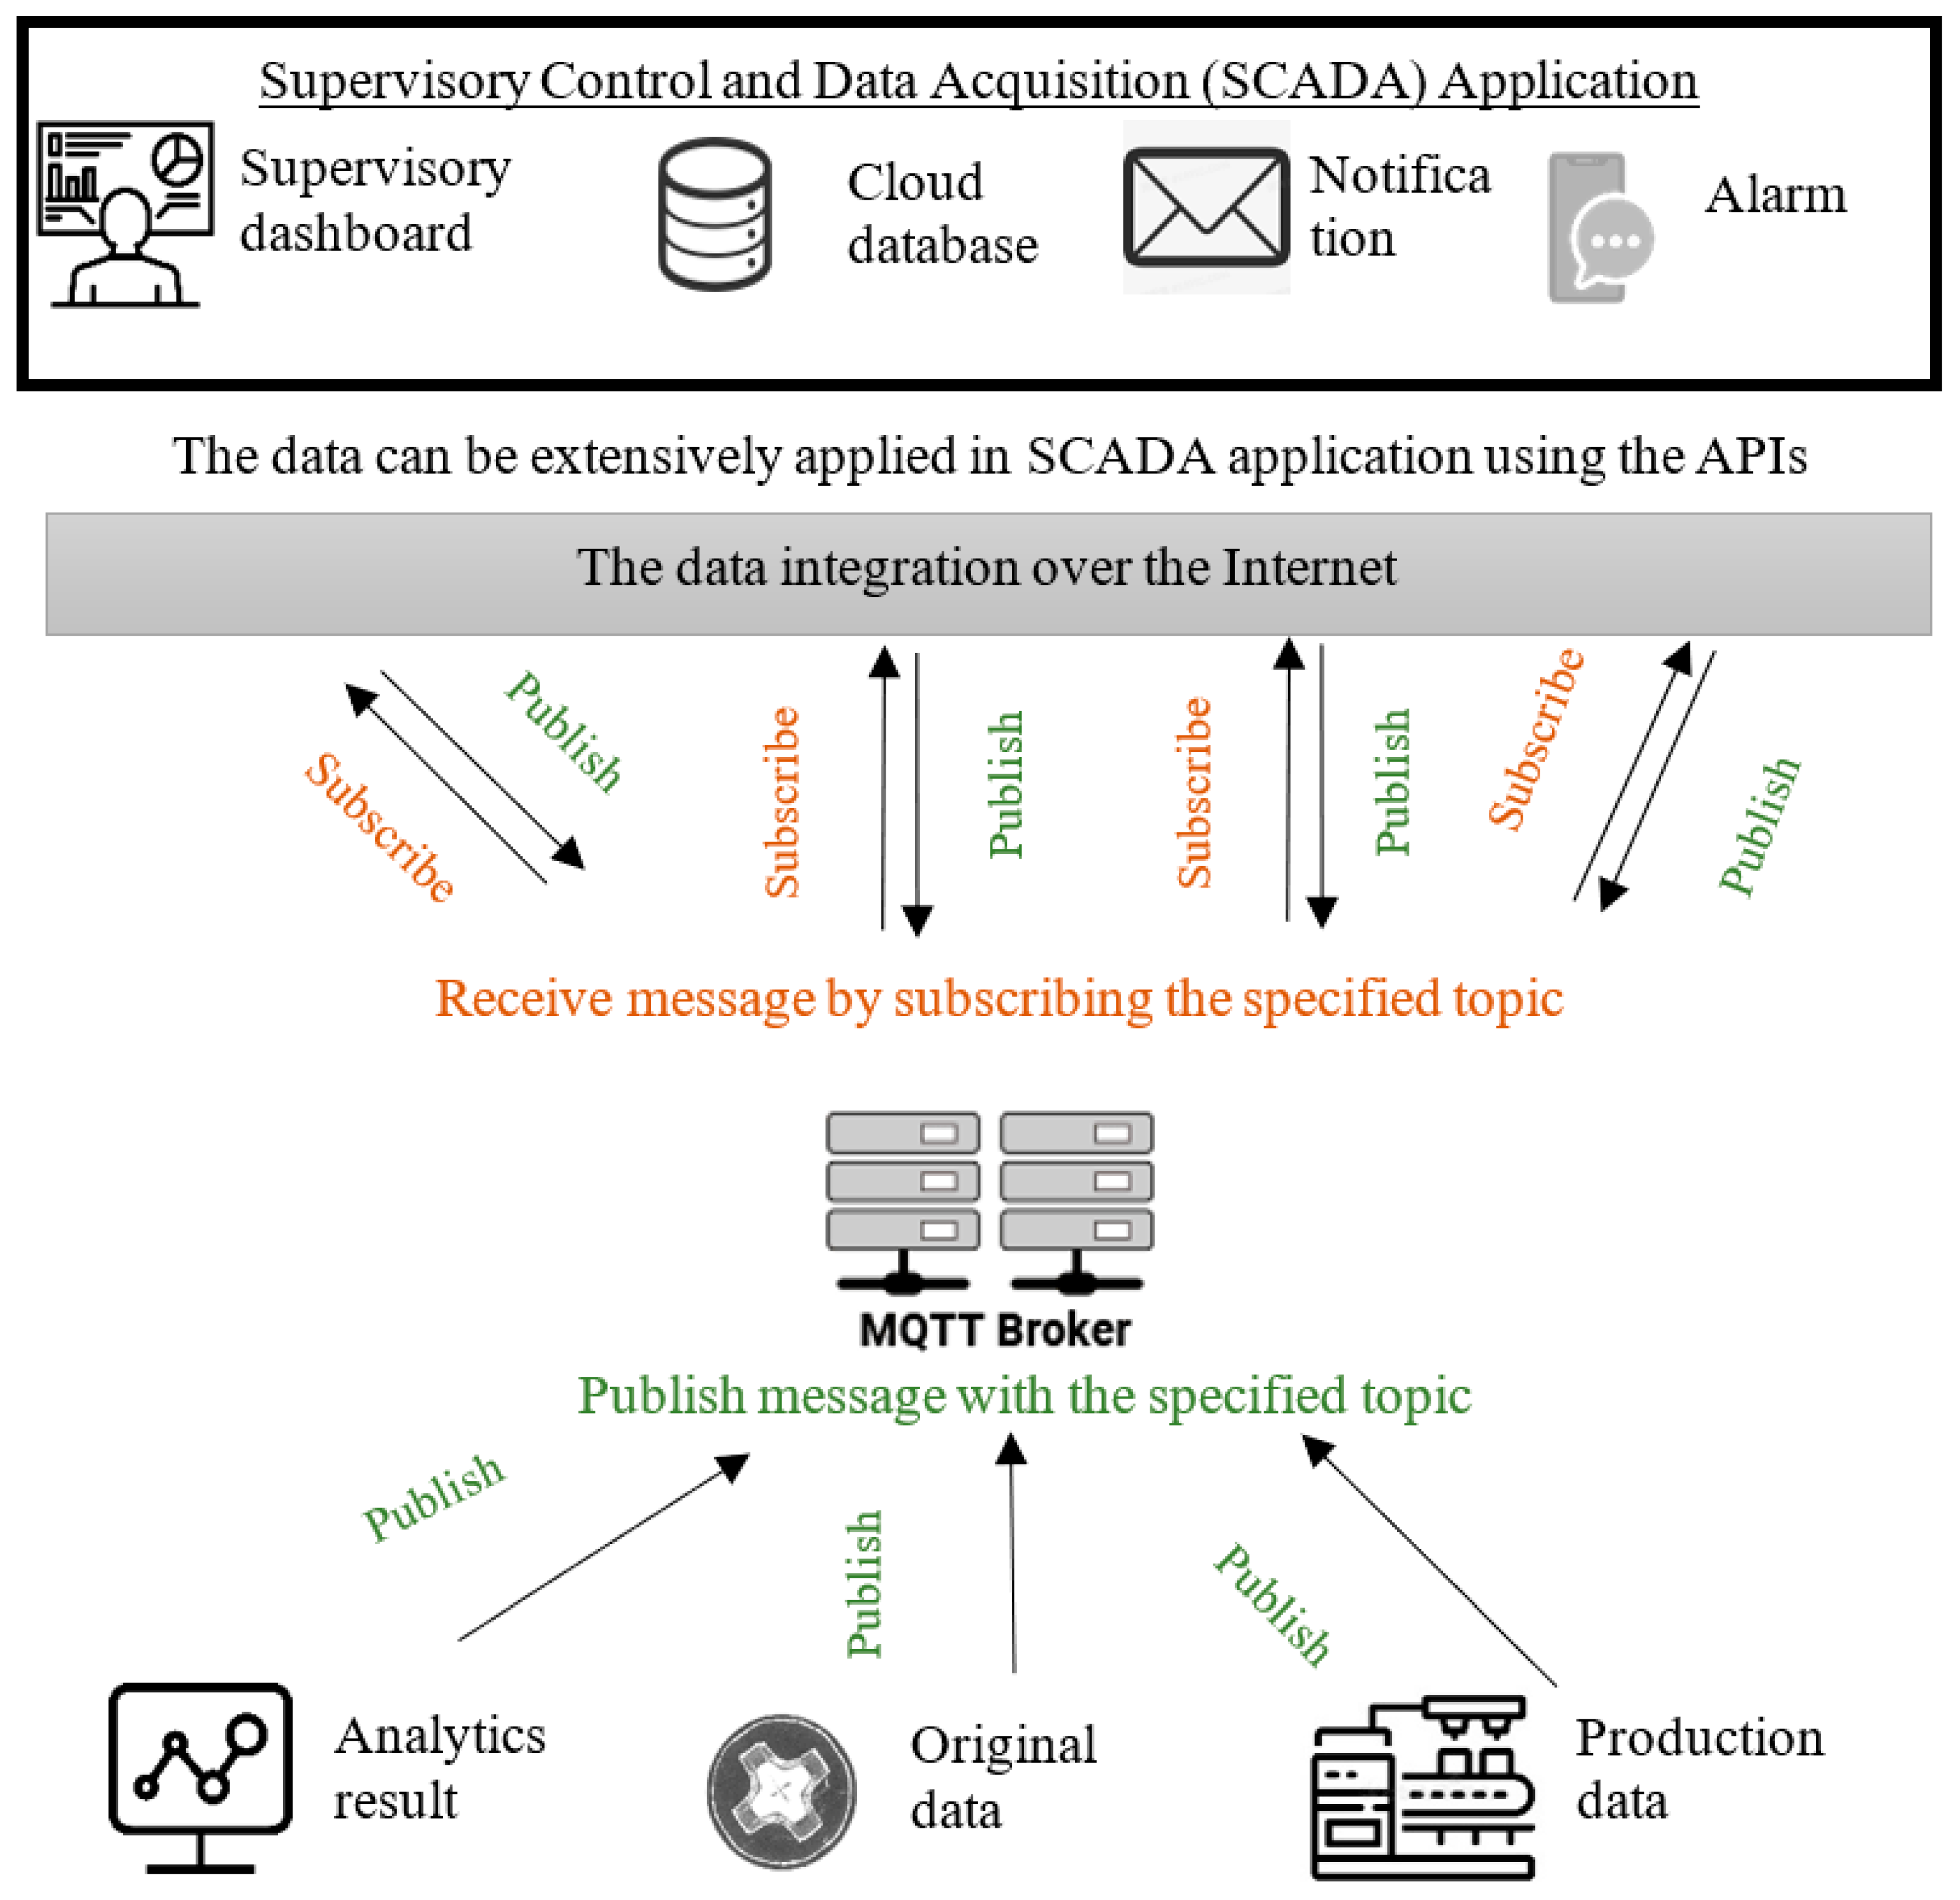
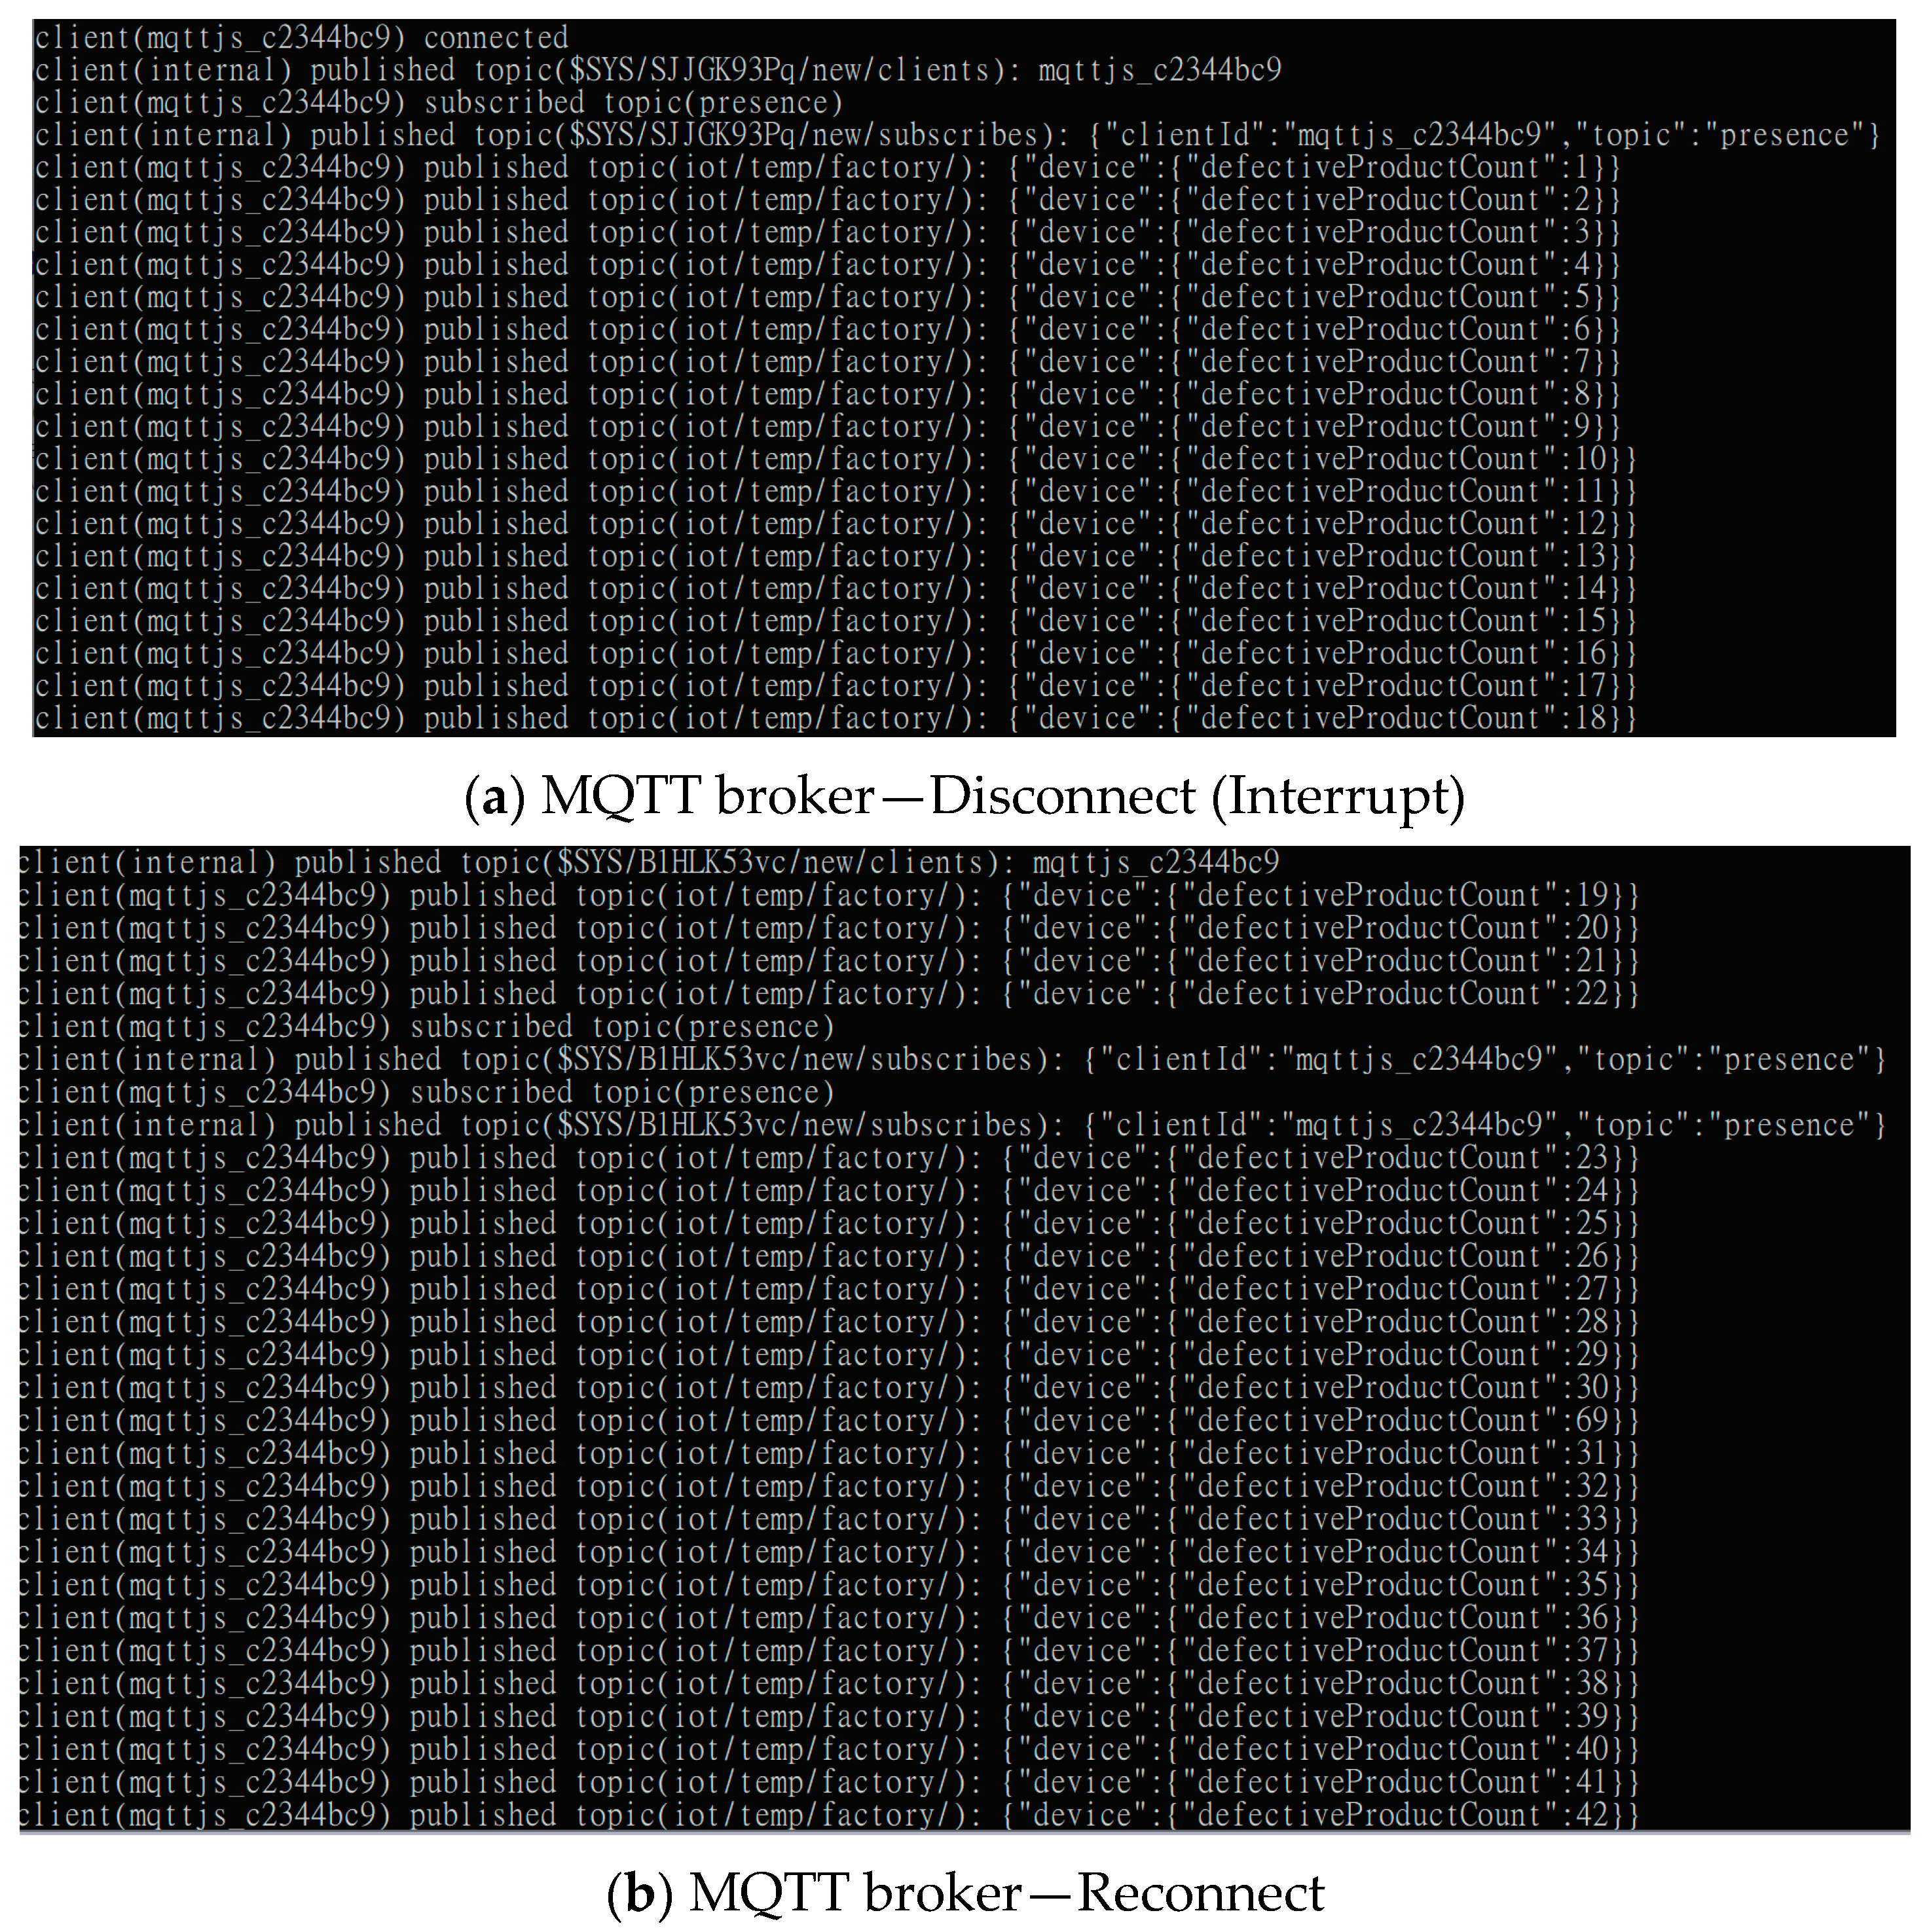
3.2.1. Real-Time Anomaly Data Connectivity via the MQTT Protocol
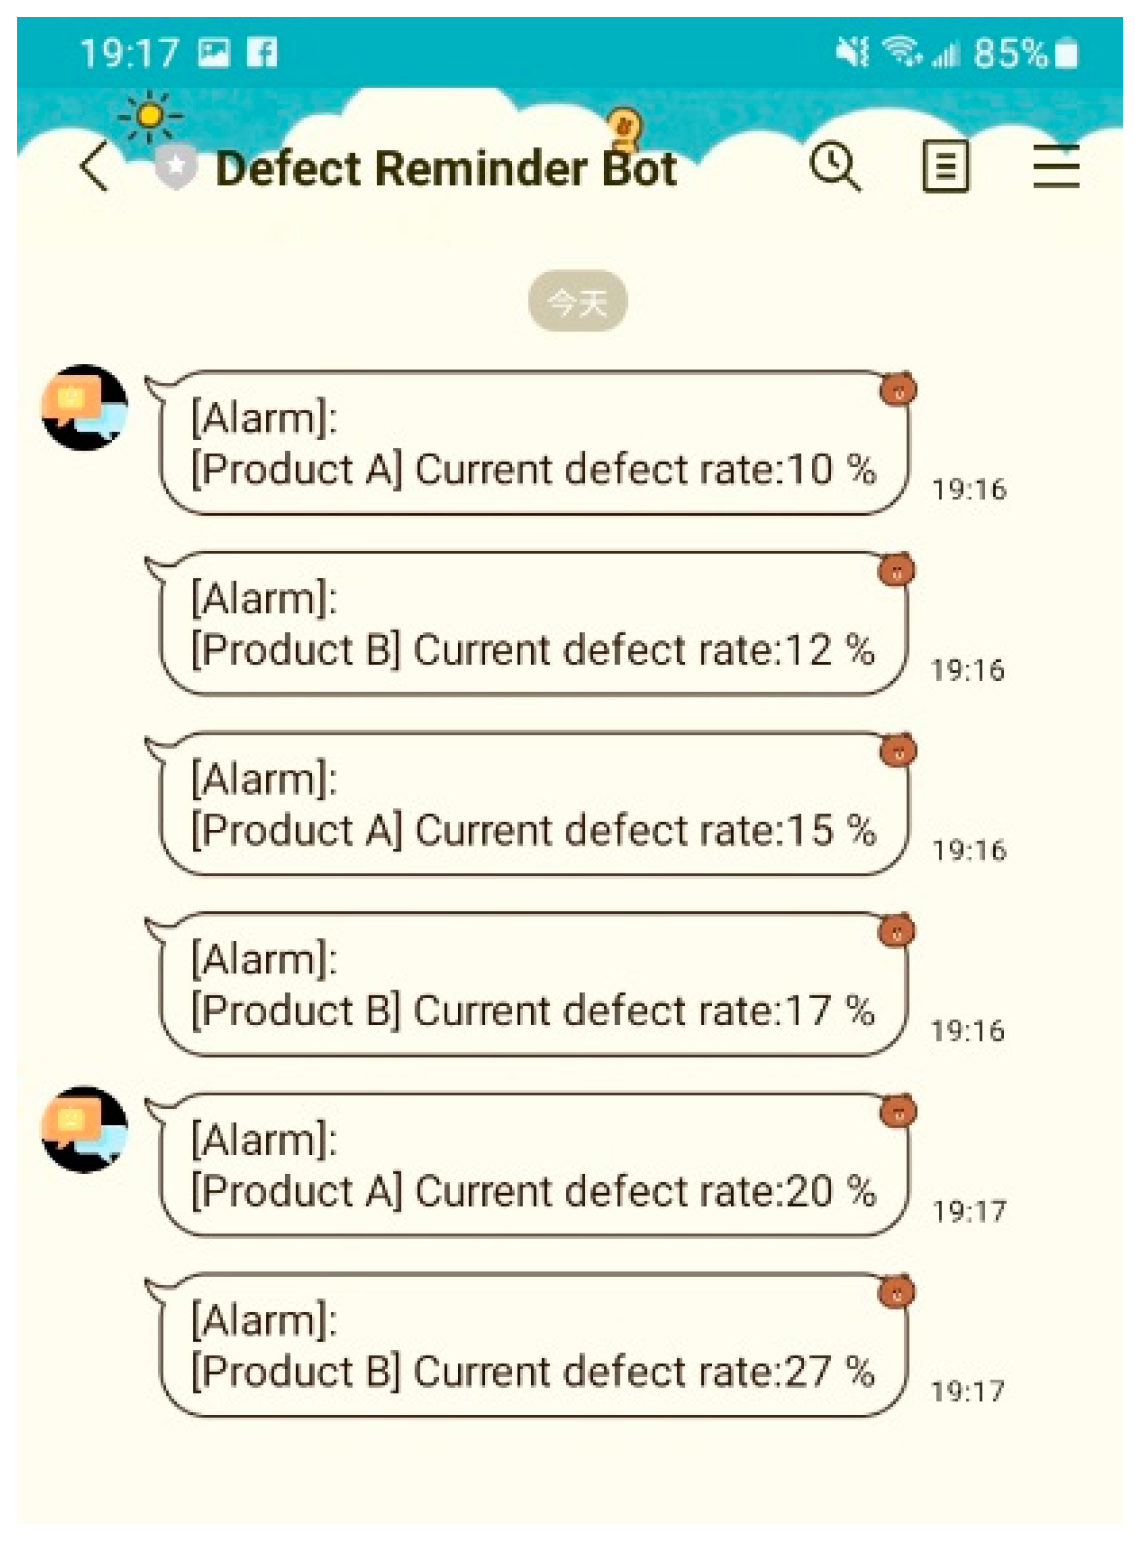
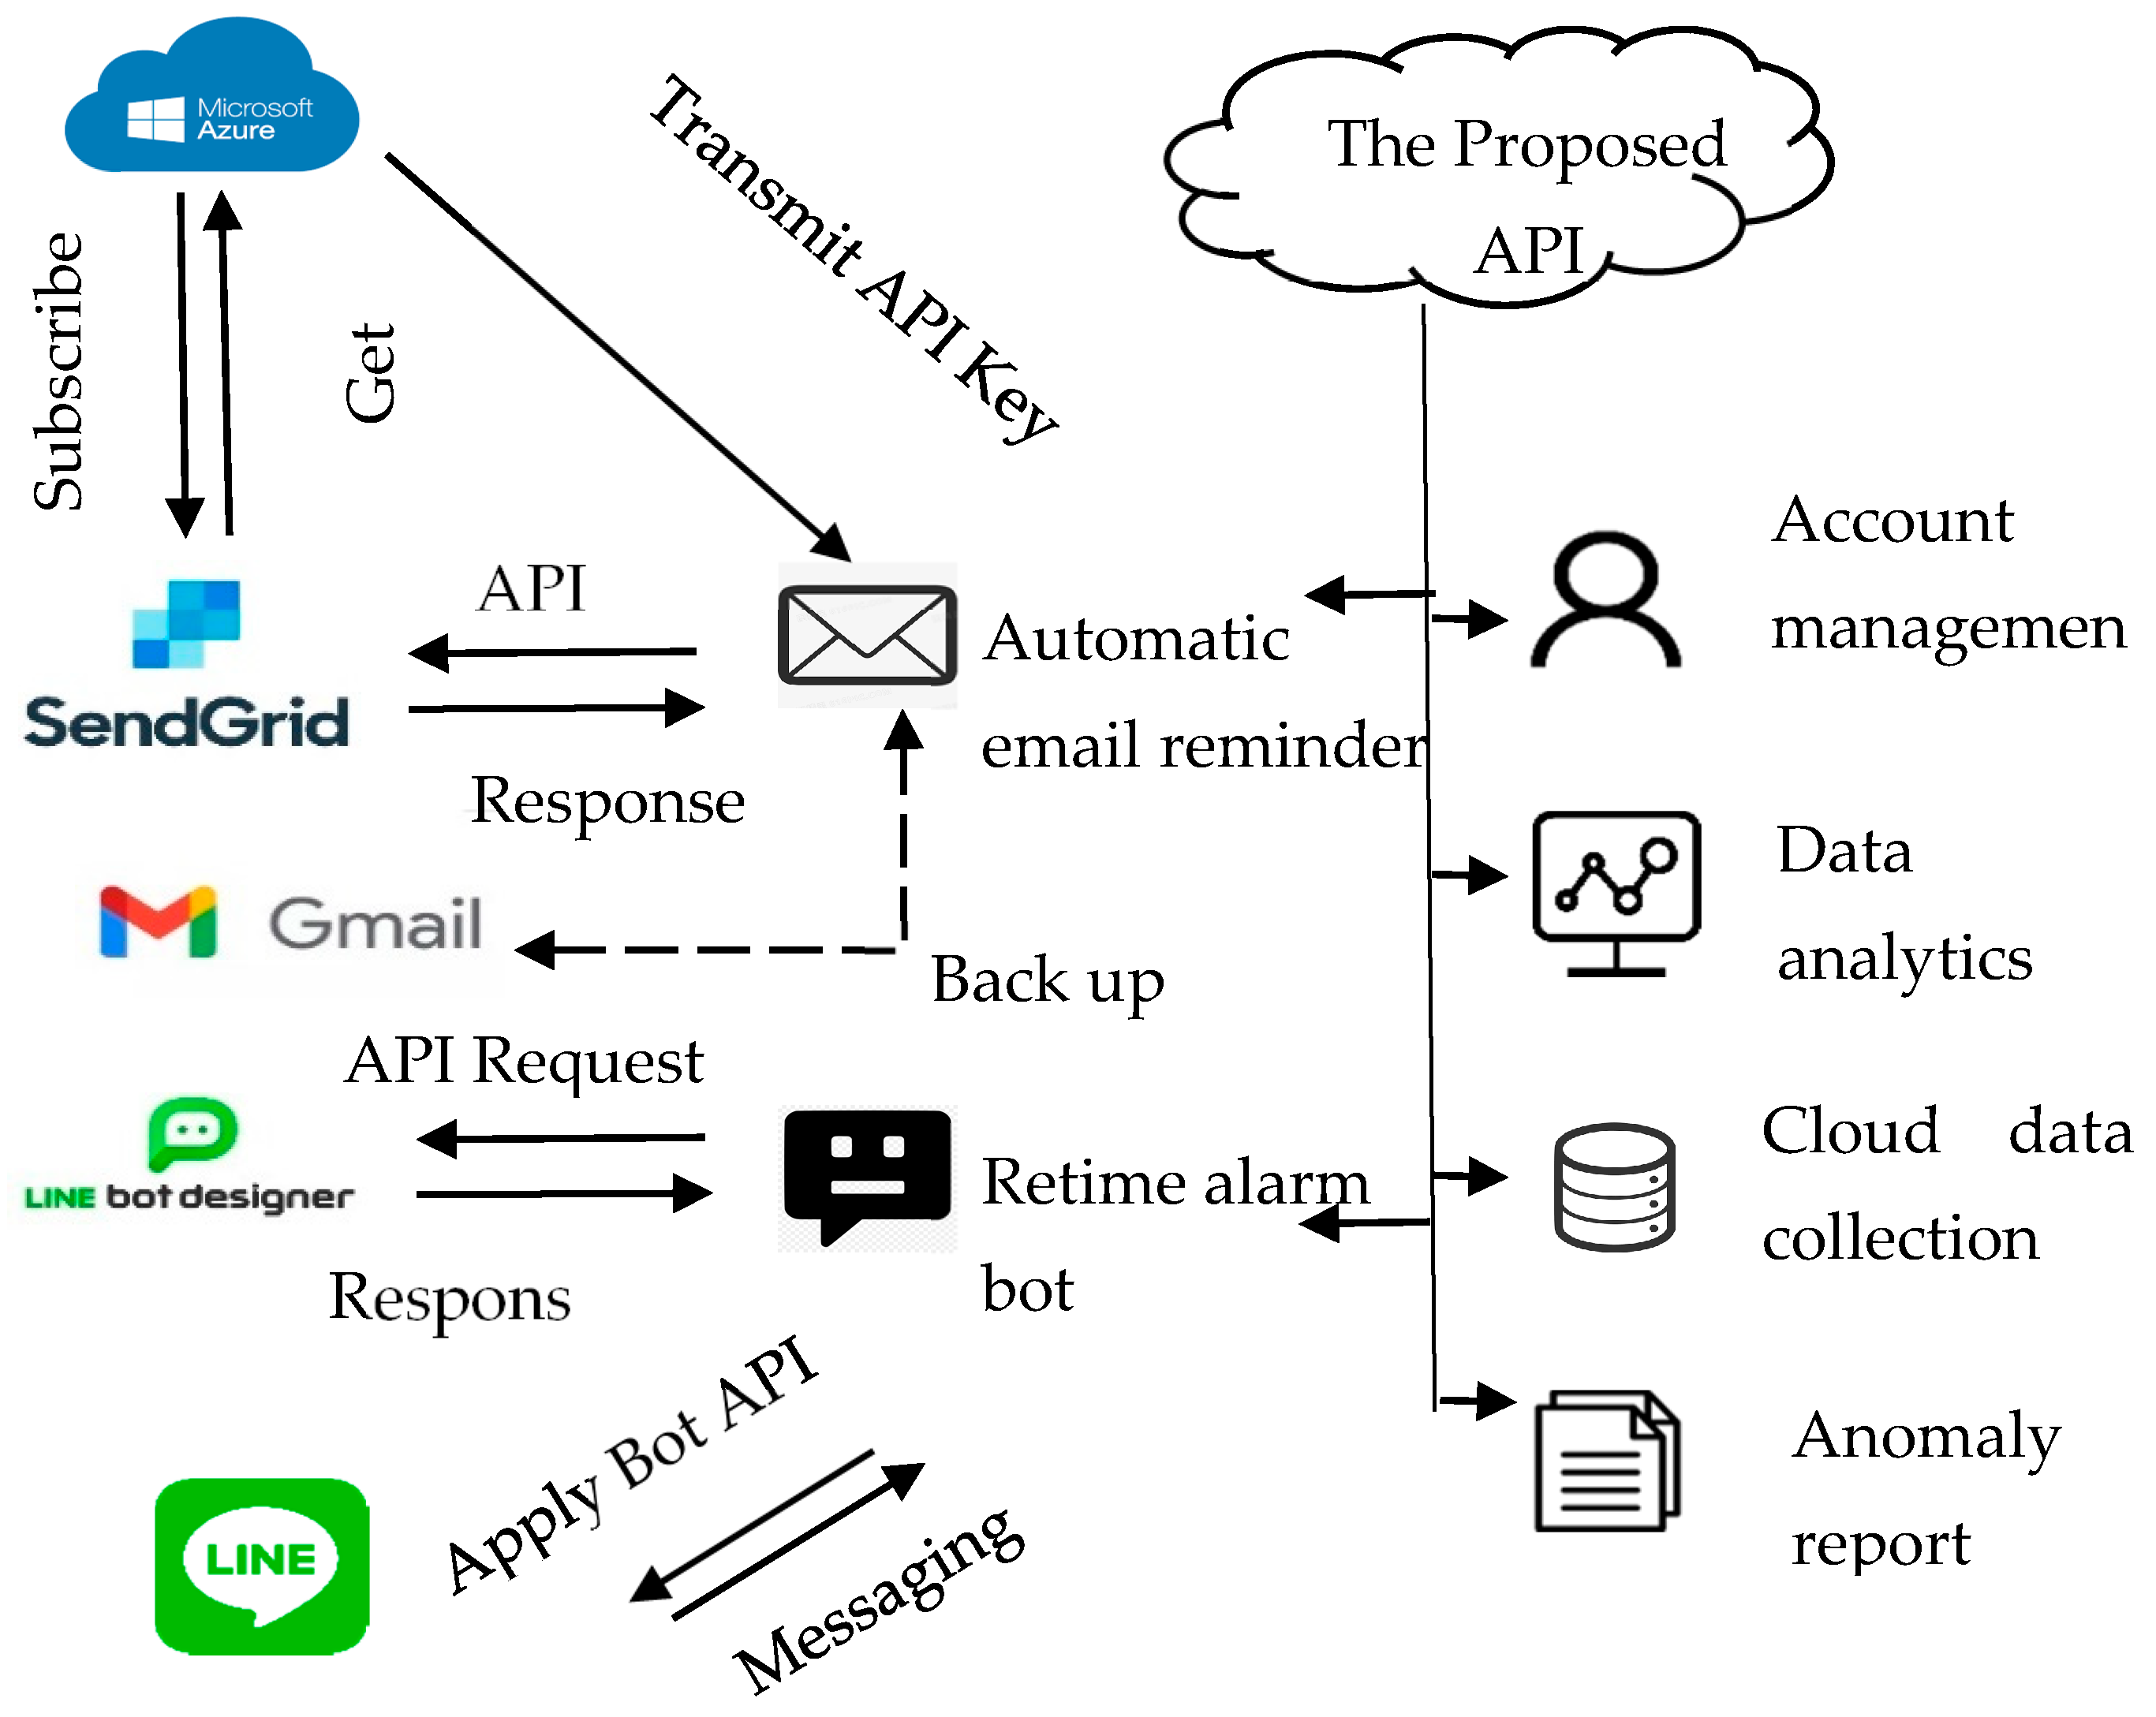
3.2.2. Automatic Notification for Anomaly Detection
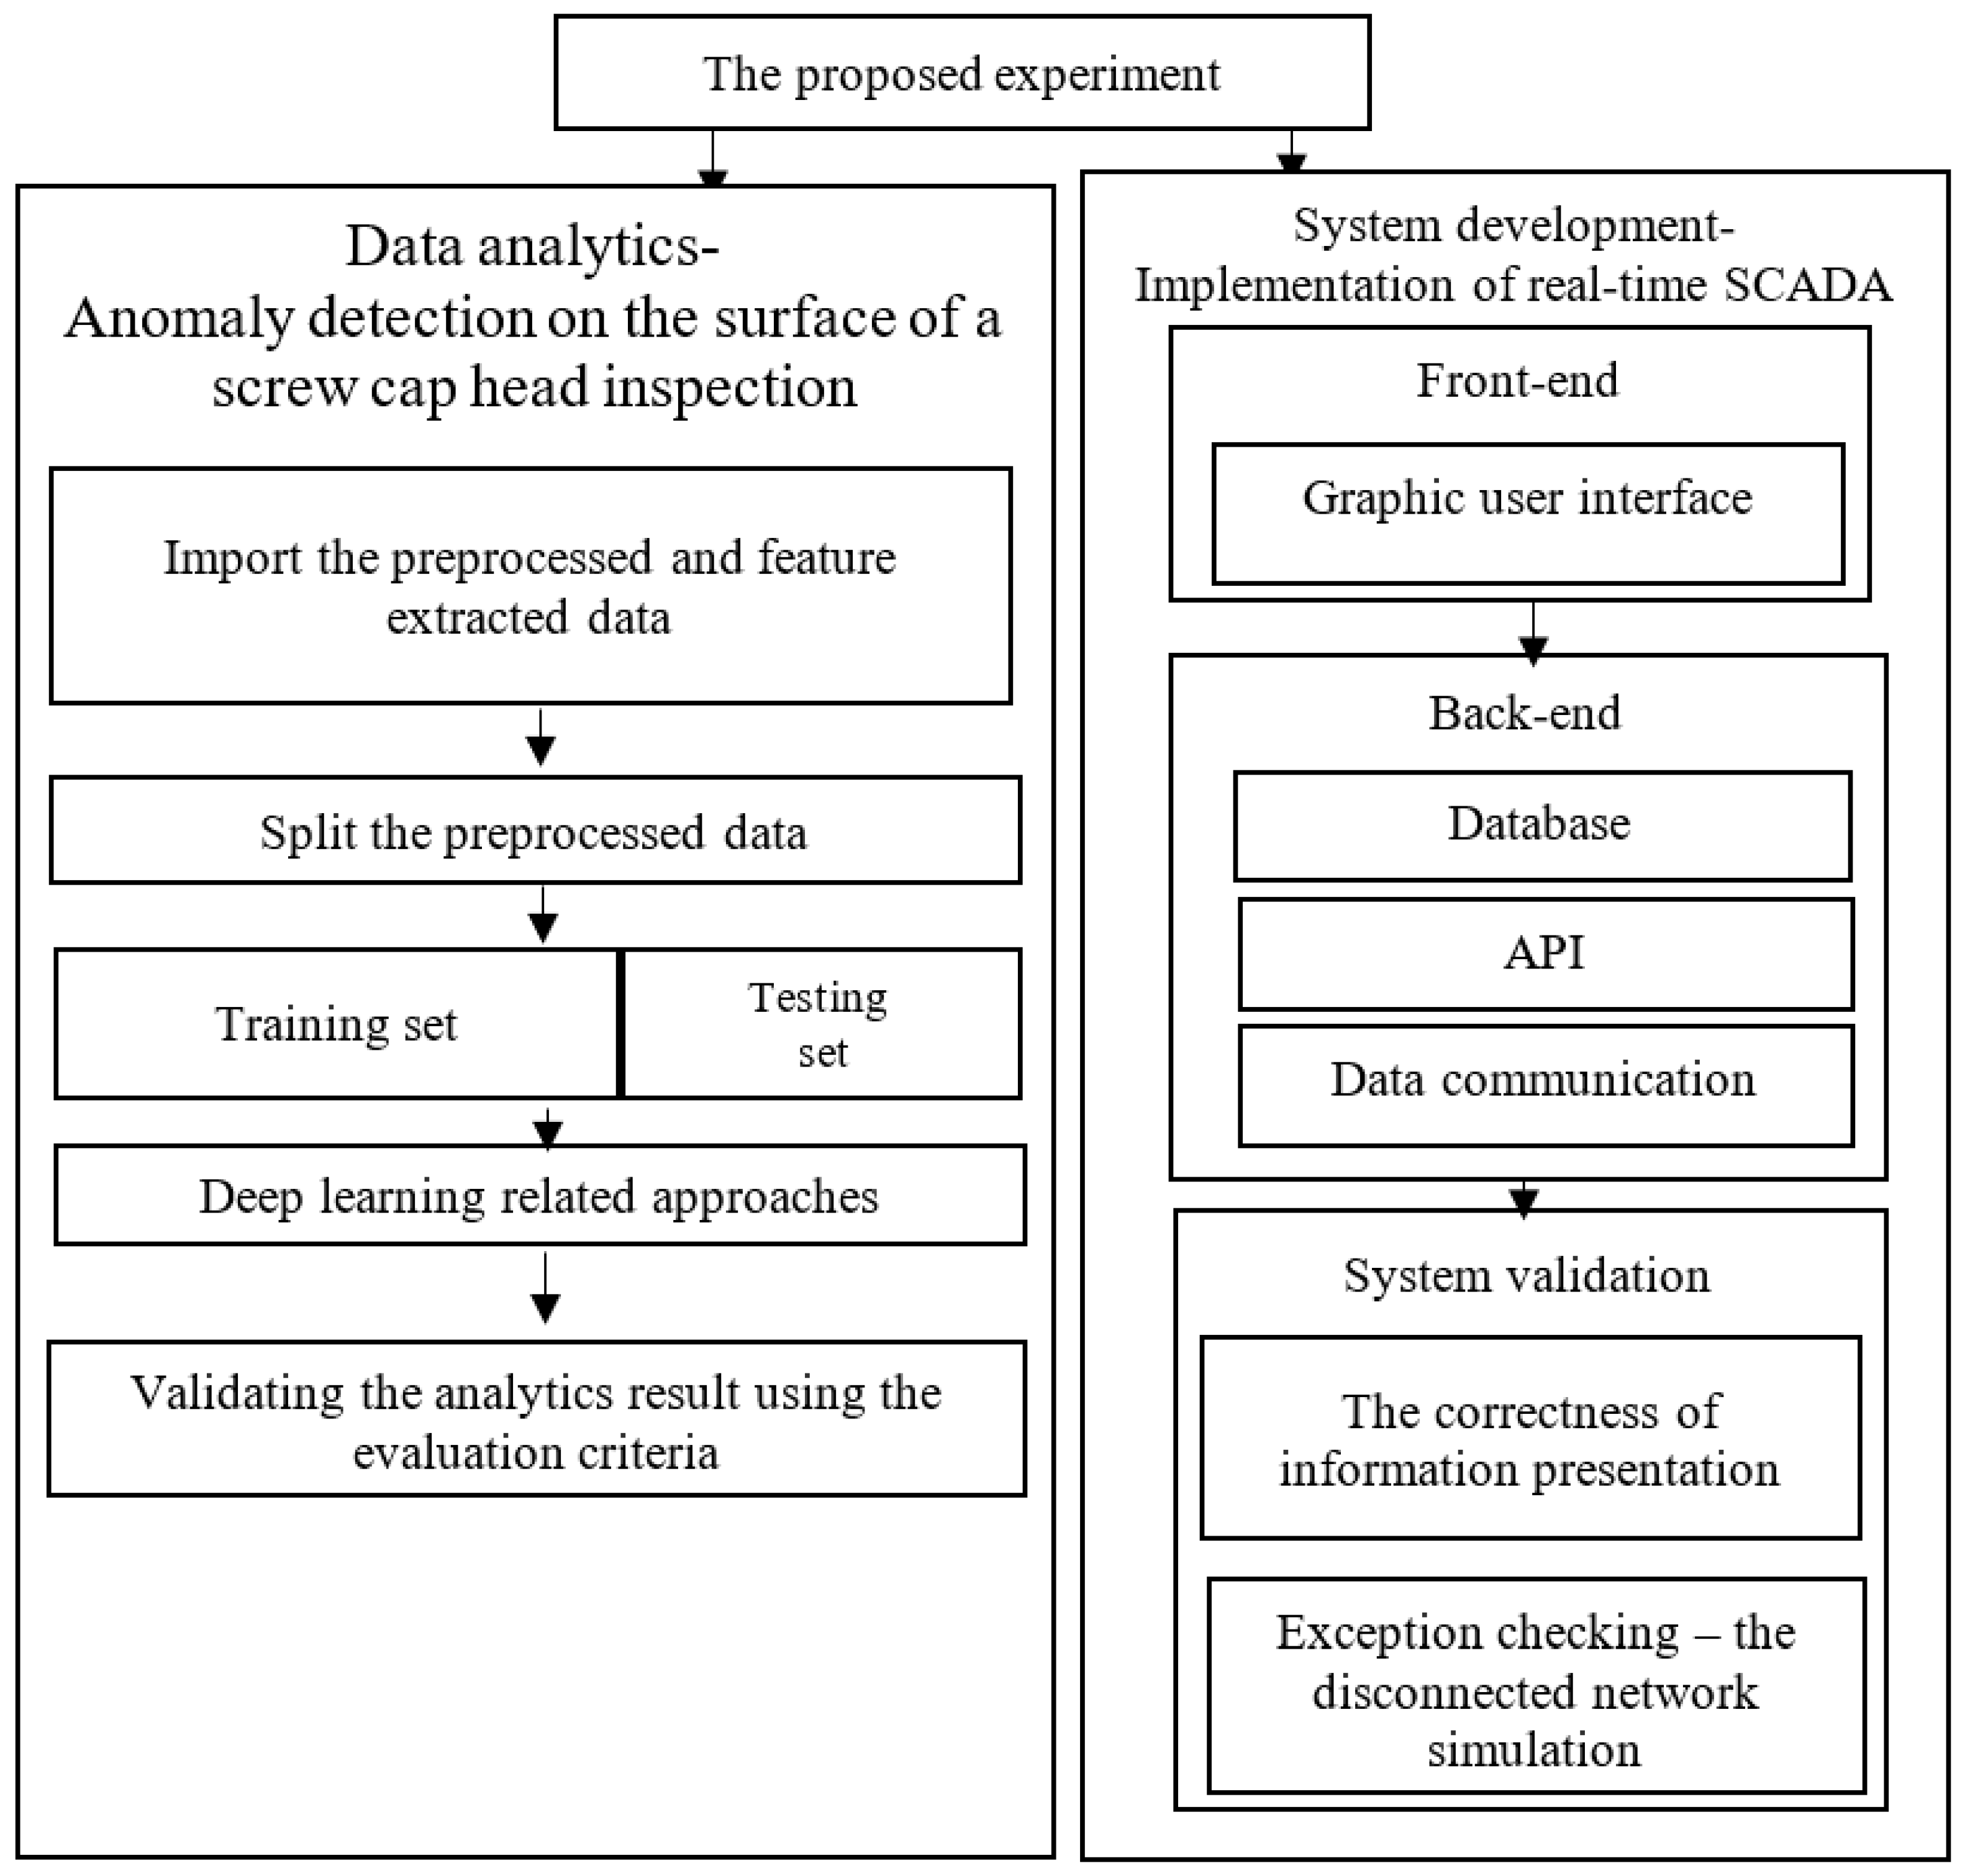
4. Experiment
4.1. Use Case
4.2. Dataset Description
4.3. Experimental Environment and Tools
5. Results
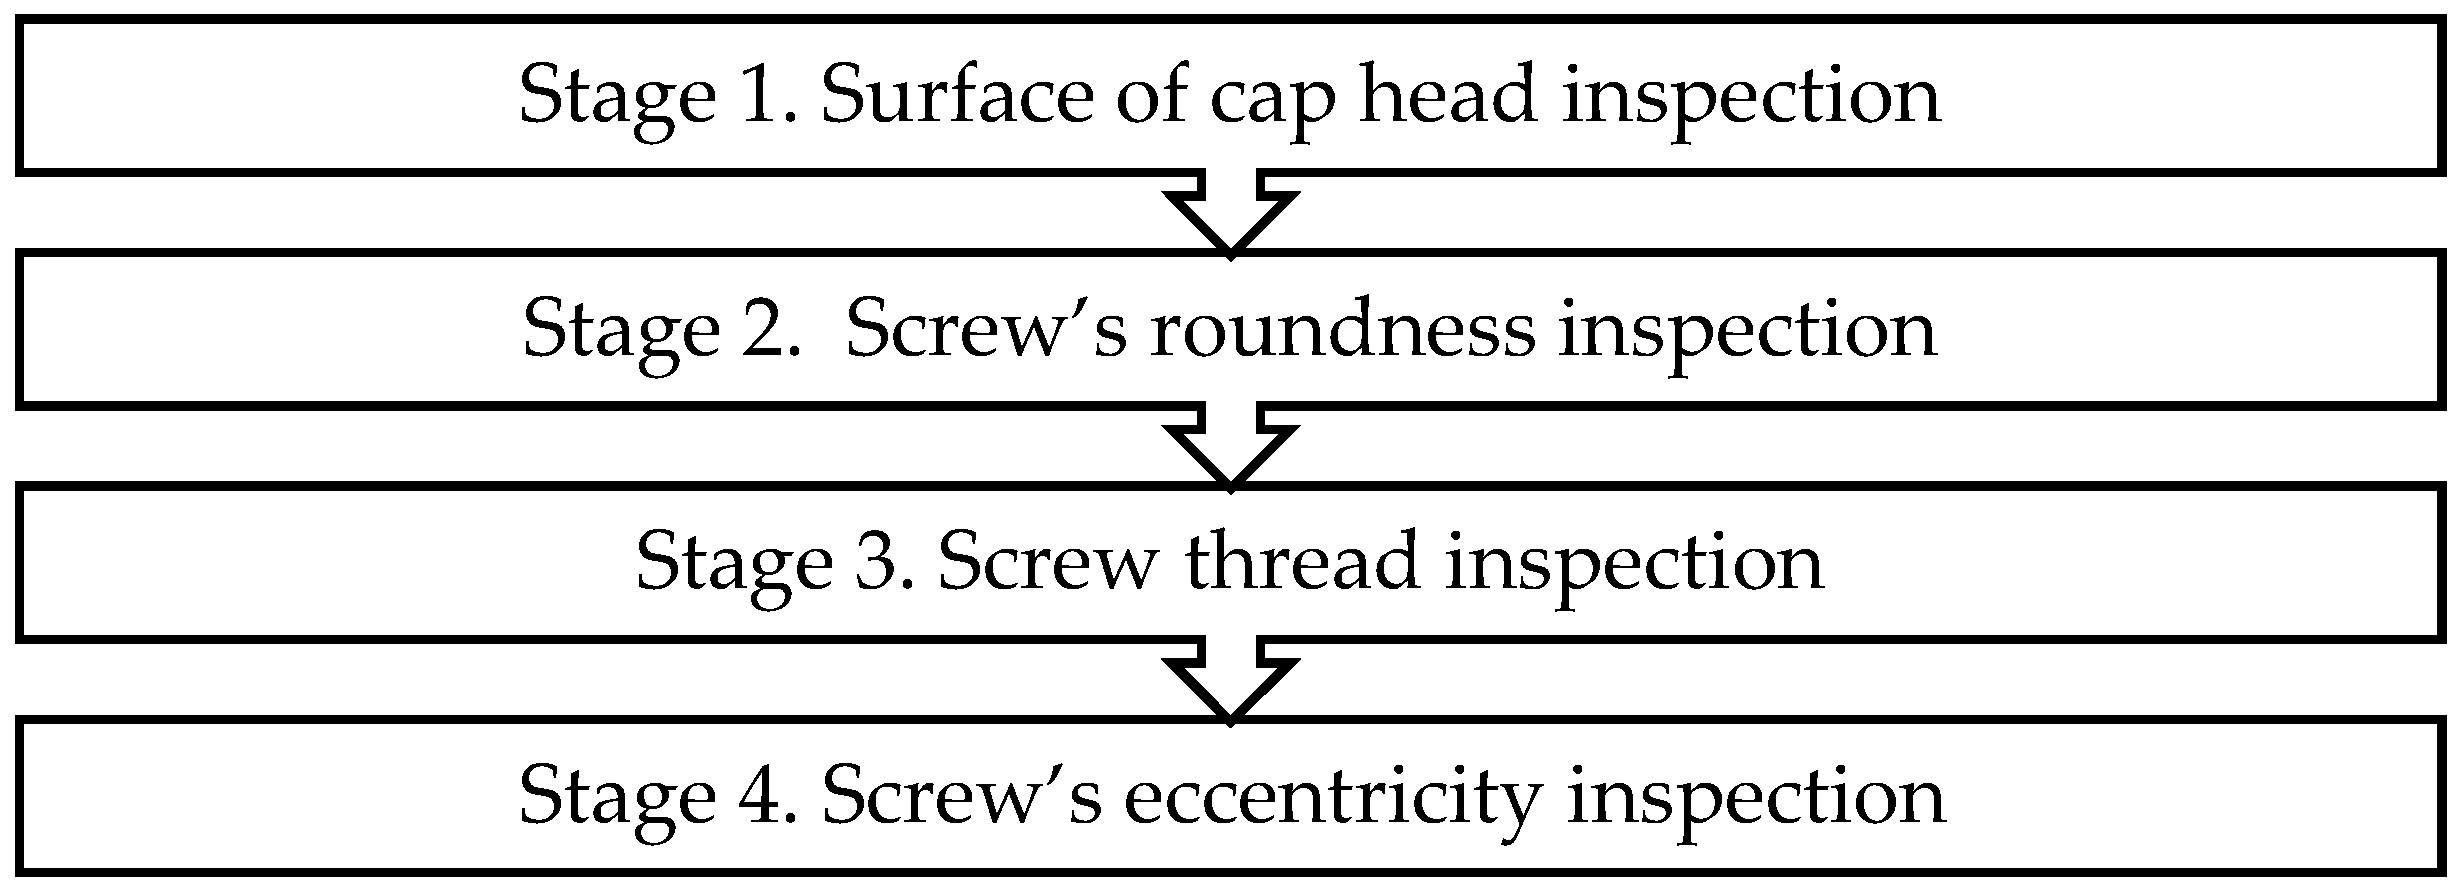
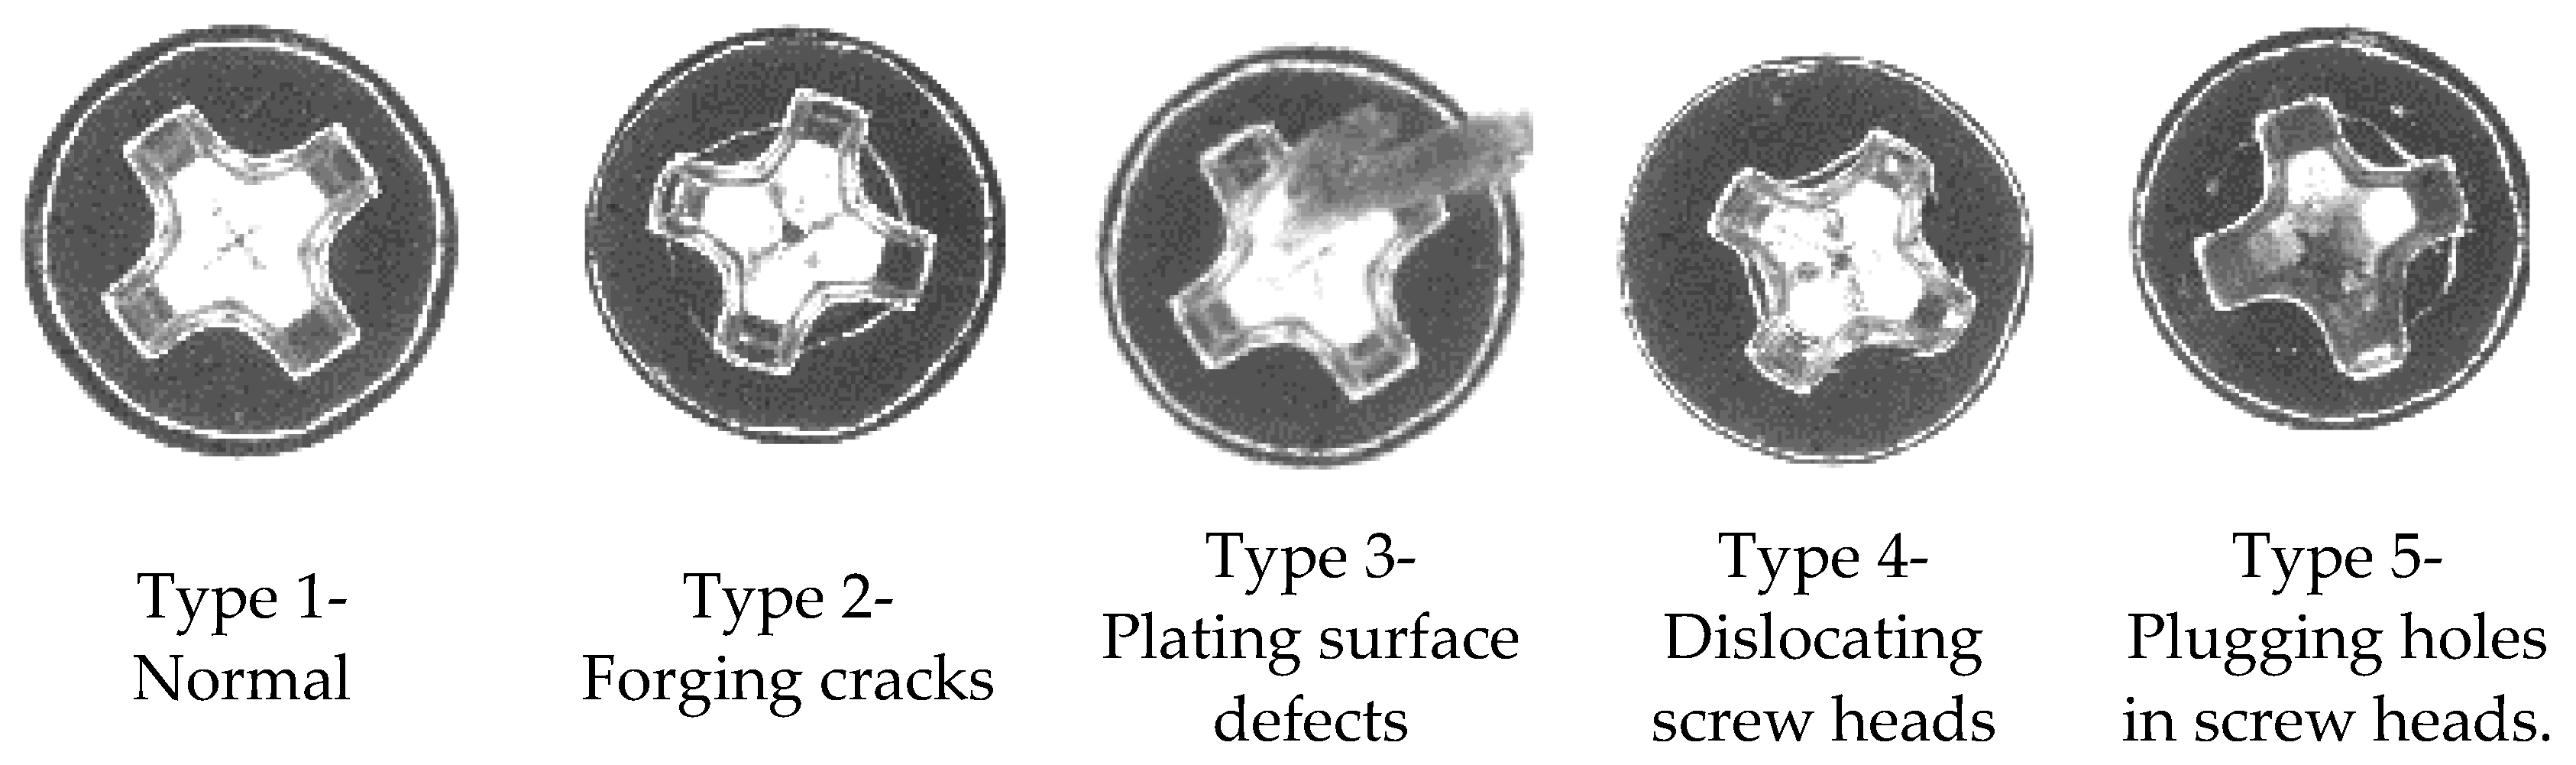
5.1. Anomaly Detection on the Surface of a Screw Cap Head during Inspections
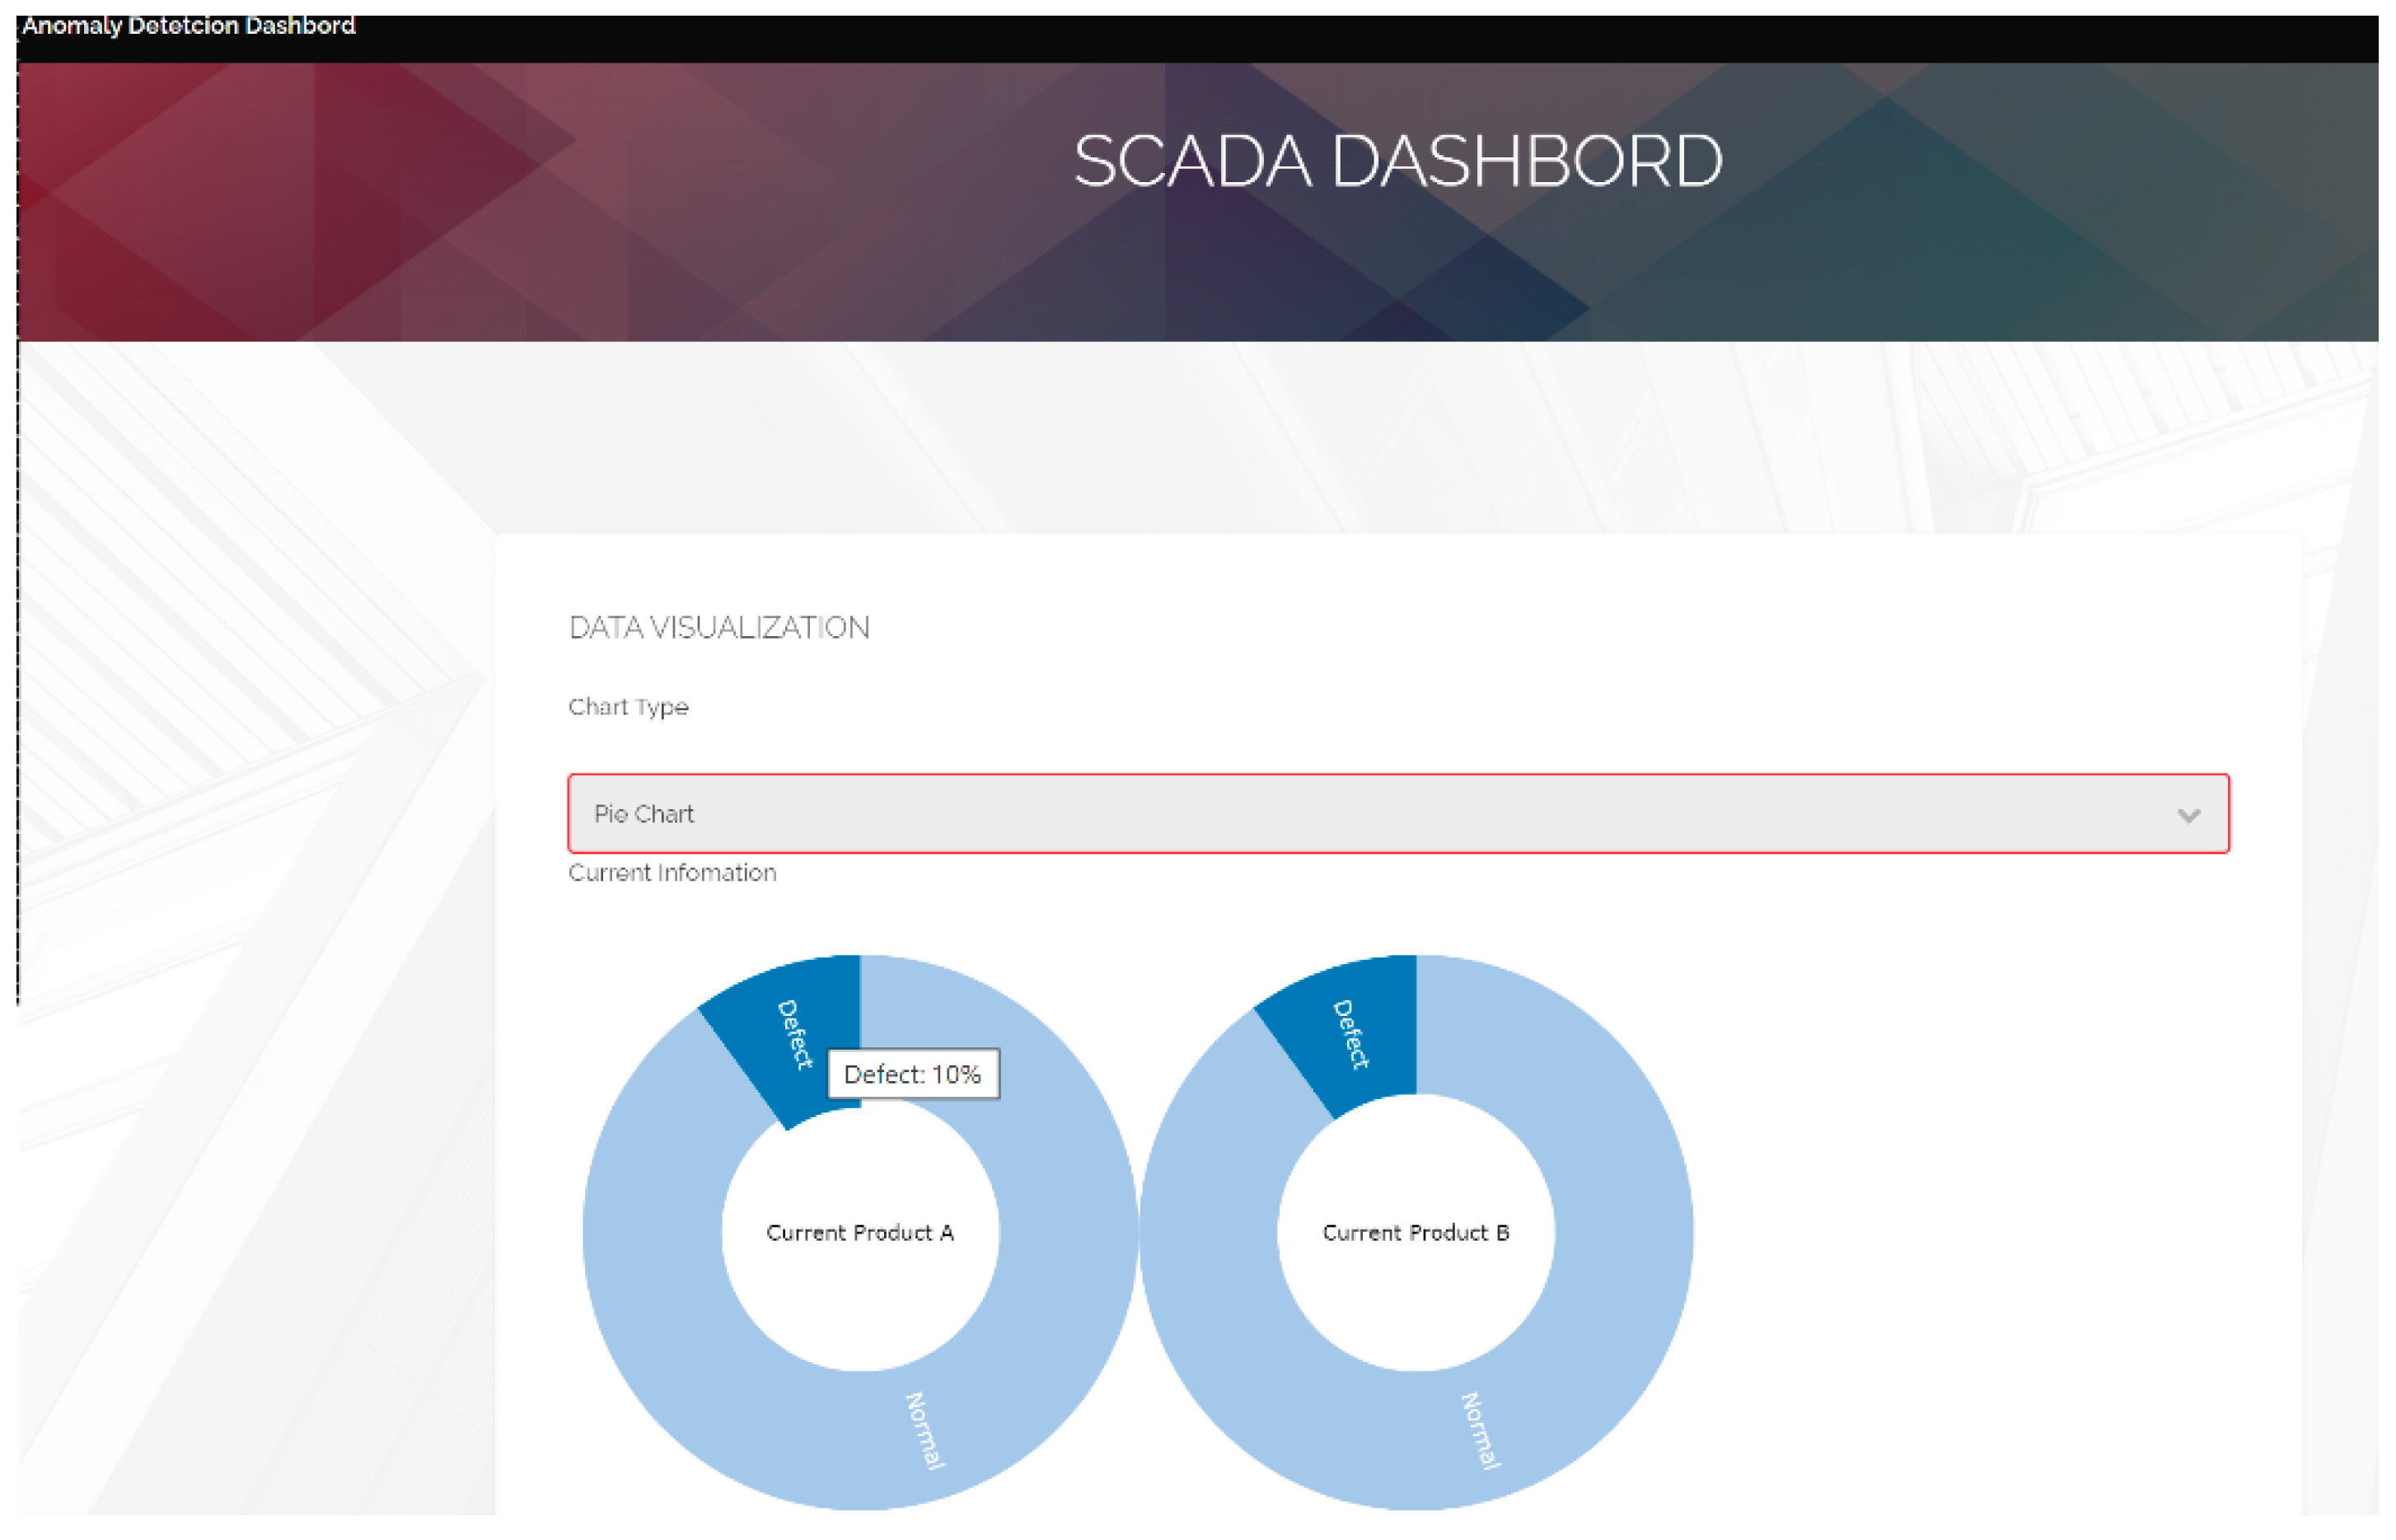
5.2. Implementation of Real-Time SCADA
6. Discussion
7. Conclusions
Funding
Institutional Review Board Statement
Informed Consent Statement
Conflicts of Interest
References
- Kamat, P.; Sugandhi, R. Anomaly detection for predictive maintenance in industry 4.0—A survey. E3S Web Conf. 2020, 170, 02007. [Google Scholar] [CrossRef]
- IBM Cloud Education. The Basics of Business Automation. IBM Official Website. Available online: https://www.ibm.com/cloud/blog/basics-of-business-automation (accessed on 12 May 2021).
- Stojanovic, L.; Dinic, M.; Stojanovic, N.; Stojadinovic, A. Big-data-driven anomaly detection in industry (4.0): An approach and a case study. In Proceedings of the 2016 IEEE International Conference on Big Data (Big Data), Washington, DC, USA, 5–8 December 2016; pp. 1647–1652. [Google Scholar]
- Winters, P.; Adae, I.; Silipo, R. Anomaly Detection in Predictive Maintenance. In Anomaly Detection with Time Series Analysis; KNIME: Zurich, Switzerland, 2014; pp. 3–9. [Google Scholar]
- Erdmann, M. Unsupervised Anomaly Detection in Sensor Data Used for Predictive Maintenance. Doctoral Dissertation, Ludwig-Maximilians-University, Munchen, Germany, 2018. [Google Scholar]
- Minarini, F. Anomaly Detection Prototype for Log-Based Predictive Maintenance at INFN-CNAF. Master’s Thesis, University of Bologna, Bologna, Italy, 2019. [Google Scholar]
- Alaoui-Belghiti, A.; Chevallier, S.; Monacelli, E. Unsupervised anomaly detection using optimal transport for predictive maintenance. In Proceedings of the International Conference on Artificial Neural Networks, Munich, Germany, 17–19 September 2019; Springer: Cham, Switzerland, 2019; pp. 686–697. [Google Scholar]
- Farbiz, F.; Miaolong, Y.; Yu, Z. A cognitive analytics based approach for machine health monitoring, anomaly detection, and predictive maintenance. In Proceedings of the 2020 15th IEEE Conference on Industrial Electronics and Applications (ICIEA), Kristiansand, Norway, 9–13 November 2020; pp. 1104–1109. [Google Scholar]
- Carrasco, J.; López, D.; Aguilera-Martos, I.; García-Gil, D.; Markova, I.; García-Barzana, M.; Herrera, F. Anomaly detection in predictive maintenance: A new evaluation framework for temporal unsupervised anomaly detection algorithms. Neurocomputing 2021, 462, 440–452. [Google Scholar] [CrossRef]
- Zhao, P.; Kurihara, M.; Tanaka, J.; Noda, T.; Chikuma, S.; Suzuki, T. Advanced correlation-based anomaly detection method for predictive maintenance. In Proceedings of the 2017 IEEE International Conference on Prognostics and Health Management (ICPHM), Dallas, TX, USA, 19–21 June 2017; pp. 78–83. [Google Scholar]
- Perini, L. Predictive Maintenance for Off-Road Vehicles Based on Hidden Markov Models and Autoencoders for Trend Anomaly Detection. Doctoral Dissertation, Politecnico di Torino University, Torino, Italy, 2019. [Google Scholar]
- Serradilla, O.; Zugasti, E.; Ramirez de Okariz, J.; Rodriguez, J.; Zurutuza, U. Adaptable and explainable predictive maintenance: Semi-supervised deep learning for anomaly detection and diagnosis in press machine data. Appl. Sci. 2021, 11, 7376. [Google Scholar] [CrossRef]
- Davari, N.; Veloso, B.; Ribeiro, R.P.; Pereira, P.M.; Gama, J. Predictive maintenance based on anomaly detection using deep learning for air production unit in the railway industry. In Proceedings of the 2021 IEEE 8th International Conference on Data Science and Advanced Analytics (DSAA), Porto, Portugal, 6–9 October 2021; pp. 1–10. [Google Scholar]
- De Benedetti, M.; Leonardi, F.; Messina, F.; Santoro, C.; Vasilakos, A. Anomaly detection and predictive maintenance for photovoltaic systems. Neurocomputing 2018, 310, 59–68. [Google Scholar] [CrossRef]
- Bose, S.K.; Kar, B.; Roy, M.; Gopalakrishnan, P.K.; Basu, A. ADEPOS: Anomaly detection based power saving for predictive maintenance using edge computing. In Proceedings of the 24th Asia and South Pacific Design Automation Conference, Tokyo, Japan, 21–24 January 2019; pp. 597–602. [Google Scholar]
- Coelho, D.; Costa, D.; Rocha, E.M.; Almeida, D.; Santos, J.P. Predictive maintenance on sensorized stamping presses by time series segmentation, anomaly detection, and classification algorithms. Procedia Comput. Sci. 2022, 200, 1184–1193. [Google Scholar] [CrossRef]
- Decker, L.; Leite, D.; Giommi, L.; Bonacorsi, D. Real-time anomaly detection in data centers for log-based predictive maintenance using an evolving fuzzy-rule-based approach. In Proceedings of the 2020 IEEE International Conference on Fuzzy Systems (FUZZ-IEEE), Glasgow, UK, 19–24 July 2020; pp. 1–8. [Google Scholar]
- Decker, L.; Leite, D.; Viola, F.; Bonacorsi, D. Comparison of evolving granular classifiers applied to anomaly detection for predictive maintenance in computing centers. In Proceedings of the 2020 IEEE Conference on Evolving and Adaptive Intelligent Systems (EAIS), Bari, Italy, 27–29 May 2020; pp. 1–8. [Google Scholar]
- Mohammadi, B.; Fathy, M.; Sabokrou, M. Image/video deep anomaly detection: A survey. arXiv 2021, arXiv:2103.01739. [Google Scholar]
- Deecke, L.; Vandermeulen, R.; Ruff, L.; Mandt, S.; Kloft, M. Image anomaly detection with generative adversarial networks. In Proceedings of the Joint European Conference on Machine Learning and Knowledge Discovery in Databases, Dublin, Ireland, 10–14 September 2018; Springer: Cham, Switzerland; pp. 3–17. [Google Scholar]
- Zhou, K.; Gao, S.; Cheng, J.; Gu, Z.; Fu, H.; Tu, Z.; Liu, J. Sparse-gan: Sparsity-constrained generative adversarial network for anomaly detection in retinal oct image. In Proceedings of the 2020 IEEE 17th International Symposium on Biomedical Imaging (ISBI), Iowa City, IA, USA, 3–7 April 2020; pp. 1227–1231. [Google Scholar]
- Haselmann, M.; Gruber, D.P.; Tabatabai, P. Anomaly detection using deep learning based image completion. In Proceedings of the 2018 17th IEEE International Conference on Machine Learning and Applications (ICMLA), Orlando, FL, USA, 17–20 December 2018; pp. 1237–1242. [Google Scholar]
- Xu, S.; Wu, H.; Bie, R. CXNet-m1: Anomaly detection on chest X-rays with image-based deep learning. IEEE Access 2018, 7, 4466–4477. [Google Scholar] [CrossRef]
- Khan, A.S.; Ahmad, Z.; Abdullah, J.; Ahmad, F. A spectrogram image-based network anomaly detection system using deep convolutional neural network. IEEE Access 2021, 9, 87079–87093. [Google Scholar] [CrossRef]
- Nguyen, B.; Feldman, A.; Bethapudi, S.; Jennings, A.; Willcocks, C.G. Unsupervised region-based anomaly detection in brain mri with adversarial image inpainting. In Proceedings of the 2021 IEEE 18th International Symposium on Biomedical Imaging (ISBI), Nice, France, 13–16 April 2021; pp. 1127–1131. [Google Scholar]
- Cozzolino, D.; Verdoliva, L. Single-image splicing localization through autoencoder-based anomaly detection. In Proceedings of the 2016 IEEE International Workshop on Information Forensics and Security (WIFS), Abu Dhabi, United Arab Emirates, 4–7 December 2016; pp. 1–6. [Google Scholar]
- Müller, R.; Ritz, F.; Illium, S.; Linnhoff-Popien, C. Acoustic anomaly detection for machine sounds based on image transfer learning. arXiv 2020, arXiv:2006.03429. [Google Scholar]
- Zhang, X.; Wen, G.; Dai, W. A tensor decomposition-based anomaly detection algorithm for hyperspectral image. IEEE Trans. Geosci. Remote Sens. 2016, 54, 5801–5820. [Google Scholar] [CrossRef]
- Ayhan, B.; Dao, M.; Kwan, C.; Chen, H.M.; Bell, J.F.; Kidd, R. A novel utilization of image registration techniques to process mastcam images in mars rover with applications to image fusion, pixel clustering, and anomaly detection. IEEE J. Sel. Top. Appl. Earth Obs. Remote Sens. 2017, 10, 4553–4564. [Google Scholar] [CrossRef]
- Zhuang, L.; Gao, L.; Zhang, B.; Fu, X.; Bioucas-Dias, J.M. Hyperspectral image denoising and anomaly detection based on low-rank and sparse representations. IEEE Trans. Geosci. Remote Sens. 2020, 60, 1–17. [Google Scholar] [CrossRef]
- Verdoja, F.; Grangetto, M. Graph Laplacian for image anomaly detection. Mach. Vis. Appl. 2020, 31, 1–16. [Google Scholar] [CrossRef] [Green Version]
- Vojir, T.; Šipka, T.; Aljundi, R.; Chumerin, N.; Reino, D.O.; Matas, J. Road anomaly detection by partial image reconstruction with segmentation coupling. In Proceedings of the IEEE/CVF International Conference on Computer Vision, Montreal, BC, Canada, 11–17 October 2021; pp. 15651–15660. [Google Scholar]
- Li, Y.; Liu, W.; Huang, Q. Traffic anomaly detection based on image descriptor in videos. Multimed. Tools Appl. 2016, 75, 2487–2505. [Google Scholar] [CrossRef]
- Wang, L.; Zhang, D.; Guo, J.; Han, Y. Image anomaly detection using normal data only by latent space resampling. Appl. Sci. 2020, 10, 8660. [Google Scholar] [CrossRef]
- Berg, A.; Ahlberg, J.; Felsberg, M. Unsupervised learning of anomaly detection from contaminated image data using simultaneous encoder training. arXiv 2019, arXiv:1905.11034. [Google Scholar]
- Chithirala, N.; Natasha, B.; Rubini, N.; Radhakrishnan, A. Weighted Mean Filter for removal of high density Salt and Pepper noise. In Proceedings of the 2016 3rd International Conference on Advanced Computing and Communication Systems (ICACCS), Coimbatore, India, 22–23 January 2016. [Google Scholar]
- Suhas, S.; Venugopal, C. MRI image preprocessing and noise removal technique using linear and nonlinear filters. In Proceedings of the 2017 International Conference on Electrical, Electronics, Communication, Computer, and Optimization Techniques (ICEECCOT), Mysuru, India, 15–16 December 2017. [Google Scholar]
- Kusnik, D.; Smolka, B. On the robust technique of mixed Gaussian and impulsive noise reduction in color digital images. In Proceedings of the 2015 6th International Conference on Information, Intelligence, Systems and Applications (IISA), Corfu, Greece, 6–8 July 2015. [Google Scholar]
- Cohen, N.; Hoshen, Y. Sub-image anomaly detection with deep pyramid correspondences. arXiv 2020, arXiv:2005.02357. [Google Scholar]
- Mishra, P.; Verk, R.; Fornasier, D.; Piciarelli, C.; Foresti, G.L. VT-ADL: A Vision Transformer Network for Image Anomaly Detection and Localization. In Proceedings of the 2021 IEEE 30th International Symposium on Industrial Electronics (ISIE), Kyoto, Japan, 20–23 June 2021; pp. 1–6. [Google Scholar]
- Mishra, P.; Piciarelli, C.; Foresti, G.L. A neural network for image anomaly detection with deep pyramidal representations and dynamic routing. Int. J. Neural Syst. 2020, 30, 2050060. [Google Scholar] [CrossRef] [PubMed]
- Papageorgiou, C.P.; Oren, M.; Poggio, T. A general framework for object detection. In Proceedings of the Sixth International Conference on Computer Vision (IEEE Cat. No. 98CH36271), Bombay, India, 7 January 1998; pp. 555–562. [Google Scholar]
- Viola, P.; Jones, M. Rapid object detection using a boosted cascade of simple features. In Proceedings of the 2001 IEEE Computer Society Conference on Computer Vision and Pattern Recognition, Kauai, HI, USA, 8–14 December 2001. [Google Scholar]
- Simonyan, K.; Zisserman, A. Very deep convolutional networks for large-scale image recognition. arXiv 2014, arXiv:1409.1556. [Google Scholar]
- Szegedy, C.; Vanhoucke, V.; Ioffe, S.; Shlens, J.; Wojna, Z. Rethinking the inception architecture for computer vision. In Proceedings of the IEEE Conference on Computer Vision and Pattern Recognition, Las Vegas, NV, USA, 27–30 June 2016; pp. 2818–2826. [Google Scholar]
- Chollet, F. Xception: Deep learning with depthwise separable convolutions. In Proceedings of the IEEE Conference on Computer Vision and Pattern Recognition, Honolulu, HI, USA, 21–26 July 2017; pp. 1251–1258. [Google Scholar]
- Filonenko, A.; Kurnianggoro, L.; Jo, K.H. Comparative study of modern convolutional neural networks for smoke detection on image data. In Proceedings of the 2017 10th International Conference on Human System Interactions (HSI), Ulsan, Korea, 17–19 July 2017; pp. 64–68. [Google Scholar]
- Antoniou, A.; Storkey, A.; Edwards, H. Data augmentation generative adversarial networks. arXiv 2017, arXiv:1711.04340. [Google Scholar]
- Constantinescu, E.C.; Udriștoiu, A.L.; Udriștoiu, Ș.C.; Iacob, A.V.; Gruionu, L.G.; Gruionu, G.; Săftoiu, A. Transfer learning with pre-trained deep convolutional neural networks for the automatic assessment of liver steatosis in ultrasound images. Med. Ultrason. 2021, 23, 135–139. [Google Scholar] [CrossRef]
- Koppikar, U.; Sujatha, C.; Patil, P.; Mudenagudi, U. Real-world anomaly detection using deep learning. In Proceedings of the International Conference on Intelligent Computing and Communication, Bengaluru, India, 7–8 June 2019; Springer: Singapore, 2019; pp. 333–342. [Google Scholar]
- Kandel, I.; Castelli, M. The effect of batch size on the generalizability of the convolutional neural networks on a histopathology dataset. ICT Express 2020, 6, 312–315. [Google Scholar] [CrossRef]


| Method | Studies |
|---|---|
| CNN | [12,13] |
| NN-related (e.g., ANN, autoencoder) | [11,14,15] |
| Machine learning | [4,5,6,7,8,9,16] |
| Data mining (correlation analysis, Markov Chain) | [10,11] |
| Mathematics (e.g., fuzzy) | [17,18] |
| Method | Studies |
|---|---|
| Generative adversarial networks (GAN) | [20,21] |
| Convolutional neural network (CNN) | [22,23,24,25] |
| Neural networks (NN)-related | [26,27] |
| Image process technologies | [28,29,30,31,32] |
| Mathematics | [33,34] |
| Topic | Message |
|---|---|
| iot/temp/factory | “device” { defectiveProductCount: number} |
| iot/defectedProductCount/{inspection_stage} | “product” { name: “product name,” defectedTypeNo.: 1, count: number } |
| iot/anomalyReport/{inspection_stage} | “header” { rptname: “anomaly detection report,” reportTime: timeStamp } “report body” { “ product” { alarmThrehold, name: “product name,” defectedTypeNo.: 1, count: number, imageSrc:[image1Url, image2Url…] } “productionOwner” { name:” employee’s name,” empId:” employee’s id,” email:” employee’s email,” phone:” employee’s phone,” } }, “footer” { otherNotification:discription } |
| iot/anomalyBotConnect/{inspection_stage} | “botInfo” { accessToken: “anomaly detection report,” userId: timeStamp } “message body” { “ product” { alarmThrehold: number, name: “product name,” defectedTypeNo.: 1, count: number, description: other notification information } } |
| The Analytics Target | Manufacturing Process Stage | Description | Total Instances | Training Batch Size | Test Size |
|---|---|---|---|---|---|
| The five defection types | The surface of the cap head | Data with different image features for each instance | 5500 | 1000 2000 3000 4000 5000 | 500 |
| Main Part | Specification |
|---|---|
| Central processing unit | AMD (8-Core) (4.7 G) |
| Main board | Asus TUF X570-PLUS(ATX) |
| Random access memory | Kingston (128 GB) |
| Hard disk | WD SN750SE 500G/Gen4 |
| Graphics processing unit | NVIDIA RTX3080-10G |
| Power supply unit | Asus ROG STRIX (1000 W) |
| Training Data Size | 1000 200 each type | 2000 400 each type | 3000 600 each type | 4000 800 each type | 5000 1000 each type |
|---|---|---|---|---|---|
| Avg. accuracy | 0.899 | 0.920 | 0.924 | 0.944 | 0.949 |
| Avg. precision | 0.908 | 0.930 | 0.924 | 0.950 | 0.954 |
| Avg. recall rate | 0.900 | 0.920 | 0.924 | 0.944 | 0.950 |
| Avg. F1-score | 0.896 | 0.918 | 0.924 | 0.944 | 0.950 |
| Training Data Size | 1000 200 each type | 2000 400 each type | 3000 600 each type | 4000 800 each type | 5000 1000 each type |
|---|---|---|---|---|---|
| Avg. accuracy | 0.928 | 0.930 | 0.932 | 0.958 | 0.960 |
| Avg. precision | 0.936 | 0.936 | 0.936 | 0.960 | 0.962 |
| Avg. recall rate | 0.928 | 0.930 | 0.932 | 0.958 | 0.960 |
| Avg. F1-score | 0.926 | 0.928 | 0.932 | 0.960 | 0.960 |
| Training Data Size | 1000 200 each type | 2000 400 each type | 3000 600 each type | 4000 800 each type | 5000 1000 each type |
|---|---|---|---|---|---|
| Avg. accuracy | 0.926 | 0.922 | 0.930 | 0.956 | 0.958 |
| Avg. precision | 0.938 | 0.934 | 0.934 | 0.960 | 0.962 |
| Avg. recall rate | 0.926 | 0.922 | 0.930 | 0.956 | 0.958 |
| Avg. F1-score | 0.926 | 0.922 | 0.930 | 0.956 | 0.960 |
Publisher’s Note: MDPI stays neutral with regard to jurisdictional claims in published maps and institutional affiliations. |
© 2022 by the author. Licensee MDPI, Basel, Switzerland. This article is an open access article distributed under the terms and conditions of the Creative Commons Attribution (CC BY) license (https://creativecommons.org/licenses/by/4.0/).
Share and Cite
Hung, Y.-H. Developing an Anomaly Detection System for Automatic Defective Products’ Inspection. Processes 2022, 10, 1476. https://doi.org/10.3390/pr10081476
Hung Y-H. Developing an Anomaly Detection System for Automatic Defective Products’ Inspection. Processes. 2022; 10(8):1476. https://doi.org/10.3390/pr10081476
Chicago/Turabian StyleHung, Yu-Hsin. 2022. "Developing an Anomaly Detection System for Automatic Defective Products’ Inspection" Processes 10, no. 8: 1476. https://doi.org/10.3390/pr10081476
APA StyleHung, Y.-H. (2022). Developing an Anomaly Detection System for Automatic Defective Products’ Inspection. Processes, 10(8), 1476. https://doi.org/10.3390/pr10081476