Article

Evaluating Indoor Carbon Dioxide Concentration and Ventilation Rate of Research Student Offices in Chinese Universities: A Case Study

School of Civil Engineering, Zhengzhou University, Zhengzhou 450001, China
*
Author to whom correspondence should be addressed.
Processes 2022, 10(8), 1434; https://doi.org/10.3390/pr10081434
Submission received: 27 June 2022 / Revised: 16 July 2022 / Accepted: 19 July 2022 / Published: 22 July 2022
(This article belongs to the Special Issue Application of Data-Driven Method for HVAC System)

Abstract

:
This work provides a case study on the indoor environment and ventilation rate of naturally ventilated research student rooms in Chinese universities. In the measured room, air temperature, relative humidity and carbon dioxide (CO2) concentration were monitored during the heating period for 4 weeks. The number of indoor occupants, occupied time of the room and window/door-opening cases were simultaneously recorded. Results showed the research student room was occupied for an average of 12.0 h each day. Due to a large indoor and outdoor temperature difference during the heating season, and occupants’ adaption to indoor environment, indoor occupants seldom open windows/doors for ventilation. Air exchange of the room only by air infiltration cannot meet the ventilation requirement. As a result, an average of 77.6% of measured CO2 data each day exceeded 1000 ppm during occupied time. In fact, according to CO2 data, it was observed that window/door opening could effectively decrease indoor CO2 concentration. Therefore, intermittent window/door opening or CO2-based demand-controlled ventilation facilities were suggested for improving indoor air quality of such rooms. Additionally, special attention should be paid to other possible outdoor pollution.

1. Introduction

Since entering the new century, China’s higher education has achieved a leapfrog in development. According to China’s statistics yearbook 2021 released by the National Bureau of Statistics of China [1], in 2020 there were about 36 million students in colleges or universities, and the student population was the largest in the world. For these students, almost all of their time was spent in university buildings, including classrooms, dormitories and other possible rooms (e.g., laboratory, library and lecture hall). Indoor air quality (IAQ) inside these rooms is one of the key issues for a pleasant stay for students. However, these rooms usually present a high occupancy rate; as a result, ventilation of these rooms is generally insufficient. A few published studies have confirmed this point. Regarding classrooms, Sarbu et al. measured indoor carbon dioxide (CO2) levels in two air conditioned classrooms at a university in the west of Romania during both cooling and heating seasons [2]. Results indicated that indoor CO2 concentration could reach a value of 2400 ppm in the case of inadequate ventilation. In addition, the CO2 concentration could decrease significantly to 1500 ppm by manually opening the windows. Chang et al. evaluated IAQ in two computer classrooms and one general classroom in a southern Taiwan college, and indicated that low ventilation rates were likely responsible for the very high indoor CO2 concentration [3]. By measuring and comparing IAQ in 15 classrooms in Brazilian universities, Jurado et al. found that the CO2 level in the air-conditioned rooms was significantly higher than that in naturally ventilated rooms [4]. Asif et al. investigated the IAQ and thermal comfort in classrooms of four buildings of an educational institute and found that indoor CO2 concentration in naturally ventilated classrooms exceeded safe levels at higher frequency [5]. Argunhan and Avci measured indoor temperature, relative humidity (RH) and IAQ of the classrooms in universities in Turkey and found that average indoor CO2 level is higher than the ASHRAE standards, due to closed doors and windows in winters [6]. With regard to college student dormitories, Li et al. tested indoor CO2 concentration in naturally ventilated student dormitories in a college in Beijing, China and showed that indoor CO2 concentration most of the time exceeded the referenced guideline of 1000 ppm provided by IAQ standard [7], due to the low ventilation rate of the dormitories by air infiltration. However, through single-sided natural ventilation, sufficient outdoor air could be provided to dilute the indoor CO2. Zhang et al. monitored indoor CO2 concentration in three selected rooms of university dormitory buildings in winter in Shanghai, China and found that the occupants tended to close the windows to maintain an indoor thermal environment in winter, thereby resulting in elevated CO2 concentrations during sleeping hours [8]. The above literature review indicated that ventilation in these university rooms was insufficient, even in developed countries. Furthermore, IAQ of other rooms such as libraries [9], lecture rooms [10,11], and research laboratories [12,13] in university buildings was also studied by some researchers.
As a matter of fact, in university buildings, there is also another type of room, namely the research student room. A research student room is often the place where postgraduate students carry out scientific research and administrative work in universities. Figure 1 shows indoor views of several typical research student offices in some universities of China. In recent years, due to a sharp increase in the number of postgraduate students in China, these rooms present a much higher occupancy rate than other offices in general office buildings. Additionally, these rooms usually have no fresh air unit in Chinese universities. For these rooms, the most effective ways to provide necessary outdoor fresh air are usually natural ventilation, which refers to air change through the intentional openings of building envelopes (windows/doors); and air infiltration, which refers to the air change through unintentional leakage areas of building envelopes when the doors and windows are closed [14]. In fact, in China most research student rooms in universities are not originally designed for high occupancy rates. Instead, with a rapidly increasing population of postgraduates in universities, some unoccupied rooms in universities have to be used as research student rooms. This inconsistency between design and utilization of the room is bound to bring about poor IAQ.
To date, however, indoor environment, ventilation rate and occupancy characteristics of such rooms in Chinese universities are rarely investigated. How about the indoor environment in such rooms? Can natural ventilation meet the requirements of postgraduate students? How to improve the ventilation rate of such rooms?
With these questions, a case study on naturally ventilated research student rooms in Chinese university is provided in the present paper. We selected a representative research student room with a high occupancy density in a university of China as the measured room and monitored indoor environmental parameters (including temperature, relative humidity and CO2 concentration) for four weeks during the heating period. At the same time, occupied and unoccupied profiles of the room and open/closed cases of the windows/doors were recorded. Based on CO2 measurement data and occupancy profile of the room, indoor environment and ventilation rate of the room were assessed. The results would be instructive to improve Chinese research students’ studying environment and to improve the ventilation rate of such rooms.

2. Materials and Methods

2.1. Description of the Measured Room

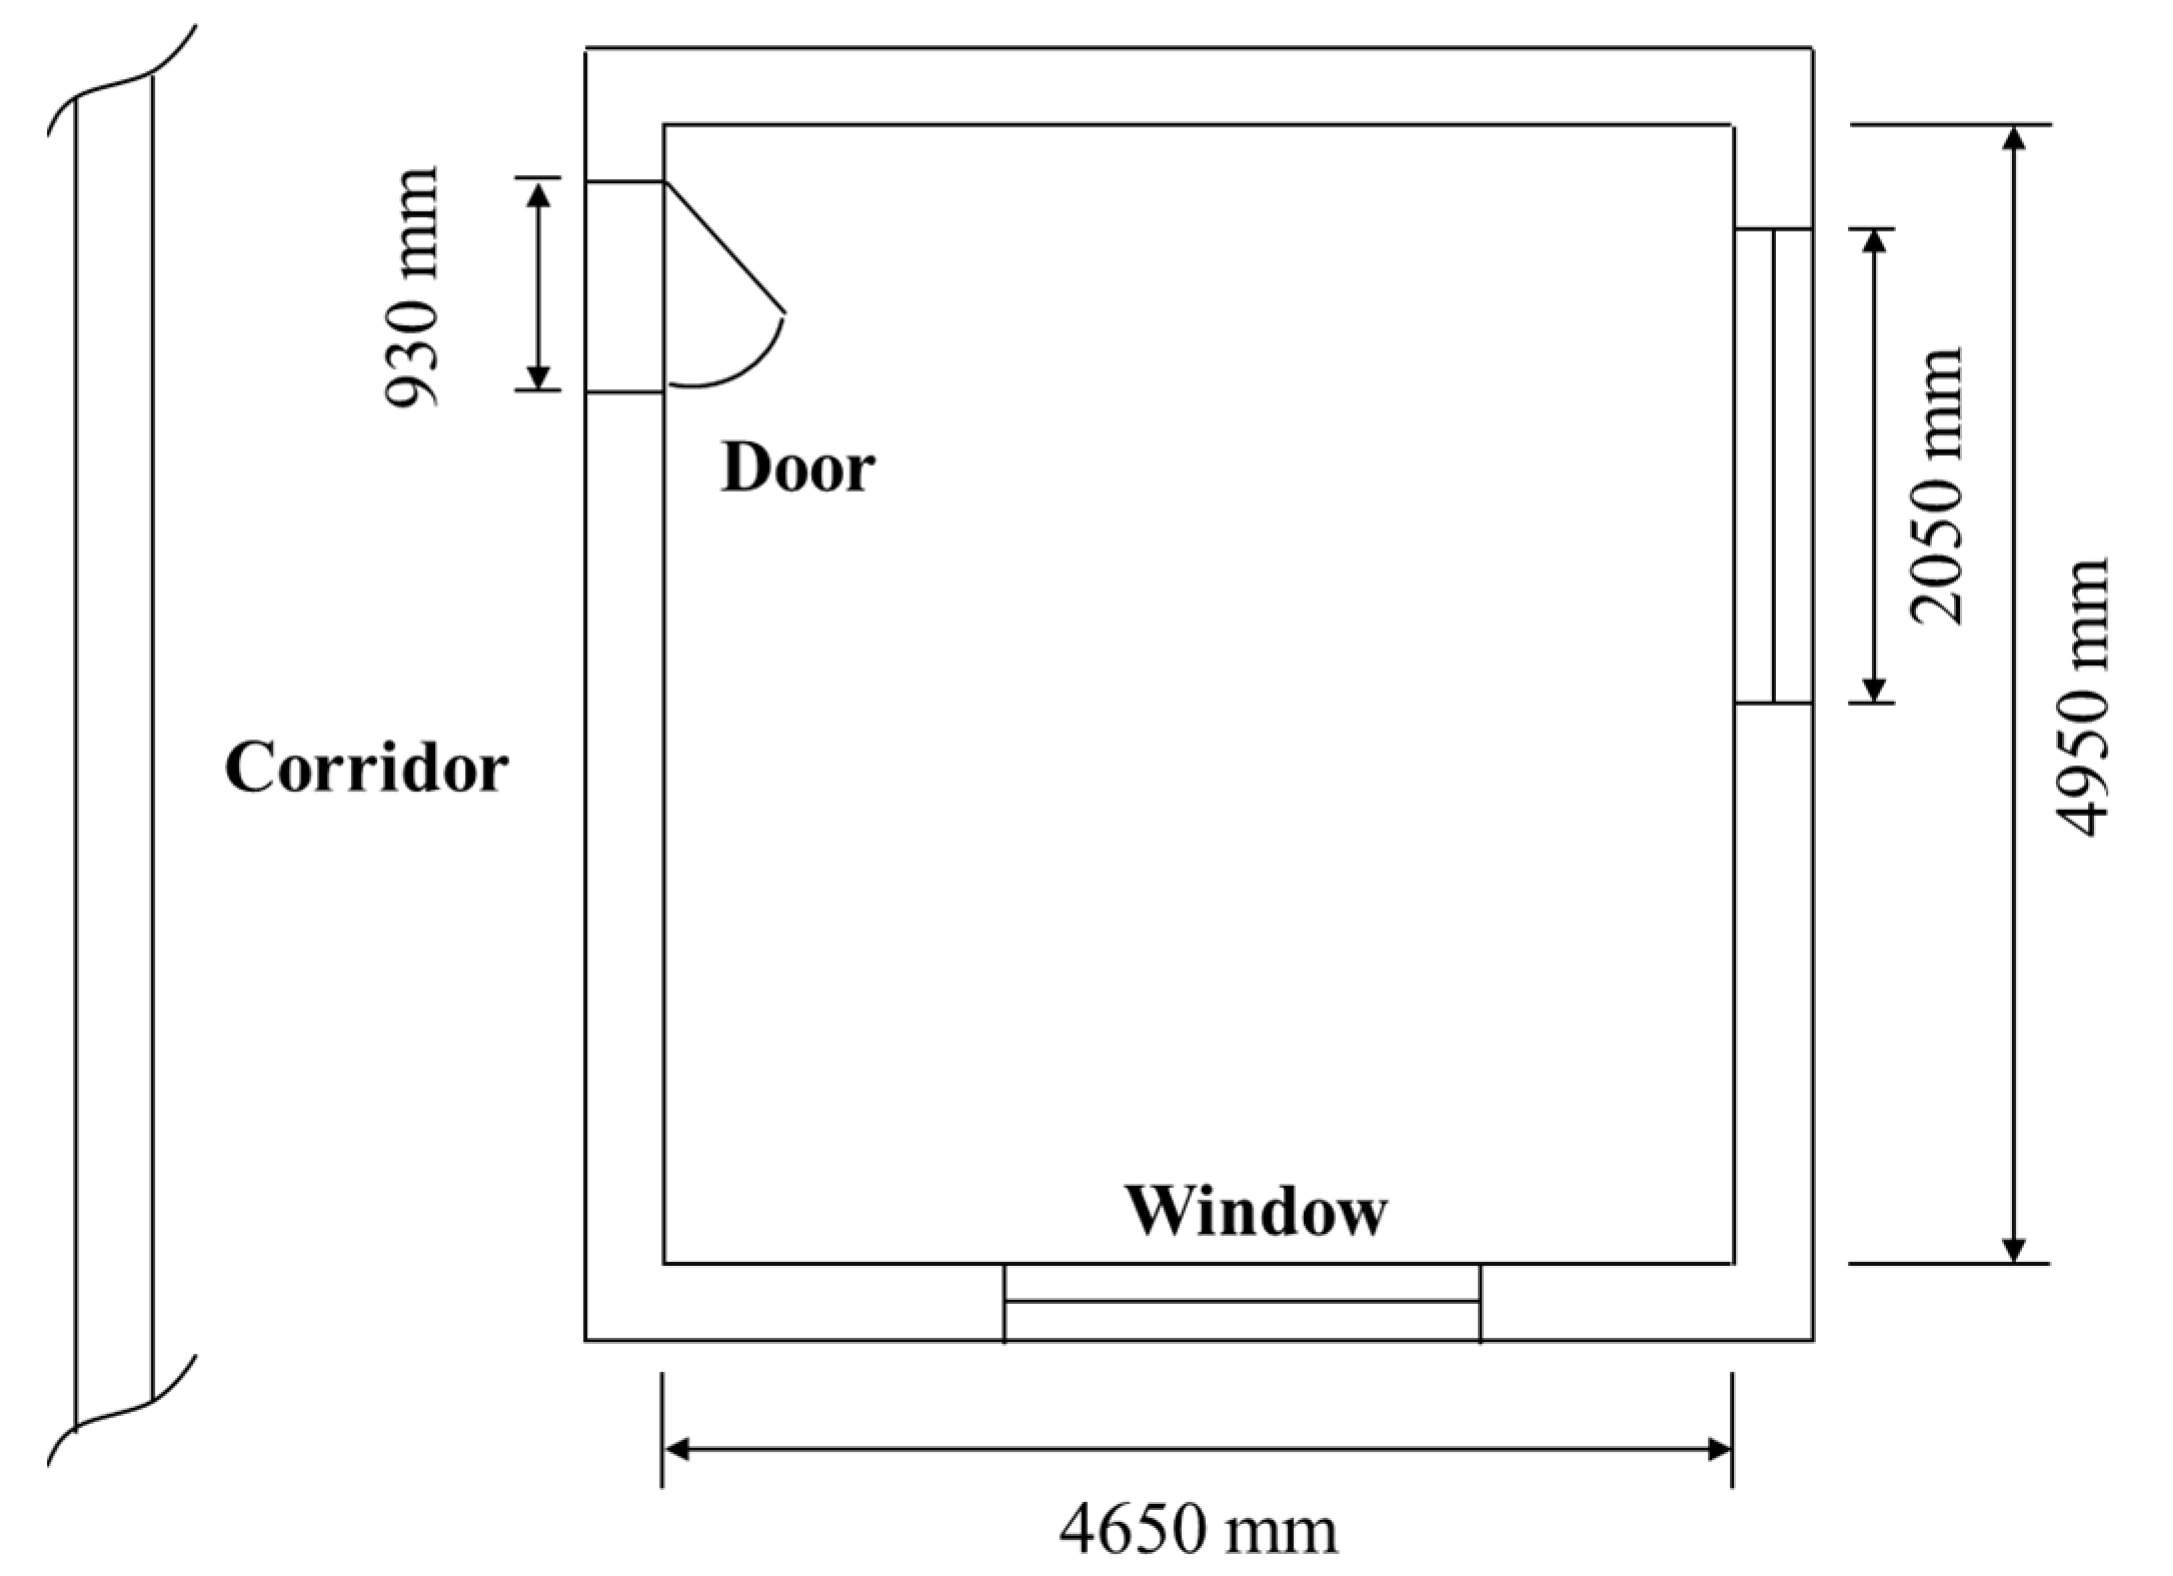
In this study, a representative research student room in a university of Beijing (latitude: 39°54′ N, longitude: 116°23′ E) was selected as the measured room. The room is on the second floor of a five–story university building, as shown in Figure 2. The five-story university building was built in the 1980s and is close to the urban main road. The layout of the measured room is given in Figure 3. The room has a height of 2.8 m and a floor area of 23 m2. In addition, the room has a door, which is set into the corridor. The fully opened door has an area of 1.8 m2. There are two in-swinging casement windows, which are located at a height of 0.9 m above the floor. Each window comprises two window sashes. Each fully opened window sash has an area of 0.55 m2, as shown in Figure 4. There is no air supply system in the room. Beijing is located in the cold region; in winter, there are three months during which the monthly mean temperature is below 0 °C. Due to low outdoor air temperature, building heating is imperative for occupants’ thermal comfort in winter. Accordingly, central heating system is used in this room in winter. In general, seven postgraduate students work in this room. During monitoring period, however, one of the postgraduates was not staying in the room. Thus, the room was generally occupied with six postgraduate students during measuring period. The details of the occupancy characteristics of the room are described in the Results, Section 3.3.

2.2. Measuring Process

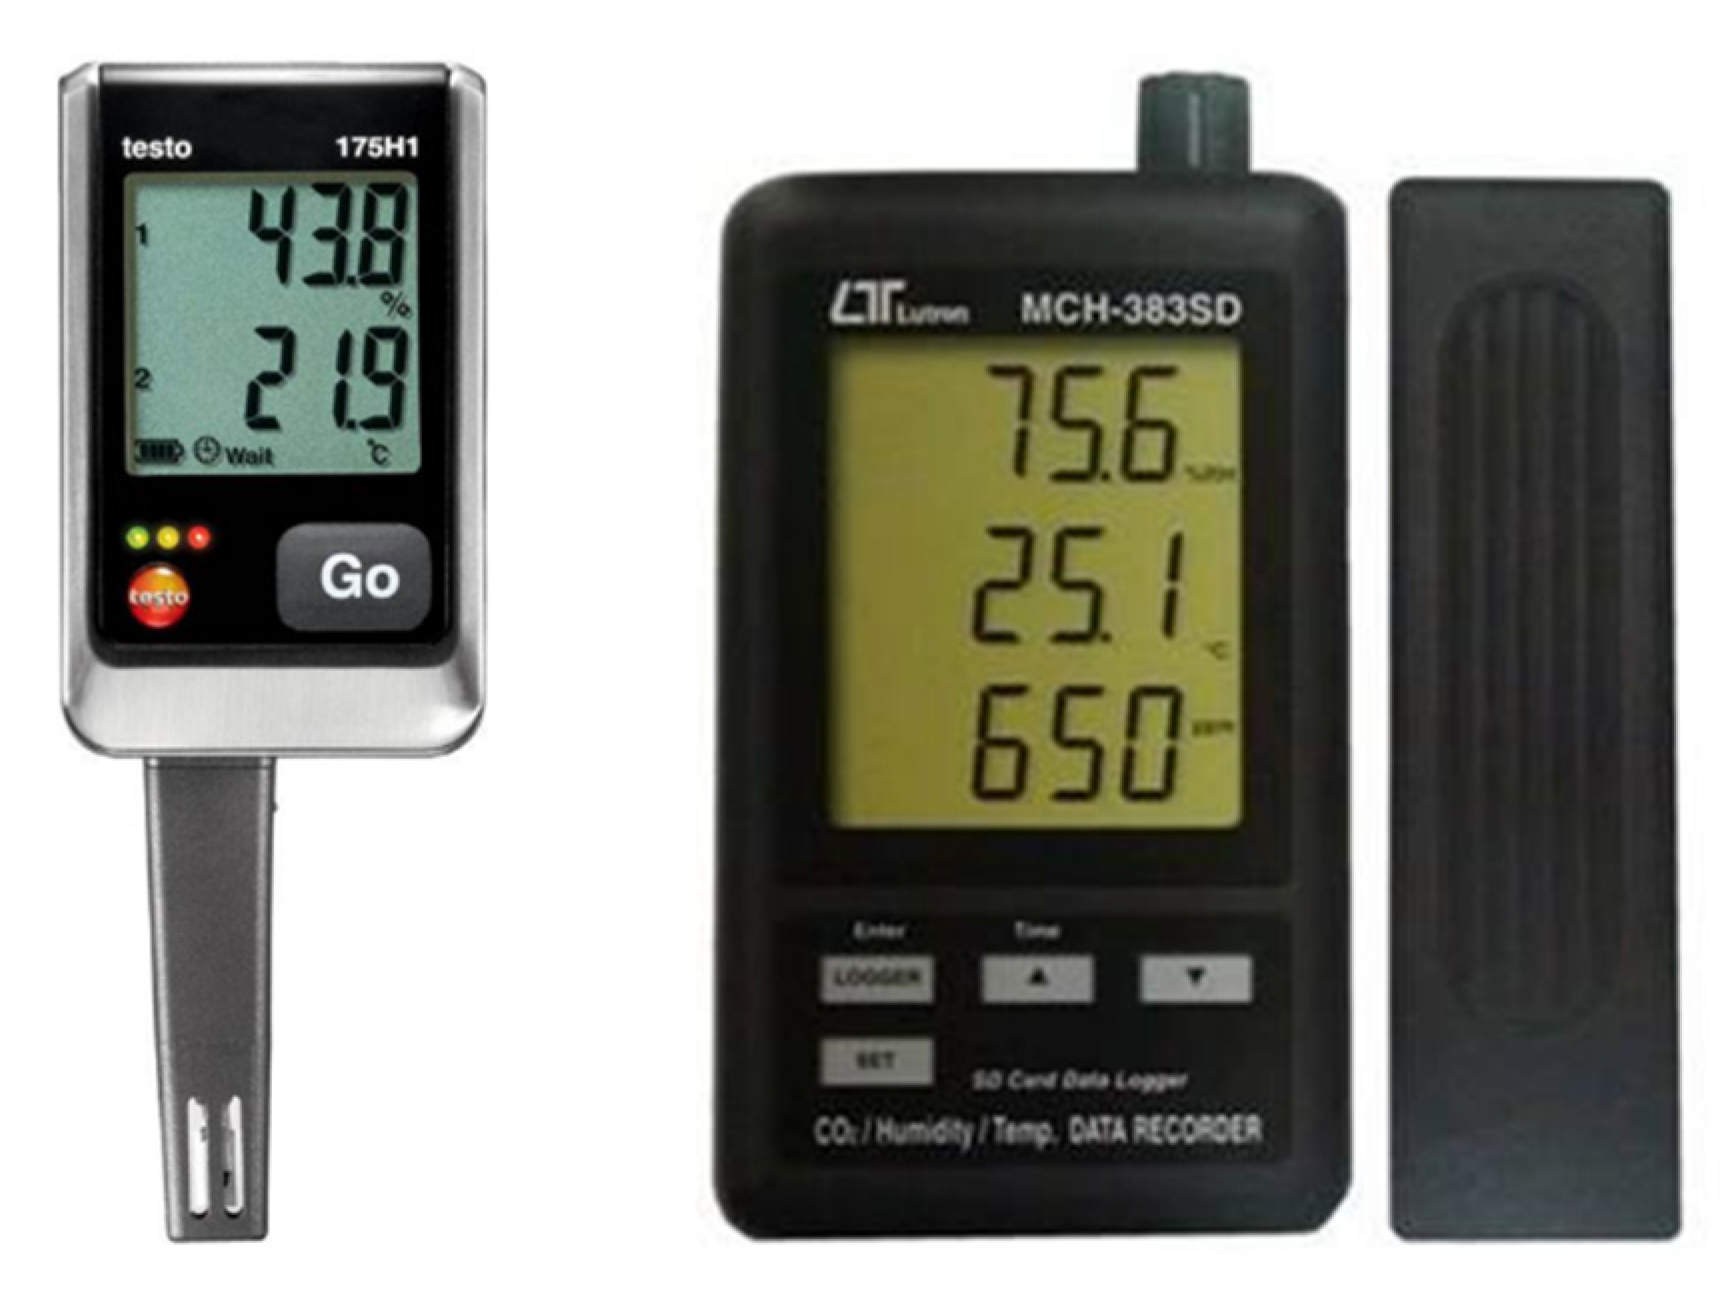
The measurement was conducted in the research student room for 4 weeks during the typical heating period. Measured parameters included air temperature, RH and CO2 concentration. Considering probably inadequate full mixing of indoor air, two sets of equipment were placed in the room. The data loggers (Testo 175H1, shown in Figure 5) with temperature and humidity sensors were used to monitor indoor air temperature and RH. Outdoor meteorological data were recorded by a small-sized automatic weather station. Indoor and outdoor CO2 concentration were monitored using data loggers with CO2 sensor (MCH–383SD, shown in Figure 5). The CO2 data loggers were installed on the convenient position to avoid the influence of the occupants’ exhalation. The locations of all used instruments were at the height of 1.3 m (the breathing zone of a seated postgraduate) above the floor level, away from the windows and door. These instruments recorded data at an interval of 5 min. Table 1 summarizes the test range and accuracy of the instruments used in the current study. Furthermore, the postgraduates were asked to complete a Room Occupation Log Sheet so that the number of occupants, occupied and unoccupied periods of the room and open/closed cases of the windows/door were clarified.

2.3. Calculation of Ventilation Rate

There are many studies using exhaled CO2 as a tracer gas to evaluate the ventilation rate [15,16]. In this study, a 24-hour day is split into occupied period when postgraduate is present during daylight and unoccupied period when postgraduate is absent during nighttime. Postgraduates can generate CO2 into the room when they are present. During unoccupied period, there is no indoor source of CO2, so air exchange rate (AER) of the room by air infiltration can be evaluated using CO2 decay method. The tracer-gas method is based on the principle of mass balance in a designated room and the assumption of uniform distribution of indoor air. The tracer-gas mass-balance equation can be expressed as [7]:
V   d ( C i n t ) d t = Q C o u t t C i n t
where V is room volume (m3), t is the time (h), C i n t is indoor CO2 concentration at time t (m3/m3), Q is volumetric airflow rate into (and out of) the space (m3/h), C o u t t is outdoor CO2 concentration (m3/m3).
If Q is assumed, and C o u t t is constant, Equation (1) can be integrated to obtain the following equation for C i n t :
C i n t = C o u t t + C i n 0 C o u t t e N t
where C i n 0 is the indoor CO2 concentration at time t = 0, N = Q / V is AER.
If air exchange rate (i.e., N ) is given a value (adjustable variable parameter) and outdoor CO2 concentration (i.e., C o u t t ) is given a constant parameter, a series of theoretical concentrations C i n t , can be calculated at the end of each time interval by Equation (2). Then, the difference between the measured and theoretical values is calculated by the least-squares method:
E r r o r = 1 n C i n , t n C i n , m n 2
where n is the number of measured concentrations, C i n , t n and C i n , m n is the computed concentration and measured concentration at the end of the n th time interval, respectively. Finally, air exchange rate is fitted out by obtaining theoretical concentration close to the measured concentration.

2.4. Model for Human CO2 Generation Rate

To analyze the association among CO2 concentration, occupancy rate and air change rate, CO2 generation rate from human respiration needs to be calculated. According to ASHRAE Handbook Fundamentals [17], an empirical formula to calculate CO2 generation rate can be expressed as follows:
V C O 2 = R Q · 0.55887 W 0.425 H 0.725 M 0.23 R Q + 0.77
where R Q is the respiratory quotient, volumetric ratio of CO2 produced to oxygen (O2) consumed, dimensionless; a good estimate for the average adult is R Q   = 0.83 for light or sedentary activities ( M < 1.5 met), 1met = 58.1 W/m2. M is the metabolic rate, W/m2, depending on the level of physical activity, M =1.2 for occupant working in research student room; W   is the body weight (kg); H is the body height (m).

3. Results

3.1. Long-Term Monitoring CO2 Concentration

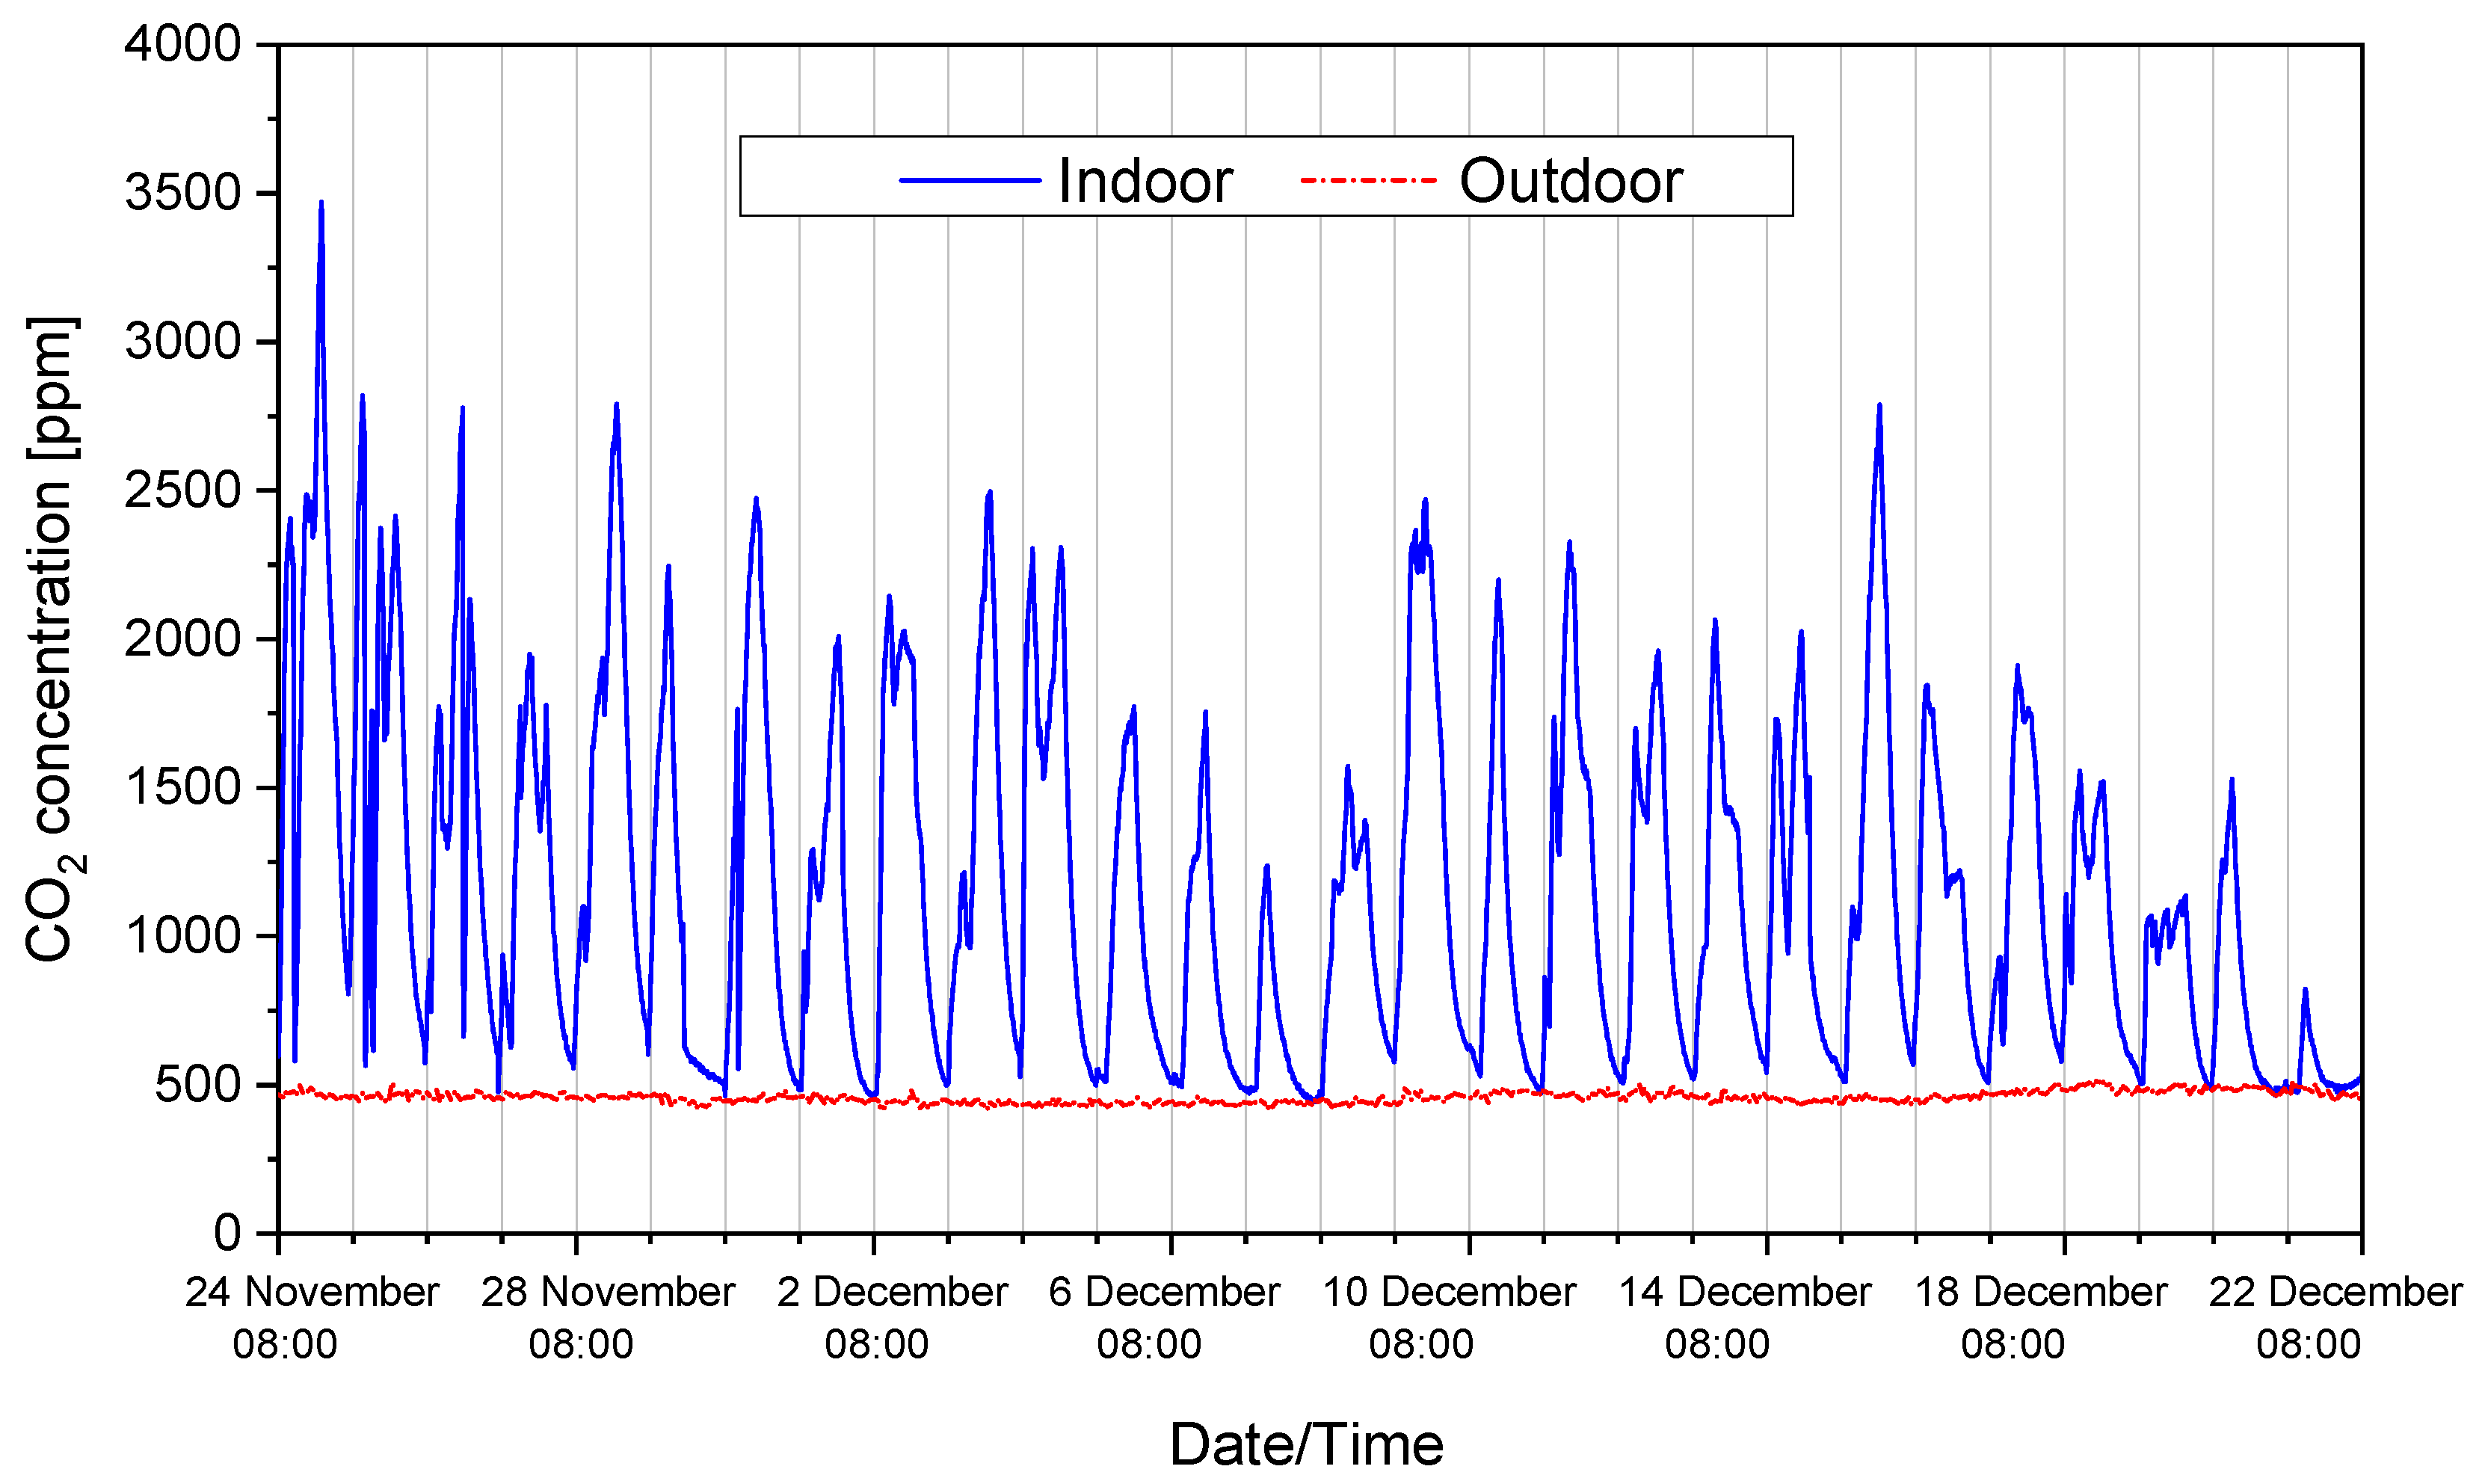
We firstly compared the CO2 data from indoor two monitoring points and found that the maximum nonuniformity coefficient of indoor CO2 distribution is 5.68%, less than 10% required by ASTM E741. Thus, this study considered indoor air to be uniformly distributed and reported an average CO2 value of two measuring points as indoor CO2 concentration. Figure 6 shows indoor and outdoor CO2 concentrations during the monitoring period of four weeks. During the period, indoor CO2 concentration in the room ranged from 442 to 3491 ppm, with an average of 1161 ppm, while outdoor CO2 value varied very little, with an average of 458 ppm. Obviously, indoor CO2 concentration variations appeared with peaks and valleys. The reason is that the room was generally occupied in the daytime and unoccupied in the evening.
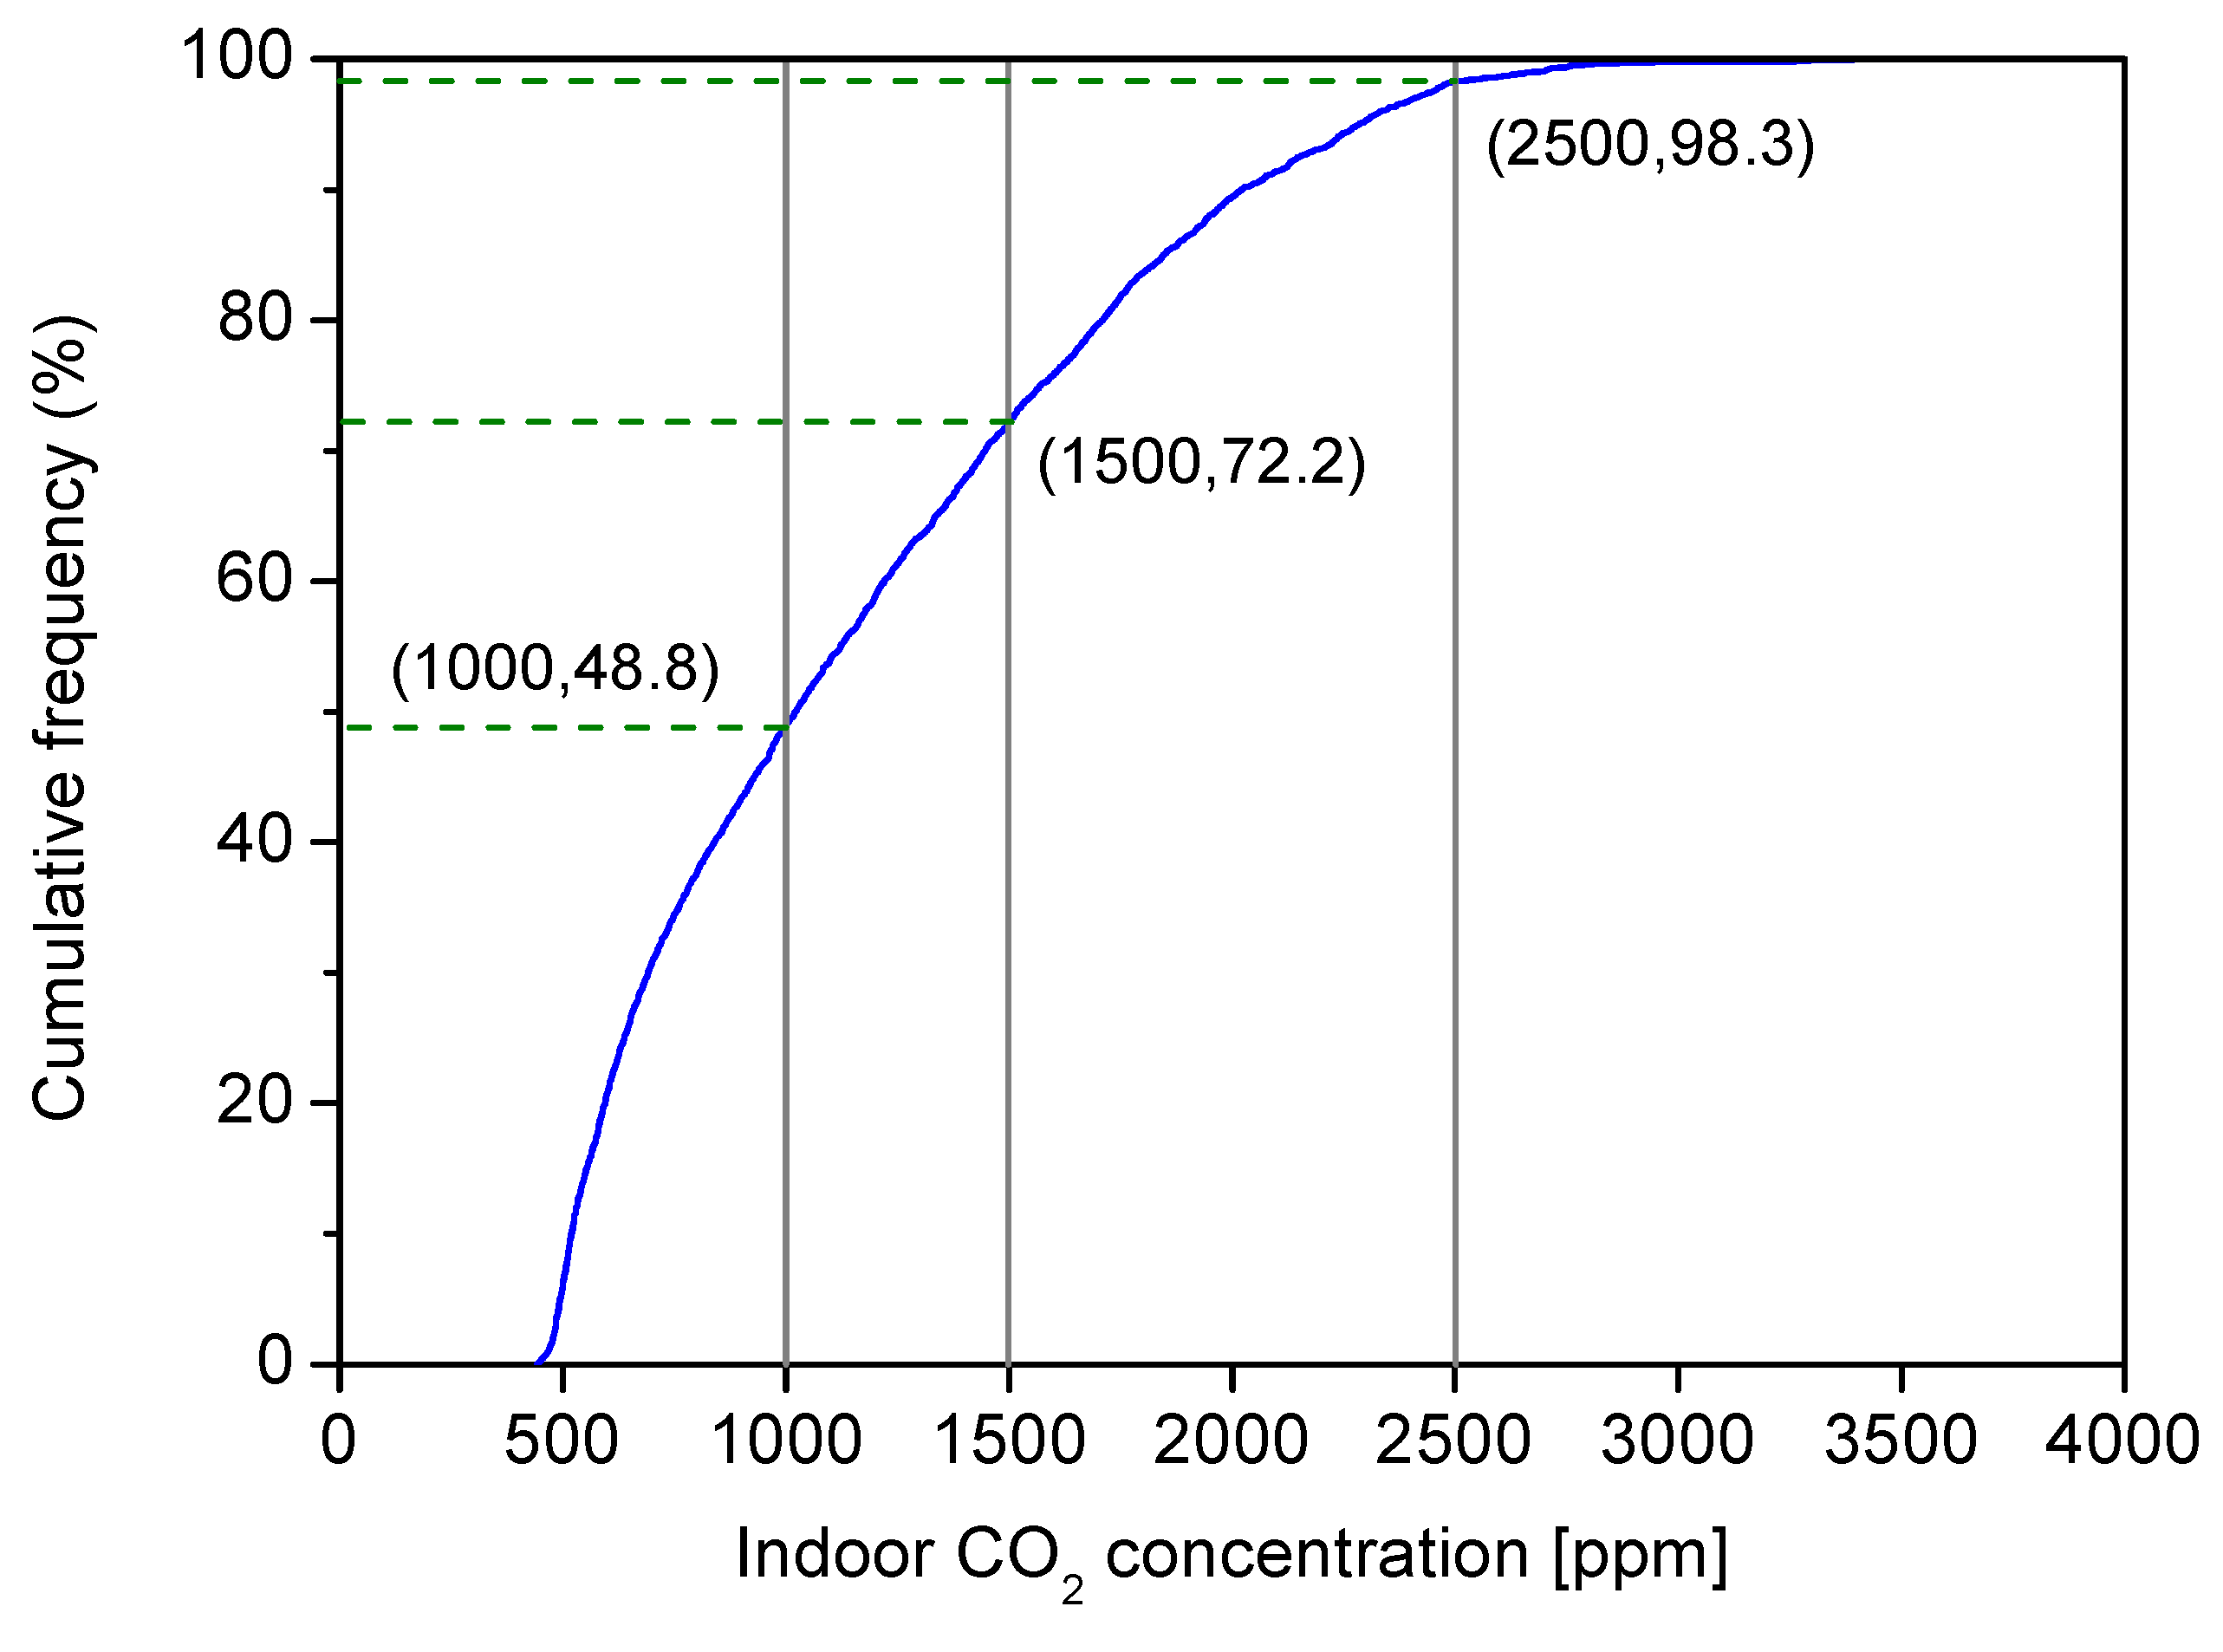
According to ASHRAE Standard 62.1 [18] and the Chinese indoor air quality standard GB/T 18883 [19], indoor CO2 concentration should be kept below the commonly referenced guideline of 1000 ppm (8–h average). However, based on the measured data, there was a large chunk of time when indoor CO2 concentration exceeded the guideline each day. Figure 7 shows the cumulative frequency of indoor CO2 concentration during the measuring period. Over 50% of the measured data were more than 1000 ppm. A total of 27.8% of the measured data were more than 1500 ppm and 1.7% of the measured data exceeded 2500 ppm.
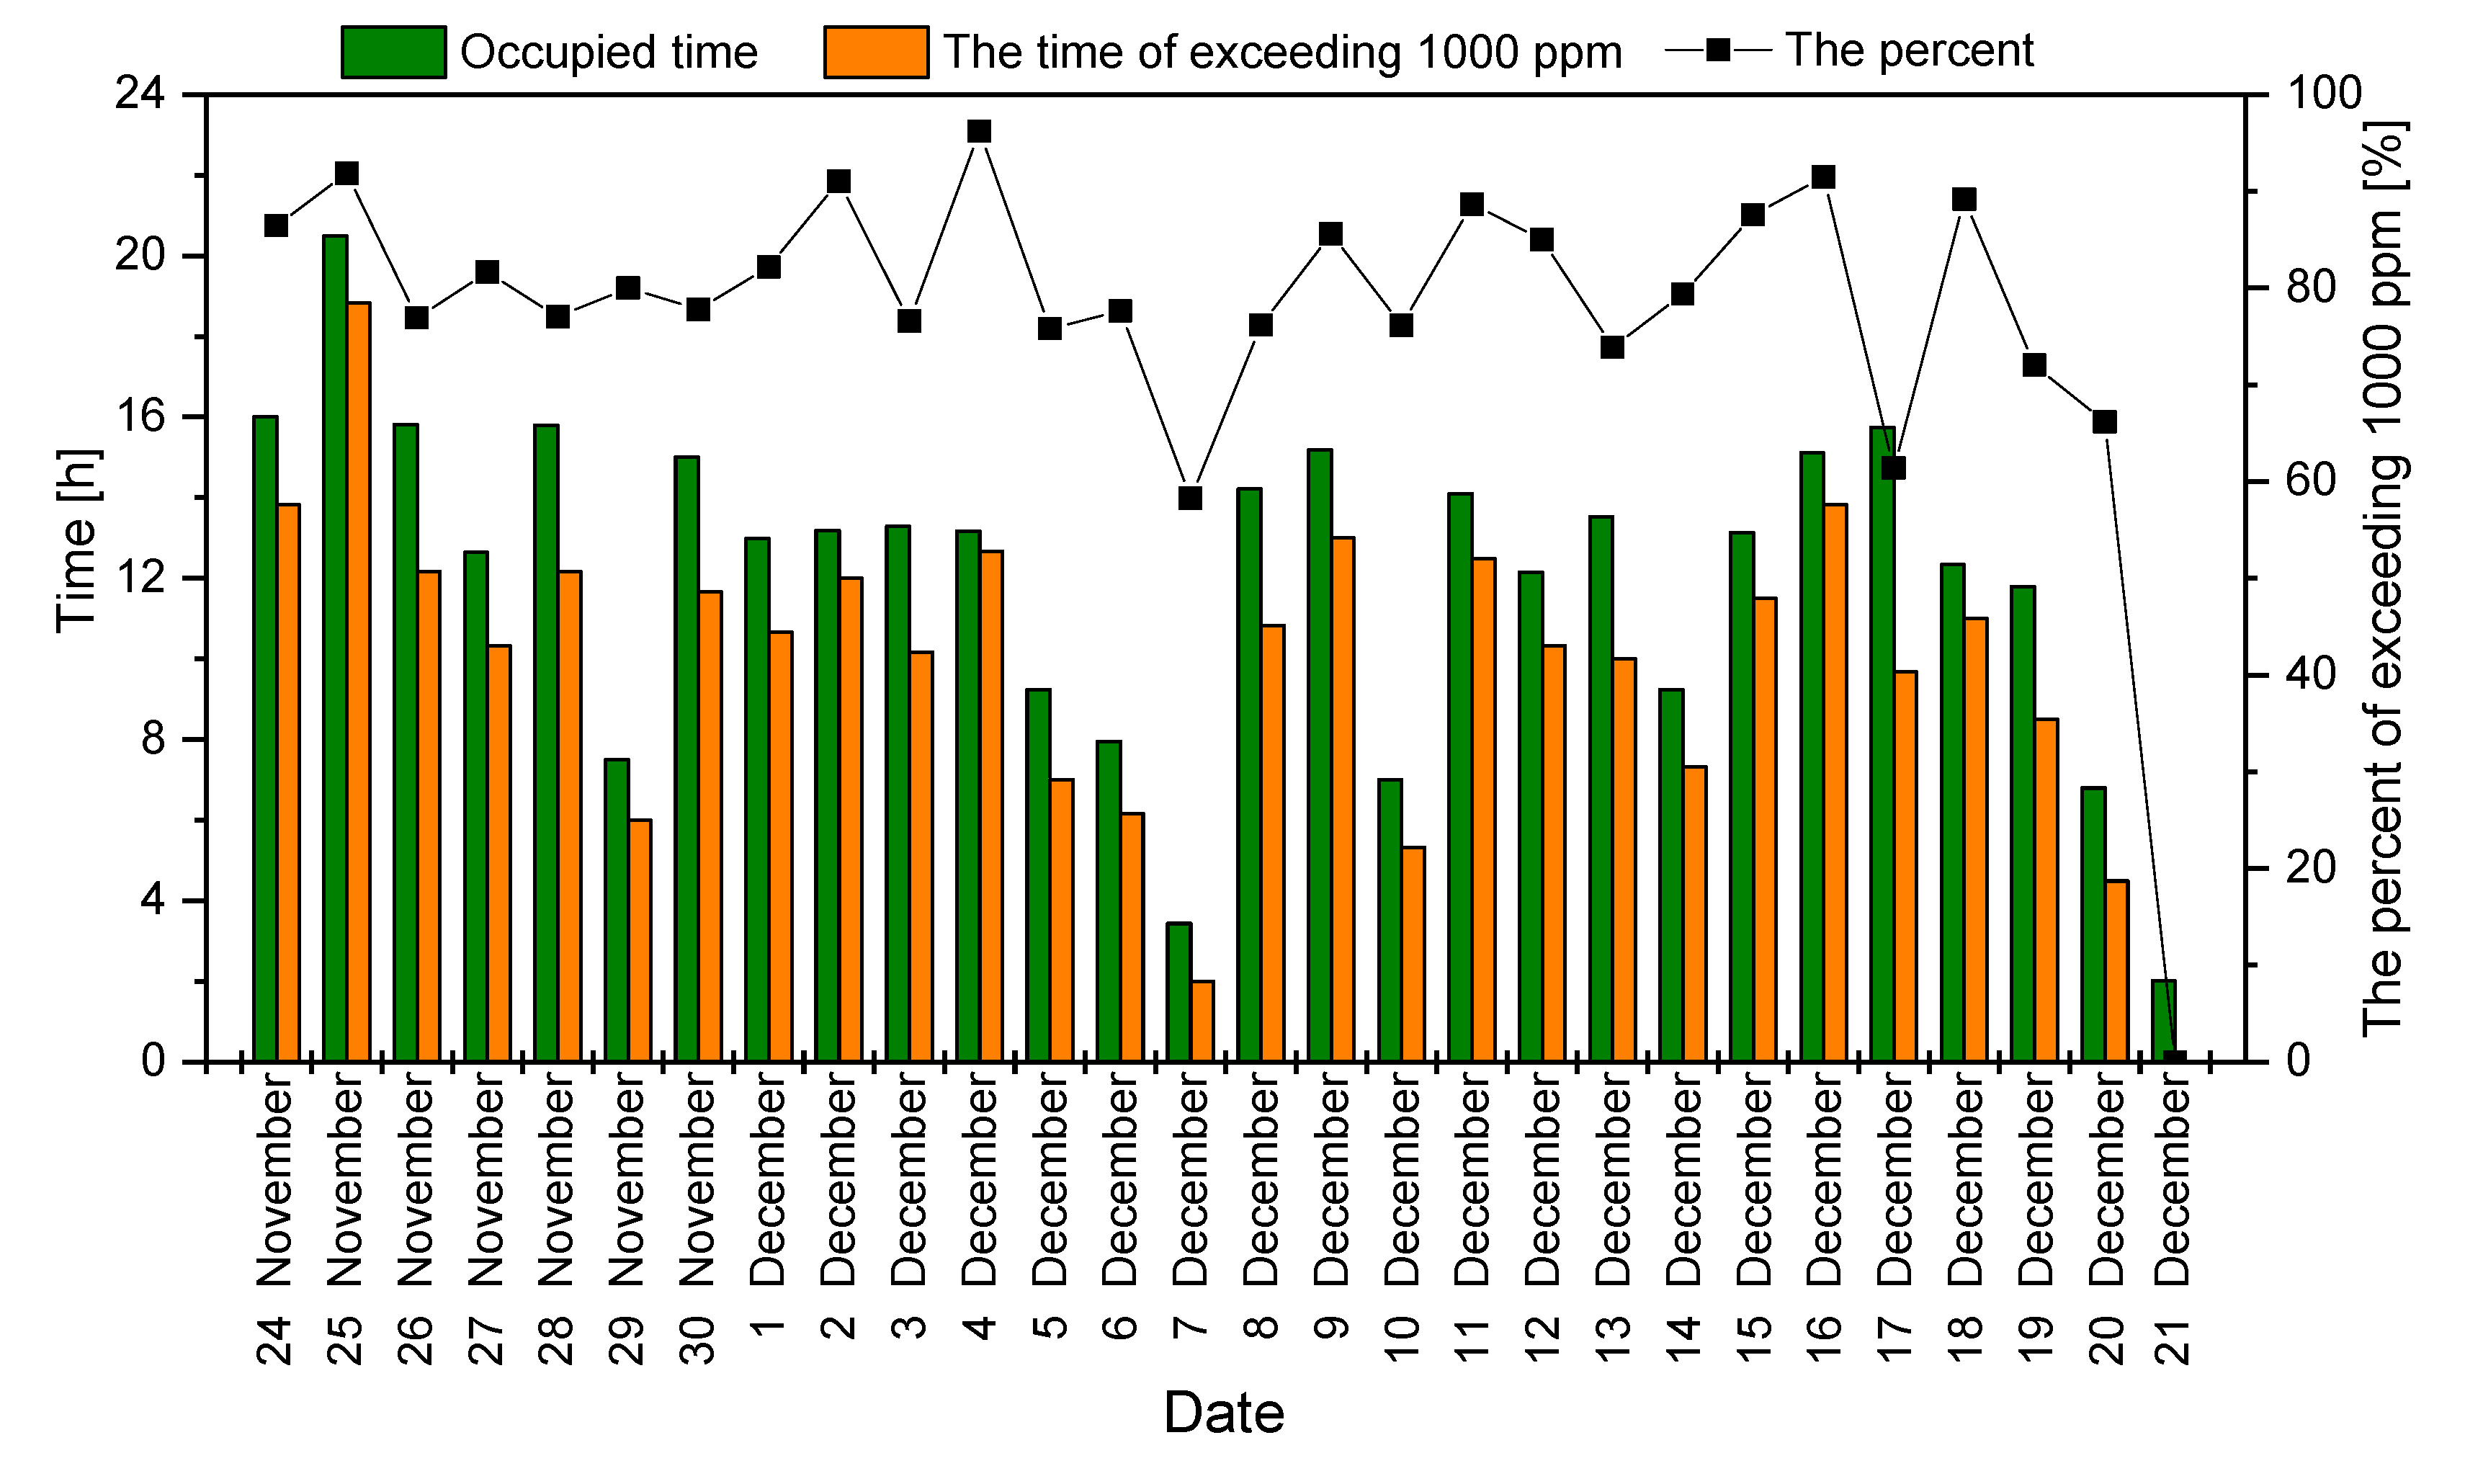
Figure 8 summarizes the time of indoor CO2 level over 1000 ppm each day. As a whole, indoor CO2 concentration exceed 1000 ppm during nearly all monitoring days. During the occupied time each day, the period when indoor CO2 concentration exceeded 1000 ppm ranged from 2.0 to 18.8 h, with an average value of 10.2 h. The percentage of occupied times with a CO2 concentration higher than 1000 ppm ranged from 58.3% to 96.2%, with an average value of 77.6% each day. These results indicate that indoor air quality in the research student room was poor during heating season.

3.2. Air Exchange Rate of the Room by Infiltration

Air exchange rate (AER) of the room by air infiltration can be evaluated using the CO2 decay method. As a general requirement, during the unoccupied period, the CO2 steady decay period when the initial CO2 level exceeds 1000 ppm is selected to calculate the air exchange rate of the room. Outdoor CO2 concentration is given as a constant 458 ppm (average value during monitoring period). Table 2 summarizes the AERs of the room calculated using the CO2 decay method during the unoccupied period each day (Adj. R2 > 0.99). There were two days when indoor CO2 concentration could not meet the above requirement. During the decay periods for calculation, the difference between indoor and outdoor temperature ranged from 18.7 to 26.3 °C, with an average of 22.3 ± 3.6 °C. Differences between indoor and outdoor temperature can cause different air infiltration, thereby generating different AERs. From Table 2, calculated AERs have a range of 0.247–0.409 h−1, and an average value of 0.313 h−1; that is, 0.9 L/ (s·person) when all postgraduate students are in the room, which is significantly lower than the minimum ventilation rates of 2.5 L/ (s·person) in breathing zone for office space.

3.3. Indoor Occupancy Characteristics

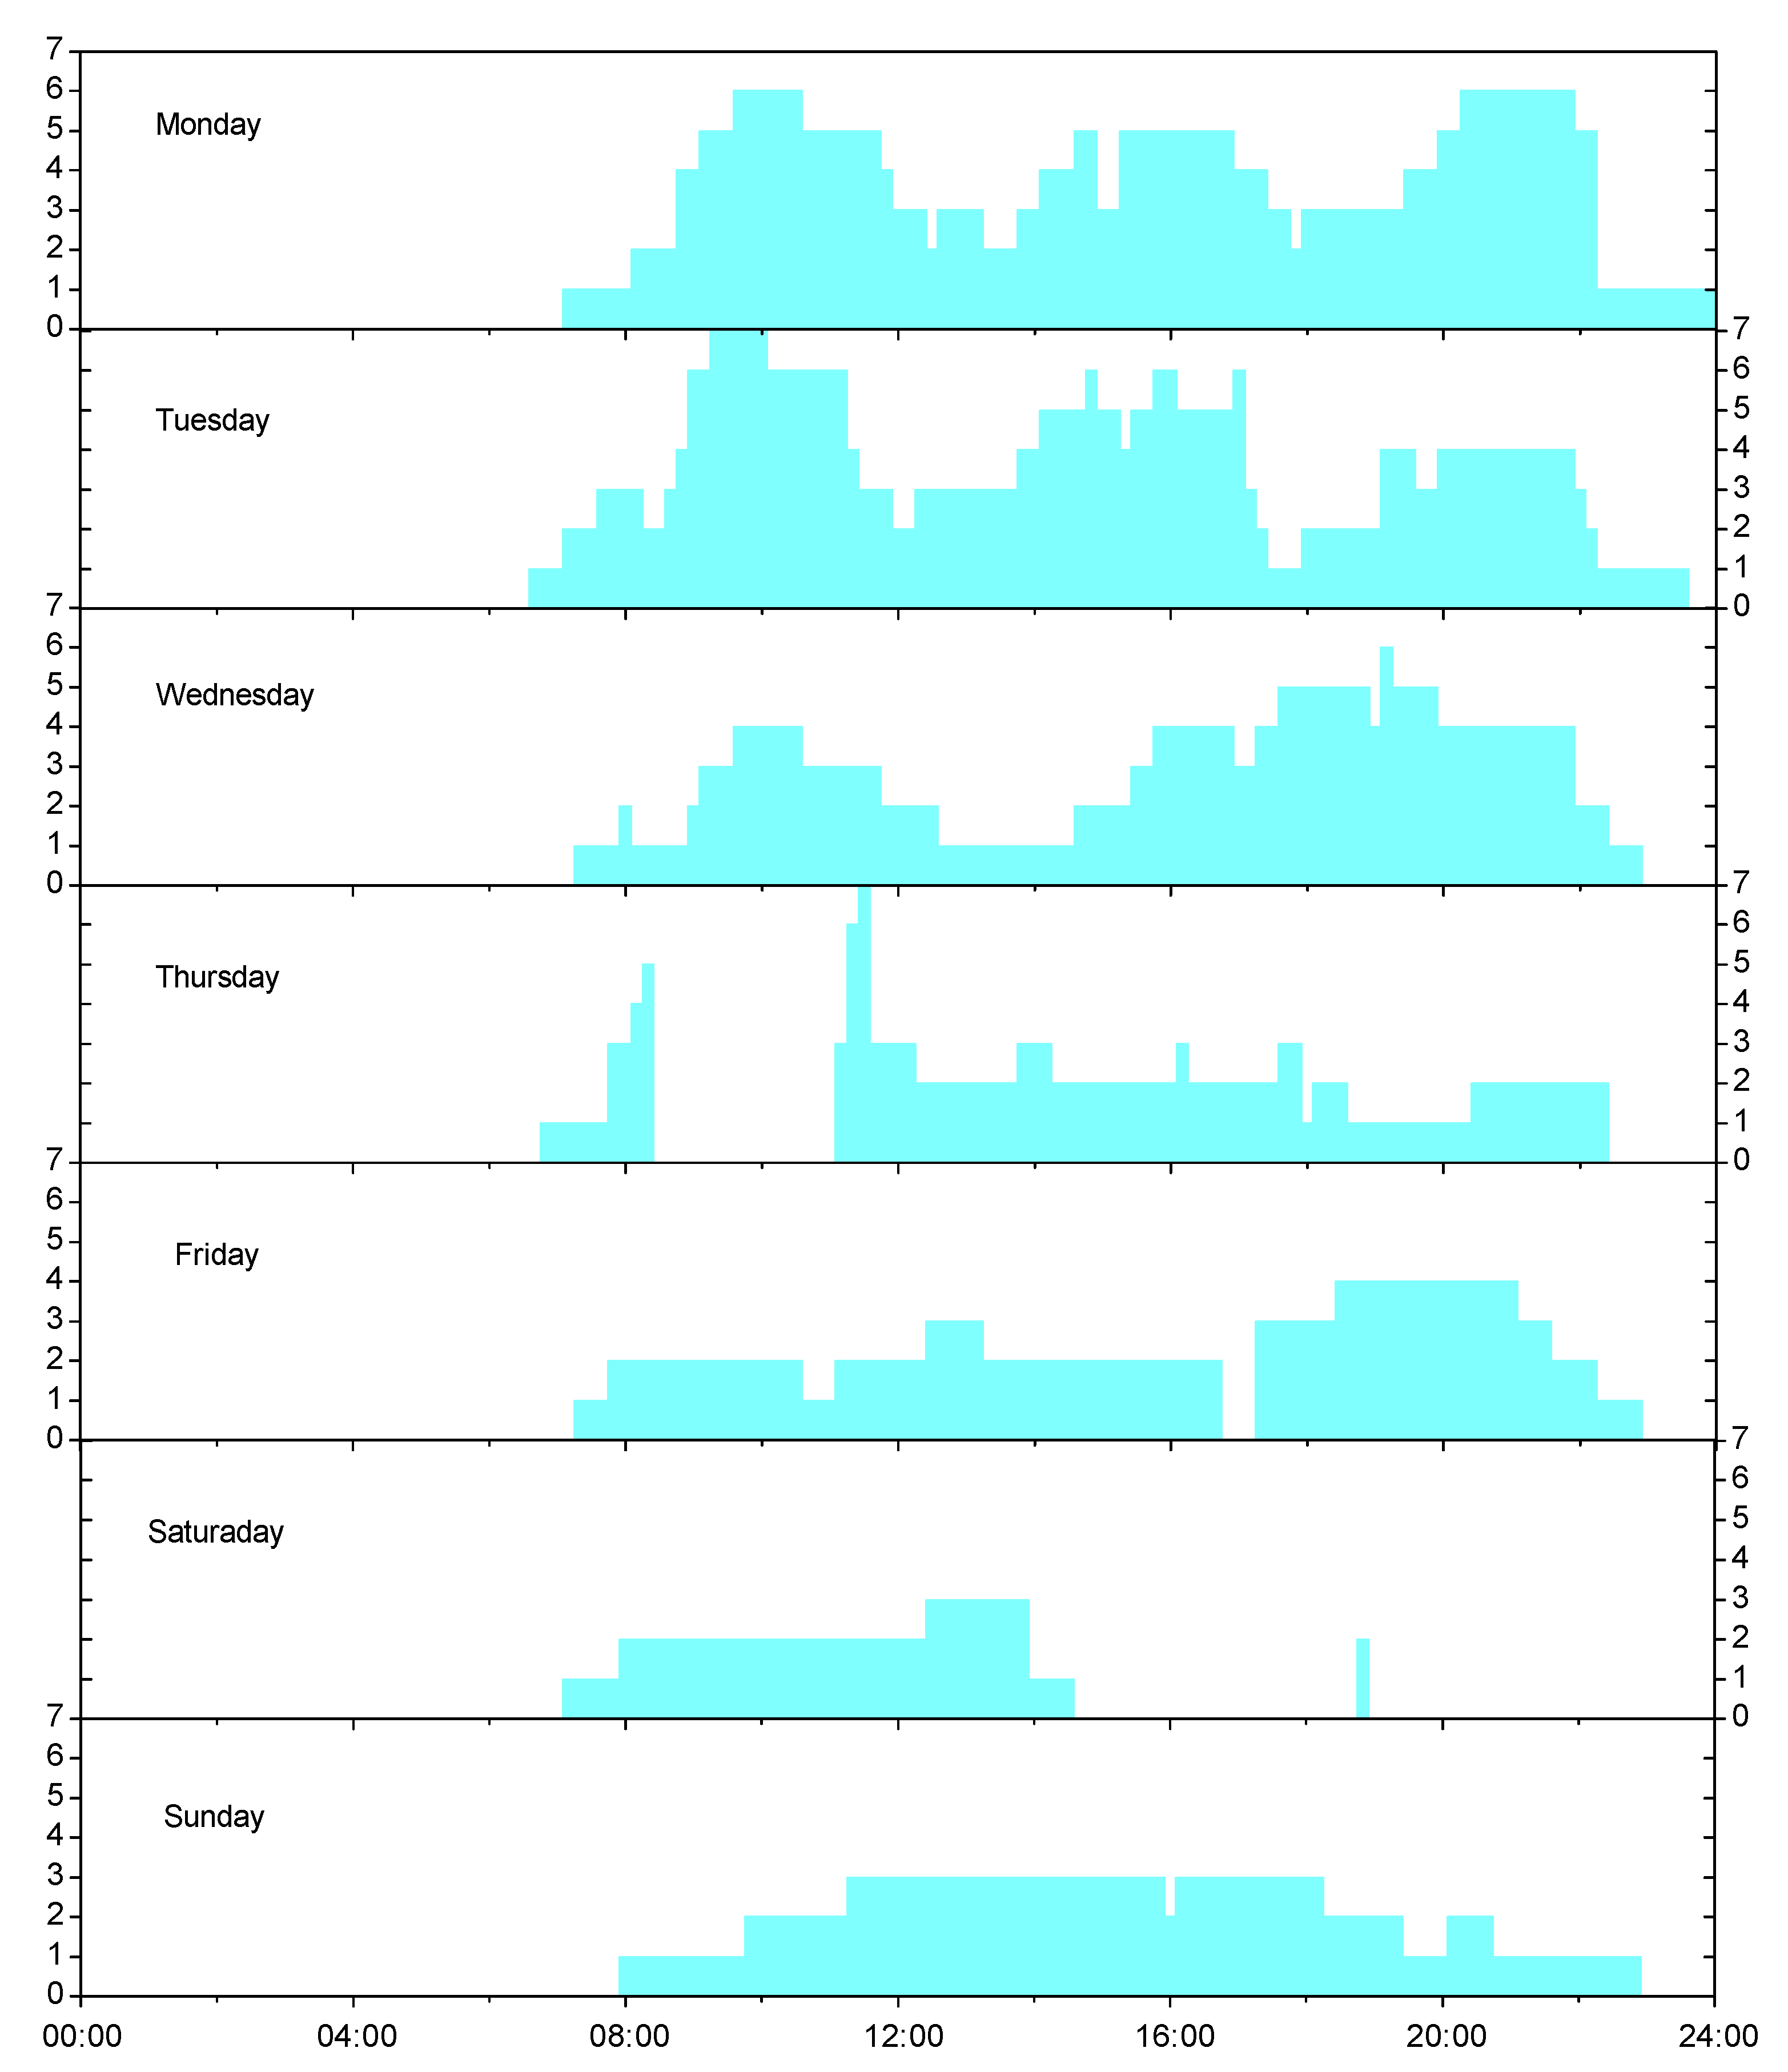
Indoor occupants are an important component of the built environment, since both occupancy rate and occupant activities have an effect on the requirement of ventilation. Figure 9 shows indoor occupancy cases of the research student room in a representative week. From Figure 9, in a day, the first occupant normally entered the room at 7:00–8:00, and the last occupant left the room at 23:00–24:00, while at mealtimes the room was sometimes unoccupied. The peak occupancy rate of the room each day mainly occurred at 10:00 in the morning and 16:00 in the afternoon. In addition, sometimes there were visitors entering the room, so the peak occupancy rate of the room was more than six. When the room was occupied with six persons, the per-capita area was 3.8 m2/p. There is no specific definition of high-occupancy density in offices in any building design standard of China. According to the Building Area Index for Regular Institutions of Higher Education [20] released by Ministry of Education of the People’s Republic of China, the subsidy building area per person for graduate student learning was 6 m2/p for Master’s degree candidates and 8 m2/p for PhD degree candidates. Obviously, the measured research student room was crowded. In terms of occupied time, the occupied time of the research student room each day overall varied from 3.4 to 20.5 h, with an average value of 12.0 h. Compared with other rooms in university buildings, the occupied time of the research student room was longer. In general, both the occupied time and occupancy rate of the research student room on weekdays were more than that on weekends, because most postgraduate students tended to have a rest on weekends. In this measurement, the average occupied time on weekdays and weekends was 13.5 h and 8.2 h, respectively. Postgraduate students in the room were commonly at the activity level of typing or reading.

3.4. Window/Door-Opening Behaviors of Postgraduate Students

Table 3 summarizes the window/door-opening behaviors of postgraduate students. During the monitoring days, there were only five days when postgraduate students actively opened windows/doors during the occupied period. We also find that, when window/door-opening behavior occurred, indoor CO2 concentrations were always at a high level. In addition, when both the window and door were open, the duration was relatively short (12 min and 8 min). The reason might be that when both the window and door are open, cross-ventilation is produced through the room. Cross-ventilation for a long time might reduce indoor thermal comfort due to a great indoor and outdoor temperature difference. When only the door was open, because the temperature in the corridor was not as low as outdoors, the duration was relatively long (16 min, 22 min and 31 min, respectively). Interestingly, it was observed that window/door-opening behaviors generally occurred when postgraduate students just went from outside into the room. A possible explanation for this case was that when occupants just went from outside into the room, they had completely adapted to outdoor fresh air, so that they could not bear indoor high CO2 concentration and bioeffluents. Consequently, they opened the window/door of the room for ventilation and let outdoor fresh air in. This indicated that occupants tended to adapt to high CO2 concentrations and bioeffluents, and had less control over window/door opening for ventilation requirement, when staying in the environment for a long time. In addition, during four weeks of continuous monitoring, as a general rule, the first occupant going into the room in the morning customarily opened the window/door to have proper ventilation for 5–10 min, although indoor CO2 concentration was not high. This might be greatly ascribed by the inadaption induced by going into the room from outside. The standard of ASTM D6245 [21] also pointed out that for adapted persons (i.e., indoor occupants), the ventilation rate per person to provide the same acceptance was approximately one-third of the value for unadapted persons (i.e., visitors), and the corresponding CO2 concentrations that outdoors-adapted occupants could accept were three times higher than those for unadapted persons. Although adapted occupants were able to accept high CO2 concentrations caused by such a reduction in the ventilation rate, the effect of exposure to high CO2 concentration on occupants’ health and productivity was not negligible. In addition, a reduction in the ventilation rate might give rise to high concentration of other contaminants. Thus, the method where the occupants control window/door opening for ventilation in such rooms by perceived air quality was inadvisable.

4. Discussion

4.1. Occupancy Rate Affects Indoor CO2 Level

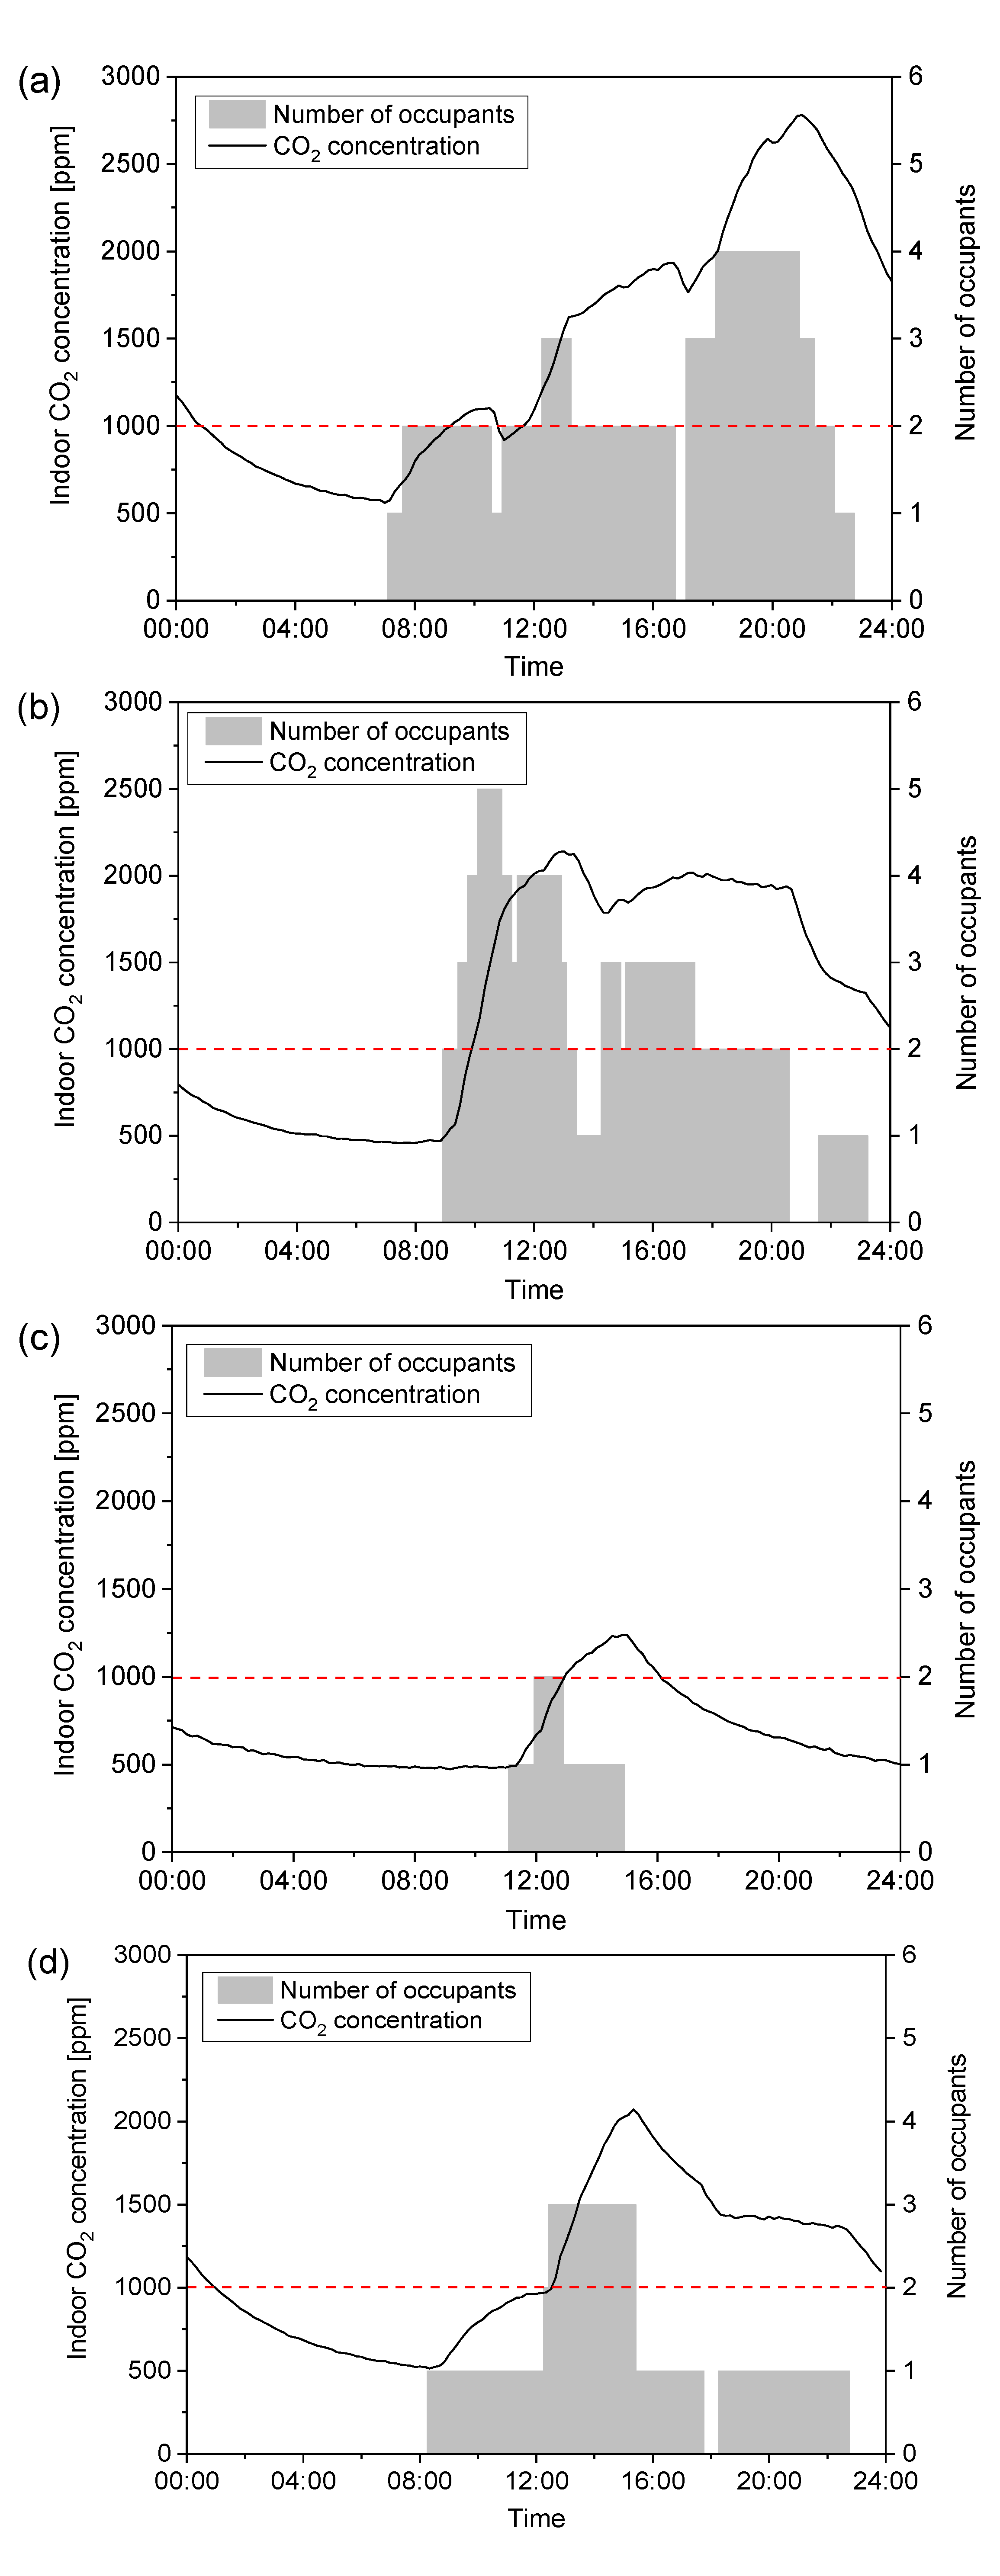
Figure 10 shows indoor CO2 concentration and occupancy rate at typical weekdays and weekends, when the door/windows are closed. It was observed that the variation in indoor CO2 concentration was sensitive to the indoor occupancy rate. Indoor CO2 concentration usually decreased to outdoor levels during the unoccupied period (i.e., night-time). In general, indoor CO2 concentration increased with occupancy time. The variation in CO2 concentration began to grow relatively fast, and then gradually became slower. However, when CO2 concentration reached a certain level, indoor CO2 concentration also decreased with time, although the room was still occupied. The reason was that indoor CO2 generation was not enough to offset the CO2 decrement induced by indoor and outdoor air exchange. Moreover, when indoor CO2 generation was equal to the CO2 decrement induced by indoor and outdoor air exchange, indoor CO2 generation tended to stabilize. On the whole, due to high occupancy rates and long occupancy time on weekdays, the duration times of indoor CO2 concentration above the reference level (dashed line in Figure 10) were longer than that on weekends. Therefore, in such kinds of room, it was recommended to reduce the number of students to ensure a low carbon dioxide concentration in the room.

4.2. Opening Door/Windows Decreases Indoor CO2 Concentration

As aforementioned in the Section Result, the average air exchange rate of the measured room by air infiltration was 0.313 h−1. In fact, this air infiltration rate could not meet indoor ventilation requirements, due to a high occupancy rate. This point was also verified by the monitoring data of indoor CO2 concentration. From Figure 11, it is seen that opening windows/doors could give rise to a considerable AER, a few dozen times higher than the air infiltration rate. Thereby, the shorter duration of opening windows/doors could significantly decrease indoor CO2 concentration close to outdoor level. Therefore, for such research student rooms with high occupancy rates, intermittent window/door opening might be an effective way to avoid continuous indoor high CO2 concentration. However, due to the great indoor and outdoor temperature difference during the heating season, postgraduate students tended to close windows/doors for a long time. When staying in the environment for a long time, postgraduate students had adapted to high CO2 concentrations and had less control over opening windows/doors for indoor ventilation.

4.3. Suggestion for Ventilation in Such Rooms

Based on the aforementioned discussion, the high occupancy rate and low air exchange rate of the room are the principal determinants of high indoor CO2 concentration of the naturally ventilated room. If any of these two parameters are adjusted, indoor air quality can be improved. However, with a rapidly increasing population of graduate students in universities, it seems to be difficult to decrease the occupancy rate of such rooms; instead, the occupancy rate may even increase. For this situation, adjusting ventilation rate of the room may be an effective way to maintain good IAQ. A basic way to enlarge the ventilation rate is for indoor occupants (graduate students) to open windows/doors. In particular, indoor occupants may need to be reminded to implement the action of opening windows/doors. For example, we can install a CO2 monitor with a warning device in such rooms. When indoor CO2 level exceeds a preset level, the device can remind indoor occupants to open window or doors.
In fact, indoor CO2 concentration can be roughly estimated based on indoor occupancy characteristics and ventilation rate. For a single-zone room, when the only indoor source of CO2 comes from occupants in the room, the indoor CO2 concentration mass balance equation can be expressed as:
V   d ( C i n t ) d t = Q C o u t t C i n t + G t
where V is room volume (m3); t is the time (h); C i n t is indoor CO2 concentration at time t (m3/m3); Q is volumetric airflow rate into (and out of) the space (m3/h); C o u t t is outdoor CO2 concentration (m3/m3), and the value varied very little; G t is CO2 generation rate in the room at time t (m3/h).
If Q is assumed, and C o u t t and G t are constant, Equation (5) can be integrated to obtain the following equation for C i n t :
C i n t = C o u t t + G t Q + C i n 0 C o u t t G t Q e N t
where C i n 0 is the indoor CO2 concentration at time t = 0; N is AER, Q / V .
For Equation (6), if outdoor CO2 concentration— C o u t t , indoor initial CO2 concentration— C i n 0 , and room volume— V are known, there will be close associations among indoor CO2 concentration— C i n t , AER— N , and indoor CO2 generation rate— G t . Once two parameters of them are known, the remaining one will be obtained. Based on the aforesaid model for human CO2 generation rate in the “Materials and Methods” section, The CO2 generation rate corresponding to an average-sized adult (BSA = 1.8 m2) engaged in office work (1.2 m) is about 18720 mL/h. The number of indoor occupants in the room hypothetically is m ; Equation (6) can be converted into the following equation:
C i n t = C o u t + m · 18720 N · V + C i n 0 C o u t m · 18720 N · V e N · t
The duration of CO2 concentration from indoor initial level to the referenced guideline (1000 ppm) is obtained as:
t = 1 N ln m · 18720 ( C i n 0 C o u t · N · V ] ln m · 18720 1000 C o u t · N · V
If indoor initial CO2 concentration C i n 0 is equal to outdoor CO2 concentration, Equation (8) can be converted into the following equation:
t = 1 N ln m · 18720 ln m · 18720 1000 C o u t · N · V
Generally speaking, outdoor CO2 concentration C o u t varies very little in an area. Therefore, from Equation (9), the main factors of the duration of indoor CO2 concentration increasing from the outdoor level to 1000 ppm are the number of indoor occupants, room volume and AER. If the three factors are known, the duration will be clear. Taking a room with four persons, a volume of 100 m3 and an AER of 0.5 h−1 as an example, the duration of indoor CO2 concentration increasing from the initial level to 1000 ppm in the room can be calculated as 0.9 h. This duration can also be considered as the reference of the interval of opening windows/doors for ventilation. Of course, for some economically viable universities, CO2-based demand-controlled ventilation facilities were also proposed to be installed in such rooms. An appropriate way to control the ventilation facilities is to directly measure the indoor CO2 level and activate the facilities if the level exceeds a preset level. Considering the serious outdoor air pollution due to particulate matter in winter in some regions of China, such as the Beijing–Tianjin–Hebei region, the simple idea to provide more outdoor air to dilute indoor CO2 concentration may even worsen indoor air quality. In this case, ventilation facilities with air-filter apparatus should be required. This is also the requirement for mechanical ventilation equipment stipulated by the current building ventilation standards in China. At the same time, it is recommended that monitoring devices for environmental pollution parameters (e.g., PM2.5, PM10, O3, NO2, SO2, CO) should be installed indoors to achieve real-time evaluation of indoor air quality [22,23]. When the concentration of indoor pollutants exceeds the threshold, indoor air-purification devices are also recommended to ensure good indoor air quality and the health of indoor occupants.

4.4. Limitations

There are several limitations for this study. A first obvious limitation was that this study only took one room as a case study, which might affect the representativeness and universality of the results. Another limitation is the accuracy of the measuring device. Compared with some instruments with high precision, the error of the instrument used in this study may affect the accuracy of measuring data, but it does not seem to make much influence on our conclusion.

5. Conclusions

In Chinese universities, postgraduate students usually carry out scientific research in a research student room in university buildings. This paper selected a naturally ventilated research student room in Chinese universities to conduct continuous field measurements of indoor CO2 level, air temperature and RH during the heating period, and then evaluated indoor environment and ventilation rate of the measured room based on measured CO2 concentration. Results showed that the research student room was crowed, and occupied time of the research student room each day varied from 3.4 to 17.5 h, with an average of 12.0 h, which was longer than general offices. During the occupied time, 58.3% to 96.2% (average 77.6%) of measured CO2 data each day exceeded 1000 ppm. Indoor high CO2 concentration was attributed to the high occupancy rate and low air infiltration rate of the room. Therefore, in such kind of rooms, it was recommended to reduce the number of students. Furthermore, it was found that opening windows/doors for several minutes could significantly decrease the indoor CO2 level close to the outdoor level. However, due to the great indoor and outdoor temperature difference during the heating season, and occupants’ adaption to indoor environment, indoor occupants (postgraduate students) generally have less control over window/door opening for ventilation requirements in such rooms. Therefore, intermittent window/door opening reminded by warning devices or estimated by indoor occupancy and air infiltration volume were suggested in such rooms. For economically viable universities, CO2-based demand-controlled ventilation facilities were also advocated for improving indoor air quality of such rooms. These results would be helpful to improve Chinese research students’ studying environment.

Author Contributions

Conceptualization, G.F.; methodology, C.L.; formal analysis, G.F.; investigation, G.F.; data curation, G.F.; writing—original draft preparation, G.F. and H.C.; writing—review and editing, H.C. and C.S.; supervision, C.L.; funding acquisition, G.F., Y.C. and B.N. All authors have read and agreed to the published version of the manuscript.

Funding

The authors would like to express their gratitude to the China Postdoctoral Science Foundation (Grant No. 2020M672279), National Natural Science Foundation of China (No. 51808505 and 52108100) for their financial supports.

Institutional Review Board Statement

Not applicable.

Informed Consent Statement

Not applicable.

Data Availability Statement

Not applicable.

Acknowledgments

The authors would like to sincerely thank the postgraduate students involved in this study for their cooperation.

Conflicts of Interest

The authors declare no conflict of interest.

Abbreviations

IAQIndoor Air Quality
CO2Carbon Dioxide
RHRelative Humidity
RQRespiratory Quotient
ASHRAEAmerican Society of Heating, Refrigerating and Air-Conditioning Engineers

References

  1. China’s Statistics Yearbook 2021. Available online: http://www.stats.gov.cn/tjsj/ndsj/2021/indexch.htm (accessed on 1 May 2022).
  2. Sarbu, I.; Pacurar, C. Experimental and numerical research to assess indoor environment quality and schoolwork performance in university classrooms. Build. Environ. 2015, 93, 141–154. [Google Scholar] [CrossRef]
  3. Chang, F.H.; Li, Y.Y.; Tsai, C.Y.; Yang, C.R. Specific indoor environmental quality parameters in college computer classrooms. Int. J. Environ. Res. 2009, 3, 517–524. [Google Scholar] [CrossRef]
  4. Jurado, S.R.; Bankoff, A.D.; Sanchez, A. Indoor air quality in Brazilian universities. Int. J. Environ. Res. Public Health 2014, 11, 7081–7093. [Google Scholar] [CrossRef] [PubMed] [Green Version]
  5. Argunhan, Z.; Avci, A.S. Statistical evaluation of indoor air quality parameters in classrooms of a university. Adv. Meteorol. 2018, 2018, 4391579. [Google Scholar] [CrossRef]
  6. Asif, A.; Zeeshan, M.; Jahanzaib, M. Indoor temperature, relative humidity and CO2 levels assessment in academic buildings with different heating, ventilation and air-conditioning systems. Build. Environ. 2018, 133, 83–90. [Google Scholar] [CrossRef]
  7. Li, H.R.; Li, X.F.; Qi, M.W. Field testing of natural ventilation in college student dormitories (Beijing, China). Build. Environ. 2014, 78, 36–43. [Google Scholar] [CrossRef]
  8. Zhang, N.B.; Kang, Y.M.; Zhong, K.; Liu, J.P. Indoor environmental quality of high occupancy dormitory buildings in winter in Shanghai, China. Indoor Built Environ. 2016, 25, 712–722. [Google Scholar] [CrossRef]
  9. Righi, E.; Aggazzotti, G.; Fantuzzi, G.; Ciccarese, V.; Predieri, G. Air quality and well-being perception in subjects attending university libraries in Modena (Italy). Sci. Total Environ. 2002, 286, 41–50. [Google Scholar] [CrossRef]
  10. Sulaiman, S.A.; Isa, N.; Raskan, N.I.; Harun, N.F.C. Study of indoor air quality in academic buildings of a university. Appl. Mech. Mater. 2013, 315, 389–393. [Google Scholar] [CrossRef]
  11. Harun, H.A.; Buyamin, N.; Othman, M.A.; Sulaiman, S.A. A case study on indoor comfort of lecture rooms in university buildings. Appl. Mech. Mater. 2013, 393, 821–826. [Google Scholar] [CrossRef]
  12. Giulio, M.D.; Grande, R.; Campli, E.D.; Bartolomeo, S.D.; Cellini, L. Indoor air quality in university environments. Environ. Monit. Assess. 2010, 170, 509–517. [Google Scholar] [CrossRef] [PubMed]
  13. Ugranli, T.; Toprak, M.; Gursoy, G.; Cimrin, A.H.; Sofuoglu, S.C. Indoor environmental quality in chemistry and chemical engineering laboratories at Izmir Institute of Technology. Atmos. Pollut. Res. 2015, 6, 147–153. [Google Scholar] [CrossRef] [Green Version]
  14. Shi, S.S.; Chen, C.; Zhao, B. Air infiltration rate distributions of residences in Beijing. Build. Environ. 2015, 92, 528–537. [Google Scholar] [CrossRef]
  15. Fujikawa, M.; Yoshino, H.; Takaki, R.; Okuyama, H.; Hayashi, M.; Sugawara, M. Experimental study of the multi-zonal airflow measurement method using human expiration. J. Environ. Eng. 2010, 75, 499–508. [Google Scholar] [CrossRef] [Green Version]
  16. Lawrence, T.M.; Braun, J.E. A methodology for estimating occupant CO2 source generation rates from measurements in small commercial buildings. Build. Environ. 2007, 42, 623–639. [Google Scholar] [CrossRef]
  17. ASHRAE Handbook Fundamentals; American Society of Heating, Air Conditioning and Refrigeration Engineers: Atlanta, GA, USA, 2013.
  18. ANSI/ASHRAE Standard 62.1; Ventilation for Acceptable Indoor Air Quality. American Society of Heating, Refrigerating and Air-Conditioning Engineers, Inc.: Atlanta GA, USA, 2013.
  19. GB/T 18883; Indoor Air Quality Standard. Ministry of Environmental Protection of the People’s Republic of China: Beijing, China, 2002.
  20. Building Area Index for Regular Institutions of Higher Education; Ministry of Education and National Development and Reform Commission of the People’s Republic of China: Beijing, China, 2018.
  21. ASTM D6245; Standard Guide for Using Indoor Carbon Dioxide Concentrations to Evaluate Indoor Air Quality and Ventilation. American Society for Testing and Materials: West Conshohocken, PA, USA, 2012.
  22. Sarkheil, H.; Rahbari, S. Development of case historical logical air quality indices via fuzzy mathematics (Mamdani and Takagi–Sugeno systems), a case study for Shahre Rey Town. Environ. Earth Sci. 2016, 75, 1319. [Google Scholar] [CrossRef]
  23. Dionovaa, B.W.; Mohammed, M.N.; Al-Zubaidi, S.; Yusuf, E. Environment indoor air quality assessment using fuzzy inference system. ICT Express 2020, 6, 185–194. [Google Scholar] [CrossRef]
Figure 1. Indoor views of typical research student offices in some universities of China.
Processes 10 01434 g001
Figure 2. Aerial view (a) and outdoor view (b) of the measured room.
Processes 10 01434 g002
Figure 3. Layout of the measured room.
Processes 10 01434 g003
Figure 4. Layout of the window.
Processes 10 01434 g004
Figure 5. Recording instruments for temperature and RH (Testo 175H1) and CO2 (MCH-383SD).
Processes 10 01434 g005
Figure 6. Indoor and outdoor CO2 concentration during monitoring period.
Processes 10 01434 g006
Figure 7. Cumulative frequency of indoor CO2 concentration during monitoring period.
Processes 10 01434 g007
Figure 8. Summary of duration for indoor CO2 level over 1000 ppm each day during monitoring period.
Processes 10 01434 g008
Figure 9. Indoor occupancy case of the research student room in a representative week.
Processes 10 01434 g009
Figure 10. Indoor CO2 concentration and occupancy rate (door/window closed): (a,b) at weekday; (c,d) at weekend.
Processes 10 01434 g010
Figure 11. Indoor CO2 concentration and door/window opening: (a) 24 November; (b) 30 November.
Processes 10 01434 g011
Table 1. Summary of instrument range and accuracy.
ParametersRangeAccuracy
CO2 concentration0–4000 ppm±40 ppm (below 1000 ppm)
±5% rdg (1001~3000 ppm)
±250 ppm (above 3000 ppm)
Indoor temperature−20–55 °C±0.4 °C
Indoor RH0–100%±2%
Table 2. Summary of AER calculated by using CO2 decay method during unoccupied period.
DateDecay PeriodInitial CO2 Level [ppm]Final CO2 Level [ppm]AER [h−1]Adj. R2
24 November----
25 November03:10–06:2015008280.3320.9987
26 November00:00–07:0017776430.3030.9975
27 November00:00–06:2015066150.2910.9986
27 November23:00–06:0014745860.3170.9968
28 November23:10–06:3021357020.2710.9980
29 November15:00–18:0017719830.3160.9928
30 November23:00–08:0013734840.3730.9991
1 December22:10–07:3011714750.4090.9989
2 December23:30–06:3012535210.3430.9975
3 December23:10–06:0019456420.3170.9996
4 December21:30–06:0019245380.3510.9996
5 December20:30–05:0015445840.2850.9961
6 December20:00–03:0013605590.3200.9974
7 December15:30–22:3011325500.2930.9929
8 December23:50–07:0011505970.2470.9905
9 December23:30–07:0014946350.2800.9911
10 December19:30–02:0013615860.3060.9968
11 December23:10–05:3014276070.2960.9991
12 December23:00–07:0014595500.3010.9995
13 December23:00–06:0012825980.2550.9954
14 December----
15 December23:00–06:0018986070.3250.9995
16 December23:10–06:1011485270.3410.9969
17 December23:20–06:2014496050.3010.9946
18 December21:40–05:0012485960.2770.9914
19 December23:20–06:0010675060.3760.9990
20 December15:00–23:5012785070.3100.9992
Table 3. Summary of opening window/door operation during occupied time.
DaysWindowsDoorWindow/Door-Opening Duration (min)Indoor CO2 Level When Occupants Open Windows/Door (ppm)
1xo162254
2oo122694
3xo311759
4xo222776
5oo81746
Notes: x is closed; o is opened.
Publisher’s Note: MDPI stays neutral with regard to jurisdictional claims in published maps and institutional affiliations.