Abstract
The online measurement of coal ash has overcome the shortcomings of chemical tests. However, there could be large fluctuations and errors in the results of online ash monitors because of the transient change in coal quality resulting from different geological conditions in the mining process. In this study, to resolve the problems of the dual-energy γ-ray online ash monitor in the Linhuan Coal Preparation Plant, we investigated the internal factors, such as the composition of multimineral and multicoal, and external factors, such as the moisture and impurities, which affect the measurement results of the coal ash monitor. Furthermore, we developed a mathematical model to determine the effect of relevant factors on the coefficient of the online ash monitor, which revealed the relationship between coal composition and the parameters of the ash monitor, ensuring the stable and accurate measurement of ash in clean coal. The method of determining parameters used in the case of coal blending has been applied in the Linhuan Coal Preparation Plant. By comparing with tested ash content, the average absolute error and relative error for daily ash content measured in April are 0.21 and 2.18%, respectively. Meanwhile, it shows certain accuracy and reproducibility while opposed to the daily average absolute error of 0.22 and relative error of 2.39% in May.
1. Introduction
Ash content is an important index for evaluating the quality of coal. Generally, the ash content of coal can be measured through chemical tests. However, such tests have large lags, and online measurements have not been achieved, which is detrimental to instructing production [1]. With the improvement in modern electronic technologies and the popularization of nuclear physics technologies, online detection technologies have become feasible [2,3,4,5,6].
Online ash monitors based on γ-ray have been widely employed in coal-property test fields owing to their fast response and real-time feedback [7,8]. Based on low-energy γ-ray backscattering, Asfahani [9] established a calibration equation for ash and discovered the best configuration radiation source of 137Cs and 133Ba, which predict ash content more accurately. Sun et al. [10] corrected the ash content online and improved the accuracy of ash measurements using a mathematical curve model and a machine-learning least-squares support vector machine (LS-SVM) models. Cheng et al. [11] proposed a chaos LS-SVM-based dual-energy γ-ray detection method. The average relative error for ash content measured using this method reduced from 2.22% and 3.19% to 0.8%, compared to the line-approaching method and the least squares approaching method, respectively. Gaft [12] developed an online mineral analysis system using laser-induced breakdown spectroscopy (LIBS) and tested it in field conditions for online analysis of ash content in coal on moving belt conveyers. The online coal ash content monitoring results achieved the required range (at least ±0.5% mean absolute error), compared with laboratory data.
The transient change in the ash content of a coal flow caused by the variation in coal-seam thickness and the contained mineral limits the physical sampling analyses of coal flows from belt conveyors [13,14]. The Linhuan Coal Preparation Plant has installed a dual-source online ash monitor on the belt conveyor of the clean coal product, which enhanced the ability of the instrument to adapt to the instantaneous changes in coal quality. However, because the raw coal for the Linhuan Coal Preparation Plant is from different adjacent mines, the coal is diverse in quality, resulting in large fluctuations and errors in the output data from the online detection ash monitor. Therefore, it is necessary and urgent to study the application of online ash monitors in coal preparation under multimine and multicoal conditions.
2. Basic Principle of the Dual-Energy γ-ray Transmission Method
According to the atomic numbers (Z), elements in coal can be divided into low- and high-Z elements. For different elements, γ-ray presents different mass attenuations; thus, the direct adsorption of γ-ray during penetration through the coal samples can be utilized to detect the ash content of coal [15,16]. By analyzing the relationship between the mass absorption coefficient of each element in coal and the energy change of γ-ray [17], we found that, for γ-ray whose energy is lower than 100 keV, the attenuation coefficient for low-Z elements is low, but that for high-Z is high. When the energy of γ-ray ranges from 200 keV to 2 MeV, the difference in the mass attenuation coefficient for different elements is very small. In this study, americium-241 (Am241) was chosen as the source of low-energy γ-ray to determine the mass fraction of high-Z elements, and cesium-137 (Cs137) was chosen as the source of middle-energy γ-ray to monitor the mass thickness change of coal.
The mass fraction of high-Z elements in the clean coal ash of the Linhuan medium is 49.019% (Table 1). The coal ash content can be obtained by multiplying the mass fraction of high-Z elements by a constant (approximately 2).

Table 1.
Mass fraction of high-Z elements in medium-clean coal ash from the Linhuan plant.
The interactions between γ-ray photons and other matters include the photoelectric effect, Compton effect, and electron-pair interaction [18]. When penetrating substances, the change in γ-ray intensity can be expressed as follows:
When two kinds of γ-ray with the same quasi-direct beam transmit the same coal seam, we have the following equations:
where and are proportional to the flux density. Because the same coal seam is transmitted by two kinds of γ-ray, the mass thicknesses of coal in Equations (3) and (4) are the same.
Assuming that the mass fraction of high-Z elements in the testing coal is , the mass fraction of the low-Z elements is (1), and the mass attenuation coefficient of the testing coal to Am241 ray is given as follows:
Taking the logarithm of Equations (1) and (2), and incorporating in Equation (5), the following equation is obtained:
Assuming the ash content in coal is , and , then:
Equation (7) is the basic formula for measuring ash content using the dual-energy γ-ray transmission method. During the measurement of ash content, In and In are preset constants, and the actual parameters measured are and .
3. Main Factors Affecting the Measurement Results of Dual-Energy γ-ray Ash Monitors
Many factors can affect the results of γ-ray measurements, including the relative content of high-Z elements, the residual medium of dense-medium coal preparation, moisture, and the metal-oxide content [19,20,21].
3.1. Relative Changes in the Content of High-Z Elements in Coal Ash
The fundamental equation for measuring coal ash content is as follows:
Assuming the elemental composition of combustible substances and their relative contents are constant, then only the effect of relative change in the composition of high-Z elements in constituent minerals of coal on the measurement results would be considered. Once the content of one high-Z element increases, the content of other high-Z elements would decrease proportionally to maintain the total content of high-Z elements.
Herein, we suppose that and are constants; thus, Equation (8) can be differentiated as follows:
High-Z elements, including silicon, aluminum, iron calcium magnesium, and sulfur, whose mass fractions are (i = 1–6), are considered herein. Based on the equation of the mass attenuation coefficient in composites, Equation (5) can be expressed as:
Supposing the mass fraction of element i in high-Z elements is , the corresponding mass attenuation coefficient is , the total mass fraction of the other five high-Z elements is (1), and their mass attenuation coefficient is . When changes but remains constant, Equation (10) becomes:
and:
Substituting Equation (11) into (9), and for , then:
In Equation (12), is the mass attenuation coefficient of element i to Am241, which is a constant. For different coals, and are different, and is related to the composition of the elements.
Taking the coal in the Linhuan plant as an example, Table 2 lists the measurement results of the ash monitor when the relative contents of the six high-Z elements and their oxides increase by 1%. The impact of ash content on the measurement result of the ash monitors increases with an increase in the ash content. When the iron, calcium, magnesium, and sulfur contents increase, the ash content measured by the ash monitor becomes higher than the real value, whereas the reverse is the case when the silicon and aluminum contents increase. The change would be most obvious in the measurement of ash content when the iron content changes, followed by calcium, aluminum, magnesium, silicon, and sulfur, in that order.
Table 2.
Measured ash contents of coal when the content of high-Z elements increases by 1%.
3.2. Residual Medium in the Dense-Medium Coal Preparation Process
A slight ferromagnetic substance (Fe3O4) remains in clean coal during the dense-medium coal preparation process. It changes to Fe2O3 during the subsequent combustion process. Because the mass difference between these two oxides of iron is only about 5%, the increased mass of Fe2O3 in ash that is due to the residual medium is equal to the mass of residual Fe3O4 when measuring the ash content.
If a ferromagnetic medium with a mass ratio of ε is doped into coal with an ash content , the true value of the ash content of the coal is given as:
According to Equation (5), and for , the mass attenuation coefficient of coal with an ash content to Am241 low-energy γ-ray is expressed as:
When a ferromagnetic medium with a mass ratio of ε is mixed into this coal, the mass attenuation coefficient of coal samples to Am241 low-energy γ-ray is given as follows:
Substituting in Equation (14) into Equation (15), we have:
Substituting Equation (16) into Equation (8), the measured ash content with residual can be expressed as:
For the medium-clean coal in the Linhuan Coal Preparation Plant, = 0. 386 cm2/g and = 0.185 cm2/g. Figure 1 shows the ash contents measured using a γ-ray ash monitor and through chemical tests when a ferromagnetic medium with a mass content of 1% is mixed with coal with of 10%, 20%, and 30%. As shown, the measured ash content in medium-clean coal is 0.65 higher than the value obtained through chemical tests, which is not attributed to the ash content in coal.
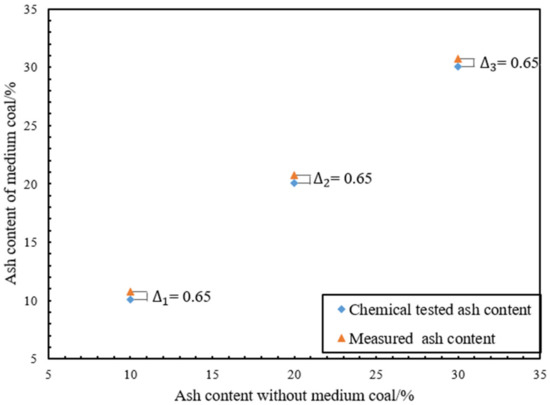
Figure 1.
Effect of the medium content (ε = 1 kg/t) on the measurement result of ash content.
Due to the existing statistical error of γ counting and laboratory error, the accidental error caused by the fluctuation of the residual medium must be less than 0.32%, ensuring the total measurement accuracy is better than ±0.5%, and the mean square error of residual medium content in the clean coal is required less than ±0.5 kg/t. Thus, the coal preparation plant should try to reduce the medium consumption in the process and make the residual medium content in the tested coal as stable as possible.
3.3. Moisture Change in Coal
If the moisture content of coal is , the mass attenuation coefficient ratio of the same coal for two kinds of γ-ray is expressed as follows:
If there is no water ( = 0), the above equations become:
The difference between the measured K values for coal sample with water content of and 0 is expressed as follows:
() in Equation (20) is two orders of magnitude lower than ; thus, it is negligible. Therefore, Equation (20) can be simplified as follows:
According to Equation (7), if the moisture in coal is , the deviation of the measured ash content compared to that in dry coal is given as:
In Equation (22), because is approximately equal to , the deviation can be expressed as follows:
The value of is related to the ash content; thus, the measured value of resulting from the change in the moisture content is also related to the ash content. When Equation (24) is satisfied, will be equal to 0.
In this case, the measured ash content is not influenced by the change in moisture content.
Based on Equation (23), there is a linear relationship between the moisture in coal and the deviation of the measured value caused by the water content. The slope of the curve represents the deviation caused by the change in the unit water content.
In Equation (25), and are 0.2067 and 0. 0858 cm2/g, respectively, and , , and are related to the composition of the coal. Taking clean coal in the Linhuan plant as an example, the change in the measured ash content with the unit water content is shown in Table 3.
Table 3.
Relationship between the measured ash content and the moisture content of coal.
increases with an increase in the ash content, and is related to the ash content. If the ash content of coal is less than 10%, the measured value increases with an increase in the water content, but the reverse becomes the case if the ash content is greater than 10%. For coal samples with ash contents less than 14%, the measured value fluctuates within 0.05% with a 1% increase in the unit water content, whereas for coal samples with ash contents greater than 14%, the measured value fluctuates in the range of 0.2%. Since the tested ash content of the coal is between 8 and 10, the effect of moisture on the results of the ash meter is negligible, so the following discussion does not consider the effect of moisture.
3.4. Change in Metal-Oxide Content of Multimineral Coal
In practice, the ash contents of coal from different mines may be the same when measured using the combustion method. However, they could significantly differ when measured using a γ-ray ash monitor. As listed in Table 1, the magnesium and sulfur contents of Linhuan coal ash are very small. Therefore, only four high-Z elements were considered in this study, including silicon, aluminum, iron, and calcium. The γ-ray attenuation performances of these metal oxides were tested separately. The attenuation coefficients of Al2O3, SiO2, CaO, and Fe2O3 are listed in Table 4.
Table 4.
Attenuation coefficients of metal oxides.
Notably, we assume the attenuation coefficient of Al2O3 is 1, and that of other oxides are the ratios to that of Al2O3.
We have the following equation:
where Qm is the total adsorption attenuation coefficients of metal elements, and Ci and Di are the content and attenuation coefficients of metal oxides, respectively. The values of Qm for coal samples from the Suntuan and Xutuan mines are listed in Table 5.
Qm = CFe2O3 × DFe + CCaO × DCa + CSiO2 × DSi + CAl2O3 × DAl
Table 5.
Parameters for minerals from the Suntuan and Xutuan mines.
As shown in Figure 2, the relationship between Qm and K values measured using a monitor can be fitted with the following equation:
K = 0.01088 * Qm + 0.51234
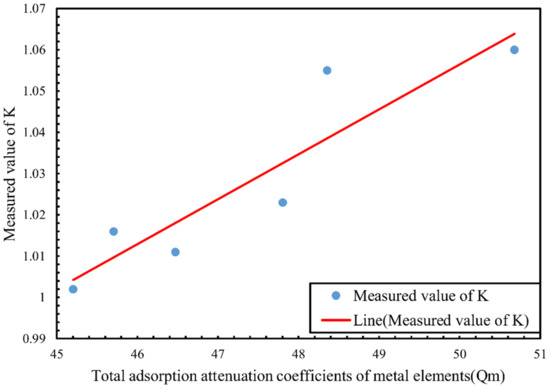
Figure 2.
Relationship between Qm and K values measured using a monitor (Suntuan and Xutuan mines).
K can also be calculated from Equation (26). As listed in Table 5, the calculated K values obtained by the theoretical formula Equation (26) are approximately equal to those measured using a monitor.
Based on Equation (7), there is a linear relationship between chemical tested Ad and the monitor measured K values. To verify the accuracy of this result, coal samples from the same mine were mixed in a certain proportion, and the recorded data are listed in Table 6.
Table 6.
Data of mixed coal from the same mine (Suntuan and Xutuan mines).
Based on Table 5 and Table 6, the chemical tested ash content and measured K values for the six coal samples from the Suntuan Mine could be linearly fitted (Figure 3). The slope, intercept, and linearity of the fitted curve are 23.45, −14.83, and 0.94, respectively, and those for coal samples from the Xutuan Mine are 33.85, −24.39, and 0.95, respectively.
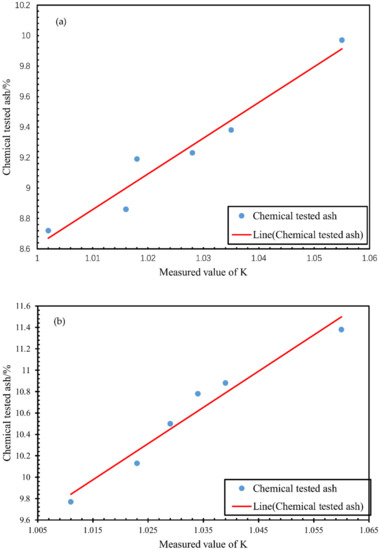
Figure 3.
Relationship between Ad and measured K for coal samples from the Suntuan Mine (a) and Xutuan Mine (b).
The type of coal washing is usually not singular in coal preparation plants; therefore, it is necessary to automatically change the slope and intercept parameters within the detector, when the system washes and processes different coal types, so a fast analysis method should be developed to determine the slope and intercept for coal types at each mixing ratio.
In summary, the ash content of mixed coal from different mines can be determined through the following procedure. First, Qm can be obtained by analyzing the ratios of chemical elements in the mixed coal. Second, the value of K can be calculated using the fitted regression equation between Qm and data from the ash monitor. Finally, the parameters, such as the slope and intercept, for the mixed coal can be obtained by fitting the calculated K and the ash content obtained through chemical tests. Table 7 shows the values of the calculated K and the monitor measured K in the case of mixed coal; using the above-mentioned method, the slope and intercept used in the case of mixed coal are obtained as 44.33 and −35.79, respectively, and the measured ash content of mixed coal is 9.91 according to Equation (7), while the chemical-tested ash content is 10.05.
Table 7.
Data of mixed coal.
4. Application of Dual-Energy γ-ray Ash Monitor in the Linhuan Coal Preparation Plant
4.1. Automatic Identification of Coal Type
There are 12 raw-coal bunkers in the western part of the Linhuan Coal Preparation Plant, and the coal from eight mines can be washing processed. To satisfy customers’ needs and diversify the clean coal products, coal blending is applied to production systems #1, #2, and #3 before washing. Coal can be blended in 19 ways, as listed in Table 8.
Table 8.
Coal blending and washing methods in the production systems.
The type of coal stored in each raw-coal bunker is fixed. The kind of coal to be washed can be determined by the operation feedback signal of the coal feeder. Then, the mix ratio of coal to be washed can be calculated from the operating frequency of the coal feeder. Information about the coal mix ratio can be transmitted to the dual-detector coal ash monitor; thus, parameters, such as the slope and intercept, can be set automatically in the ash monitor.
Theoretical analyses, site commissioning, and comparison of tested ash contents have shown that the parameters of an online ash monitor change significantly when the kinds and ratios of coal to be washed are different. Therefore, parameters, such as slopes and intercepts, for different coal proportions can be input into the ash monitor in advance. These parameters can be switched automatically when coal samples of different proportions are washed (Table 9, Table 10 and Table 11). In production systems #1, #2, and #3, the slope is usually set as 72.55 for raw coals in the Huaibei area, but the intercept changes when there is a large difference between the coals. For general coal preparation plants using dual energy gamma ray ash monitor, the slope and intercept mentioned in Equation (7) are generally fixed, which will cause large measurement errors. Taking Table 9 as an example, there is a gap between the slopes and intercepts of different coals. According to Equation (7), If the intercept of LFX is set to be the same as that of other mine types, i.e., −131, the ash value measured by the monitor will have a gap of 4.
Table 9.
Parameters for the online ash monitor in production system #1.
Table 10.
Parameters for the online ash monitor in production system #2.
Table 11.
Parameters for the online ash monitor in production system #3.
4.2. Analysis of Application Results
Coal from the western part of the Linhuan Coal Preparation Plant can be divided into coking coal, 1/3 coking coal, fat coal, and low-fat coal. The average ash content per day in April for coal in Linhuan measured using a dual-energy γ-ray ash monitor or through chemical tests are listed in Table 12.
Table 12.
Average ash content per day in April for coal in the western part of the Linhuan Coal Preparation Plant.
By comparing with tested ash content, the maximum, minimum, and average absolute errors for daily ash content measured in April are 0.45, 0.02, and 0.21, respectively; the average relative error is 2.18%. These values satisfy the measurement error range (±0.5% mean absolute error) of the gamma radiation coal ash meter specified in EJ/T1078-1998.
To verify the accuracy and reproducibility of the method, the daily ash content data in May has been given, as shown in Table 13. The difference of average absolute error and relative error is 0.01 and 0.21%, respectively.
Table 13.
Average ash content per day in May for coal in the western part of the Linhuan Coal Preparation Plant.
5. Conclusions
To resolve the current problems of dual-energy γ-ray ash monitors in the Linhuan Coal Preparation Plant, such as poor measurement accuracy and stability, we investigated the internal (the composition of multimineral and multicoal) and external factors affecting them; the following conclusions have been obtained:
- (1)
- The six high-Z elements have different degrees of influence on the measurement results, and this influence intensifies with the increase of ash content. The change would be most obvious in the measurement of ash content when the iron content changes, followed by calcium, aluminum, magnesium, silicon, and sulfur.
- (2)
- The deviation value of the ash content caused by ferromagnetic media is only related to the ash content of the coal, during the dense-medium coal preparation process. We should try to reduce the medium consumption in the process and make the residual medium in the tested coal as stable as possible.
- (3)
- When the ash content of coal is less than 10%, the measured value increases with an increase in the water content, but the reverse becomes the case if the ash content is greater than 10%. The measured value of ash content of high ash clean coal is more affected than that of low ash clean coal.
- (4)
- The method of determining parameters used in the case of coal blending has achieved ideal application effect in the Linhuan Coal Preparation Plant. By comparing with tested ash content, the average absolute error and relative error for daily ash content measured are 0.21 and 2.18% in April while the errors are 0.22 and 2.39% in May, respectively, and the difference of average absolute error and relative error is 0.01 and 0.21%. These values satisfy the measurement error range (±0.5% mean absolute error) of the gamma radiation coal ash meter specified in EJ/T1078-1998.
Author Contributions
Conceptualization, A.Y. and C.W. data curation, H.L.; formal analysis, C.W. and A.Y.; funding acquisition, H.L.; investigation, C.W. and H.L.; methodology, A.Y. and J.L.; project administration, F.W.; software, C.W. and L.W.; supervision, H.L. and S.H.; writing—original draft, J.L. and A.Y.; writing—review and editing, H.L. and C.W. All authors have read and agreed to the published version of the manuscript.
Funding
This work was supported by Postgraduate Scientific Research Project in Higher Education Institutions of Anhui Province (YJS20210398); Anhui Provincial Natural Science Foundation (2008085QE272); Youth Program of National Natural Science Foundation of China (52004009); China Postdoctoral Science Foundation (2020M671837); and Doctor Foundation of Anhui University of Science and Technology.
Institutional Review Board Statement
Not applicable.
Informed Consent Statement
Not applicable.
Data Availability Statement
The data presented in this study are available on request from the corresponding authors. The data are not publicly available because of the continuous research.
Conflicts of Interest
The authors declare no conflict of interest.
Nomenclature
| Intensity of rays without and with absorption, respectively | |
| Am241 counts measured by the detector in a certain time interval when there is no coal and when there is coal absorption, respectively | |
| Cs137 counts measured by the detector in a certain time interval when there is no coal and when there is coal absorption, respectively | |
| The mass thickness of the transmission coal (cm2/g), ρ is the bulk density of the coal (g/cm2), d is the thickness of the coal (cm) | |
| The total mass absorption coefficient | |
| The mass absorption coefficient of the photoelectric effect part | |
| The mass absorption coefficient of the active part of the Compton effect | |
| The mass absorption coefficient of the electron pair acting part | |
| The mass fraction of high Z elements in coal | |
| The mass attenuation coefficient of coal to Am241 rays, Cs137 rays, respectively | |
| The mass attenuation coefficients of high-Z elements and low-Z elements for Am241 rays, respectively | |
| Slope coefficient | |
| Intercept coefficient | |
| The ratio of the mass attenuation coefficient of coal to Am241 rays and Cs137 rays | |
| The mass fraction of element i in the high Z element | |
| The mass decay coefficients of element i and high Z elements other than i elements, respectively | |
| Ash content of coal (%) | |
| The mass ratio of ferromagnetic medium (kg/t) | |
| The mass Attenuation Coefficient of Ferromagnetic Medium (Fe3O4) for Am241 Ray | |
| The mass attenuation coefficient of Am241 Rays by coal mixed with ferromagnetic medium with mass ratio ε | |
| The measured value of coal ash mixed with residual medium | |
| The moisture content of coal | |
| The ratio of the mass attenuation coefficient of water-containing coal to Am241 rays and to Cs137 rays | |
| The mass attenuation coefficient of dry coal for Am241 rays and Cs137 rays, respectively | |
| The mass attenuation coefficient of hydrous coal for Am241 rays and Cs137 rays, respectively | |
| The ratio of mass attenuation coefficient of dry coal to Am241 rays and to Cs137 rays | |
| The difference of measured value K between the coal with the moisture content and the dry coal | |
| The difference of measured ash content between the coal with the moisture content in the coal and the dry coal | |
| The difference between chemical tested ash and monitor measured ash when is 10%, 20%, and 30%, respectively |
References
- Styszko-Grochowiak, K.; Gołaś, J.; Jankowski, H.; Koziński, S. Characterization of the coal fly ash for the purpose of improvement of industrial on-line measurement of unburned carbon content. Fuel 2004, 83, 1847–1853. [Google Scholar] [CrossRef]
- Legnaioli, S.; Campanella, B.; Pagnotta, S.; Poggialini, F.; Palleschi, V. Determination of Ash Content of coal by Laser-Induced Breakdown Spectroscopy. Spectrochim. Acta Part B At. Spectrosc. 2019, 155, 123–126. [Google Scholar] [CrossRef]
- Mikhailov, I.F.; Baturin, A.A.; Mikhailov, A.I.; Borisova, S.S.; Fomina, L.P. Determination of coal ash content by the combined x-ray fluorescence and scattering spectrum. Rev. Sci. Instrum. 2018, 89, 023103. [Google Scholar] [CrossRef] [PubMed]
- Yao, S.C.; Mo, J.H.; Zhao, J.B.; Li, Y.S.; Zhang, X.; Lu, W.Y.; Lu, Z.M. Development of a Rapid Coal Analyzer Using Laser-Induced Breakdown Spectroscopy (LIBS). Appl. Spectrosc. 2018, 72, 1225–1233. [Google Scholar] [CrossRef] [PubMed]
- Shan, Q.; Chu, S.N.; Jia, W.B. Monte Carlo simulation of moderator and reflector in coal analyzer based on a D-T neutron generator. Appl. Radiat. Isot. 2015, 105, 204–208. [Google Scholar] [CrossRef] [PubMed]
- Vardhan, R.H.; Giribabu. On-Line Coal-Ash Monitoring Technologies in Coal Washaries—A Review. Procedia Earth Planet. Sci. 2015, 11, 49–55. [Google Scholar] [CrossRef] [Green Version]
- Cierpisz, S.; Heyduk, A. A simulation study of coal blending control using a fuzzy logic ash monitor. Control. Eng. Pract. 2002, 10, 449–456. [Google Scholar] [CrossRef]
- Cierpisz, S.; Heyduk, A. Dynamics of On-Line Ash Monitors in Monitoring and Control Systems. Int. J. Coal Prep. Util. 2002, 22, 277–292. [Google Scholar] [CrossRef]
- Asfahani, J. Optimization of low activity spectrometric gamma–gamma probes for ash determination in Coal Stockpiles. Appl. Radiat. Isot. 2003, 58, 643–649. [Google Scholar] [CrossRef]
- Xiaolu, S.; Yuanhe, Y.; Chunxia, Z.; Yali, K. The Online Correction of Gamma-ray Ash Monitor in Coal Preparation Plant. Int. J. Coal Prep. Util. 2021, 41, 144–157. [Google Scholar]
- Dong, C.; Zhaosheng, T.; Fuhai, L. Dual-energy γ-ray determination of ash in coal based on chaos least squares support vector machines. J. Cent. South Univ. (Nat. Sci. Ed.) 2014, 45, 1510–1515. [Google Scholar]
- Gaft, M.; Dvir, E.; Modiano, H.; Schone, U. Laser Induced Breakdown Spectroscopy machine for online ash analyses in coal. Spectrochim. Acta Part B At. Spectrosc. 2008, 63, 1177–1182. [Google Scholar] [CrossRef]
- Fu, X.; Wang, R.-F.; Dong, Z.-Y. Application of a Shewhart control chart to monitor clean ash during coal preparation. Int. J. Miner. Process. 2017, 158, 45–54. [Google Scholar] [CrossRef]
- Zhang, Z.; Yang, J. Online Analysis of Coal Ash Content on a Moving Conveyor Belt by Machine Vision. Int. J. Coal Prep. Util. 2016, 37, 100–111. [Google Scholar] [CrossRef]
- Cierpisz, S.; Heyduk, A. Radiometric online ash monitor for coal industry using fuzzy logic. IEEE Trans. Instrum. Meas. 2001, 50, 1176–1180. [Google Scholar] [CrossRef]
- Sowerby, B.D.; Watt, J.S. Development of nuclear techniques for on-line analysis in the coal industry. Nucl. Instrum. Methods Phys. Res. Sect. A Accel. Spectrometers Detect. Assoc. Equip. 1990, 299, 642–647. [Google Scholar] [CrossRef]
- Dong, C.; Xiangdong, T.; Fuhai, L. Research on Method to Optimize Accuracy of γ-ray Backscatter Ash Analyzer. J. Hunan Univ. (Nat. Sci. Ed.) 2019, 46, 92–96. [Google Scholar] [CrossRef]
- Attix, F. Introduction to Radiological Physics and Radiation Dosimetry; Longman Inc.: New York, NY, USA, 2004; pp. 95–117. [Google Scholar] [CrossRef]
- Hong-chang, Y. Application of Online Coal Ash Monitor in China. Coal Process. Compr. Utli. 2006, 5, 79–81. [Google Scholar] [CrossRef]
- Sikora, T.; BĊdkowski, Z.; Smyáa, J. Automation of technological processes in a coal preparation plant and useful systems and devices for monitoring of coal quality. AGH J. Min. Geoengin. 2012, 36, 309–323. [Google Scholar]
- Zhikang, Z.; Yunshang, Z.; Qian, L. γ Radiation Coal Ash Analyzer; Atomic Energy Press: Beijing, China, 1999. [Google Scholar]
Publisher’s Note: MDPI stays neutral with regard to jurisdictional claims in published maps and institutional affiliations. |
© 2022 by the authors. Licensee MDPI, Basel, Switzerland. This article is an open access article distributed under the terms and conditions of the Creative Commons Attribution (CC BY) license (https://creativecommons.org/licenses/by/4.0/).