Article

Understanding Cd2+ Adsorption Mechanism on Montmorillonite Surfaces by Combining DFT and MD

1
College of Resources and Environment, Zunyi Normal University, Zunyi 563006, China
2
Department of Materials Science and Engineering, Anhui University of Science and Technology, Huainan 232001, China
*
Author to whom correspondence should be addressed.
Processes 2022, 10(7), 1381; https://doi.org/10.3390/pr10071381
Submission received: 13 June 2022 / Revised: 13 July 2022 / Accepted: 13 July 2022 / Published: 14 July 2022

Abstract

:
The adsorption mechanism of Cd2+ on different cleavage planes of montmorillonite was investigated using density functional theory (DFT) calculations and molecular dynamics (MD) simulations. The most stable adsorption energies of Cd2+ on the (001) and (010) surfaces were −88.74 kJ/mol and −283.55 kJ/mol, respectively. On the (001) surface, Cd2+ was adsorbed on the centre of the silicon–oxygen ring by electrostatic interactions, whereas on the (010) surface, Cd2+ was adsorbed between two ≡Al–OH groups and formed two covalent bonds with O, which was mainly due to the interaction between the Cd s and O p orbitals. Upon the partial substitution of Na+ by Cd2+, Cd2+ was adsorbed on the (001) surface as inner-sphere surface complexes, with a hydration number of 5.01 and a diffusion coefficient of 0 m2/s. Whereas, when Cd2+ completely replaced Na+, part of the Cd2+ moved from the inner-sphere surface complexes to the outer-sphere surface complexes owing to its competitive adsorption. In this case, its hydration number became 6.05, and the diffusion coefficient increased to 1.83 × 10⁻¹⁰ m2/s. This study provides the theoretical background necessary for the development of montmorillonite-based adsorbents.

1. Introduction

The main sources of Cd2+ in water are the electroplating industries, mining operations, and washing, in addition to dye and alloy manufacturing [1]. Cd2+ is not only non-biodegradable but is also toxic and a threat to public health. Consequently, various methods have been employed for its removal, such as chemical precipitation, evaporation, extraction, ion exchange, electrochemical treatment, and membrane filtration. However, these processes have several disadvantages including their high costs and complexity [2].
Montmorillonite and other clay minerals have been used as adsorption materials due to their low cost, easy access, large specific surface area, and strong surface charge [3]. Currently, adsorbent materials are mainly obtained by changing their particle size or composition. For example, Song et al. [4,5] reported the synthesis of chitosan-2D montmorillonite with good adsorption properties for Pb2+ by the stripping and modification of montmorillonite. Yin et al. [6] investigated the removal of Pb2+ from aqueous solutions by nano illite/smectite clay and revealed that the adsorption patterns followed the Langmuir adsorption isotherm models. The adsorption process was endothermic, and Pb2+ was removed by 99.45%. Chen et al. [7] reported the synthesis of a waste-paper montmorillonite composite aerogel to adsorb Cd2+ by ambient pressure drying technology followed by modification with NaOH or H2O2, and the NaOH-modified aerogel revealed a maximum adsorption capacity of 232.5 mg/g. In most of the studies, montmorillonite adsorption of heavy metal ions has been investigated on the macroscopic level; only a limited number of studies have discussed the adsorption mechanisms at the microscopic scale. Recently, density functional theory (DFT) calculations and molecular dynamics (MD) simulations have been employed to understand the ion adsorption mechanism. For example, Min et al. [8] investigated the adsorption of Ca(OH)+ on montmorillonite (001) and (010) surfaces by DFT, and the results revealed that the cations were adsorbed on the (001) surface electrostatically and on the (010) surface via hydrogen bonds. Furthermore, Chen et al. [9,10] concluded via DFT that the selectivity of flotation agents to minerals and ions is related to the symmetry of the molecular orbitals. Peng et al. [11,12] relied on MD to study the adsorption of NH4+ between montmorillonite layers and found that the interaction of NH4+ and water molecules between these layers were affected by surface lattice substitution, charge, and the content of water stratification. However, DFT has limited accuracy in the presence of a large number of molecules due to the numerous calculations involved. Conversely, MD simulations can be applied to systems with a large number of molecules but cannot explore the mechanism of the chemical bonding.
In this study, the advantages of DFT and MD were combined in order to reveal the microscopic mechanism of Cd2+ adsorption on montmorillonite. The simple adsorption models of anhydrous montmorillonite were calculated by DFT to investigate the adsorption process, while the complex water–clay mineral interface adsorption models were calculated by MD to reveal the adsorption kinetics of Cd2+.

2. Model and Calculation

2.1. Density Functional Theory Calculations

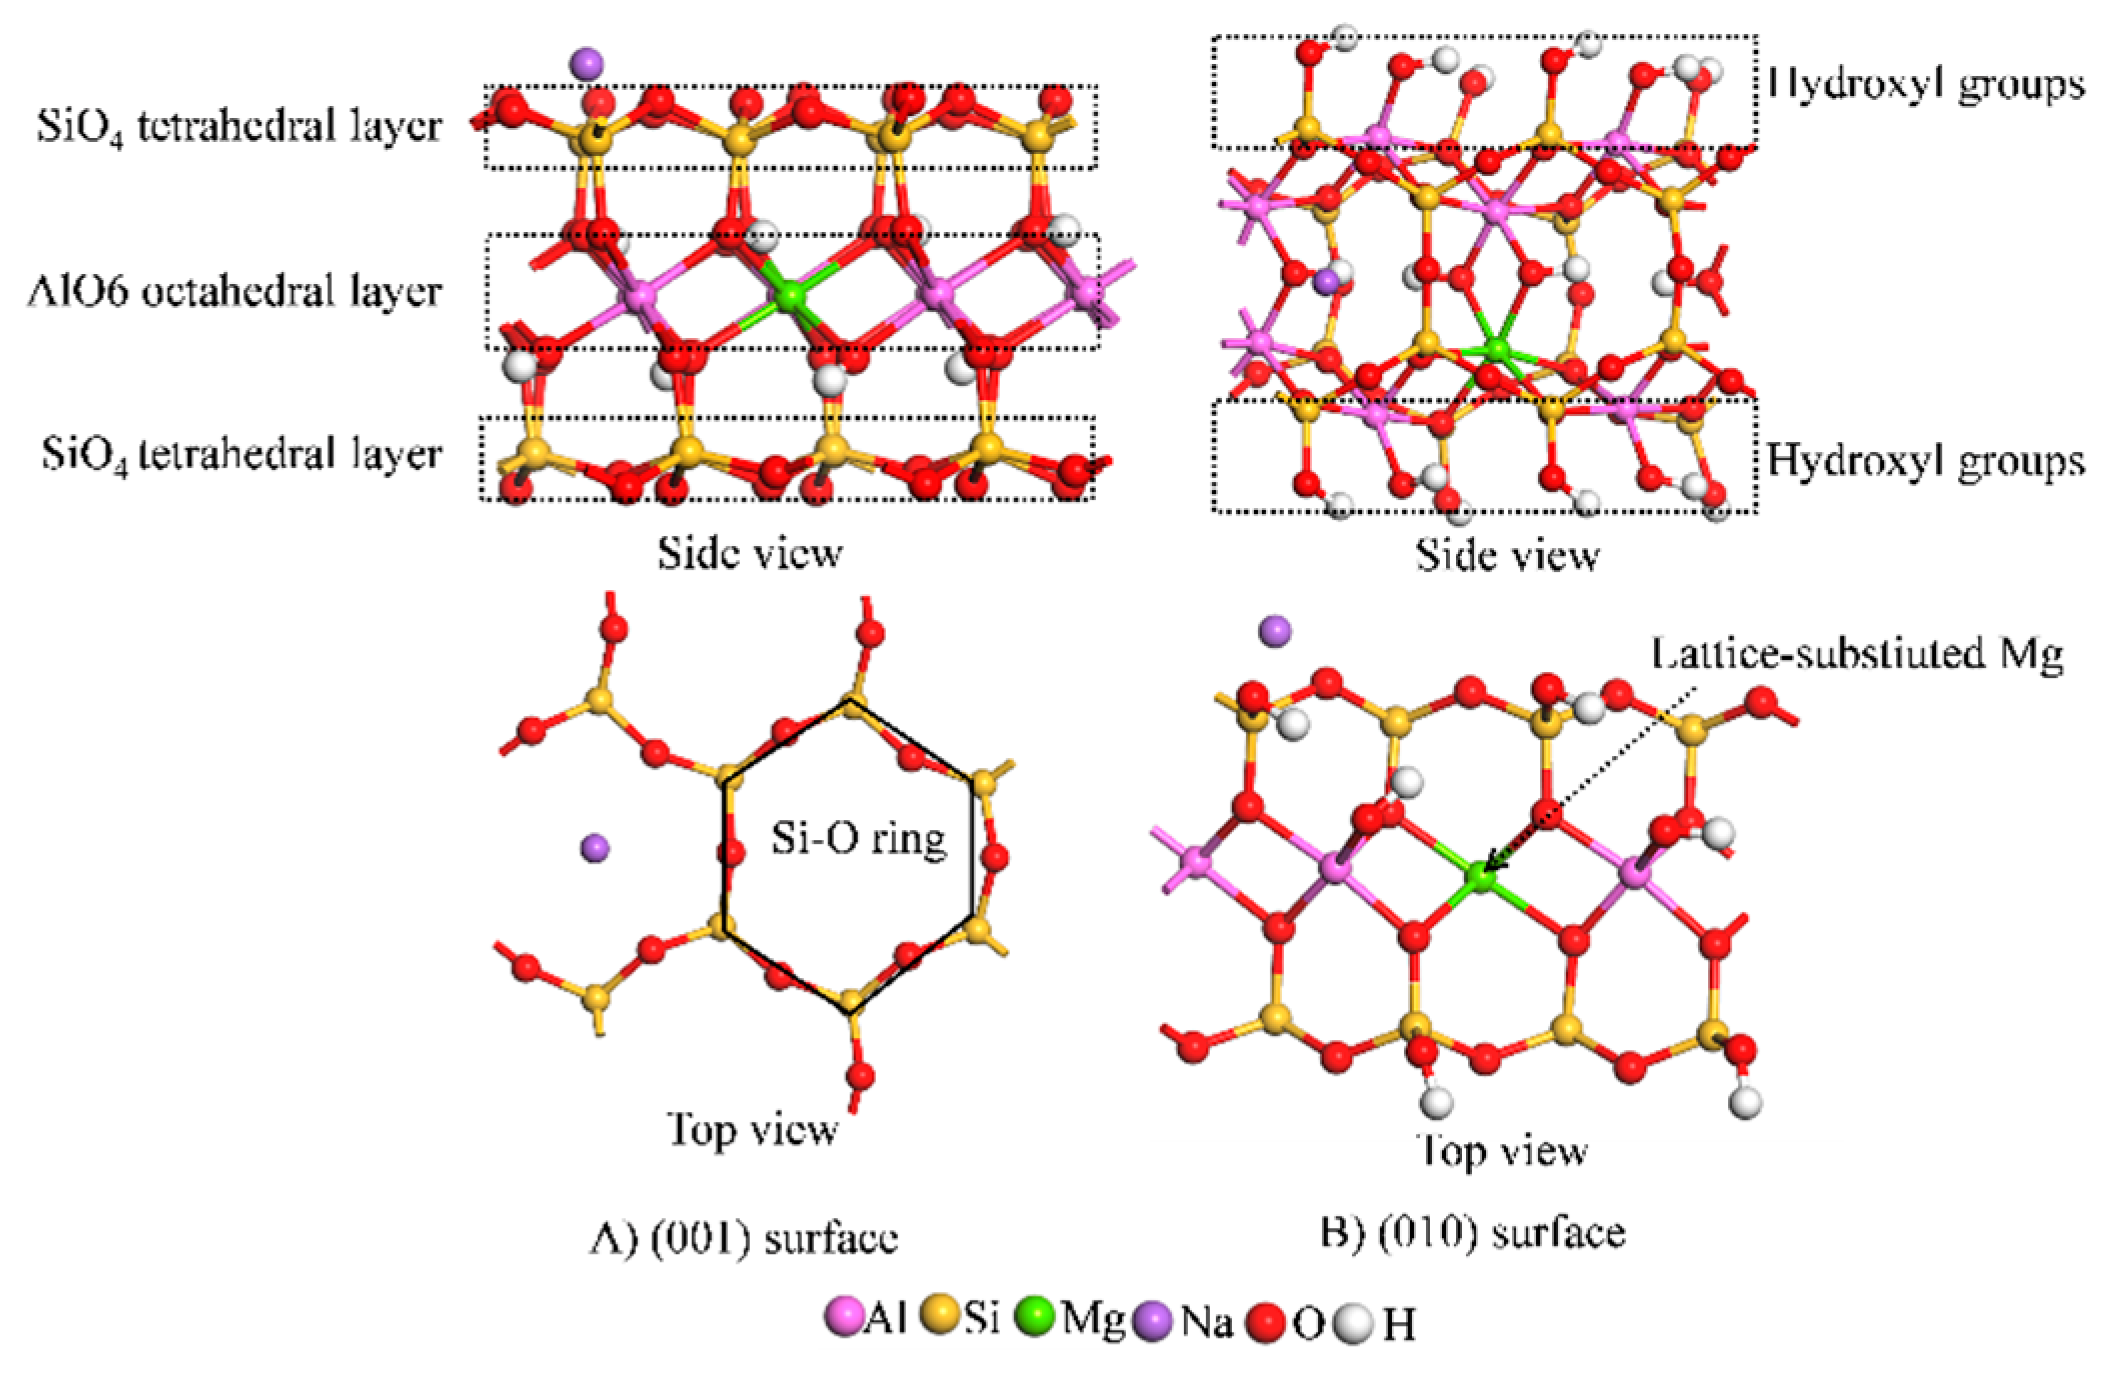
2.1.1. Model Construction

The Wardle model [13] was adopted for the montmorillonite crystal cells. To meet the structural requirements of montmorillonite, 2 × 1 × 1 supercrystal cells were constructed, lattice substitution was set, and the chemical formula of the final cell was Na0.5Al3.5Mg0.5Si8O20(OH)4. To study the adsorption mechanism of Cd2+ on different crystal planes of montmorillonite, the (001) and (010) surfaces were constructed, and a vacuum layer of 15 Å was added above the surface to avoid periodic influence (Figure 1). The montmorillonite (001) surface is composed of two sheets of tetrahedral (T) SiO4 enclosing a sheet of octahedral (O) AlO6 resulting in a TOT structure (Figure 1A). Substituting Al3+ by Mg2+ in the AlO6 octahedral layer renders the surface negatively charged, which can become neutral upon absorbing cations from the environment. Consequently, competitive adsorption exists between the cations and the surface. In the (010) surface (Figure 1B), the exposed Si and Al form hydroxyl groups, such as ≡Si-OH and ≡Al-OH [11]. The model was constructed to obtain a (001) surface and a (010) surface with 81 and 93 atoms, respectively.

2.1.2. Calculation Method

The DFT calculations were performed with the Dmol3 module [14,15] of the Materials Studio 2017 software. The parameters for the structural calculation of the montmorillonite model were optimised according to the following conditions: The Perdew–Burke–Ernerhof (PBE) was selected as the correlation functional using the generalised gradient (GGA) [16], the Grimme dispersion correction was set [17], and the all-electronic system calculation was performed. Moreover, the centre base group of the double numerically positively polarised (DNP) atom was selected, and the BFGS optimisation algorithm was used to set the self-consistent field convergence accuracy to 1 × 10⁻⁶ eV/atom. The convergence criteria of the geometric optimisation were as follows: the maximum atomic displacement was 5 × 10⁻³ Å, the maximum interatomic force was 2 × 10⁻³ Ha/Å, and the total energy change of the system was 1 × 10⁻⁵ Ha. All calculations were carried out in reciprocal space, and the sampling at the k-point in the Brillouin zone [18] was 1 × 2 × 1.
The surface models and adsorption system were optimised using the exchange-correlation function and convergence criteria in consistency with those of the crystal cell. To avoid the operation of the adsorption system in a vacuum, the Conductor-like Screening Model (COSMO) model was selected, water was chosen as the adsorption environment, the dielectric constant was 78.54, and the charged neutrality of the adsorption system was realised by lattice substitution or the addition or removal of equilibrium ions. For structural optimisation, the k-point was limited to the г point. Cd2+ was in a 15 × 15 × 15 Å3 space. The optimisation criteria were consistent with those of the surface model.
The adsorption energy of Cd2+ on montmorillonite surfaces was calculated according to Equation (1):
E ads = E [ MMT Cd ] E [ MMT ] E [ Cd ]
where Eads is the adsorption energy of Cd2+ on montmorillonite surfaces, E[MMT-Cd] is the energy of the configuration after adsorption, E[MMT] is the energy of the montmorillonite configuration before adsorption, and E[Cd] is the energy of Cd2+. The Eads of the adsorption reaction is negative, and a larger absolute value leads to a more stable adsorption configuration.
In this work, DFT was used in combination with the COSMO model to self-consistently include the influence of aqueous solvation, which can greatly improve the calculation efficiency. However, in real case scenarios, both cations and mineral surfaces form hydrated layers in aqueous solutions. These hydrated cations gradually displace the water molecules in the hydrated layer before interacting with the surface. Consequently, the adsorption energy calculated in this study is larger than the actual value.

2.2. Molecular Dynamics Calculation

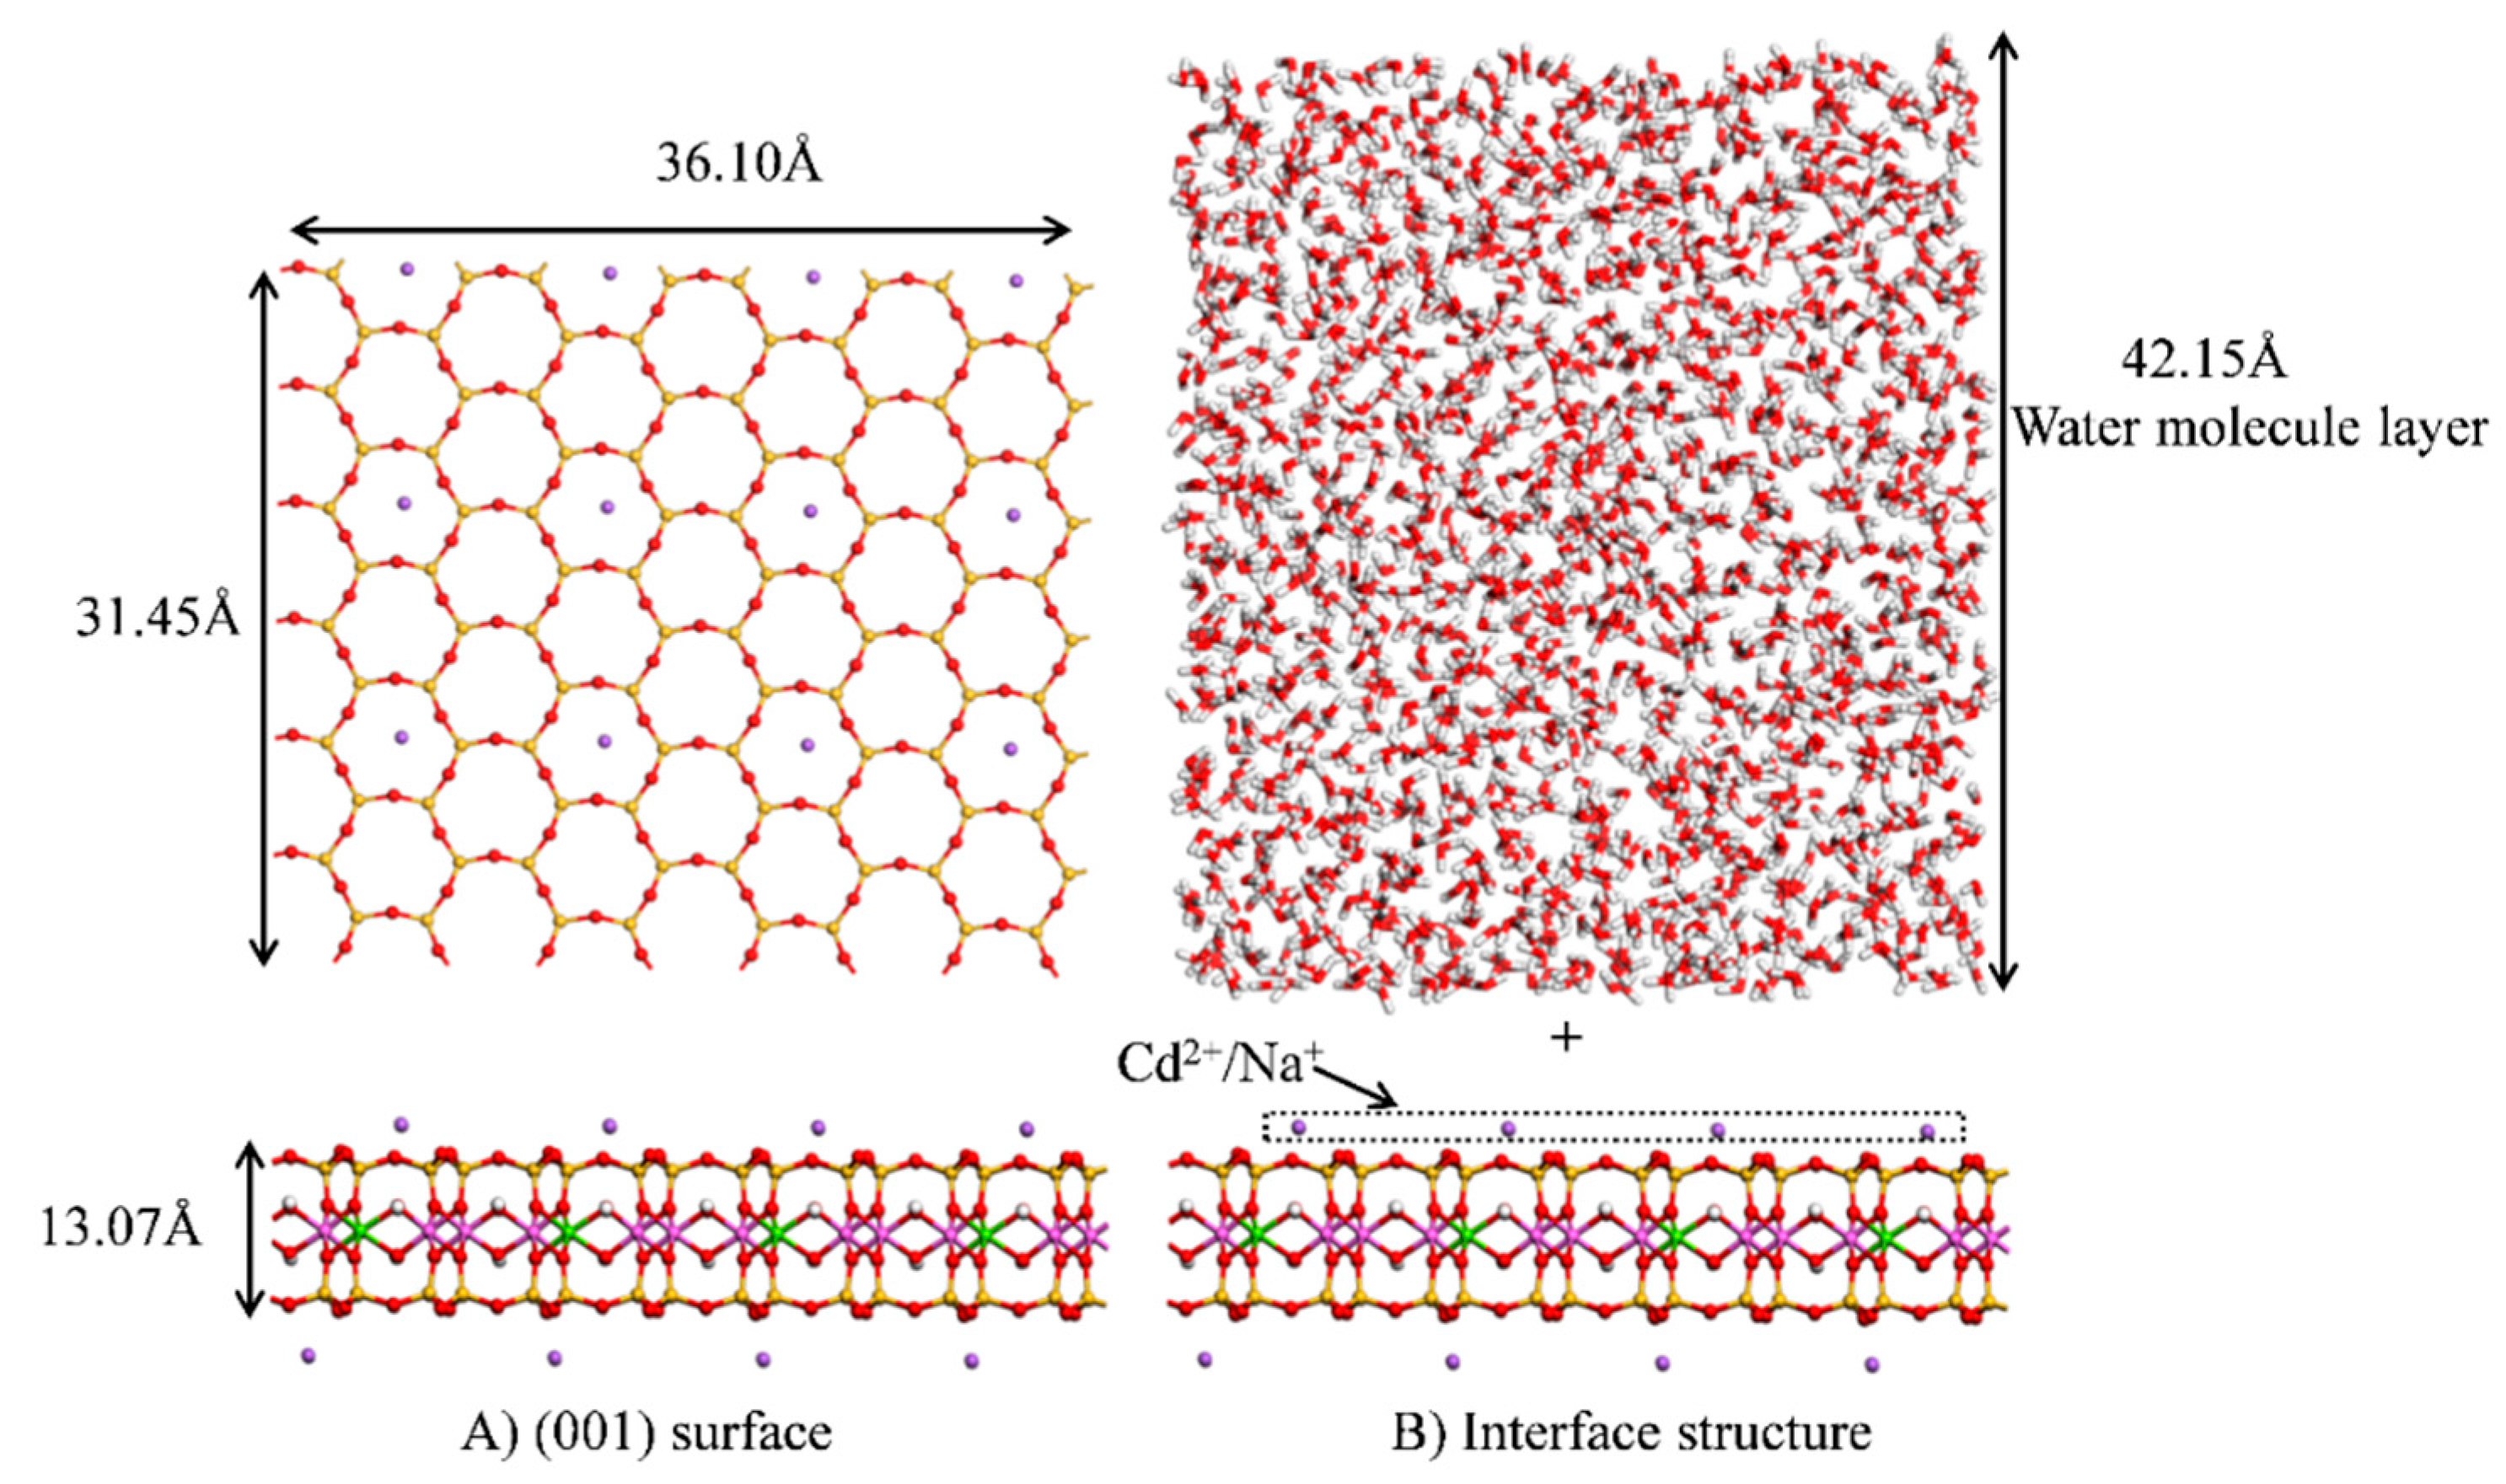
2.2.1. Construction of the Model

Interactions occur between ions, water molecules, and mineral surfaces at the montmorillonite interface. Consequently, an interface model of montmorillonite was constructed to reveal the adsorption mechanism of Cd2+ (Figure 2). The (001) face of montmorillonite, obtained from a previous DFT model and having the chemical composition Na0.5Al3.5Mg0.5Si8O20(OH)4, was selected. Figure 2A shows the model of the montmorillonite (001) surface with a surface size of 36.10 × 31.45 Å2 and a thickness of 13.07 Å, whereas Figure 2B shows the interface model of montmorillonite. A hydration layer with a thickness of 42.15 Å (1600 water molecules and density of 1 g/cm3) was added in the normal direction of the (001) surface and a vacuum layer of 80 Å was added above the water molecular layer to avoid periodic interactions between the upper and lower layers of the structure. Since Na+ exposed on the (001) surface can undergo exchange adsorption with cations present in the solution [19], this study considered the cation exchange capacity (CEC) of Na+ by Cd2+ and CEC was set to 1/3, 2/3, and 1 to investigate the adsorption of cations at the interface.

2.2.2. MD Simulations

The Forcite module of Materials Studio 2017 software was adopted, and the ClayFF force field [20,21,22] was selected for the simulation calculations. First, the interface structure of montmorillonite was optimised to reduce unreasonable contact between water molecules, ions, and the surface. The dynamics of the montmorillonite interface were then calculated according to the following conditions: the ensemble was selected as NVT (number of simulated particles, simulation cell volume, and temperature), and Gaussian distribution was used to randomly set the initial speed of the interface molecules, the temperature was controlled at 298 K by the nose method, the step size was 1 fs, and the calculation time was 200 ps to balance the interface system. Once the energy and temperature of the interface system reached equilibrium, the dynamic calculation was continued. The calculation time was set to 200 ps and data were collected every 100 fs to calculate the dynamic properties of the interface system.

3. Discussion

3.1. DFT

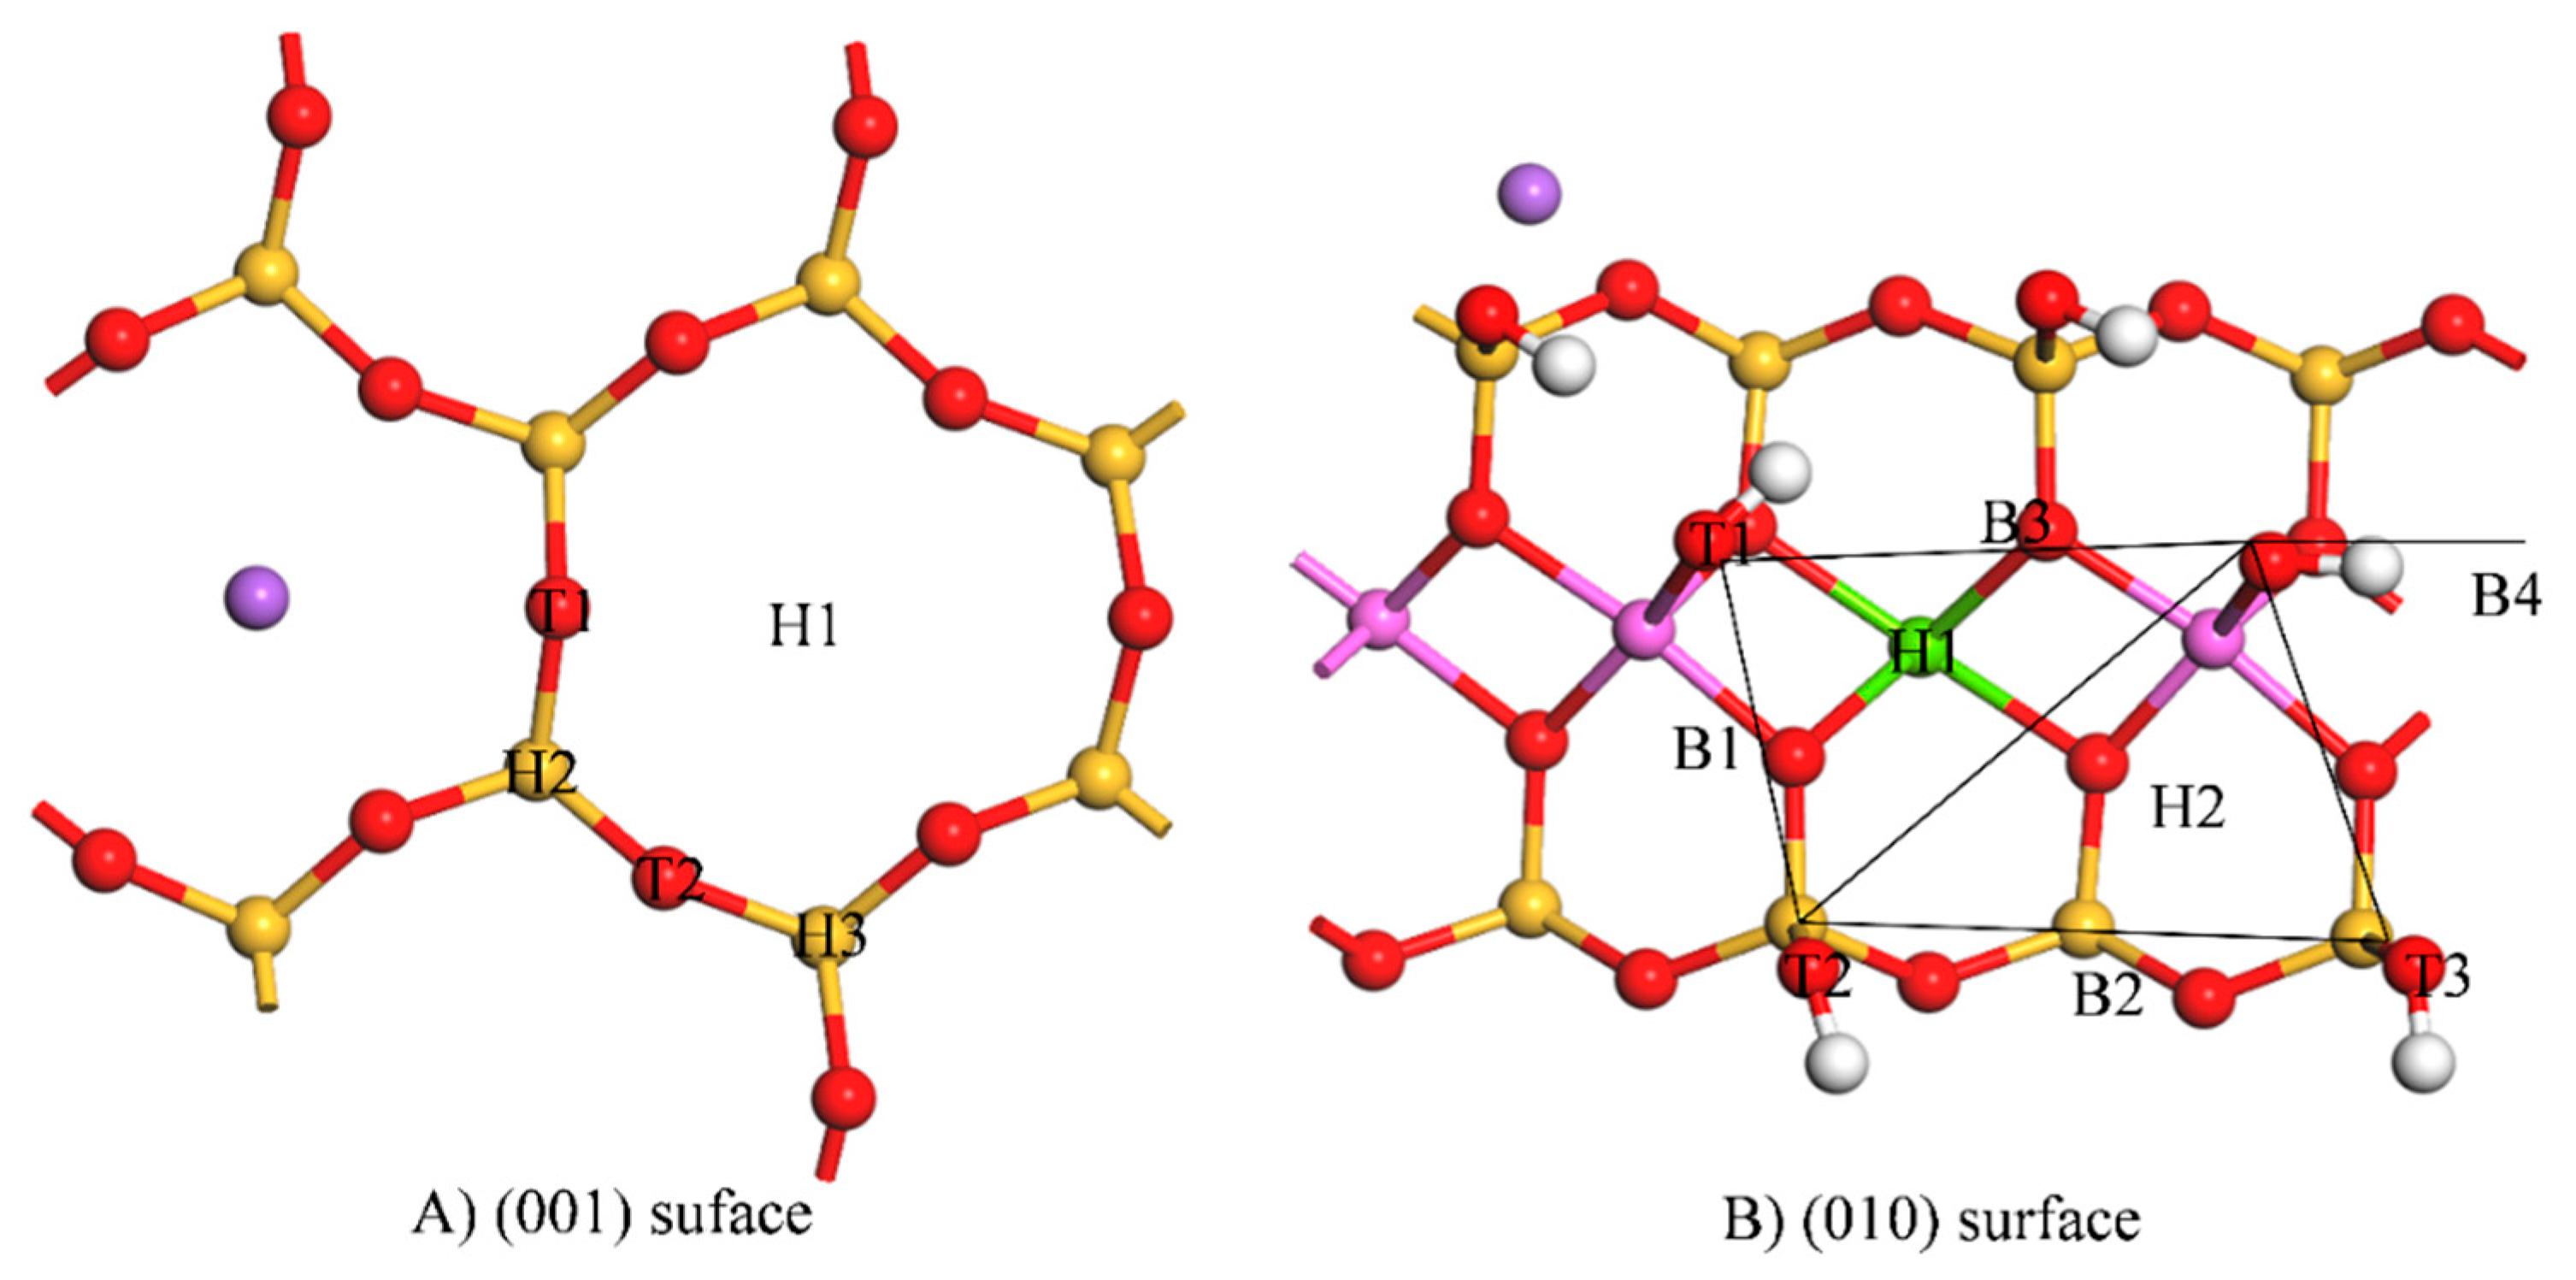
3.1.1. Initial Adsorption Position and Adsorption Energy

Taking into account the symmetries of the (001) and (010) surfaces and the reactivity of the surface, the initial adsorption sites of Cd2+ on the montmorillonite surface were set (Figure 3). In Figure 3A, the holes above and between the oxygen atoms of the silicon–oxygen ring and oxygen atoms were mainly on the (001) surface with five adsorption sites, mainly T1–T2 and H1–H3. On the montmorillonite (010) surface (Figure 3B), the main influence considered was that of the hydroxyl groups, and the bridge sites B1–B3, top sites T1–T3, and acupuncture points H1–H3 were set. In addition, the configurations of the different initial bits were optimised using DFT (Table 1). Through structural optimisation, the interactions between Cd2+ and the surface atoms caused the adsorption sites to migrate. On the (001) surface, the adsorption energy of Cd2+ ranged from −44.11 to 88.74 kJ/mol. The final adsorption sites were H1 and H3, and the adsorption energy of H3 was −44.11 kJ/mol. The adsorption energy of water molecules on the (001) surface ranged from −24.96 to −62.40 kJ/mol [23], and consequently, the adsorption sites of H3 were easily occupied by water molecules. On the (010) surface, the adsorption energy of Cd2+ ranged from −178.53 to −283.55 kJ/mol which was much higher than that on the (001) surface, and the maximum adsorption energy was located at B4. The adsorption energy of the water molecules on the montmorillonite surface (010) ranged from −30.72 to 82.56 kJ/mol [23]. The adsorption of Cd2+ on (010) was much larger than that of the water molecules, and hence it can drain boiling water molecules and act directly on the (010) surface.

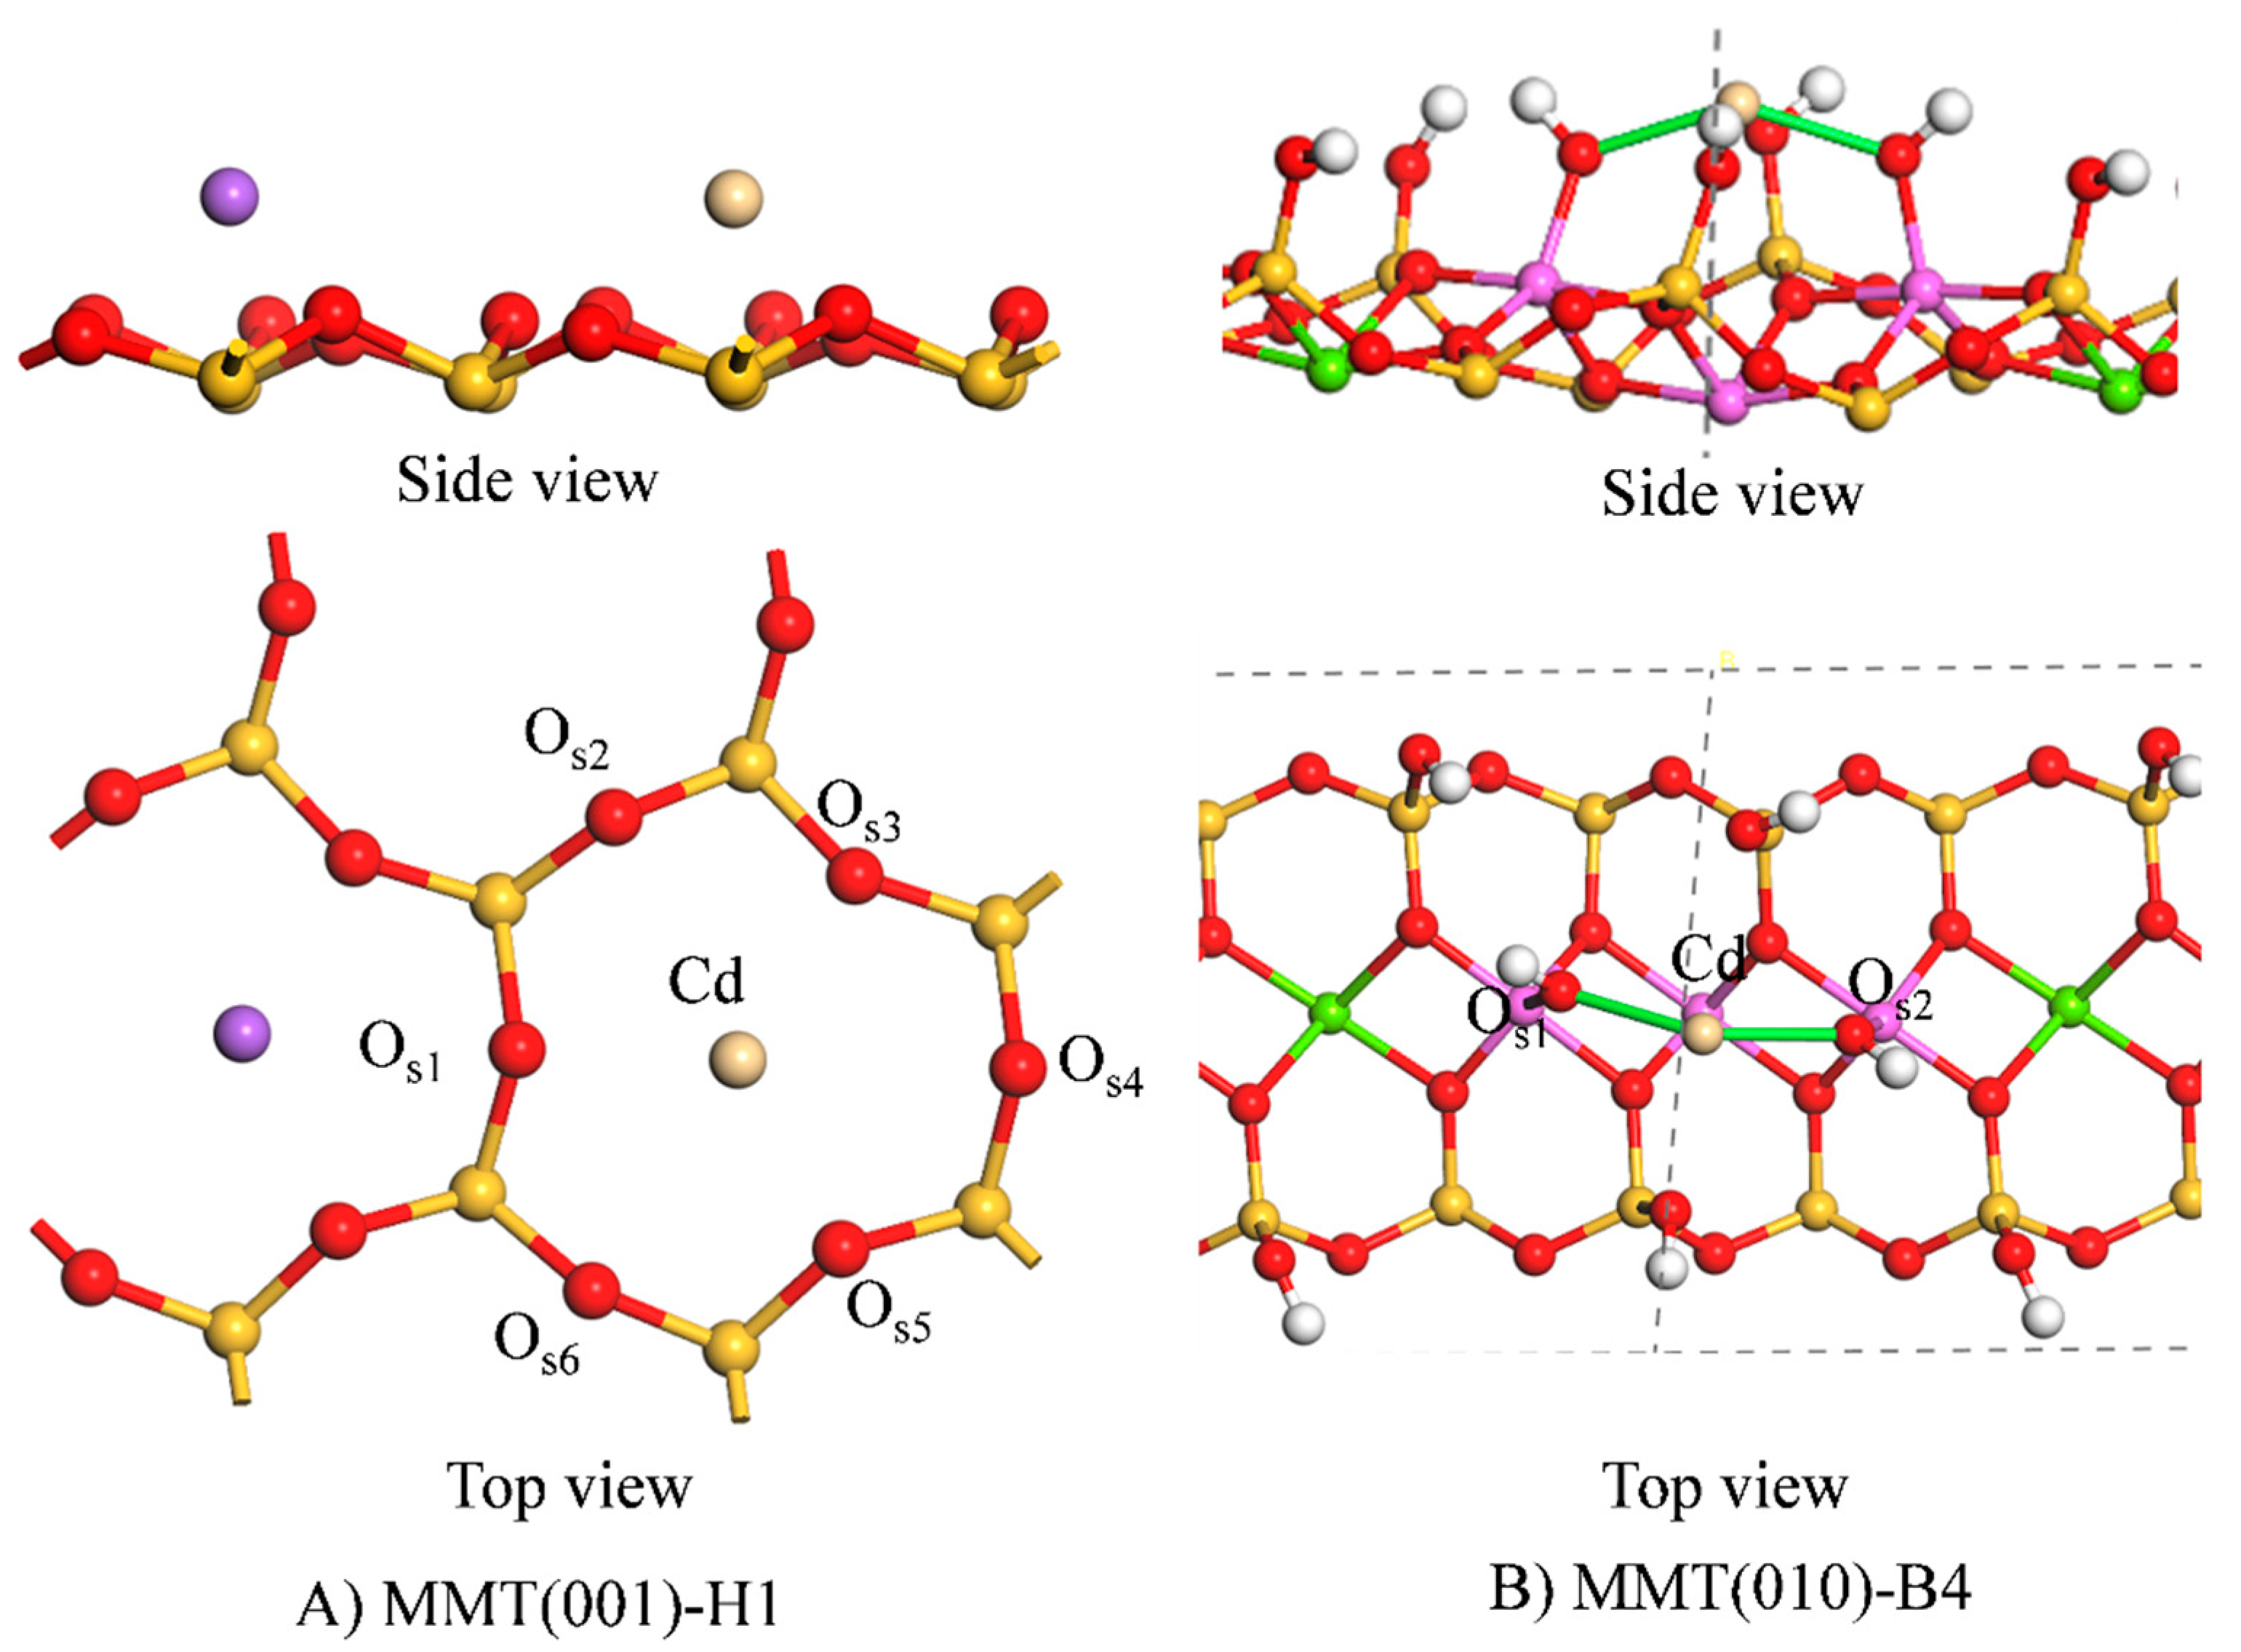
3.1.2. Adsorption Configuration

To further reveal the adsorption mechanism of Cd2+ on montmorillonite surfaces, the most stable adsorption configurations on different surfaces were selected. Figure 4 shows the stable adsorption configurations, and Table 2 lists the configuration parameters. Figure 4A shows the most stable adsorption configuration of Cd2+ on the (001) surface, which was mainly MMT(001)-H1. Cd2+ was adsorbed at the centre of the silicon–oxygen ring at 1.1 Å away from (001) surface, and the distance between Cd2+ and the surface oxygen atom OSn (n = 1–6) was between 2.533 and 3.151 Å. According to a previous study [24], montmorillonite has strong electronegativity at the centre of the silica ring, thus electrostatic adsorption occurred between the (001) surface and Cd2+. In solution, a hydration layer was formed between Cd2+ and water molecules due to electrostatic interactions. The maximum hydration distance between Cd2+ and O in the first layer can reach 3.02 Å, and in the second layer, it can reach 5.29 Å [25]. The distance between Cd2+ and OSn (n = 1–6) was in the range of 2.533–3.151 Å, hence Cd2+ and the (001) surface can facilitate internal spherical adsorption under electrostatic interaction. When Cd2+ was adsorbed on the (001) surface, the distance between Na+ and the surface increased from 0.7 Å to 1.3 Å, owing to the competitive adsorption between Na+ and Cd2+, which weakened the interaction between Na+ and the surface. The surface can also adsorb other heavy metal cations via electrostatic interactions and the order of adsorption is determined by the strength of the cations’ charge density. In fact, cations with a stronger charge density are preferentially adsorbed on the surface which is in agreement with the results of Abollino et al. [26].
Figure 4B shows the most stable adsorption configuration of Cd2+ on the (010) surface, MMT(010)–B4. Cd2+ was adsorbed in the bridge position between two ≡Al-OH groups and formed covalent bonds with Os1 and Os2 on the (010) surface with bond lengths of 2.209 Å and 2.210 Å, respectively. This was mainly attributed to the substitution of Mg2+ with Al3+ in the AlO6 octahedron of montmorillonite, which leads to a high pH in the surrounding ≡Al-OH, thus increasing the activity of ≡Al-OH [27]. According to the Lewis acids and bases, transition metal ions similar to Cd2+, such as Cu2+, Zn2+, Ni2+, can coordinate with the surface via ≡Al-OH. Consequently, to improve the adsorption capacity of these cations, the hydroxyl groups on the (010) surface can be regulated by modifying the pH.

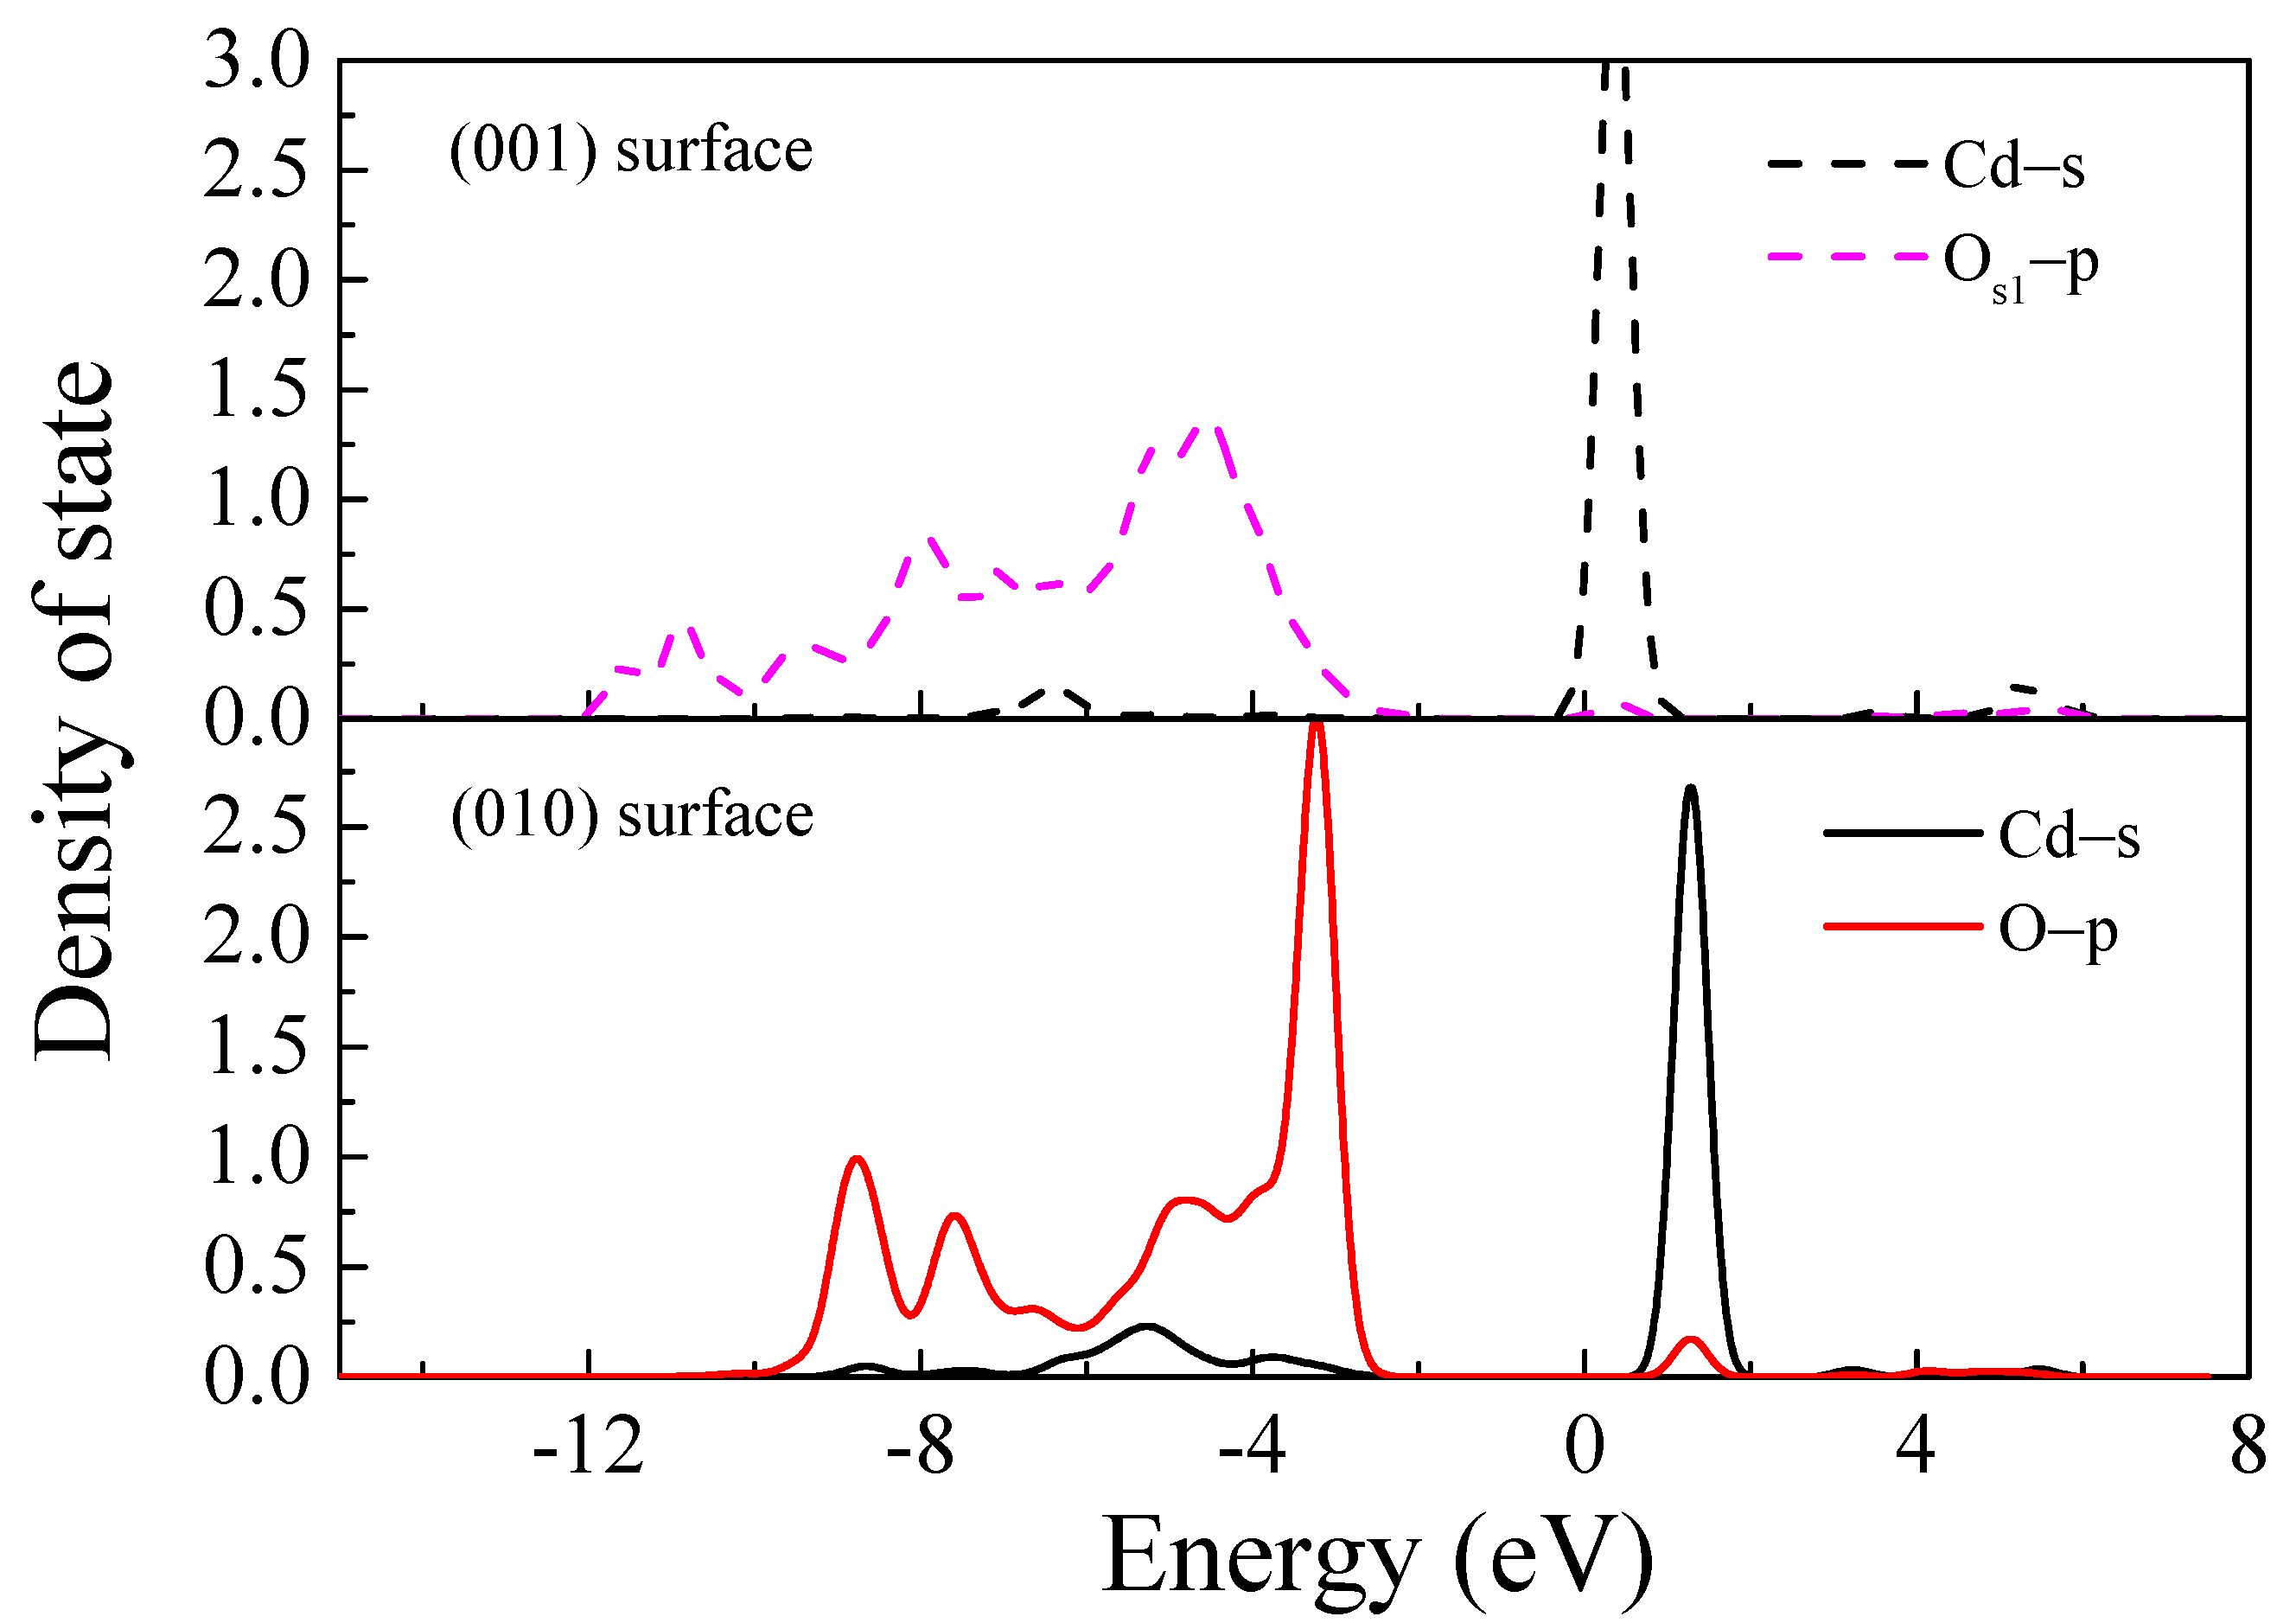
3.1.3. Local State Density Analysis

In the state density analysis, the interaction between atomic orbitals of appropriate symmetry results in the formation of chemical bonds [28,29,30]. Antibonding orbitals form alongside bonding orbitals, and the energy range corresponding to the overlap between the orbitals reflects the bonding strength. To further analyse the bonding mechanism, Cd and OS1 of MMT(001)-H1 and MMT(010)-B4 were selected. Figure 5 shows the state densities of Cd and OS1. On the (001) surface, the Cd s orbital interacted with the OS1 p orbital in the range −5.8 to ~−7.5 eV which resulted in bonding (mainly the OS1 p orbital), whereas antibonding was observed at −0.5–1 eV and 4.5–6 eV (mainly the Cd s orbital). The antibonding orbital was stronger than the bonding, and delocalisation was strong. Consequently, bonding did not occur between Cd and OS1. The Cd s orbital crossed the Fermi level, indicating the strong chemical activity of Cd, which can provide adsorption sites for desorption agents and facilitate cation desorption.
On the (010) surface, the Cd s orbital interacted with the Os1 p orbital at −2 to −10 eV to form the bond (mainly the Os1 p orbital), and the antibond was formed at 0.5–2 eV (mainly the Cd s orbital). The bonding strength was stronger than that of the antibond, and the covalence was strong, which resulted in a σ bond.

3.2. MD Simulations

Based on the DFT results, the adsorption energy of Cd2+ on the (010) surface was large, and consequently, it can directly form covalent bonds with the O atoms of the surface hydroxyl groups. However, on the (001) surface, Cd2+ was mainly electrostatically adsorbed on the surface, and the adsorption energy was small, leading to competitive adsorption at the montmorillonite interface. Cation and surface hydration were neglected in the DFT calculations. Consequently, MD simulations were employed to further analyse the interaction between hydrated cations and the surface.

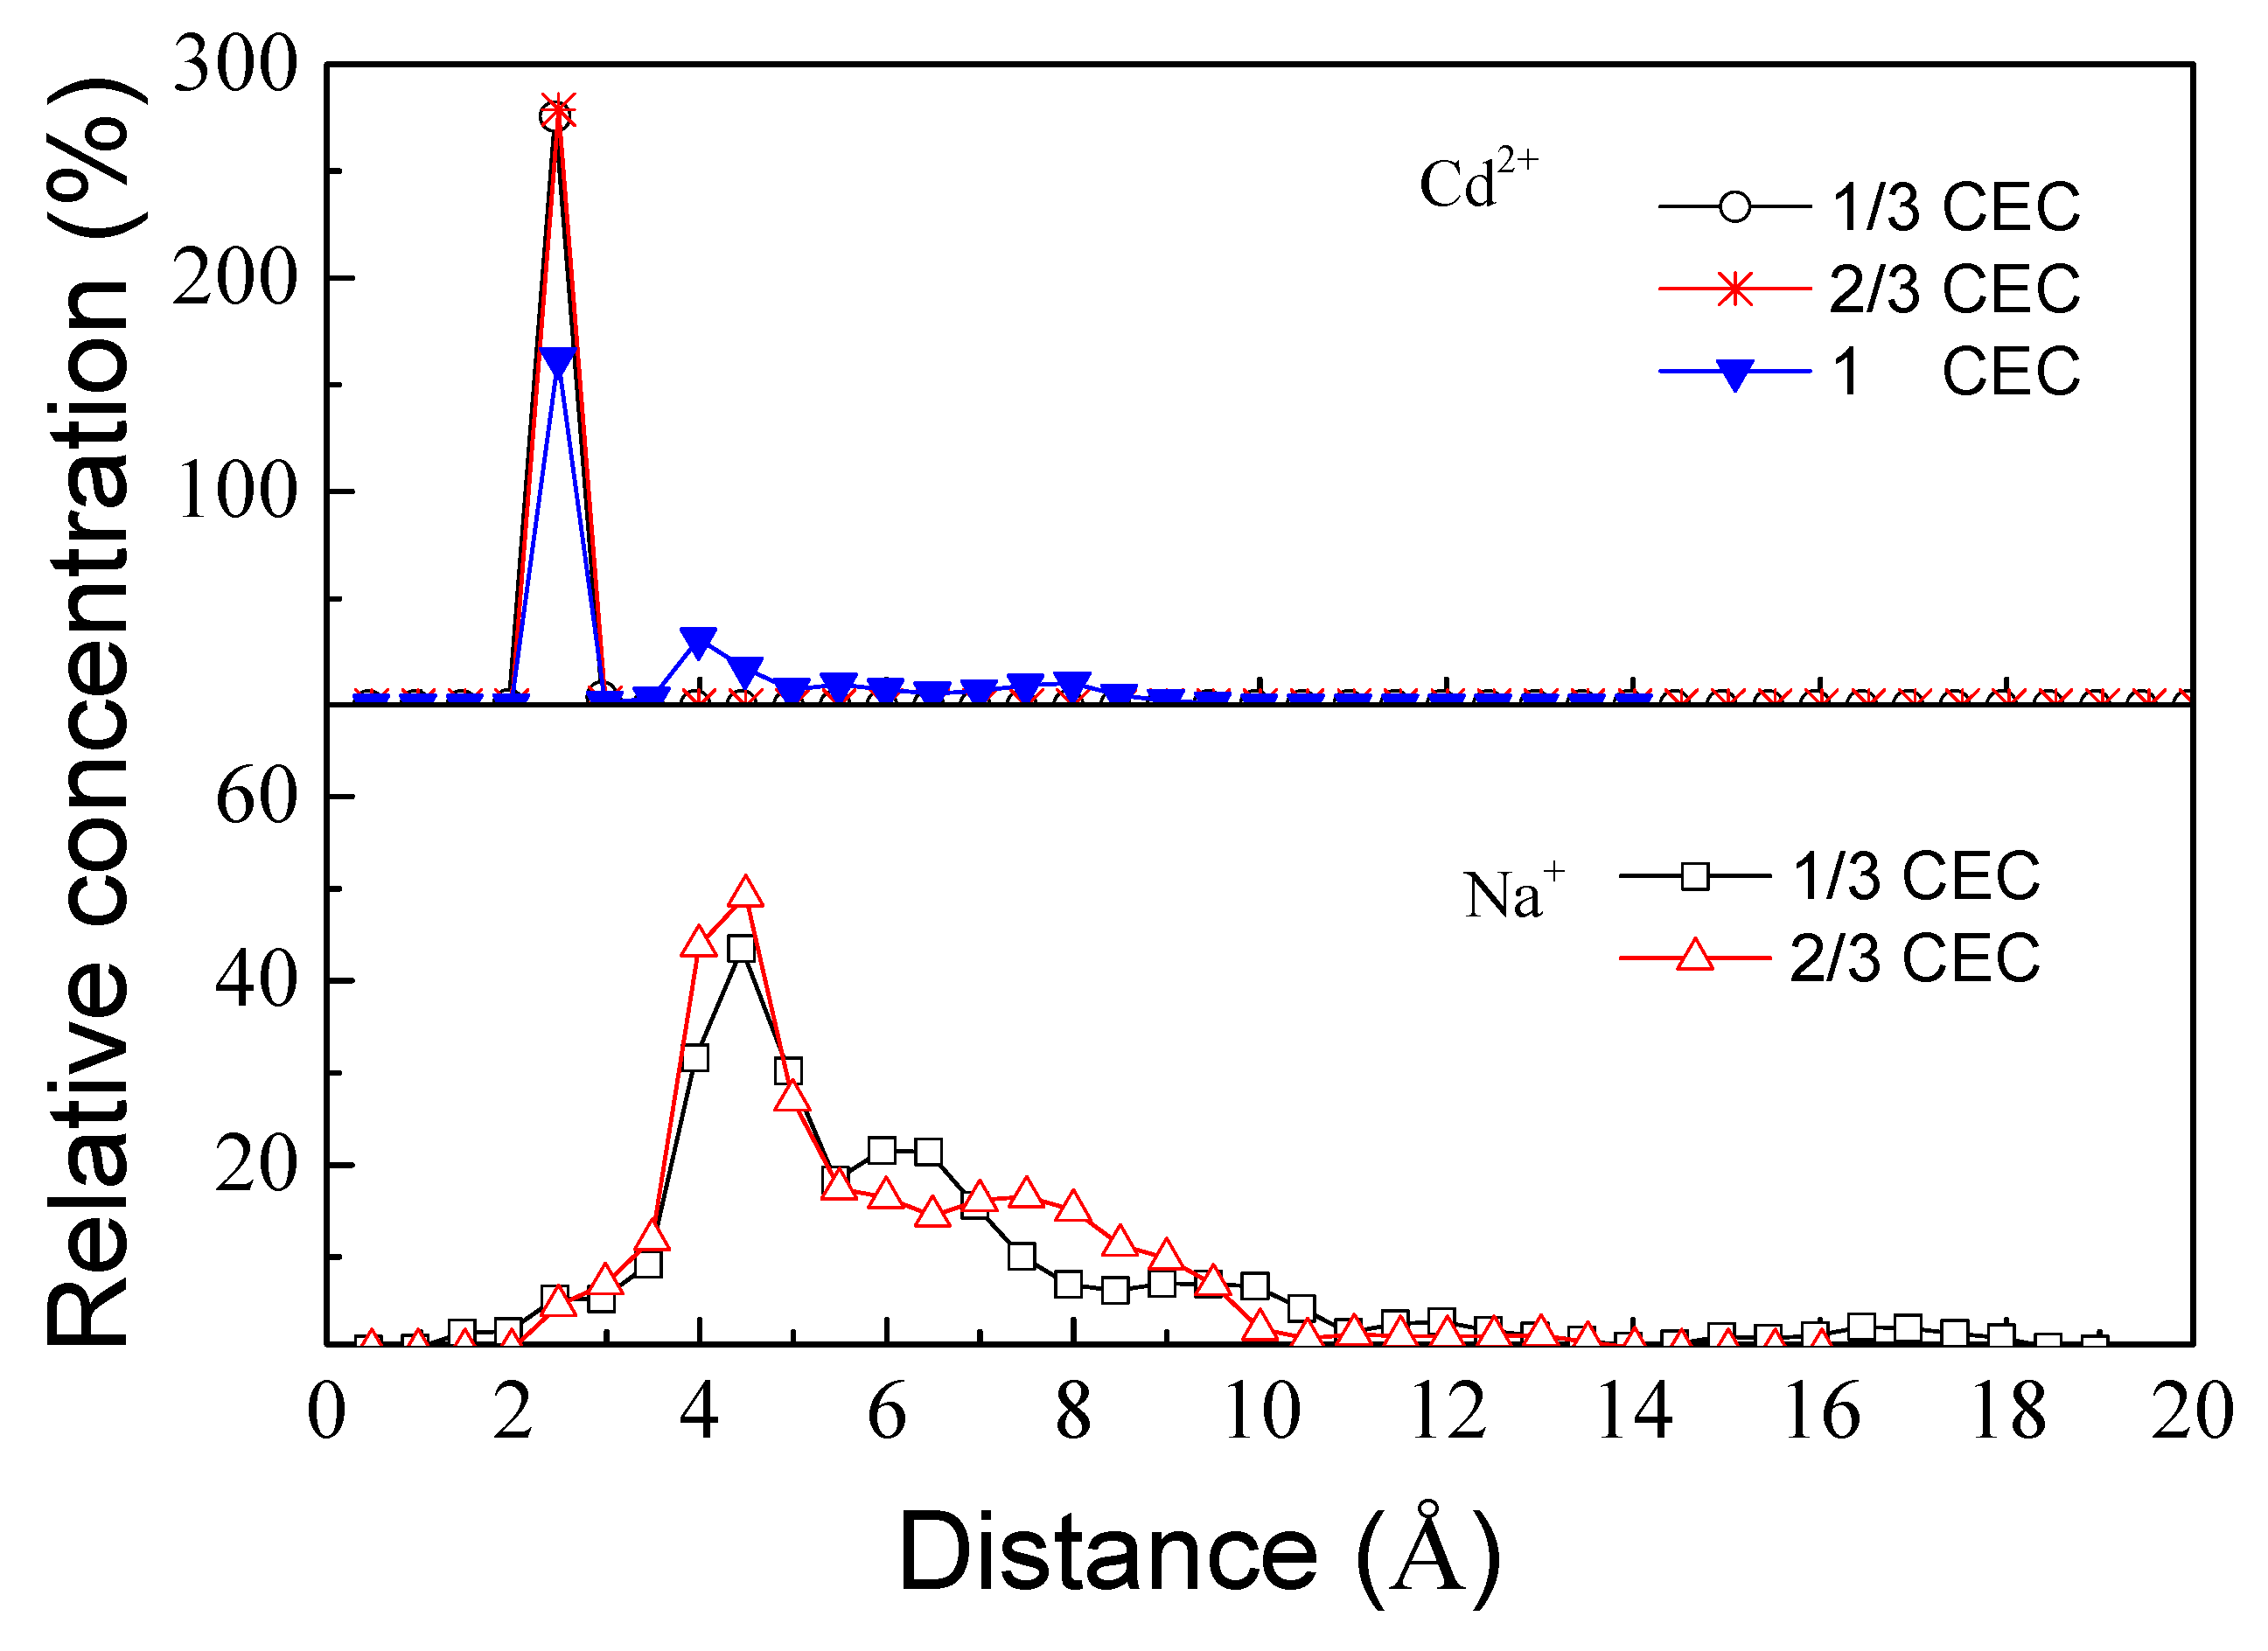
3.2.1. Relative Concentration Distribution

The (001) surface was mainly affected by the electrostatic adsorption of nearby cations to balance its negative charge due to lattice substitution. Figure 6 shows the relative concentration curves of Cd2+ and Na+ at the interface. At CEC values of 1/3 and 2/3, Cd2+ was mainly concentrated at the vicinity of 2.48 Å from the surface. When CEC increased to 1, the concentration of Cd2+ decreased at this distance and a secondary peak was formed close to 4.1 Å. When Na+ was replaced with Cd2+, Na+ was always distributed within 2.5–10 Å of the surface, and the concentration was mainly distributed at a distance of 4.5 Å. The interaction distance between Na+ and the surface was larger than that of Cd2+ and the surface; therefore, the interaction between Cd2+ and the surface was stronger than that between Na+ and the surface. Consequently, Cd2+ can easily replace Na+ and be adsorbed on the surface. Generally, divalent cations are adsorbed as inner-sphere surface complexes (IS) within 4 Å from the surface and as outer-sphere surface complexes (OS) beyond 4 Å [20]. Therefore, at CEC values of 1/3 and 2/3, the adsorption of Cd2+ on the surface was as IS due to the competitive adsorption between Cd2+ and Na+. Cd2+ attained a dominant position and had a stronger interaction with the surface. At a CEC of 1, part of the Cd2+ at the interface changed from IS to OS due to the competitive adsorption between Cd2+, which weakened the interaction between Cd2+ and the surface. In DFT calculations and without taking into consideration the water molecules, the adsorption distance between Cd2+ and the surface (001) was 1.1 Å, while by MD calculations, the presence of water molecules increased the adsorption distance to 2.48–4.1 Å. According to Peng et al. [23], the adsorption of water molecules on the surface of montmorillonite mainly involves both electrostatic and hydrogen bond interactions. Therefore, the adsorption of water molecules on the surface weakens the electrostatic interaction of Cd2+, resulting in an increase in the adsorption distance.

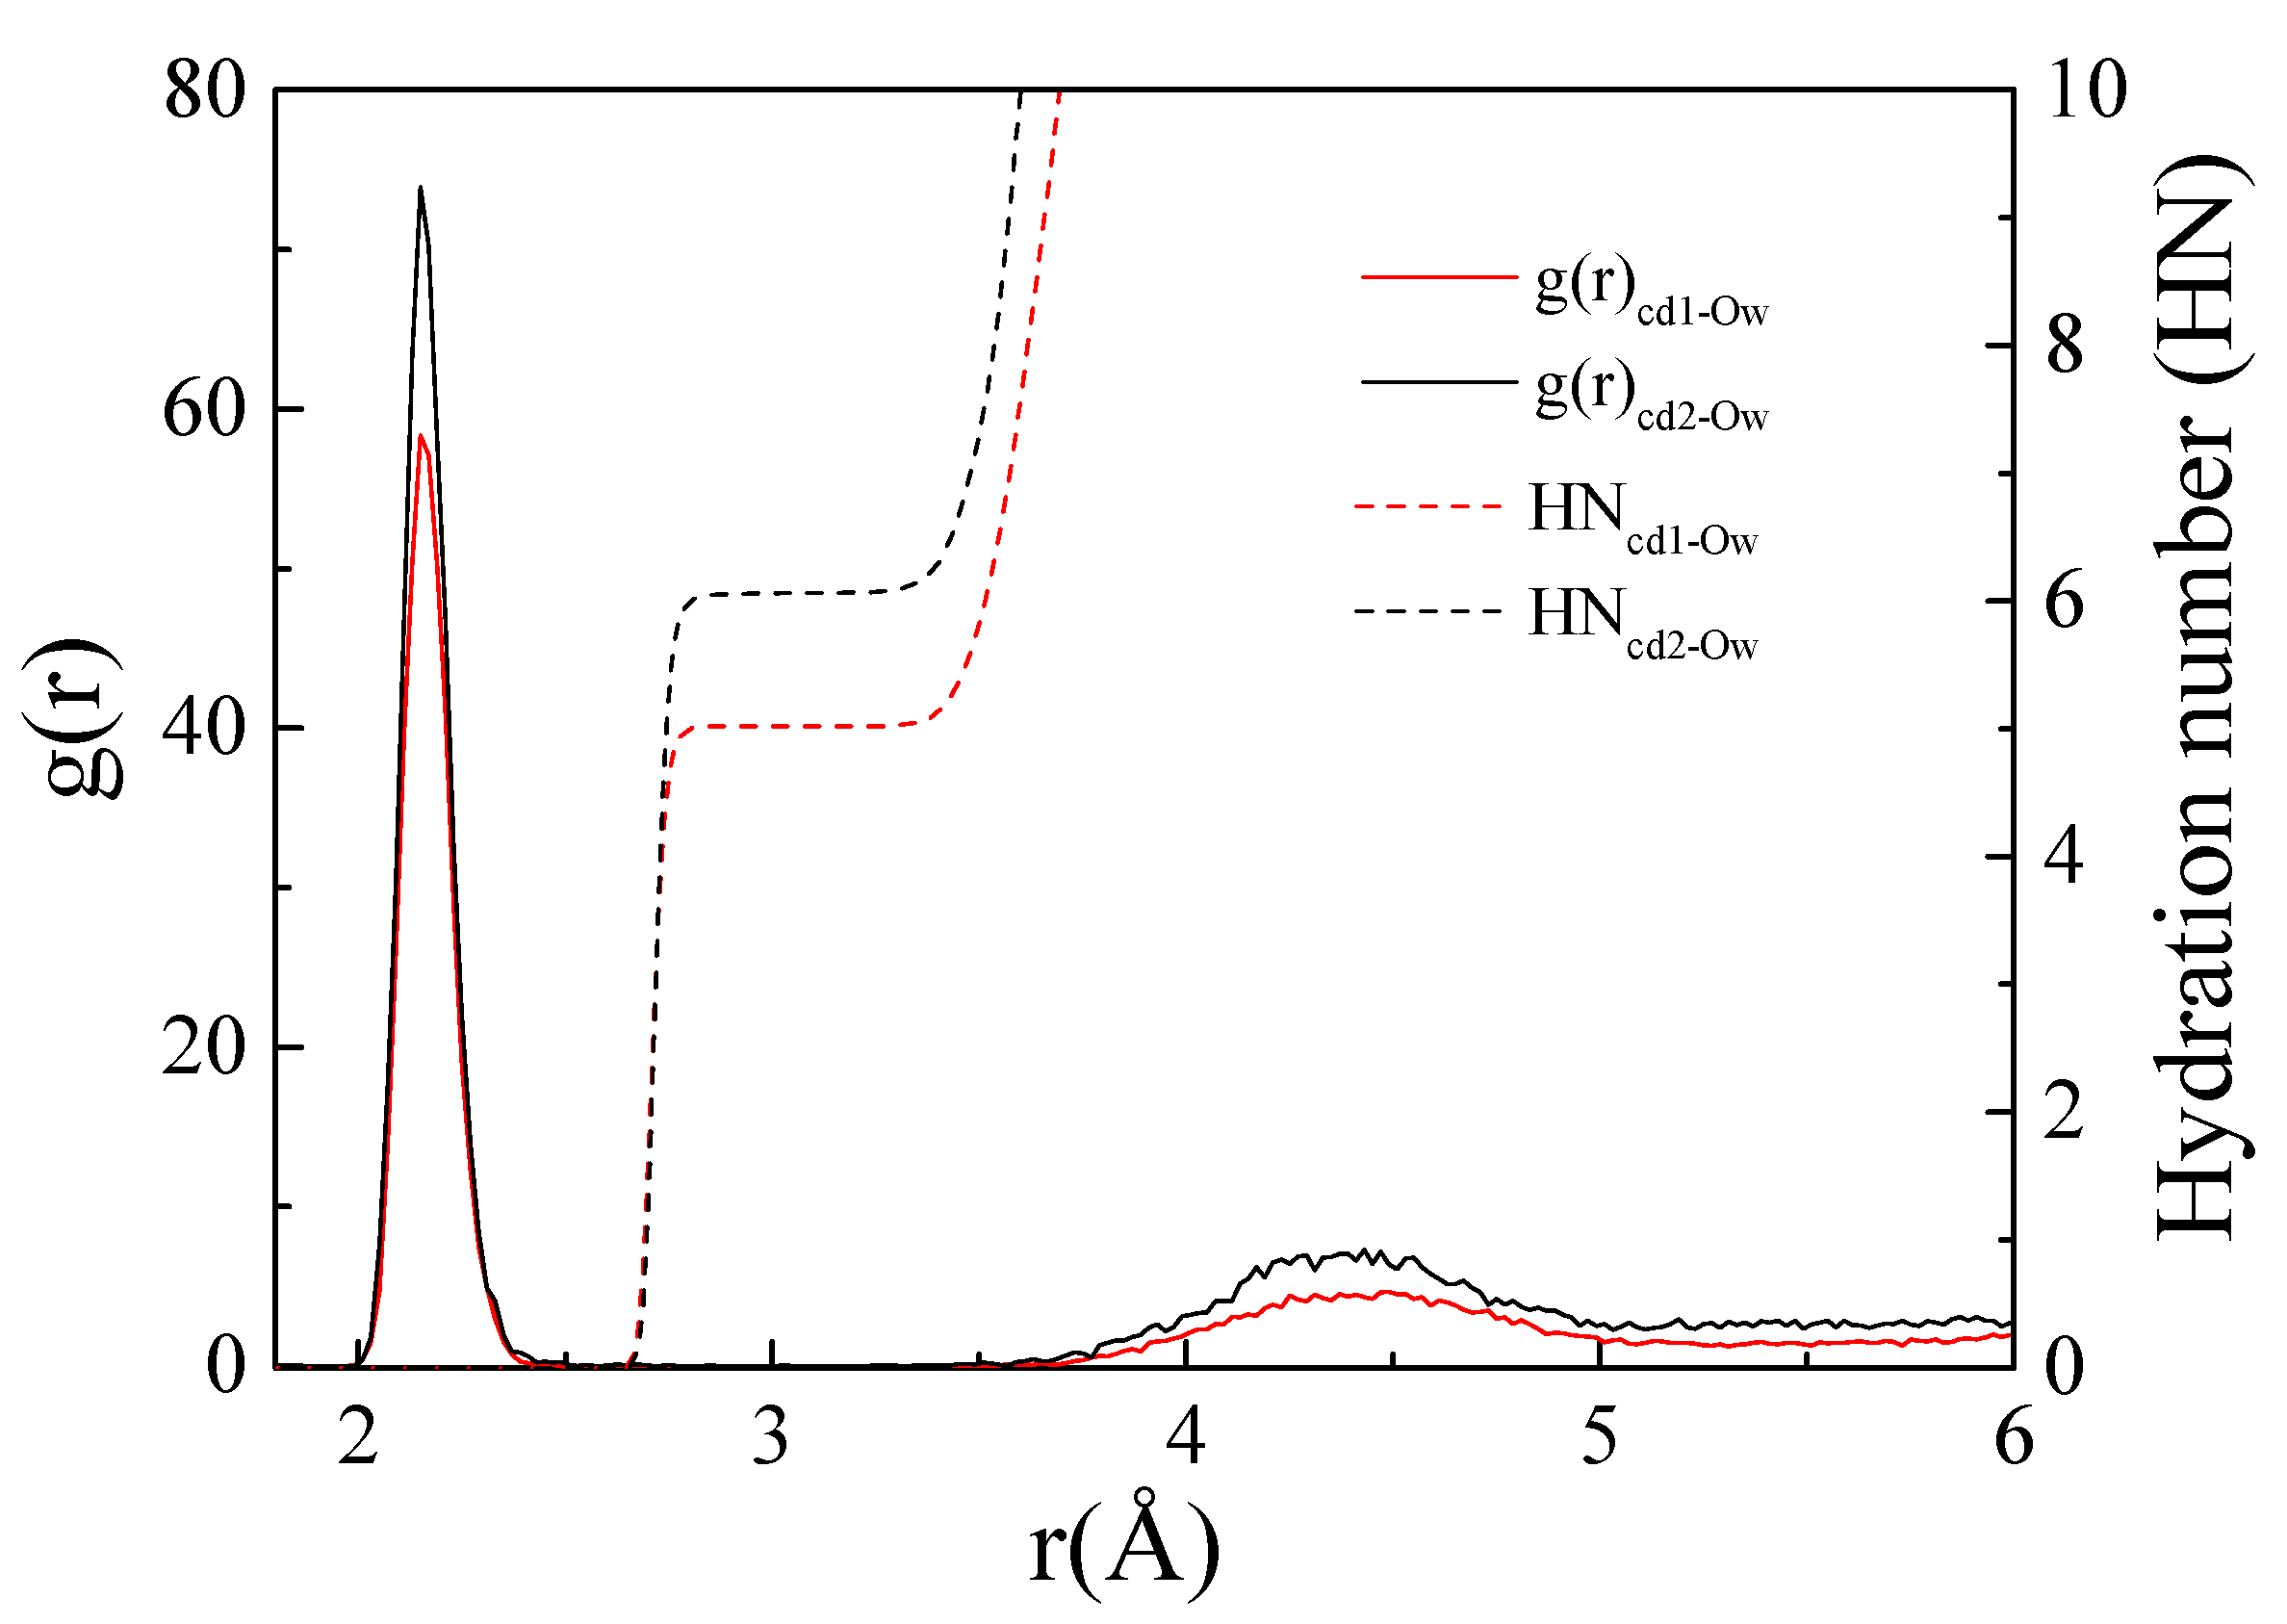
3.2.2. Radial Distribution

By analysing the radial distribution function between Cd2+ and the oxygen atom (Ow) of the interface water molecule, the hydration structure of the cation at the interface can be obtained. Figure 7 shows the radial distribution of Cd2+ and Ow at the montmorillonite interface. Cd1 represents IS, and Cd2 represents OS. The peak value of the radial distribution of Cd1-Ow was 2.15 Å, that is, the coordination distance (r) was 2.15 Å. The hydration number was 5.01. For Cd2-Ow, r was 2.15 Å and the hydration number of Cd2+ was 6.05. The hydration number of Cd2+ formed in bulk water is six, and rcd-O is 2.1–2.3 Å [31]. In general, hydration layers of approximately 10 Å thickness are present on the surface of clay minerals, and the molecular density of the hydration layer is greater than that of bulk water [32,33]. As the density of the interface hydration layer increases, the hydration number of Cd2+ adsorbed as OS becomes larger than that in the bulk phase. The change in the Cd2+ hydration number at the montmorillonite interface was mainly due to the stronger interaction between Cd2+ adsorbed by the inner sphere and the silica ring on the surface as compared to the interaction with water molecules. Consequently, the water molecules between the cations and the surface were squeezed out and reduced. When the inner sphere is converted to the outer sphere, the increase in distance weakens the interaction between Cd2+ and the surface, causing water molecules to enter between the surface and Cd2+ leading to an increase in the hydration number.

3.2.3. Diffusion Coefficient

Diffusion coefficients can be obtained by fitting the mean-square displacement of cations at the interface [12,34]. As the diffusion coefficient increases, fewer ions are bound by surface adsorption allowing them to move away more easily from the surface and enter the water phase. Figure 8 shows the mean square displacements of Cd2+ and Na+ at the interface. When CEC was 1/3 and 2/3, the mean-square displacement of Cd2+ at the interface was within 0.3 Ų. The distribution was approximately horizontal and straight, so the diffusion coefficient was 0 m2/s, indicating that Cd2+ was firmly adsorbed on the (001) surface. At a CEC of 1, the diffusion coefficient became 1.83 × 10⁻¹⁰ m2/s, and this increase indicated that the adsorption between Cd2+ and the (001) surface was weakened. This was consistent with the analysis of the relative cation concentration. The diffusion coefficient of water in the bulk phase is 26 × 10−10 m2/s [35]. The diffusion coefficient of cations at the interface is much smaller than that of bulk water molecules, mainly due to the electrostatic attraction of cations on the surface and the binding of cations.

4. Conclusions

In conclusion, the mechanism behind Cd2+ adsorption and its interactions with the surface were revealed by combining the advantages of DFT and MD calculation.
On the (001) surface, Cd2+ was adsorbed at the centre of the silicon–oxygen ring by electrostatic interactions, and the adsorption energy was −88.74 kJ/mol. However, the presence of water molecules weakened the interaction of Cd2+ with the surface and led to an increase in the adsorption distance from 1.1 to 2.48~4.10 Å. When Na+ was partially replaced by Cd2+, Cd2+ was mainly located at a distance of 2.48 Å and was adsorbed as IS surface complexes with a hydration number of 5.01 and a diffusion coefficient of 0 m2/s. However, when Na+ was completely replaced by Cd2+, part of Cd2+ migrated to 4.1 Å and part of the Cd2+ moved from the IS surface complexes to the OS surface complexes with a hydration number of 6.05 and a diffusion coefficient of 1.83 × 10⁻¹⁰ m2/s.
On the (010) surface, Cd2+ was adsorbed between two ≡Al-OH groups and formed two covalent bonds with an adsorption energy of −283.55 kJ/mol. The formation of covalent bonds was mainly caused by the interaction between the Cd s orbital and the O p orbital.
From a microscopic point of view, montmorillonite can be stripped to increase its basicity and expose more silica rings on the surface to increase the number of adsorption sites. Montmorillonite (001) surfaces can be used to remove cations from wastewaters contaminated with low concentrations of heavy metals.

Author Contributions

Conceptualization, J.D. and Q.W.; methodology, J.C. and J.D.; software, J.C. and J.D.; investigation, Q.W.; data curation, J.D.; writing—original draft preparation, Q.W.; writing—review and editing, J.D.; supervision, Q.W.; All authors have read and agreed to the published version of the manuscript.

Funding

This research was supported by Guizhou Provincial Natural Science Foundation (No. Qian Ke He Ji Chu—ZK[2021] Yi Ban 259), Guizhou Education Department Youth Science and Technology Talents Growth Project (No. Qian Jiao He KY Zi [2019]111), Talent base for environmental protection and mountain agricultural in Chishui River Basin and Doctoral Foundation Project of Zunyi Normal University (No. Zun Shi BS [2019]35).

Conflicts of Interest

The authors declare no conflict of interest.

References

  1. Gupta, S.S.; Bhattacharyya, K.G. Removal of Cd(II) from aqueous solution by kaolinite, montmorillonite and their poly(oxo zirconium) and tetrabutylammonium derivatives. J. Hazard. Mater. 2006, 128, 247–257. [Google Scholar] [CrossRef]
  2. Uddin, M.K. A review on the adsorption of heavy metals by clay minerals, with special focus on the past decade. Chem. Eng. J. 2017, 308, 438–462. [Google Scholar] [CrossRef]
  3. Hu, C.; Hu, H.; Song, M.; Tan, J. Preparation, characterization, and Cd(II) sorption of/on cysteine-montmorillonite composites synthesized at various pH. Environ. Sci. Pollut. Res. 2020, 27, 10599–10606. [Google Scholar] [CrossRef] [PubMed]
  4. Chen, T.; Yuan, Y.; Zhao, Y.; Rao, F. Effect of layer charges on exfoliation of montmorillonite in aqueous solutions. Colloids Surf. A 2018, 548, 92–97. [Google Scholar] [CrossRef]
  5. Wang, W.; Zhao, Y.; Yi, H.; Chen, T.; Kang, S.; Zhang, T.; Rao, F.; Song, S. Pb(ΙΙ) removal from water using porous hydrogel of chitosan-2D montmorillonite. Int. J. Biol. Macromol. 2019, 128, 85–93. [Google Scholar] [CrossRef] [PubMed]
  6. Juan, Y.; Chaobing, D.; Zhen, Y.; Wang, X.; Xu, G. Effective removal of lead ions from aqueous solution using nano Illite/Smectite clay: Isotherm, kinetic, and thermodynamic modeling of adsorption. Water 2018, 10, 210. [Google Scholar]
  7. Chen, Y.; Liu, Y.; Li, Y.; Li Zhao, L.; Chen, Y.; Li, H.; Liu, Y.; Li, L.; Xu, F.; Li, M. Functional wastepaper-montmorillonite composite aerogel for Cd2+ adsorption. Environ. Sci. Pollut. R. 2020, 27, 38644–38653. [Google Scholar] [CrossRef]
  8. Peng, C.; Min, F.; Liu, L.; Chen, J. The adsorption of CaOH+ on (001) basal and (010) edge surface of Na-montmorillonite: A DFT study. Surf. Interface Anal. 2017, 49, 267–277. [Google Scholar] [CrossRef]
  9. Chen, J.; Li, Y. Orbital symmetry matching study on the interactions of flotation reagents with mineral surfaces. Miner. Eng. 2022, 179, 107469. [Google Scholar] [CrossRef]
  10. Chen, J. The interaction of flotation reagents with metal ions in mineral surfaces. Miner. Eng. 2021, 171, 107067. [Google Scholar] [CrossRef]
  11. Peng, C.; Wang, G.; Zhang, C.; Qin, L. Molecular dynamics simulation of NH4+-smectite interlayer hydration: Influence of layer charge density and location. J. Mol. Liq. 2021, 336, 116232. [Google Scholar] [CrossRef]
  12. Peng, C.; Wang, G.; Qin, L.; Luo, S. Molecular dynamics simulation of NH4+-montmorillonite interlayer hydration: Structure, energetics, and dynamics. Appl. Clay Sci. 2020, 195, 105657. [Google Scholar] [CrossRef]
  13. Wardle, R.; Brindley, G. The Crystal structures of pyrophyllite, 1Tc, and of its dehydroxylate. Am. Mineral. 1972, 57, 732–750. [Google Scholar]
  14. Delley, B. An all-electron numerical method for solving the localdensity functional for polyatomic molecules. J. Chem. Phys. 1990, 92, 508–517. [Google Scholar] [CrossRef]
  15. Delley, B. From molecules to solids with the DMol3 approach. J. Chem. Phys. 2000, 113, 7756–7764. [Google Scholar] [CrossRef]
  16. Perdew, J.P.; Burke, K.; Ernzerhof, M. Generalized gradient approximation made made simple. Phys. Rev. Lett. 1996, 77, 3865–3868. [Google Scholar] [CrossRef] [Green Version]
  17. Grimme, S. Semiempirical hybrid density functional with perturbative second-order correlation. J. Chem. Phys. 2006, 124, 034108. [Google Scholar] [CrossRef] [Green Version]
  18. Pack, J.D. Special points for Brillon-zone integrations. Phys. Rev. B 1976, 13, 5188–5192. [Google Scholar]
  19. Kai, C.; Zh, B. A new method for quantifying cation exchange capacity in clay minerals. Appl. Clay Sci. 2018, 161, 444–455. [Google Scholar]
  20. Kobayashi, K.; Liang, Y.; Murata, S.; Matsuoka, T.; Takahashi, S.; Nishi, N.; Sakka, T. Ion distribution and hydration structure in the stern layer on muscovite surface. Langmuir 2017, 33, 3892–3899. [Google Scholar] [CrossRef]
  21. Kirkpatrick, R.; Kalinichev, A.; Bowers, G.M.; Yazaydin, A.O. NMR and computational molecular modeling studies of mineral surfaces and interlayer galleries: A review. Am. Mineral. 2015, 100, 1341–1354. [Google Scholar] [CrossRef]
  22. Cygan, R.; Liang, J.; Kalinichev, A. Molecular models of hydroxide, oxyhydroxide, and clay phases and the development of a general force field. J. Phys. Chem. B 2004, 108, 1255–1266. [Google Scholar] [CrossRef]
  23. Peng, C.; Min, F.; Liu, L.; Chen, J. A periodic DFT study of adsorption of water on sodium-montmorillonite (001) basal and (010) edge surface. Appl. Surf. Sci. 2016, 387, 308–316. [Google Scholar] [CrossRef]
  24. Mignon, P.; Ugliengo, P.; Sodupe, M. Ab initio molecular dynamics study of the hydration of Li+, Na+ and K+ in a montmorillonite model. Influence of isomorphic substitution. Phys. Chem. Chem. Phys. 2010, 12, 688–697. [Google Scholar] [CrossRef]
  25. Mohammed, A.M. Hydration of Cd(II): Molecular dynamics study. Chem. Soc. Ethiop. 2008, 22, 423–432. [Google Scholar] [CrossRef] [Green Version]
  26. Abollino, O.; Aceto, M.; Malandrino, M.; Sarzanini, C.; Mentasti, E. Adsorption of heavy metals on Na-montmorillonite. Effect of pH and organic substances. Water Res. 2003, 37, 1619–1627. [Google Scholar] [CrossRef]
  27. Liu, X.; Cheng, J.; Sprik, M.; Lu, X. Surface acidity of 2:1-type dioctahedral clay minerals from first principles molecular dynamics simulations. Geochim. Cosmochim. Acta 2014, 140, 410–417. [Google Scholar] [CrossRef]
  28. Peng, C.; Zhong, Y.; Wang, G.; Min, F.; Qin, L. Atomic-level insights into the adsorption of rare earth Y(OH)3−nn (n = 1–3) ion. Appl. Surf. Sci. 2019, 469, 357–367. [Google Scholar] [CrossRef]
  29. Ramadugu, S.K.; Mason, S.E. DFT study antimony(V) oxyanion adsorption on a-A2O3(1102). J. Phys. Chem. 2015, 119, 18149–18159. [Google Scholar]
  30. Du, J.; Fan, L.; Wang, Q.; Min, F. Adsorption of Cr(OH)n(3−n)+ (n=1–3) on illite (001) and (010) surfaces: A DFT study. Processes 2021, 9, 2048–2059. [Google Scholar] [CrossRef]
  31. Xia, S.; Yang, Y.; Yu, L. DFT study on structures and stabilities of hydration and hydrolysis Cd(Ⅱ). Riodical Ocean. Univ. China 2009, 39, 115–118. [Google Scholar]
  32. Du, J.; Min, F.; Zhang, M.; Peng, C. Study on hydration of illite in K+, Na+, Ca2+, Mg2+, and Al3+ electrolyte solutions. Z. Phys. Chem. 2019, 233, 721–735. [Google Scholar] [CrossRef]
  33. Yi, H.; Zhang, X.; Zhao, Y.; Liu, L. Molecular dynamics simulations of hydration shell on montmorillonite (001) in water. Surf. Interface Anal. 2016, 48, 976–980. [Google Scholar] [CrossRef]
  34. Chen, J.; Min, F.; Liu, L.; Liu, C. Mechanism research on surface hydration of kaolinite insights from DFT and MD simulations. Appl. Surf. Sci. 2019, 476, 6–15. [Google Scholar] [CrossRef]
  35. Loganathan, N.; Yazaydin, A.O.; Bowers, G.M.; Kalinichev, A.G.; Kirkpatrick, R.J. Structure, energetics, and dynamics of Cs+ and H2O in hectorite: Molecular dynamics simulations with an unconstrained substrate surface. J. Phys. Chem. C 2016, 120, 10298–10310. [Google Scholar] [CrossRef] [Green Version]
Figure 1. Montmorillonite surface models.
Processes 10 01381 g001
Figure 2. Montmorillonite surface.
Processes 10 01381 g002
Figure 3. Initial adsorption sites of Cd2+. T represents the top position above the oxygen atoms on the surface, H represents the hole position between the oxygen atoms, and B represents the bridge position between the oxygen atoms.
Processes 10 01381 g003
Figure 4. Stable adsorption configurations.
Processes 10 01381 g004
Figure 5. State density between Cd and Os1.
Processes 10 01381 g005
Figure 6. Relative concentration of cations at the interface.
Processes 10 01381 g006
Figure 7. Cd-Ow radial distribution.
Processes 10 01381 g007
Figure 8. Mean-square displacement of cations at interface.
Processes 10 01381 g008
Table 1. Adsorption sites and energy.
(001) SurfaceInitial PositionFinal PositionAdsorption Energy (kJ/mol)Initial PositionFinal PositionAdsorption Energy (kJ/mol)
H1H1−88.74T1H1−81.65
H2H1−75.61T2H1−80.87
H3H3−44.11-
(010) surfaceH1H1−254.67B4B4−283.55
H2H2−189.56T1T1−183.79
B1B1−183.79T2B2−183.55
B2B2−178.53T3B2−183.12
B3H1−254.67-
Table 2. Adsorption configuration parameters.
ConfigurationCd-Os1
Cd-Os2
Cd-Os3
Cd-Os4
Cd-Os5
Cd-Os6
Cd-Place
Before
Na-Place/Å
After
Na-Place/Å
MMT(001)-H12.6123.0642.6683.1512.5333.1541.10.71.3
MMT(010)-B42.2092.210-------
Publisher’s Note: MDPI stays neutral with regard to jurisdictional claims in published maps and institutional affiliations.

