Article

Parametric Sensitivity Analysis and Performance Evaluation of High-Temperature Macro-Encapsulated Packed-Bed Latent Heat Storage System Operating with Transient Inlet Boundary Conditions

1
Energy Systems Engineering Department, Atilim University, Ankara 06830, Turkey
2
Mechanical Engineering Department, Middle East Technical University, Ankara 06800, Turkey
3
ODTÜ-GÜNAM Center for Solar Energy Research and Applications, Ankara 06800, Turkey
*
Author to whom correspondence should be addressed.
Processes 2022, 10(7), 1382; https://doi.org/10.3390/pr10071382
Submission received: 22 May 2022 / Revised: 13 June 2022 / Accepted: 18 June 2022 / Published: 15 July 2022

Abstract

:
This paper presents the results of comprehensive numerical analyses in the performance of a packed-bed latent heat storage (PBLHS) system in terms of key performance indicators, namely charging time, charging rate, charging capacity, and charging efficiency. Numerical simulations are performed for the packed bed region using a transient two-dimensional axisymmetric model based on the local thermal non-equilibrium (LTNE) approach. The model considers the variation in the inlet temperature of the system as these storage systems are typically integrated with solar collectors that operate with intermittent solar radiation intensity. The model results are validated using the experimental data for temperature distribution throughout the bed. The simulations are carried out while changing the operating parameters such as the capsule diameter, bed porosity, inlet velocity, and the height-to-diameter aspect ratio to investigate their impact on the performance indicators. Observations indicate that low porosity, large-sized capsules, low inlet velocity, and a low height-to-diameter aspect ratio increase the charging time. In terms of achieving a high charging rate, a bed with low porosity, small-sized capsules, a high inflow velocity, and a high height-to-diameter aspect ratio is deemed advantageous. It is shown that raising the flow velocity and the height-to-diameter aspect ratio can improve the charging efficiency. These findings provide recommendations for optimizing the design and operating conditions of the system within the practical constraints.

1. Introduction

Renewable energy sources such as wind and solar power, have been encouraged by recent climate accords and international regulations in order to reduce fossil fuels-based energy use. These technologies, however, suffer from an intermittent and unreliable energy output, which can be mitigated by combining them with energy storage devices. In this respect, thermal energy storage (TES) has received significant attention recently due to its capacity to deal with problems that arise as a result of time and space imbalances as well as supply and demand discrepancies in energy [1].
In terms of the type of heat storage, TES technology can be classified into three categories: sensible [2], latent [3], and thermochemical [4]. Sensible heat TES technology has been extensively used because it is simple and costs less. However, it has low heat storage density and requires a large supply of raw materials. Latent TES is the other viable option that provides stable phase transition temperature and high heat storage density. However, latent TES is still in its early stages of development. As the other alternative, thermochemical TES technology provides a prolonged heat storage duration and a high heat storage density; however, it too is still in its infancy and is challenging to implement [5].
In line with these developments, phase change materials (PCMs) have also received a lot of attention due to their high heat storage density, a wide range of sources, and inexpensive cost [6]. The three fundamental categories of PCM are organics, inorganics, and liquid metals. Inorganic salts are widely used as the storage medium in latent heat TES systems due to their high melting enthalpy, high-temperature operating capabilities, and low cost [7]. However, due to their limited thermal conductivity and strong reactivity, they are not ideal for many applications. To deal with these challenges, finned tubes, heat pipes, nanoparticles, and encapsulation have been implemented [8]. Specifically, encasing the PCM in capsules (encapsulation) is a good way to improve the heat transfer and charging performance while preventing any possible leakage problem. As a result of its cheap initial investment cost and increased overall efficiency, the packed-bed latent heat storage (PBLHS) system has grown in popularity in recent years [9,10].
With regards to PBLHS systems, different numerical models have been developed [11,12], with Schumman’s models [13], continuous solid-phase models [14], and dispersion-concentric models [15] being the most common ones. The continuous solid-phase model was used by Lu et al. [16] to explore the thermal behavior of a PBLHS system, and it was discovered that the charging efficiency rises as the melting temperature and phase change material content increase. Using a dispersion-concentric model, Peng et al. [16] examined the heat transfer performance of a PBLHS system at various heat transfer fluid (HTF) velocities, particle sizes, and storage tank heights. The charging efficiency was observed to decrease with increasing PCM capsule diameter and inlet velocity, as well as with a decrease in the height of the TES tank.
Due to their relatively recent arrival, the thermal performance of PBLHS systems has not been sufficiently investigated experimentally. While a substantial amount of research is conducted under low-temperature circumstances, experimental analyses under medium- and high-temperature conditions are rarely documented. The thermal behavior of a packed bed filled with paraffin-encapsulated PCM was investigated by Nallusamy et al. [17]. The mass flow rate was observed to have little impact on the charging rate while running at a constant inlet HTF temperature. The thermal performance of a high-temperature PBLHS system was examined experimentally by Bellan et al. [18]. The Stefan number and shell parameters of the PCM capsules were found to be critical for the overall system performance. Li et al. [19] conducted experiments on their PBLHS system, using spherically encapsulated PCM. The charging efficiency was found to improve with an increase in inlet temperature and mass flow rate.
Previous studies have mostly concentrated on constant flow rates and steady-state HTF inlet temperatures. In real-life applications, the HTF temperature, which is determined in accordance with the renewable energy source, varies over time. In solar thermal systems, this temperature is set by the solar collector, and the temperature of the HTF outlet inside the collector controls the HTF inlet temperature within the TES unit. Recently, the performance of PBLHS was investigated experimentally, considering this change in the inlet temperature of the HTF by Wang et al. [20]. The charging process is analyzed in terms of the charging rate, charging capacity, and charging efficiency. Despite the experimental findings, the complicated transient nature and high cost of the TES system necessitate the employment of numerical models in order to thoroughly comprehend the system performance. The use of numerical models can reduce the number of tests required to determine the design criteria for the latent heat storage system. It also enables direct control of all variables inside a system without concern for measurement accuracies. As a result, to more effectively assess the heat transfer characteristics, the numerical analysis is carried out under unsteady heat flow input conditions. In this study, an axisymmetric cylindrical tank filled with a porous bed serves as the computational domain. The temperature of the fluid and solid phases are calculated using the transient two-phase model based on the local thermal non-equilibrium (LTNE) approach. The influences of capsule diameter, bed porosity, air inlet velocity, and bed height-to-diameter aspect ratio on the charge time, charging rate, charging capacity, and charging efficiency are studied separately to determine the optimal operating conditions. The findings are likely to play a significant role in enhancing the thermal performance and charging efficiency of PBLHS technology for industrial applications.

2. Model Description

The numerical model given in this study aims to replicate the experimental study performed by Wang et al. [20]. The schematic representation of the packed bed used in the reference experimental study is illustrated in Figure 1a. The tank is filled with PCM encased in spherical capsules. The HTF is air, while NaNO3–KNO3 (55–45 wt%) is selected as the PCM based on the experimental study. There is an air distributor to support a uniform flow through the bed. The air runs through the storage system, melts the PCM, and thereby stores energy as sensible and latent heat. Encapsulated PCMs are treated as a porous structure in the numerical simulations, with air flowing through the pores. The thermal performance of the system is predicted using a two-dimensional axisymmetrical numerical domain, as illustrated in Figure 1b. The numerical simulation is carried out in a cylindrical coordinates system to account for the impacts of velocity and temperature distributions in both axial and radial directions. The physical domain of the PBLHS system, together with the temperature measurement points in the bed, is shown in Figure 1b. The tank dimensions and fluid inlet temperatures are the same as those of the experiment. The charging procedure begins with an average temperature of 63 °C and ends with an average temperature of 320 °C. The grid network used in this model is depicted in Figure 1c. It comprises an unstructured mesh with triangular element types. The resultant three-dimensional model, obtained after revolving the 2D model around the r = 0 axis, is depicted in Figure 1d. The tank is surrounded by an insulation layer to accurately capture the temperature distribution in the system similar to the experimental setup.

2.1. Model Assumptions

The analysis is simplified by the following plausible assumptions and simplifications:
  • The inlet temperature varies with respect to time using a piecewise function based on the given data in the reference experimental study [20].
  • The air flows uniformly into the tank, and the flow is classified as laminar and incompressible. The air temperature variation with respect to time results in changes in the air density and inlet mass flow rate.
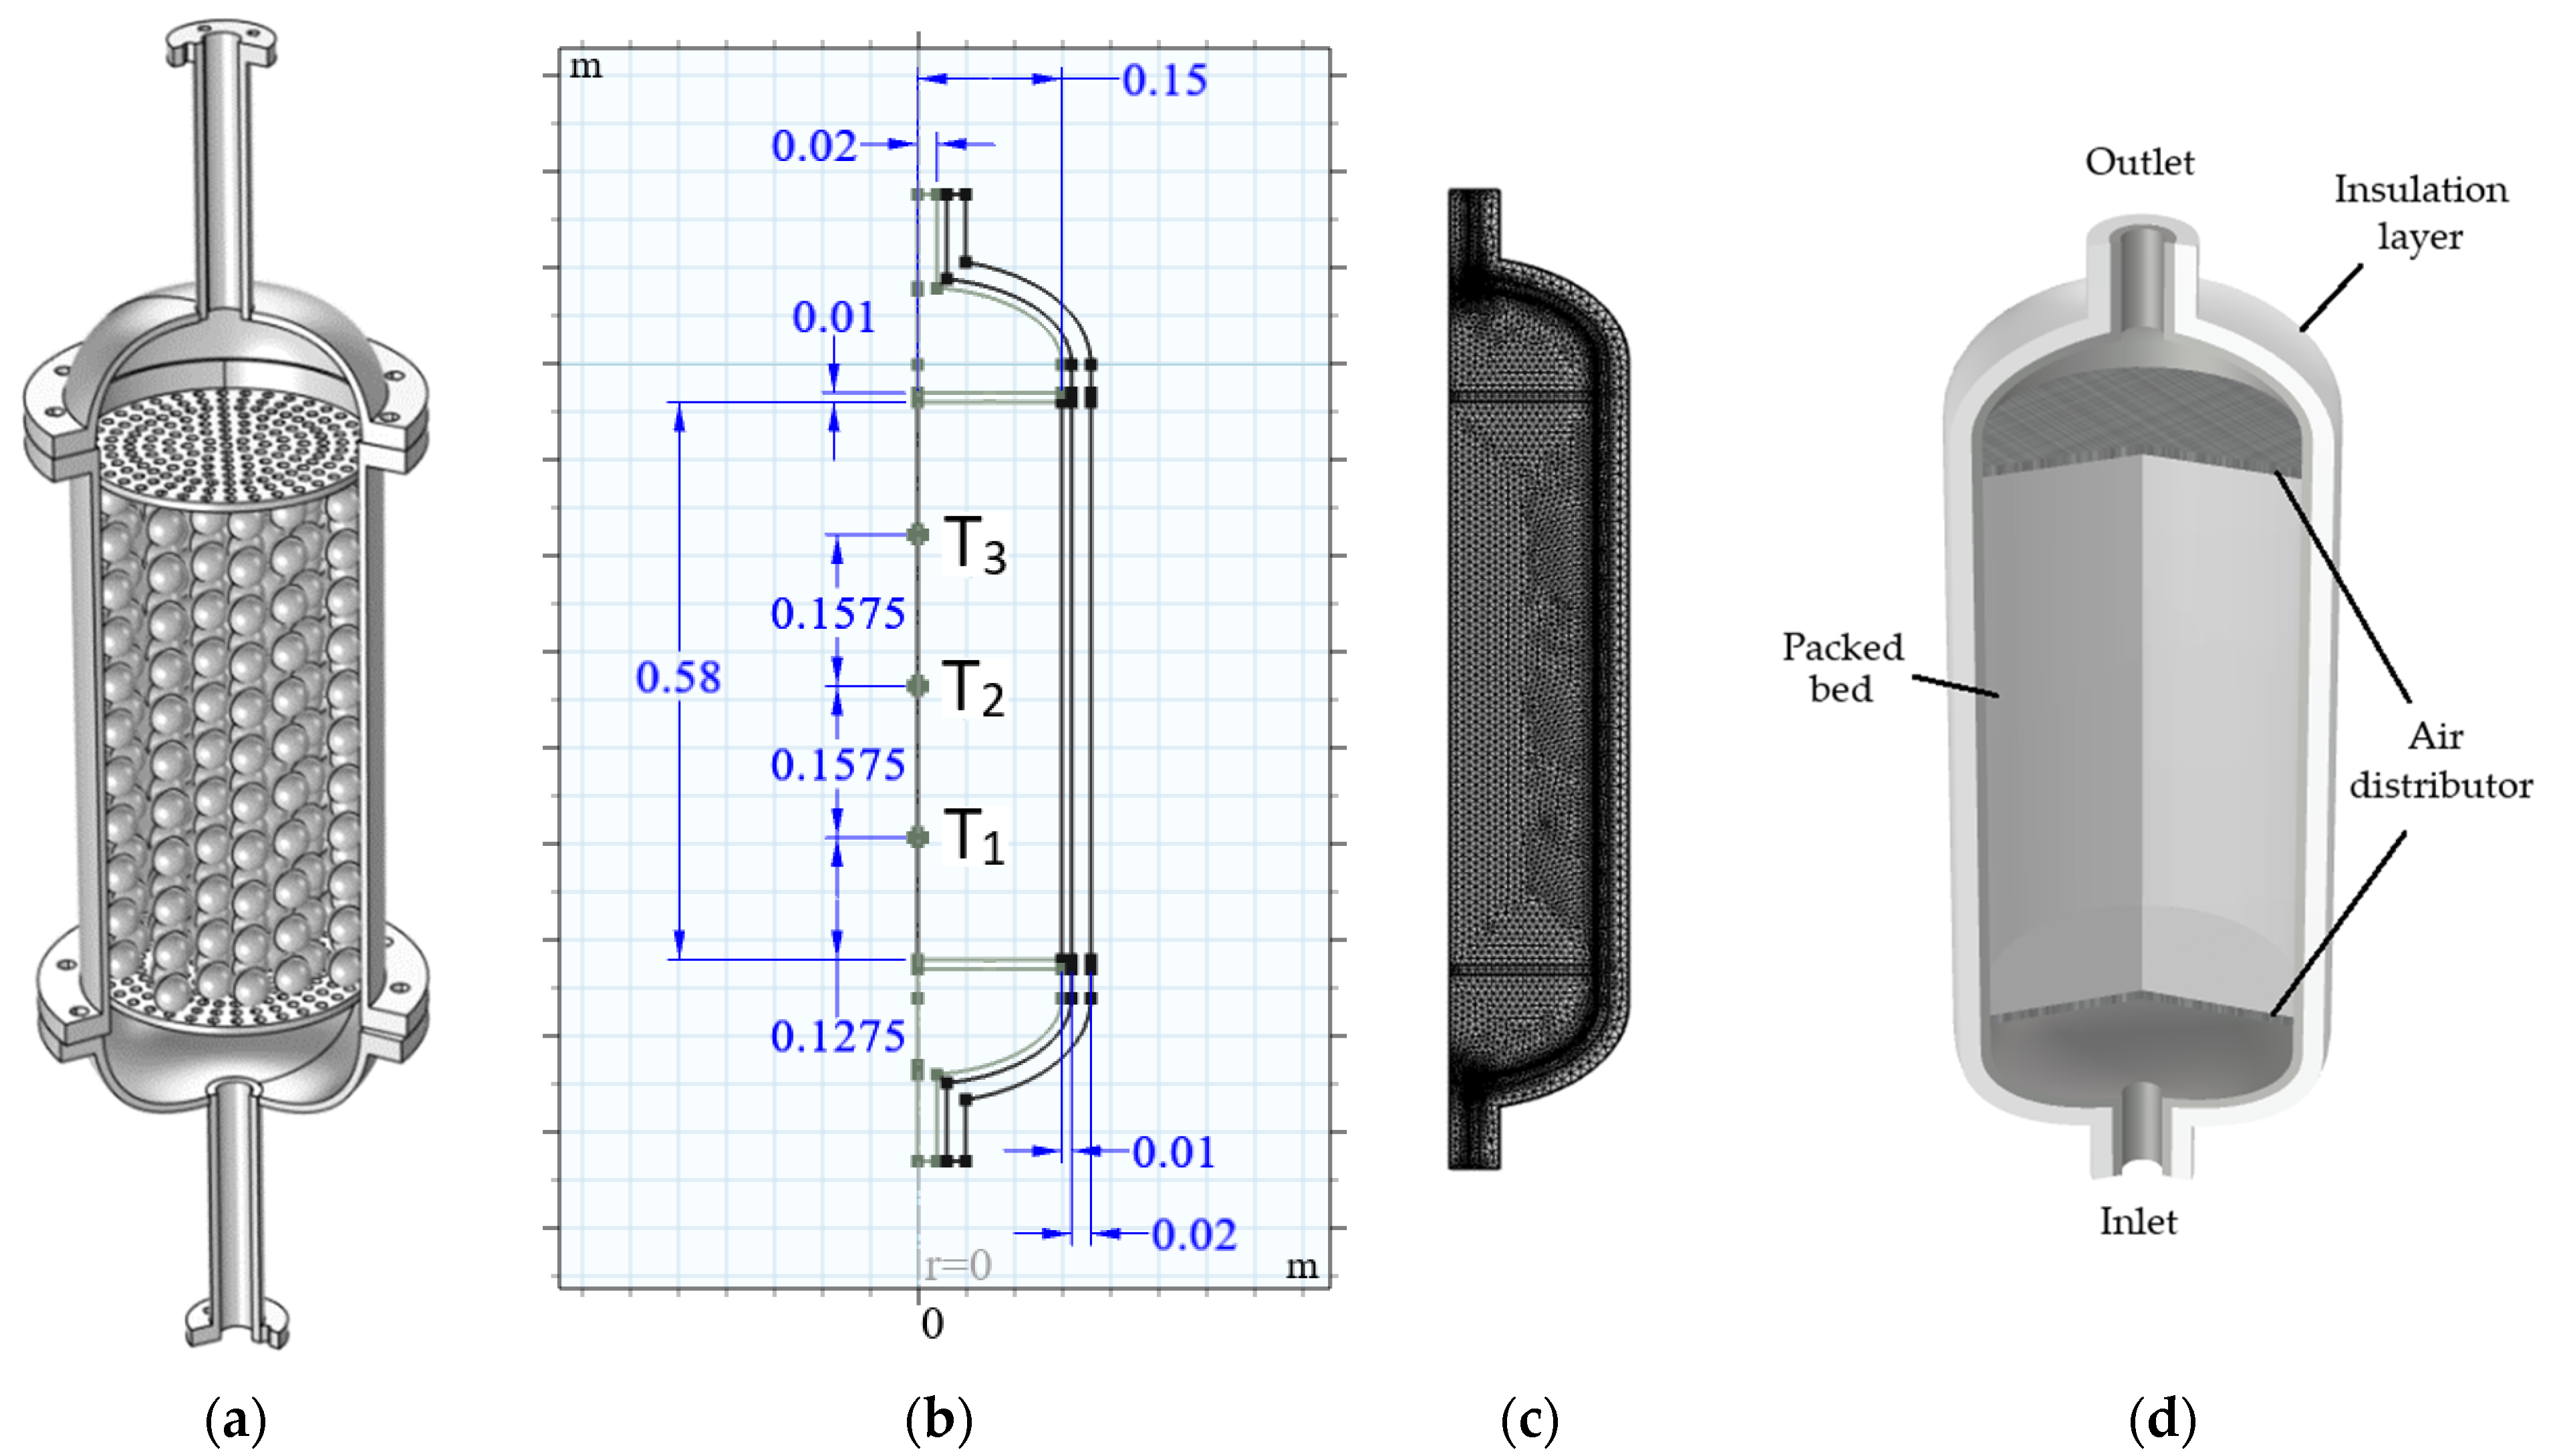
  • To evenly supply the bed with air, air distributors are used with an equivalent porous medium with a porosity of 0.53, determined based on the structure of the experimental setup [20].
  • The thickness of the encapsulation shell is ignored since it is small relative to the diameter of the capsule.
  • The outer surface of the PBLHS model is insulated with an equivalent layer to the one presented in the experimental setup to reduce the computational effort. Using the concept of thermal resistance for cylindrical systems, reducing the outer radius of the insulation layer from 0.41 to 0.18 m is accompanied by a reduction in thermal conductivity from 0.09 to 0.01 W/mK.
  • Radiative heat transfer is not considered.

2.2. Governing Equations

Transport equations for the flow through the PBLHS model provide an altered set of governing equations for the porous media. The air exchanges heat with the filler items, which are PCM encapsulations, as it flows through the system. The computational domain in this work is reduced to a cylindrical area and a two-dimensional cylindrical coordinate is used, as illustrated in Figure 1b. Therefore, the followings are the respective governing equations for the air and PCM [12]:
Continuity equation:
ρ f t + 1 r ρ f r u r r + ρ f u z z = 0
where ρ f is the fluid density.
Momentum equations:
ρ f ε u r t + ρ f ε 2 u r u r r + u z u r z = μ ε r 1 r r u r r + 2 u r z 2 P r μ K + ρ f C K 1 / 2 u r u r
ρ f ε u z t + ρ f ε 2 u r u z r + u z u z z = μ ε 1 r r r u z r + 2 u z z 2 P z μ K + ρ f C K 1 / 2 u z u z
where K is the permeability, and C is the inertial coefficient. The porosity and diameter of the PCM capsule can be used to calculate these two parameters:
K = d p 2 ε 3 150 1 ε 2
C = 3.5 150 K ε 3
where ε is the void fraction (bed porosity) and d p is the diameter of the PCM capsule.
Energy equation for the tank wall and insulation layer:
ρ s c p , s T s t = k s 1 r r r T s r + 2 T s z 2 + q
where c p , s and k s are the specific heat and thermal conductivity for each solid layer.
Energy equation for the porous distributor:
ρ c p e f f T t + ρ f c p , f u r T r + u z T z = k e f f 1 r r r T r + 2 T z 2
where effective volumetric heat capacity and thermal conductivity are calculated as:
k e f f = ε d i s t k f + 1 ε d i s t k s
ρ c p e f f = ε d i s t ρ f c p , f + 1 ε d i s t ρ s c p , s
where ε d i s t is the porosity of the distributor layer.
Energy equation for the air:
ε ρ f c p , f T f t + ε ρ f c p , f u r T f r + u z T f z = k f 1 r r r T f r + 2 T f z 2 + h v o l T p T f
Energy equation for the PCM:
1 ε ρ p c p , p T p t = k p 1 r r r T p r + 2 T p z 2 + h v o l T f T p
where h v o l and c p , p denote the volumetric convective heat transfer coefficient and specific heat capacity, respectively. Two temperature (non-equilibrium) energy equations of air and PCM are coupled through the last terms in Equations (10) and (11). This term adds the exchanged opposite heat sources that one phase receives from or releases to the other when respective temperatures differ. In these terms, h v o l refers to the volumetric heat transfer coefficient formulated as:
h v o l = 6 h 1 ε d p
where h is the convection heat transfer coefficient and can be obtained using the semi-empirical formula for Nu proposed by [21]:
h = k f d p Nu   = k f Nu 2 + 1.1 Pr 1 / 3 Re 0.6
in which the Prandtl number and Reynolds number are defined as Pr = μ C p , f k f and Re   = d p ρ f u μ , respectively.
Within the mushy zone, the PCM is considered a pseudo-porous medium, where porosity is a function of the melt fraction. A melt fraction of 1 indicates completely molten PCM, a melt fraction of 0 indicates a completely solid region and a melt fraction between 0 and 1 indicates a mushy zone where melting is ongoing:
θ = 1 ϕ
ϕ T = 0                                                                       T < T m Δ T 2 0 1               T m Δ T 2   T T m + Δ T 2 1                                                                       T T m + Δ T 2
in which Δ T is the transition interval during melting, and T m is the melting temperature of PCM.
During the phase change process, heat conductivity and density in the PCM change according to the fraction associated with the solid phase and liquid phase as:
ρ p = θ ρ s o l + 1 θ ρ l i q
k p = θ k s o l + 1 θ k s o l
in which ρ s o l and ρ l i q represent the density of solid and liquid phases of PCM and k s o l , and k l i q represent thermal conductivity of solid and liquid phases of PCM, respectively.
While melting, PCM absorbs a large amount of latent heat in a short period. Therefore, to capture the melting process accurately, the model uses an equivalent specific heat capacity method and the phase change function, which determines how much of the PCM has gone through a phase change:
c p , p = 1 ρ θ ρ s o l c p . s o l + 1 θ ρ l i q c p , l i q + h f s λ m T
where c p , s o l and c p , l i q , respectively, represent the specific heat of solid and liquid PCM. h f s is the enthalpy of fusion, and λ m is defined as:
λ m = 1 2 1 θ ρ l i q θ ρ s o l θ ρ s o l + 1 θ ρ l i q

2.3. Boundary and Initial Conditions

Given a suitable set of initial and boundary conditions, the governing equations can be solved simultaneously. Temperature and velocity boundary conditions are specified at the inlet, whereas Neumann pressure and temperature boundary conditions are employed at the outlet. The boundary conditions for this model are:
Inlet :   u z = u i n , u r = 0 , T f = T i n t
Outlet :   u z z = 0 , u r = 0 , T f z = 0  
Axisymmetric   boundary :   u r r = 0 , T f r = 0
Surface   wall :   u z = 0 , u r = 0 , k s T s r = h w T a m b T w
The correlation presented in [22] is used to calculate the heat transfer coefficient at the outer surface:
h w = k a m b H t a n k 0.825 + 0.387 Ra H 1 / 6 1 + 0.492 / Pr 9 / 16 8 / 27 2
where k a m b is the thermal conductivity of ambient air and H t a n k is the height of the tank. Ra H is the Rayleigh number defined as:
Ra H = g β T w T a m b H t a n k 3 ν α
in which β , ν , and α are thermal expansion coefficient, kinematic viscosity, and thermal diffusivity of the air, respectively.
The initial conditions are also formulated as:
u f , i n i = 0     m / s
T f , i n i t i a l = T p , i n i t i a l = T s = T i n i t i a l = 63   ° C

2.4. Material Properties

The thermophysical properties of PCM are listed in Table 1. The variations in the thermophysical properties of air are also considered as [20]:
ρ a i r = 1.274 0.004509 T a i r + 1.343 × 10 5 T a i r 2 2.799 × 10 8 T a i r 3 + 3.56 × 10 11 T a i r 4 2.429 × 10 14 T a i r 5 + 6.75 × 10 18 T a i r 5
c p , a i r = 1006 0.008615 T a i r + 6.581 × 10 4 T a i r 2 7.131 × 10 7 T a i r 3 + 2.42 × 10 10 T a i r 4
k a i r = 0.02477 + 7.298 × 10 5 T a i r 2.592 × 10 8 T a i r 2 + 9.381 × 10 12 T a i r 3
μ a i r = 1.743 × 10 5 + 4.76 × 10 8 T a i r 2.243 × 10 11 T a i r 2 + 8.118 × 10 15 T a i r 3
In the above equations, the unit of air temperature, T a i r , is °C.

2.5. Solution Method

The governing equations are solved using COMSOL Multiphysics. This code discretizes the governing equations using the finite element method (FEM). The PARDISO solver handles unsteady fluid flow and heat transfer to find velocity, temperature, and pressure. The relative tolerance of 10−6 is assigned as the convergence criterion.

3. Key Performance Indicators

The performance of the PBLHS system can be assessed using the conservation of energy methodologies once the thermal behavior has been determined. The charging time, charging capacity, charging rate, and charging efficiency are the four important performance indicators explored in this study. The heat in the PBLHS system is stored in three compartments apart from the air itself: PCM, tank, and air distributors, As a result, the stored energy in the system can be estimated as follows:
Q s t o r e d m a x = Q P C M , s t o r e d m a x + Q a i r , s t o r e d m a x + Q d i s t , s t o r e d m a x + Q t a n k , s t o r e d m a x
Q P C M , s t o r e d m a x = m P C M c p , l i q T i n l e t T m + m P C M h f s + m P C M c p , s o l T m T P C M , i n i t i a l
Q a i r , s t o r e d m a x = V a i r ρ a i r c p , a i r T i n l e t T i n i t i a l
Q d i s t , s t o r e d m a x = m d i s t c p , s t T i n l e t T i n i t i a l
Q t a n k , s t o r e d m a x = m t a n k c p , s t T i n l e t T i n i t i a l
where T i n l e t , T m , and T P C M , i n i t i a l are the inlet temperature, melting temperature, and initial temperature of the PCM, respectively.
The heat transferred from air to the PBLHS system during the charging process is calculated at:
Q c h r a g e = 0 t m ˙ a i r T i n l e t c p , a i r , i n l e t T o u t l e t c p , a i r , o u t l e t d t
where m ˙ a i r is the air mass flow rate. c p , a i r , i n l e t and c p , a i r , o u t l e t represent the average specific heat of the air at the inlet and outlet, respectively.
Using the transferred heat of the air and the charging period, the average charging rate can be obtained as:
P c h a r g e = Q c h a r g e t c h a r g e
Charging efficiency is the ratio between the total thermal energy saved in the PBLHS system to the total thermal energy of air provided throughout the charging time:
η c h a r g e = Q s t o r e d m a x Q c h a r g e

4. Results and Discussion

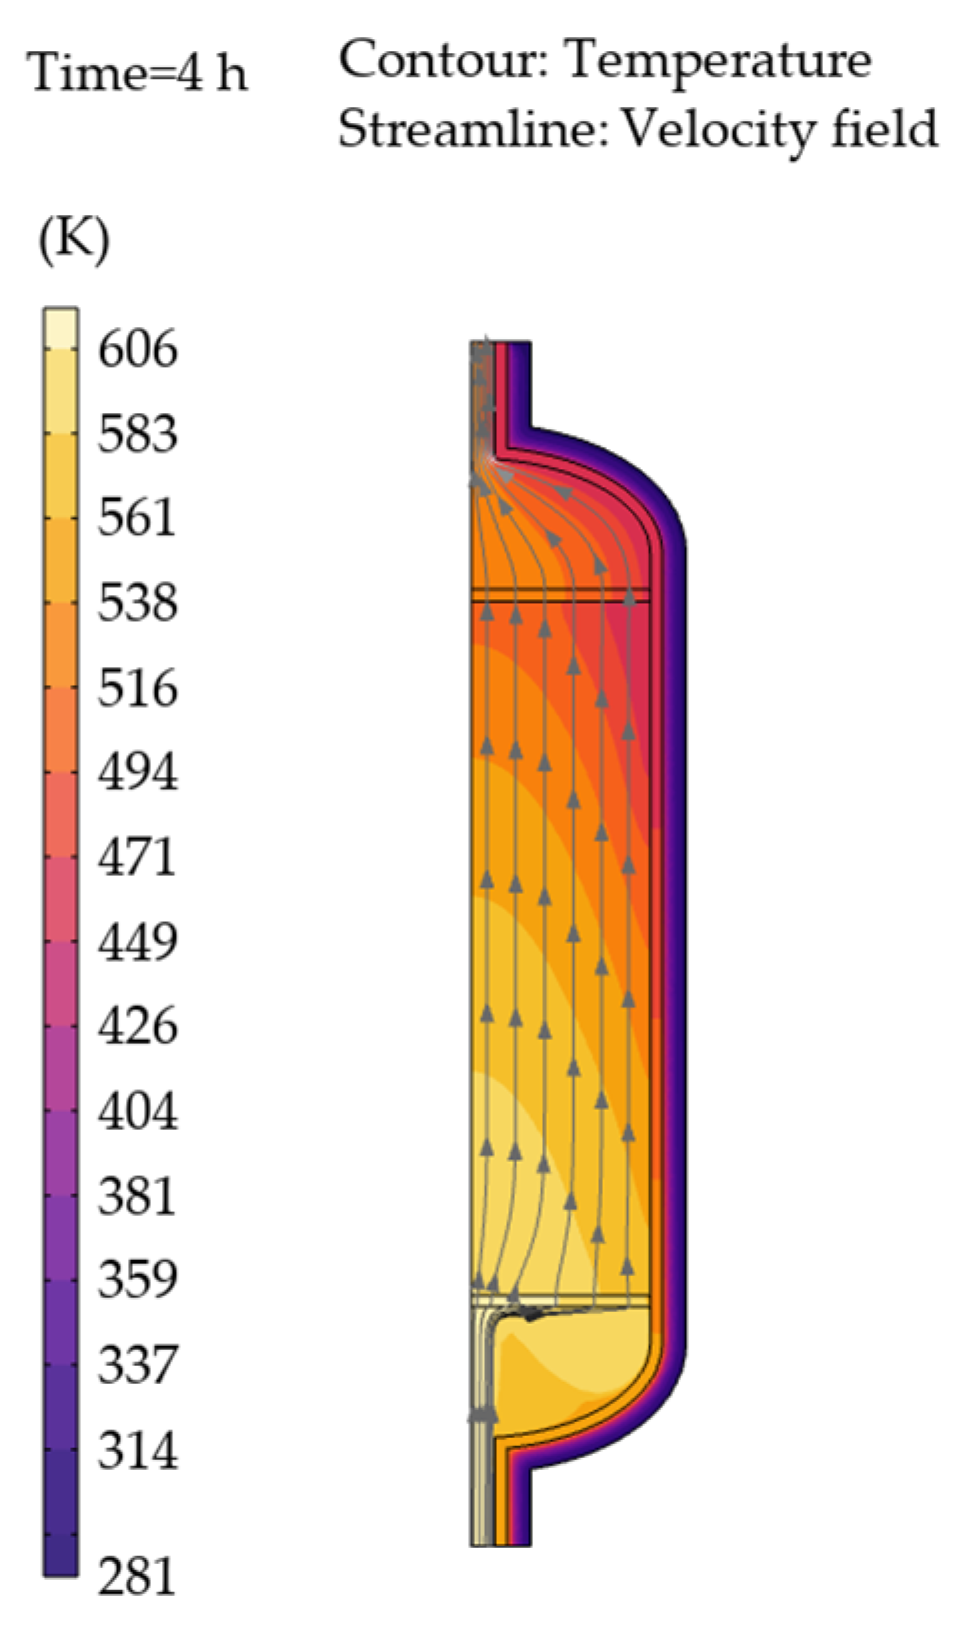
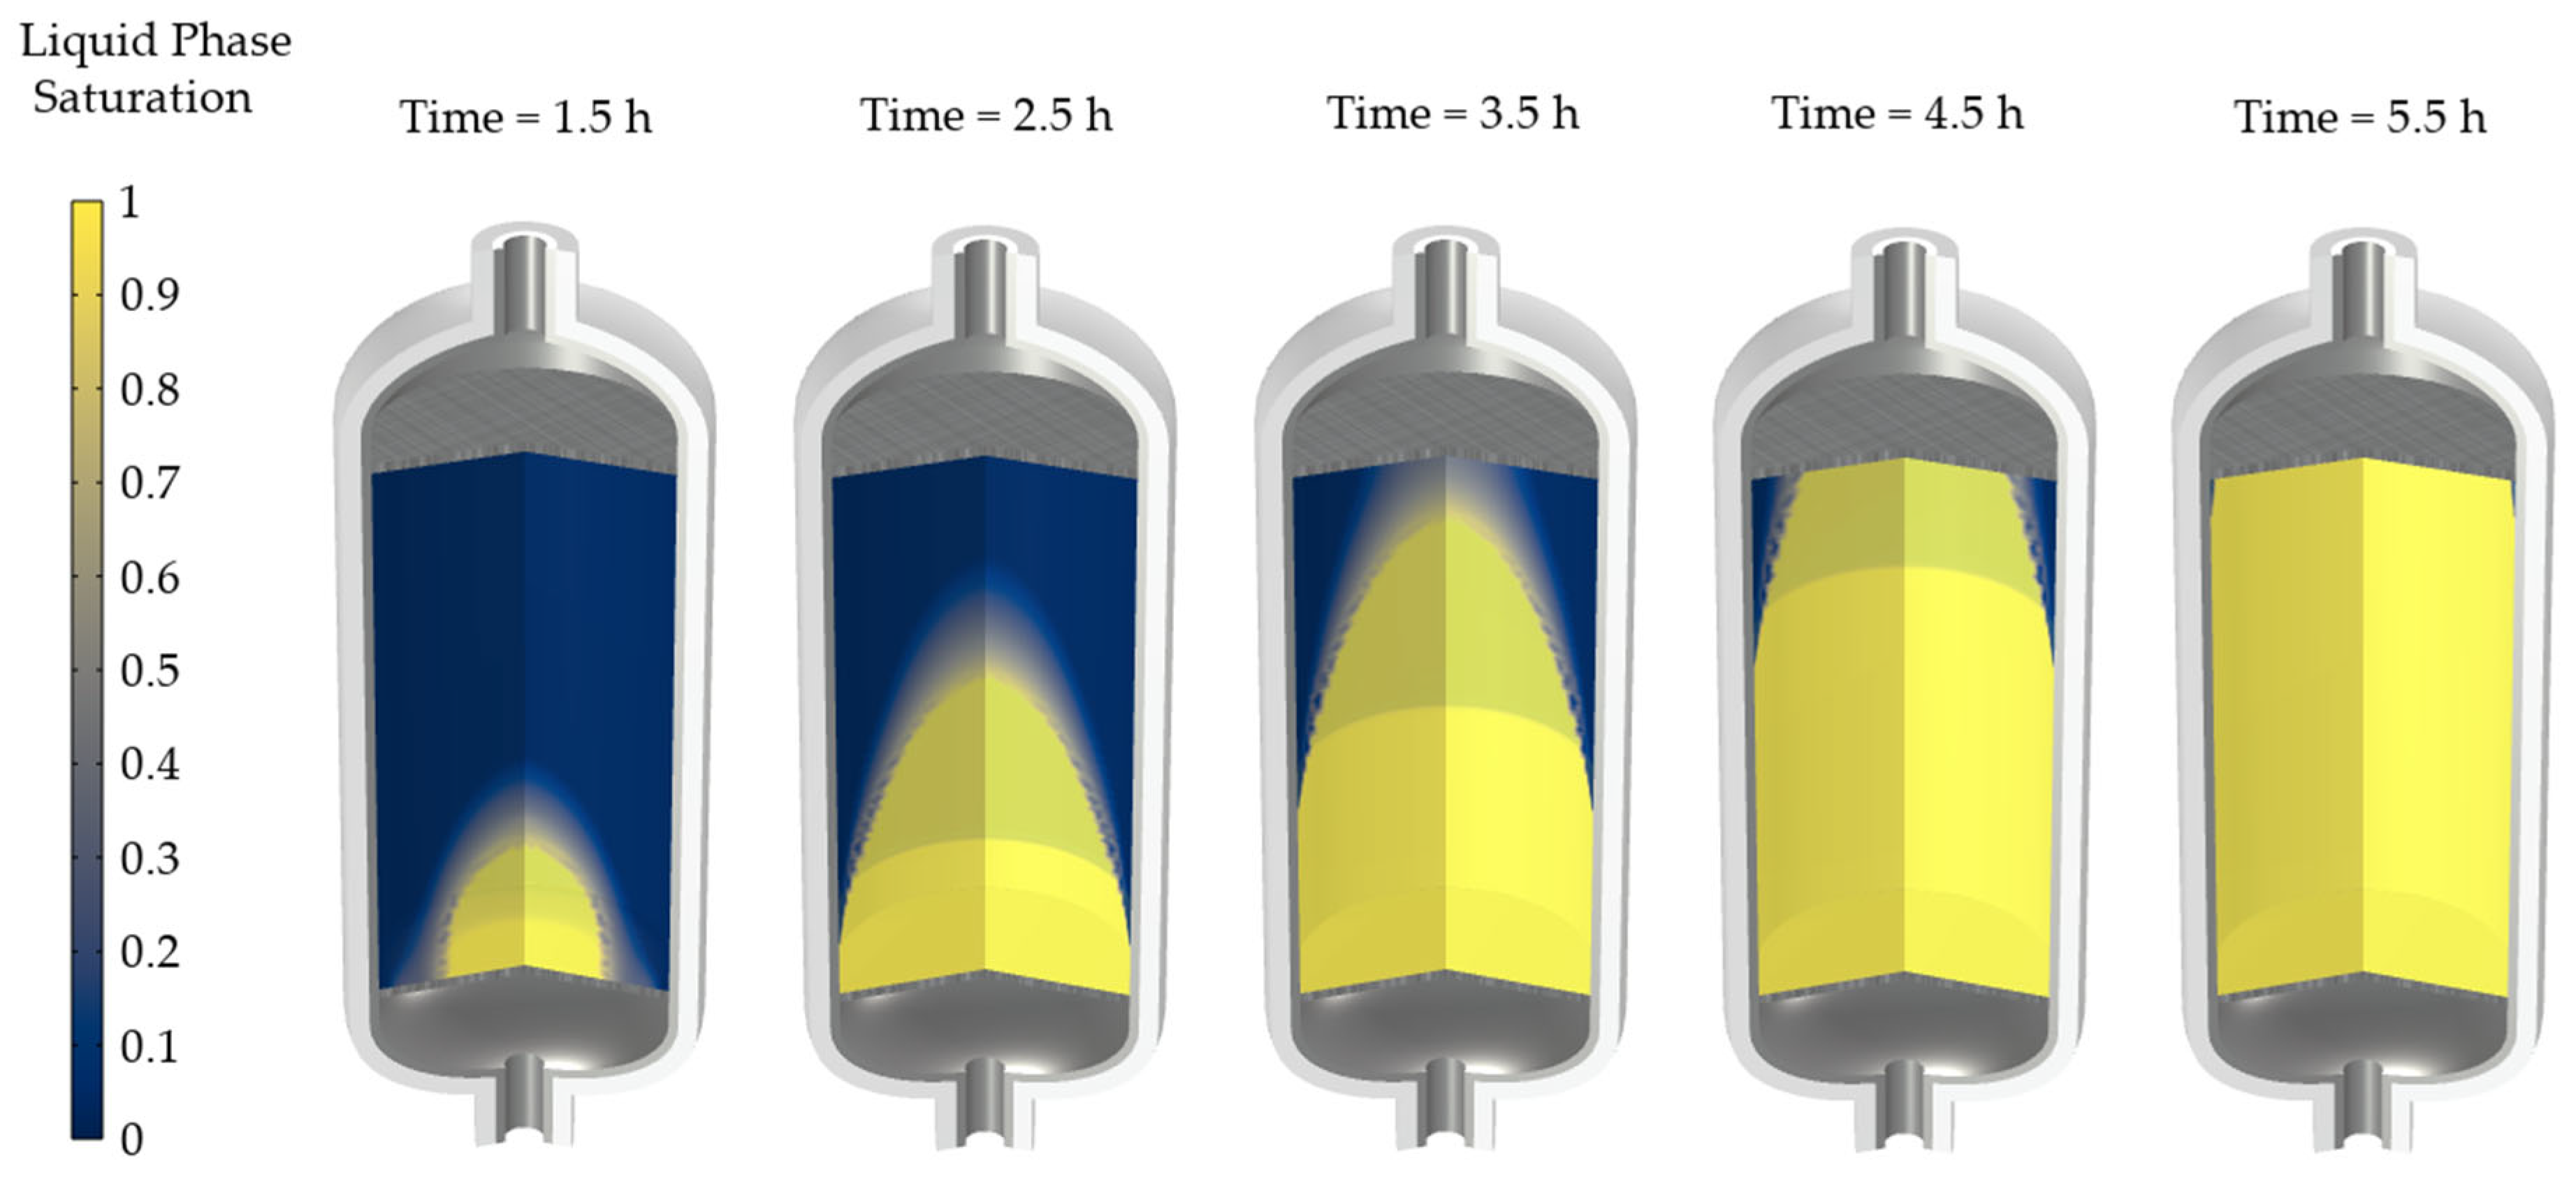
4.1. Fluid Flow and Heat Transfer Characteristics

The velocity and temperature profiles along the axis of the tank for the bed at t = 4 h are shown in Figure 2. The streamlines are evenly distributed through the packed bed region, as seen in the figure. The air heats this region before exiting from the top of the tank. The area with the highest temperature is at the lower portion of the bed, while the area with the lowest temperature is at the top portion.
The distribution of the liquid fraction over time during charging is shown in Figure 3. The solid phase is colored in dark blue, and the liquid phase is colored in yellow. The PCMs are observed to melt from the bottom to the top of the storage tank in the same direction as the air flows through the tank. In the course of the charging process, the bed temperature increases. Along with that increase in temperature, the fraction of the melted PCM also increases. The liquid fraction is at its minimum level at the beginning of the charging process, and it is at the maximum level towards its end.

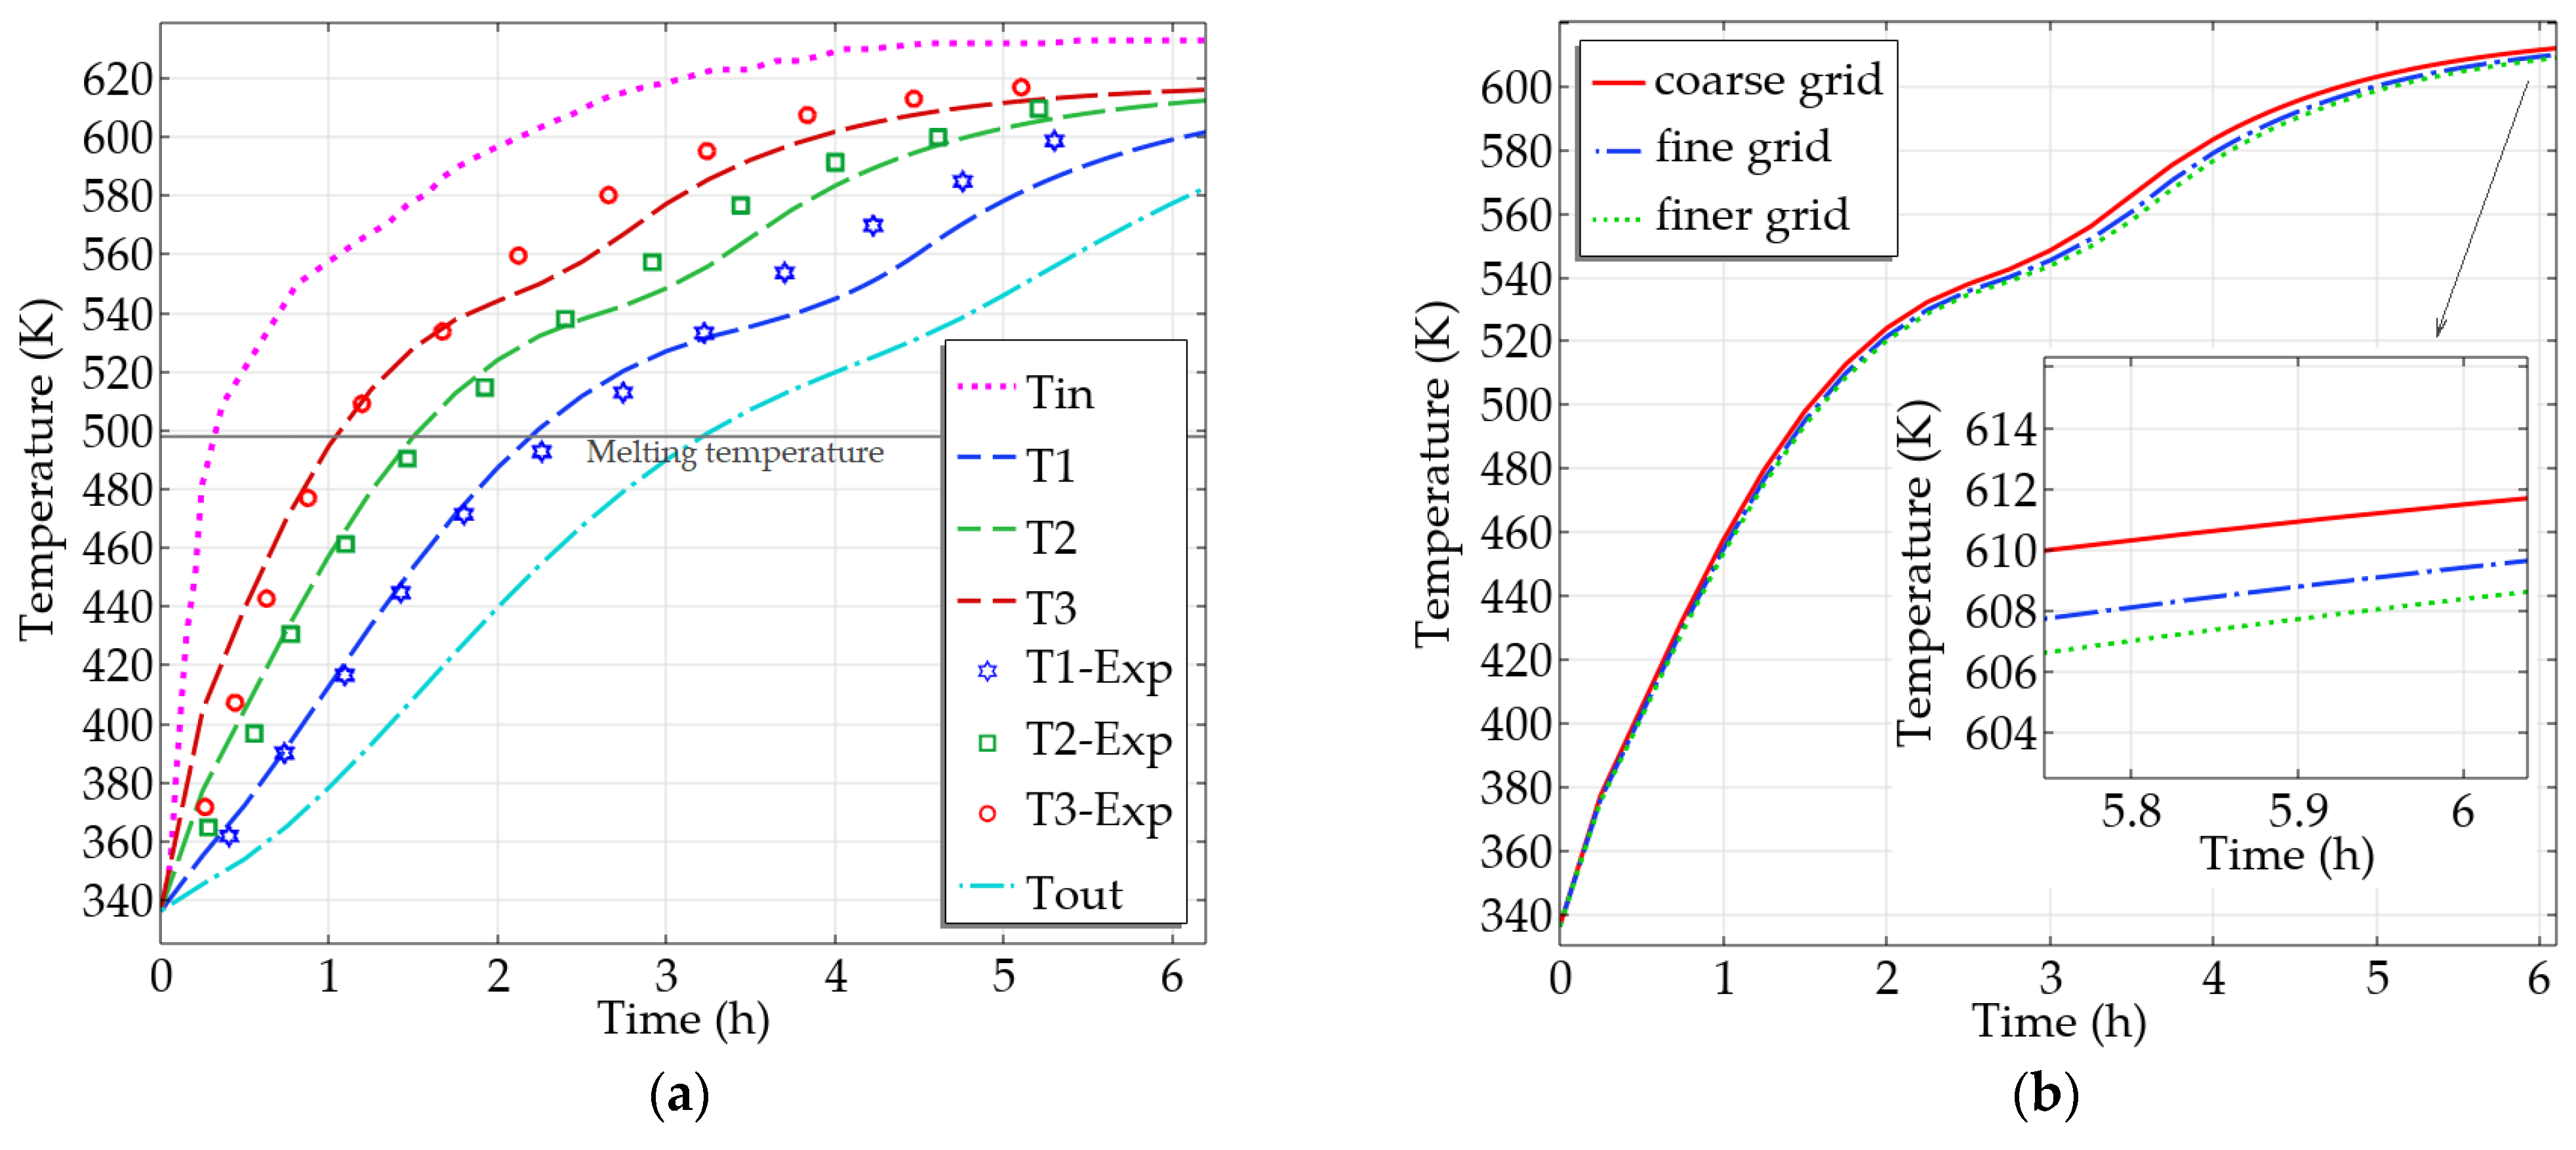
4.2. Model Validation and Grid Independence Analyses

The temporal variation of the air temperature during the charging process at three locations along the axial direction is illustrated in Figure 4a. As can be observed, the temperature distribution within the TES tank is not uniform; the temperature at the bottom is greater than the one at the top on the same axis. Before reaching the melting temperature, the temperature inside the packed bed rises sharply and consistently in the axial direction. Once the temperature of capsules reaches the melting point (498 K), an endothermic phase transition process occurs. The stable temperature range of the phase transition process is difficult to distinguish due to the low latent heat. After this, the process of liquid sensible heat starts, and the temperature field inside the tank begins to rise again.
Model validation is carried out by comparing the numerical and experimental data, as illustrated in the same figure. The actual and the modeling inlet temperature profiles are identical throughout the charging time. This constraint is essential to ensure that the numerical and experimental results are in good agreement. The experimental data for the temperature progression patterns are for the same measuring points as the numerical study. Close and agreeing temperature profiles can be observed from these comparisons. The discrepancy between the numerical model and the tests can be explained by several reasons, such as the assumptions related to the heat loss from the system boundary and experimental uncertainties.
A grid sensitivity analysis is performed to balance the accuracy and computing resources for different grid sizes and to ensure that the results are independent of the grid size used to mesh the geometry. Grid independence is examined using 28,653 (coarse), 47,482 (fine), and 75,274 (finer) elements. Figure 4b demonstrates the variation in the average temperature of the air in the bed during charging for these three cases. Since the deviation between the results for the fine and the finer grids are not significant, the mesh with 47,482 elements is used for all calculations as a compromise between calculation time and accuracy. Three distinct time steps—0.1 s, 0.5 s, and 1 s—are checked in order to find the best alternative. Based on our analysis, the size of the time step has only a minor impact on the results; therefore, a time step of 1 s is chosen for this study.

4.3. Performance Analysis

In this section, the thermal behavior of the PBLHS system is investigated in terms of its key performance indicators under various operating conditions. A PBLHS system with the dimensions of D = 0.305 m and H = 0.67 m, the porosity of ε = 0.51, the capsule diameter of d p = 51 mm, and an inlet velocity of u = 7.5 m/s is considered to be the base case. For all investigated cases, the charging process starts with the initial average temperature of the bed at 336 K and ends when the entire bed reaches the average temperature of 610 K.

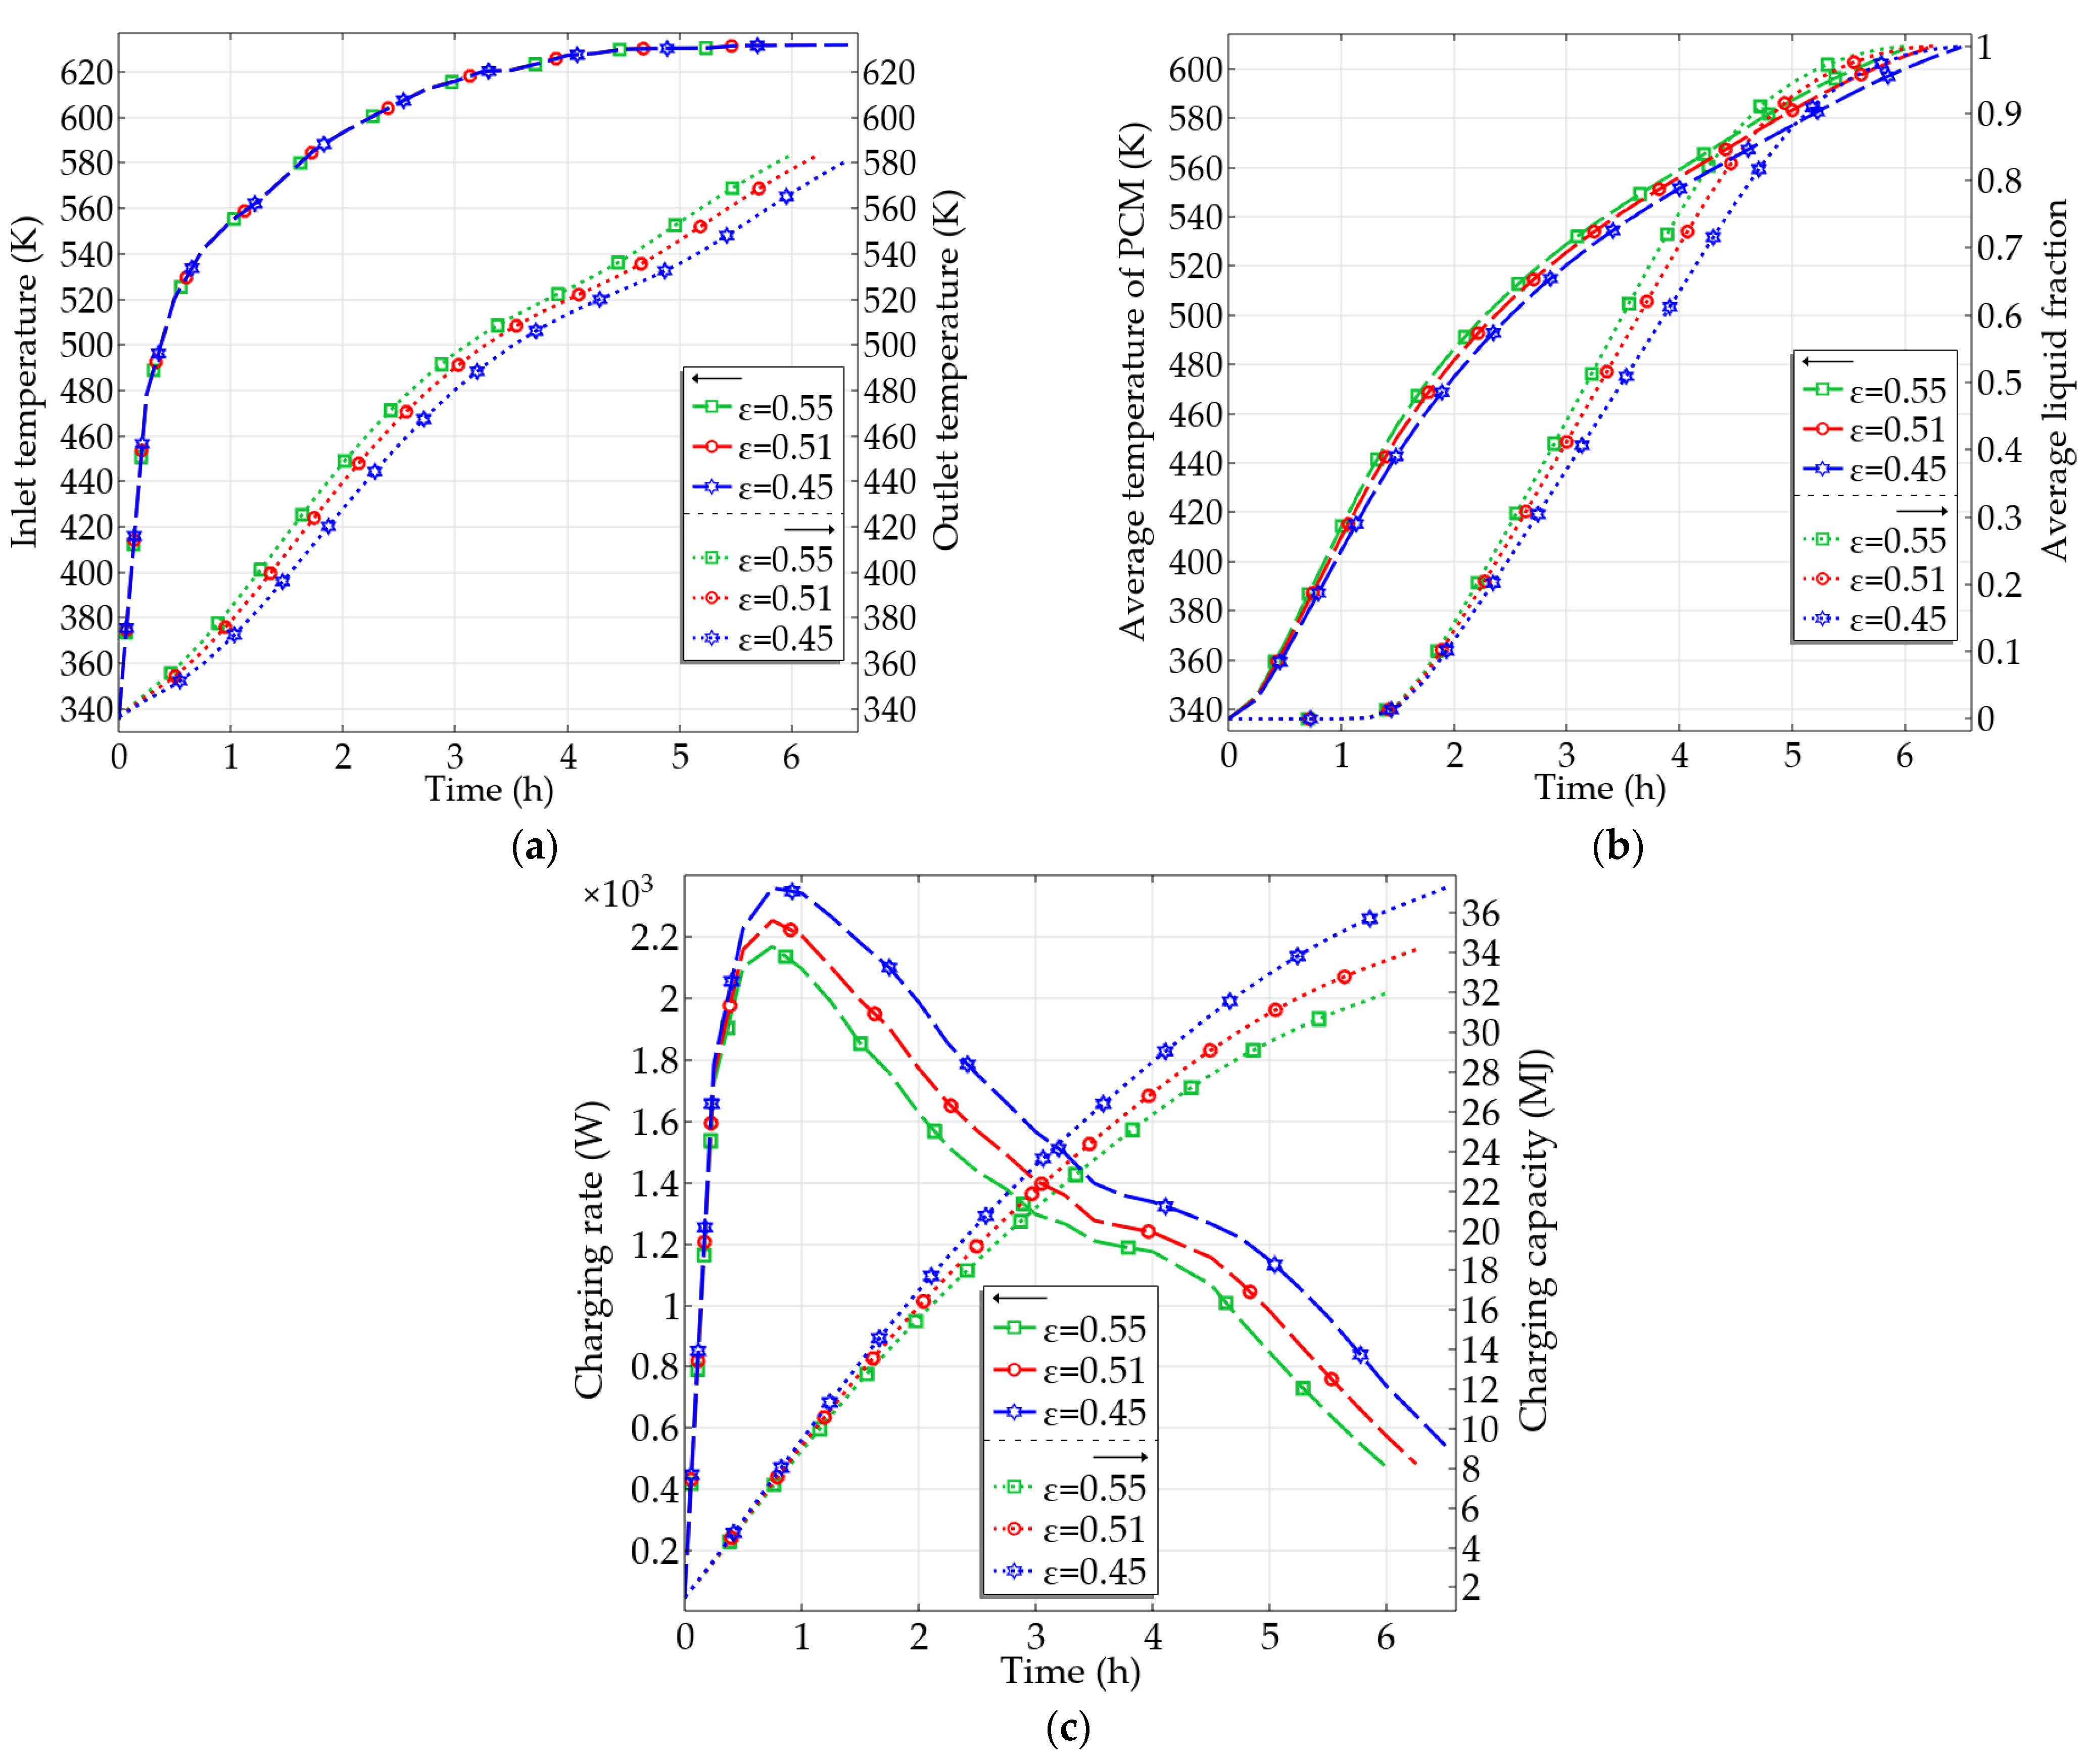
4.3.1. Effect of Porosity

Porosity influences the amount of thermal energy that can be stored and the heat transfer surface area per unit volume between the capsules and the air. For a given capsule size and volume of the tank, three different bed porosities are evaluated: namely, 0.45 (low), 0.51 (medium), and 0.55 (high) corresponding to 335, 298, and 274 capsules in the bed, respectively.
The variations of outlet temperatures with time for these three cases are illustrated in Figure 5a. Although the inlet temperatures are unaffected by the variation in the bed properties, they are presented to highlight the instantaneous temperature difference between the inlet and outlet. It can be seen that the increase in bed porosity results in an increase in outlet temperature due to enhanced convective heat transfer. Correspondingly, Figure 5b presents the transient variation of the average temperature of the PCM and liquid fraction in the bed. It shows that a higher bed porosity results in a steeper increase in the PCM temperature. This is because a larger porosity increases the volume of air present in the bed, resulting in a greater heat transfer rate from air to PCM. Similarly, the change in the average liquid fraction for the case with high porosity has a steeper trend compared to the other two cases, indicating that the higher the porosity, the higher the rate of phase change. When porosity increases, the PCM content decreases, thereby increasing the phase transition rate and average liquid fraction.
The instantaneous charging rate and charging capacity for the three considered cases are shown in Figure 5c. The charging rate steadily increases throughout the initial stages of the charging process. This rate is highest at the intermediate stage of the solid-phase sensible heat storage when the air-to-PCM temperature difference is greatest. Following that, the average temperature of the system rises, lowering the instantaneous charging rate. The initial steep slope demonstrates a greater proportionate rise in the charging rate with decreasing porosity. This peak can be seen to decline with the increase in bed porosity. According to Equation (12), increasing the porosity lowers the volumetric heat transfer coefficient, h v o l , and the charging rate.
Both the charging capacity and the charging time decrease as porosity increases. When porosity increases from 0.45 to 0.55, the maximum energy storage drops from 37.1 MJ to 31.9 MJ, while the charging time decreases from 6.5 h to 6 h. Based on Equation (37), the heat transfer between the air and the PCM depends on the temperature difference between the inlet and outlet. Since this difference is lower for the bed with high porosity, accumulative heat storage capacity is also lower for this case.
The essential performance metrics of the storage system for the three considered bed porosity cases are estimated and presented in Table 2. According to this table, decreasing the porosity increases every performance metric. The case with high porosity exhibits a lower efficiency compared to the other cases since high porosity means fewer capsules, which implies less PCM to store energy and lower maximum stored energy. Aside from the prolonged charging time, the data point to low porosity as a promising choice for improving the performance of the PBLHS system.

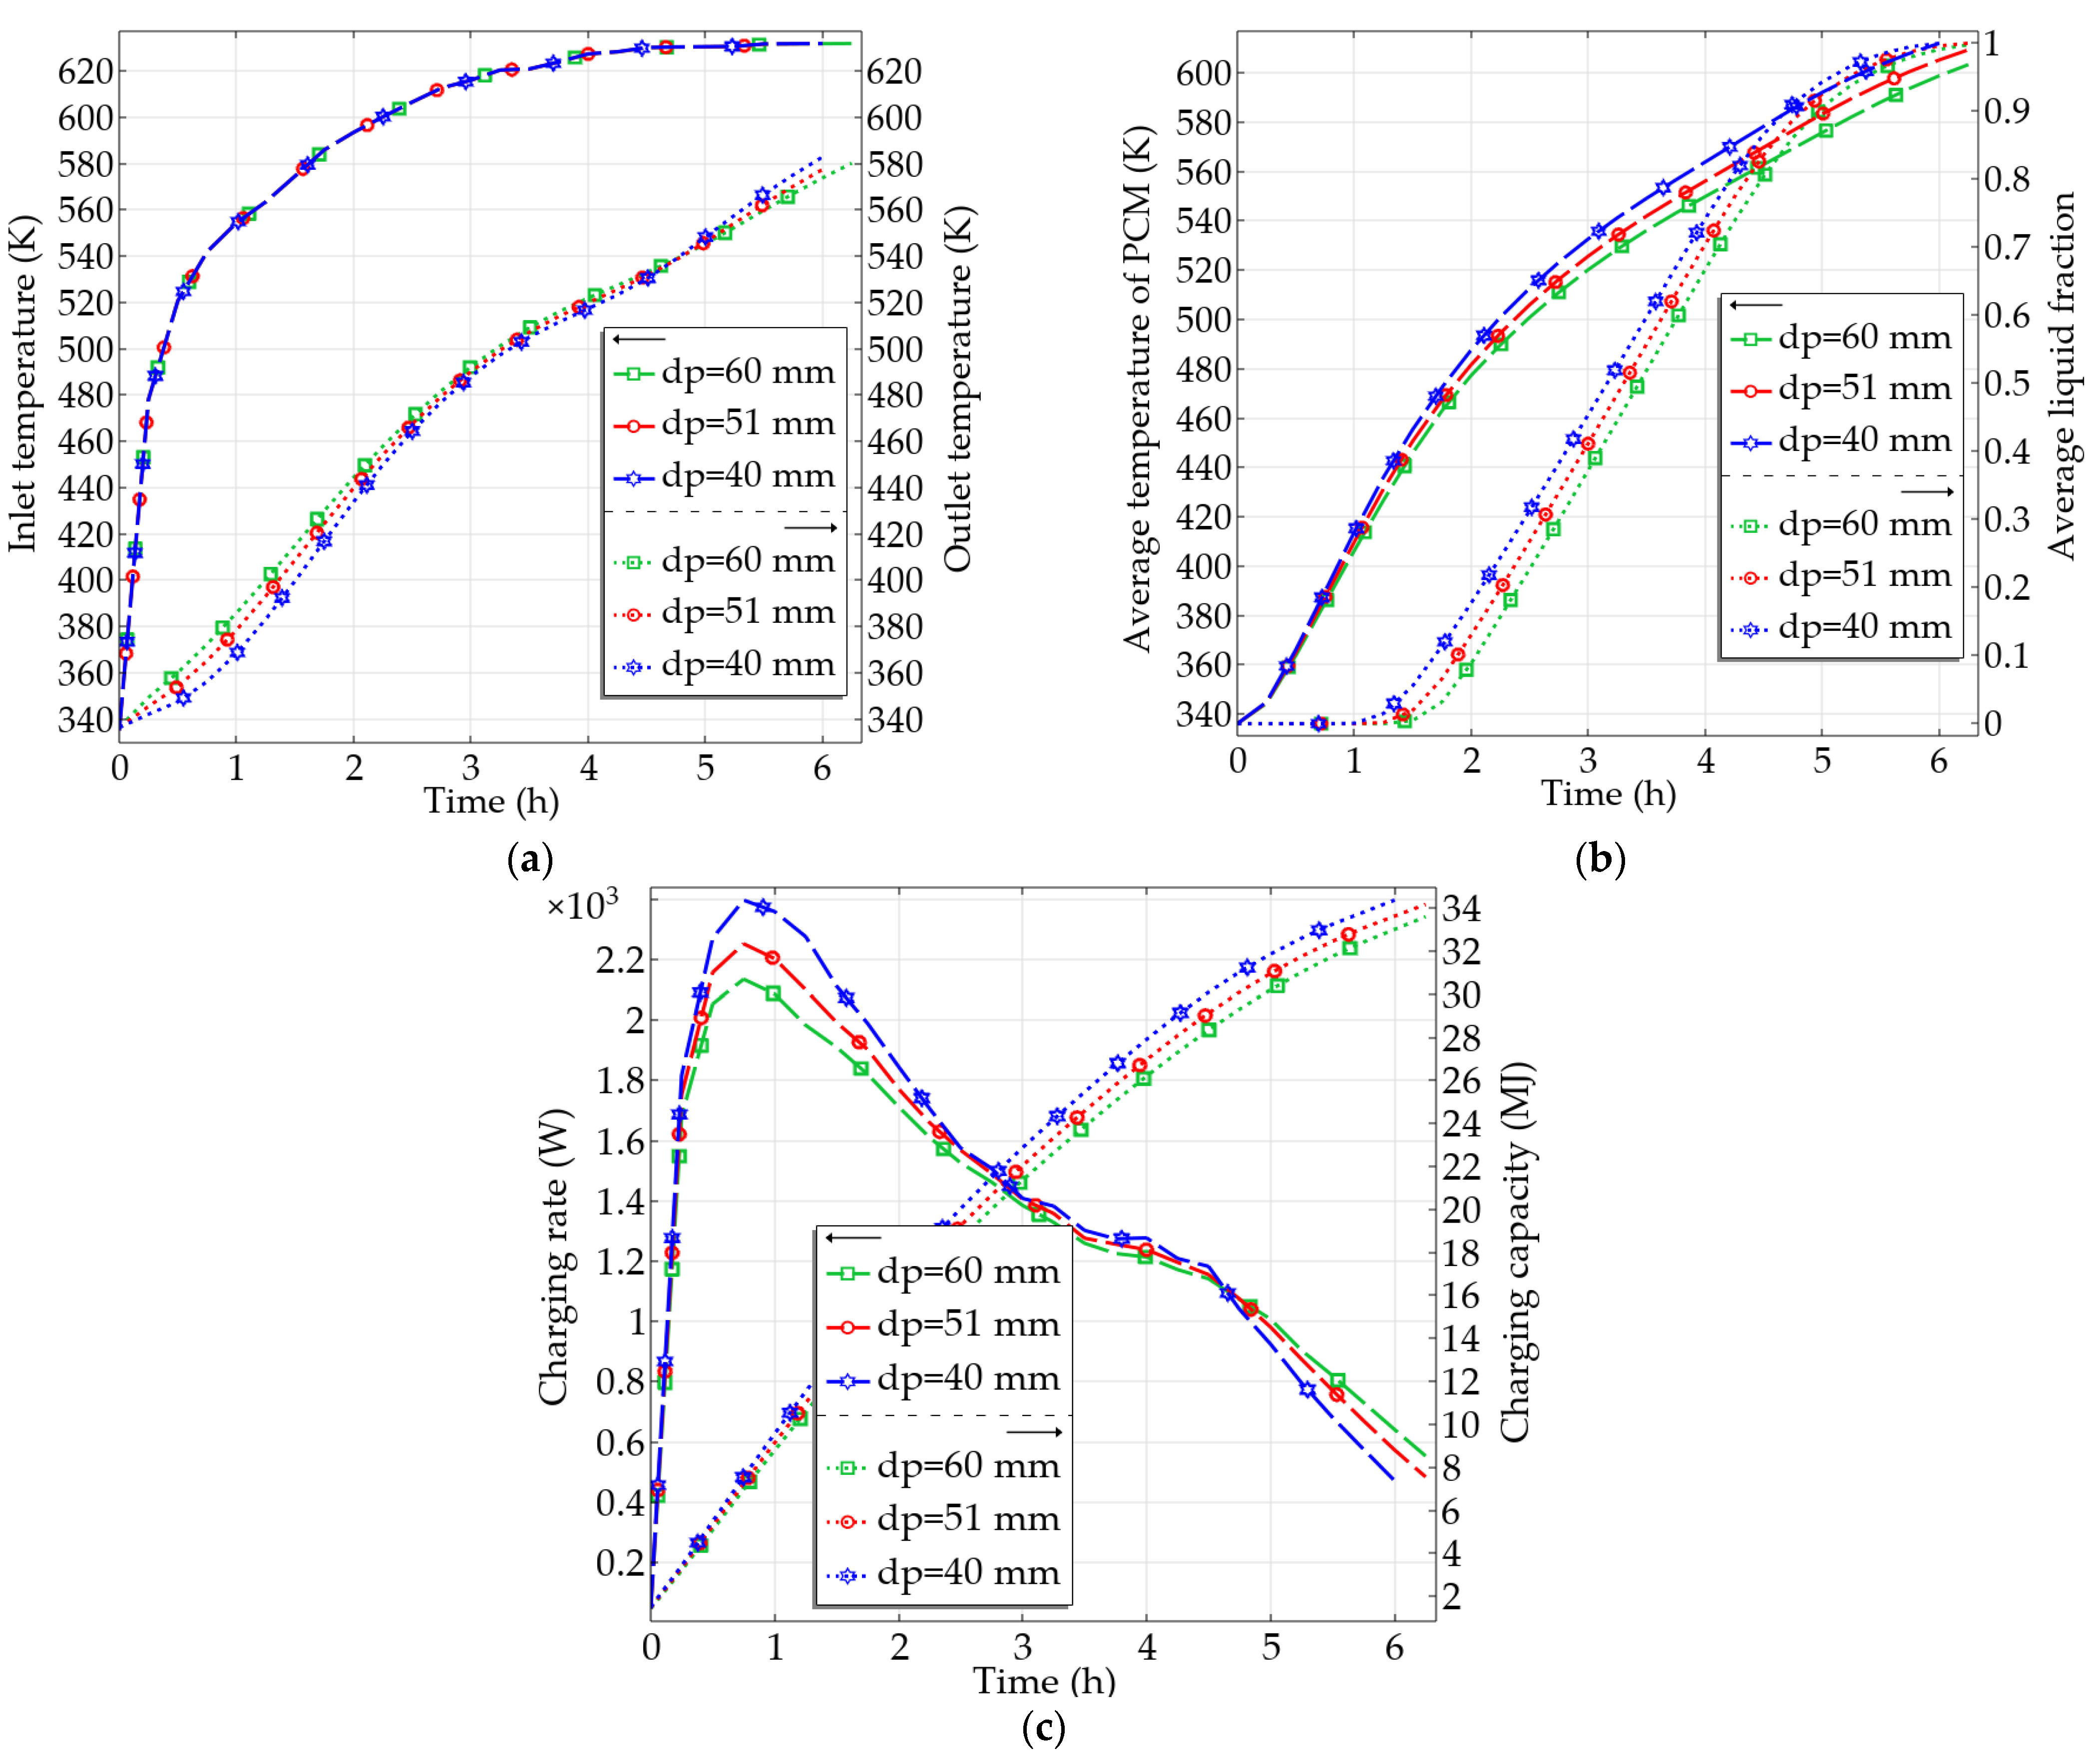
4.3.2. Effect of PCM Capsule Diameter

The influence of the diameter of PCM capsules on the thermal performance of the PBLHS system is investigated by keeping all other variables in the model as the base case and changing only the capsule diameter. The diameters of the capsules in the numerical simulation are d p = 60, 51, and 40 mm, corresponding to 183, 298, and 619 capsules, respectively in the bed.
The temporal variation of inlet and outlet temperature for the three simulated cases are presented in Figure 6a. The changes in capsule diameter are seen to have a modest impact on the outlet temperature. Therefore, the temperature difference between the inlet and outlet is almost identical in all cases. Figure 6b shows the transient variation of the average temperature of the PCM together with the liquid fraction in the bed. The smaller the diameter, the steeper the slope of the average temperature. Similarly, smaller PCM capsules experience the phase transition earlier. The reduction in the diameter increases the total number of capsules in the bed as well as the total surface area per unit volume. Higher surface area to volume reduces the heat transfer resistance between the air and PCM. In addition to that, smaller capsules have lower thermal resistance between their centers and their walls. An increase in the heat transfer rate can also be explained by the volumetric heat transfer coefficient presented in Equation (12). As the diameter becomes smaller, h v o l increases, enhancing convective heat transfer between the air and the PCM capsules. However, the impact does not seem very significant, since the corresponding coefficient also depends on Re, which diminishes as the diameter decreases according to Equation (13).
Figure 6c depicts the charging profiles for a more accurate quantitative and qualitative assessment of the storage performance. The initial rapid increase in the charging rate to maximum values with the small capsule diameter exhibits a faster heat transfer rate. The peak value for the charging rate reduces as the capsule size increases. These peaks form in the initial stages of the charging process when the top portion of the storage tank is still cold, and thus the thermal gradients along its height are high. However, when the outlet temperatures rise over time, the thermal gradients decrease, resulting in a drop in the charging rates.
The charging capacity rises progressively, the rate of which decreases as the PCM temperature approaches the inlet temperatures. As depicted in the figure, using small-sized capsules results in a higher charging rate, thereby reducing the charging time. The energy levels rise with the increasing charging time during the early stage of the charging process, and the smaller the capsules, the larger this trend. The heat storage capacity reaches a maximum at the end of the charging process, and this maximum charge capacity is slightly higher for smaller capsule diameters.
The important performance metrics are extracted from the simulations for the three case studies on the effect of the diameter of the capsules and presented in Table 3. Since the total PCM fraction of the bed is unaffected by the number of capsules in the bed, the maximum energy that can be stored is identical in all three cases. Using smaller capsules improves charging rate and capacity while shortening the charging time marginally. As the diameter of the capsule increases, so does the charging efficiency of the PBLHS. Therefore, while small-sized capsules are ideal in terms of charging time, they are not favorable in terms of charging efficiency.

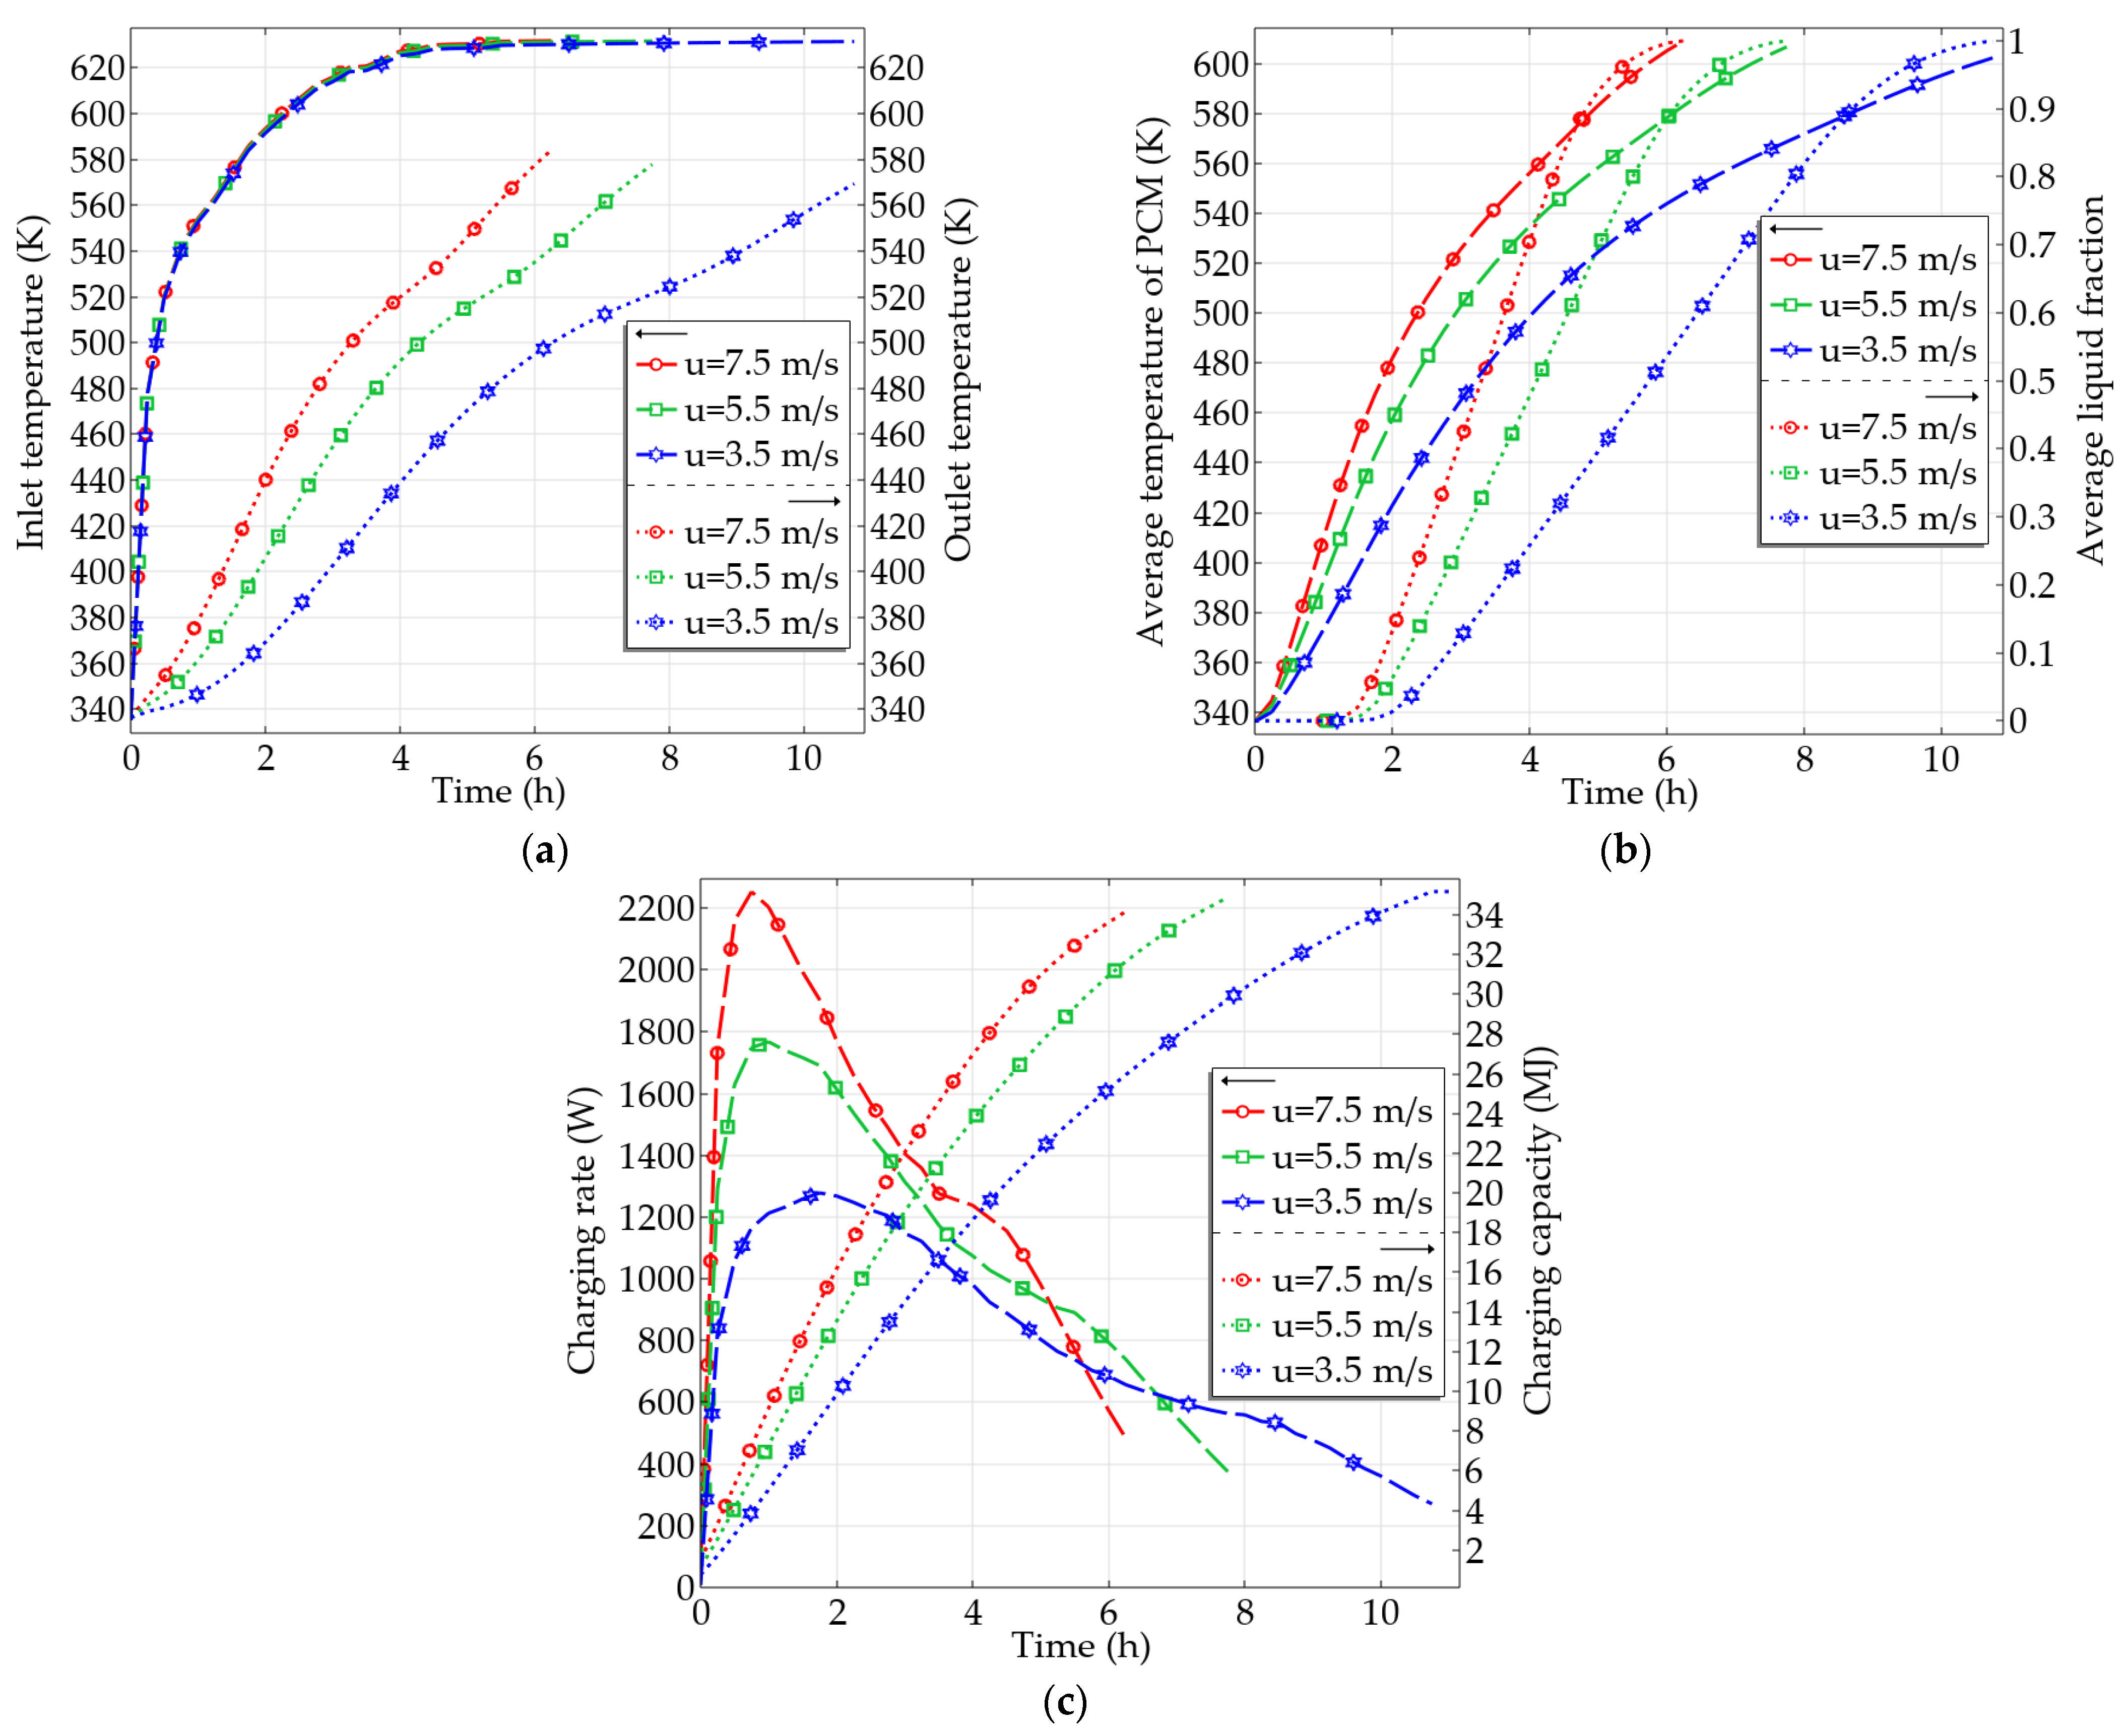
4.3.3. Effect of Inlet Velocity

Three inlet velocities, namely 3.5 m/s (low), 5.5 m/s (medium), and 7.5 m/s (high), are tested to see how they affect the thermal performance of the PBLHS system. Figure 7a shows the influence of inlet velocity on the air outlet temperature with time. As the inlet velocity increases, the outlet temperature starts rising early. As a result, a lower temperature difference between the inlet and outlet of the air is obtained at the high inlet velocity.
The temporal variations of the average temperature of PCM and the liquid fraction are demonstrated in Figure 7b. It can be seen that the charging duration becomes longer with a decrease in inlet velocity. The charging time is increased by 24% and 35% when the flow rate is reduced from 7.5 to 5.5 m/s and from 5.5 to 3.5 m/s, respectively. This occurs due to the slower rate of energy extraction from air to PCM in the bed. Similarly, a longer phase change transition period is seen with the lowest flow rate. This indicates that the higher the inlet velocity, the faster the phase change process.
The influence of inlet velocity on the charging rate and charging capacity is illustrated in Figure 7c. As can be seen, a high flow inlet velocity results in faster and enhanced convective heat transfer between air and PCM due to the increase in h v o l . The peak charging rate is seen to decrease with a decrease in the inlet velocity due to a drop in the rate of heat extraction. Reducing the flow velocity from high to medium decreases the heat transfer, such that the peak value is obtained later within 20 min of charging. As a result, the energy storage process is completed over a longer period compared to when using high flow velocity.
The results reveal that the smaller the inlet velocities, the greater the temperature difference between the inlet and outlet of the tank. This rise in the temperature difference is expected to lead to a higher instantaneous charging capacity. However, based on Equation (37), this capacity diminishes due to the low mass flow rate. The total accumulated energy for the inlet velocity of 7.5, 5.5, and 3.5 m/s is 33.9, 34.5, and 35.2 MJ, respectively, indicating that the velocity has a negligible effect on the charging capacity.
Table 4 summarizes the effect of different inlet velocities on the performance metrics of the PBLHS system. Low inlet velocity reduces the charging rate while increasing the charging time and charging capacity. Since the maximum stored energy remains unchanged, the charging efficiency decreases as the charging capacity increases. High inlet velocity exhibits higher charging efficiency due to the shorter charging time and greater charging rate. As a result, given the appropriate limits, it is recommended that the PBLHS system be operated with high inlet velocities.

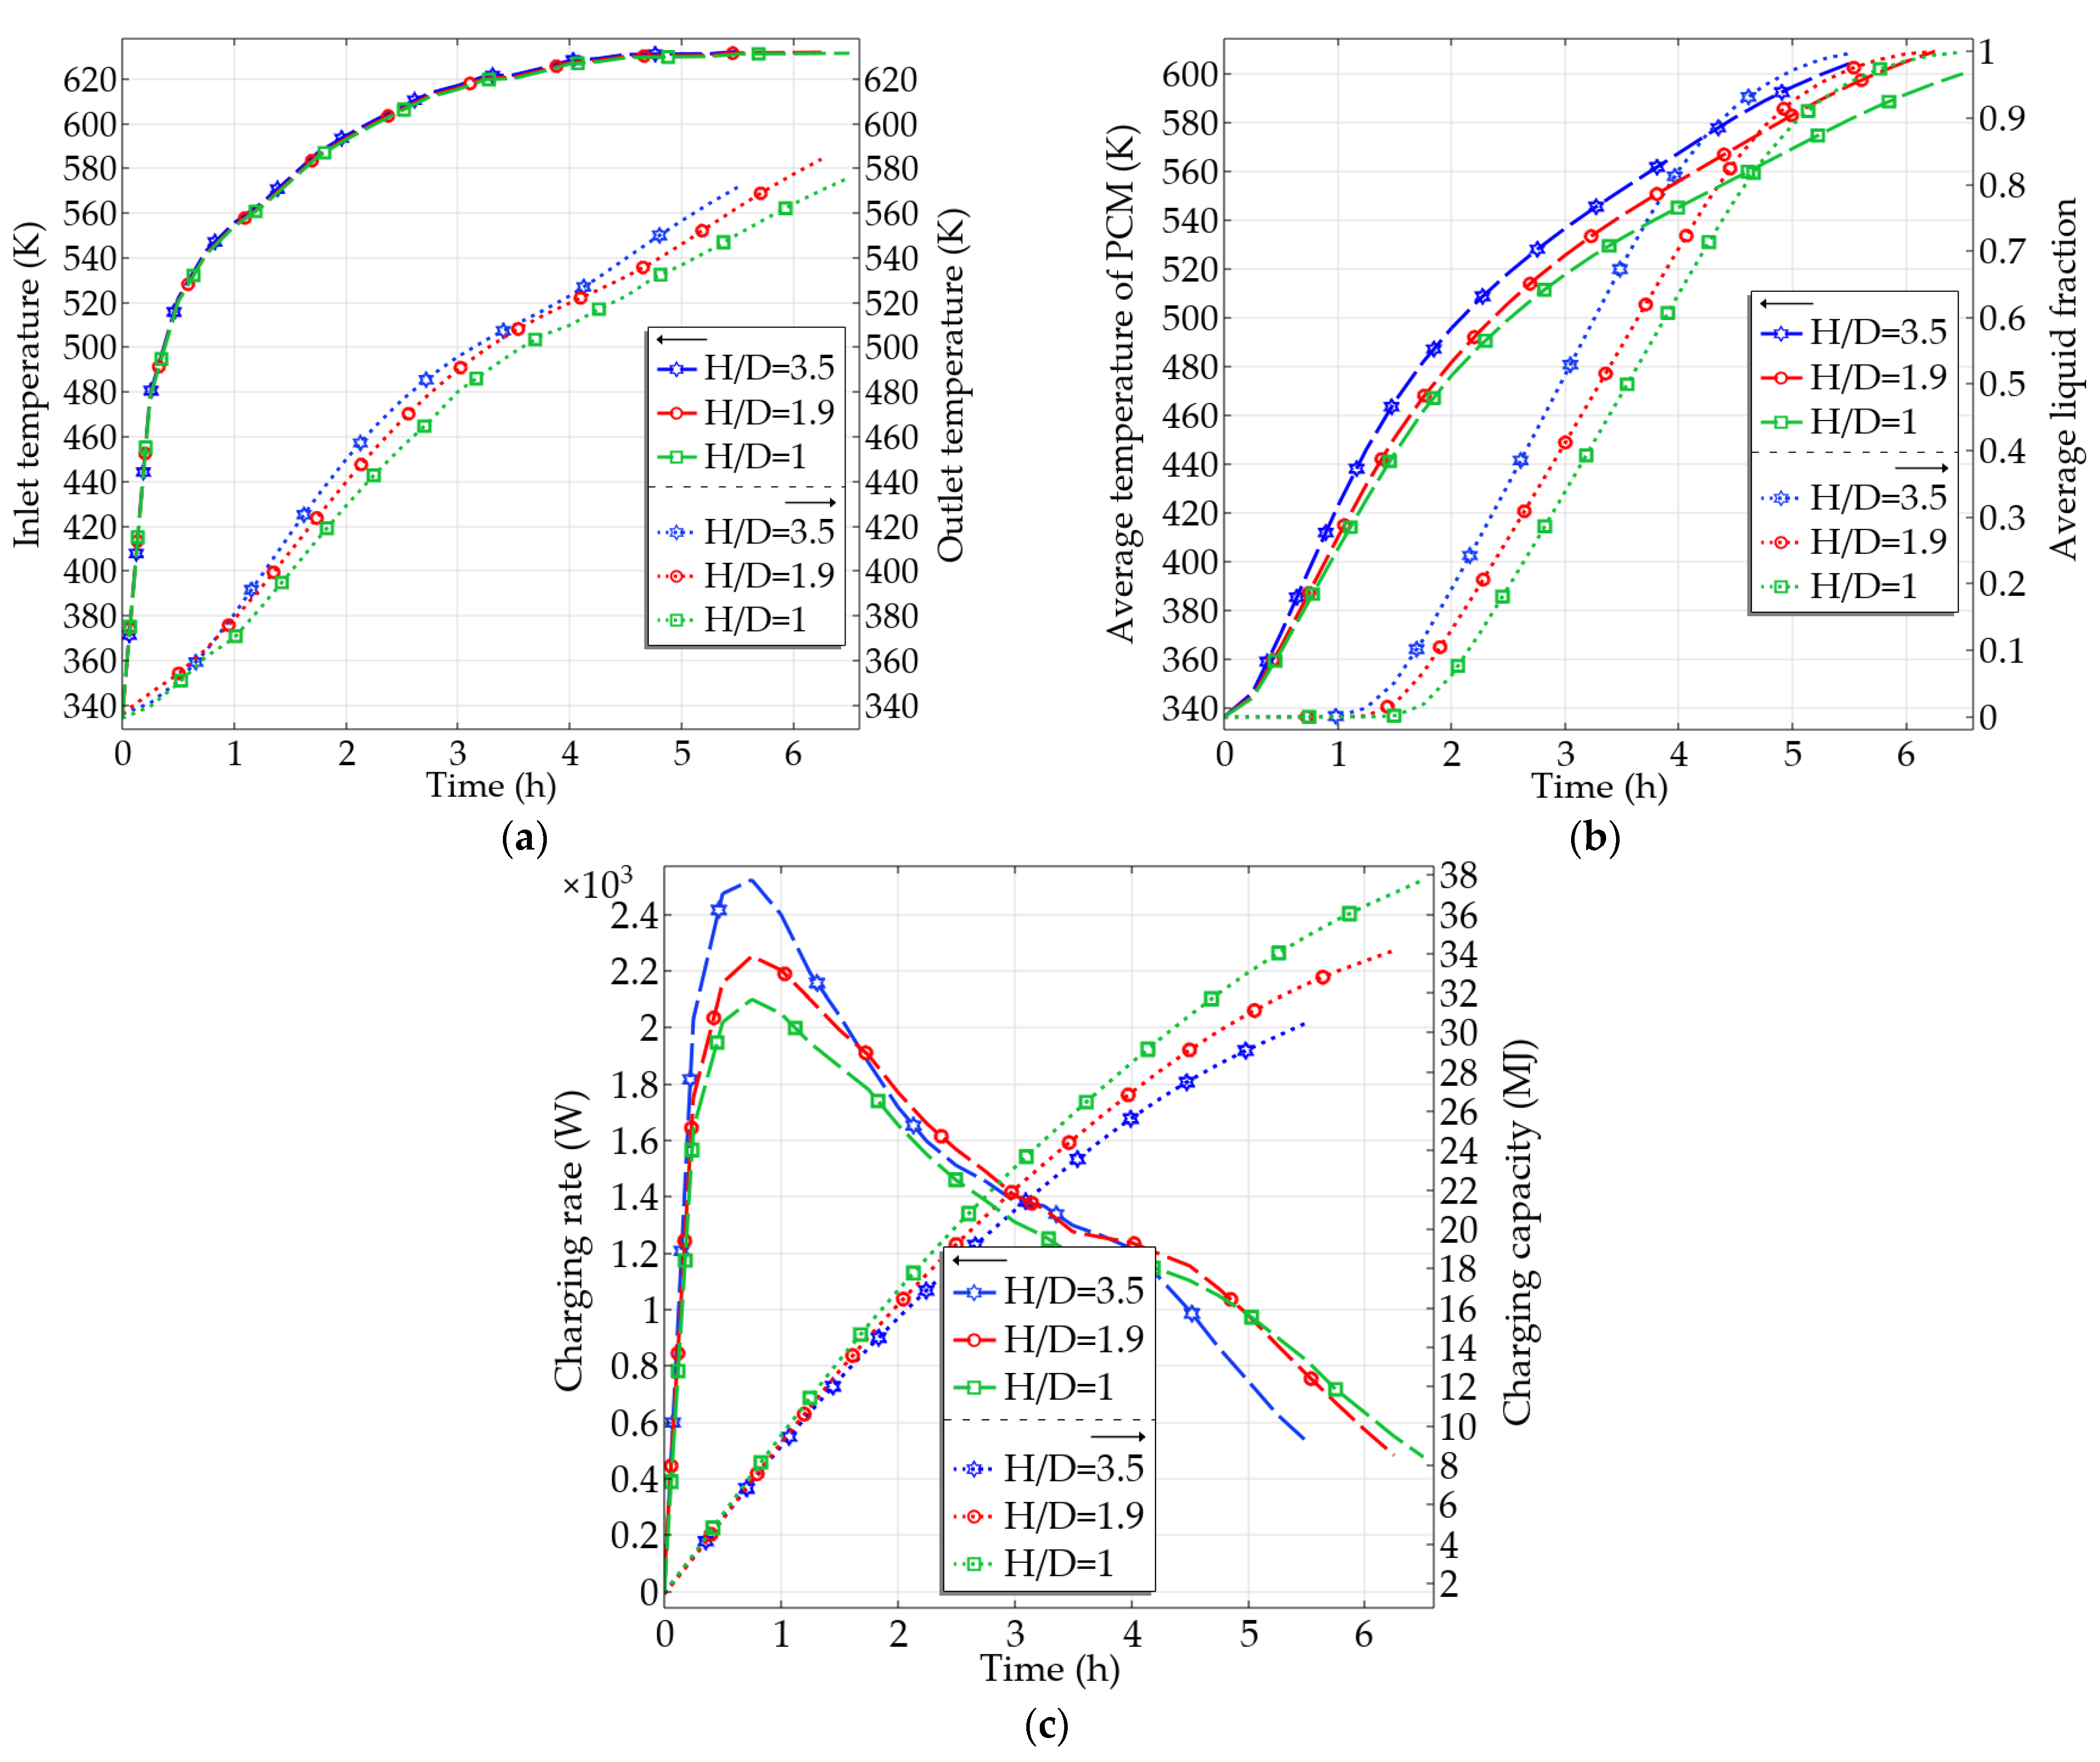
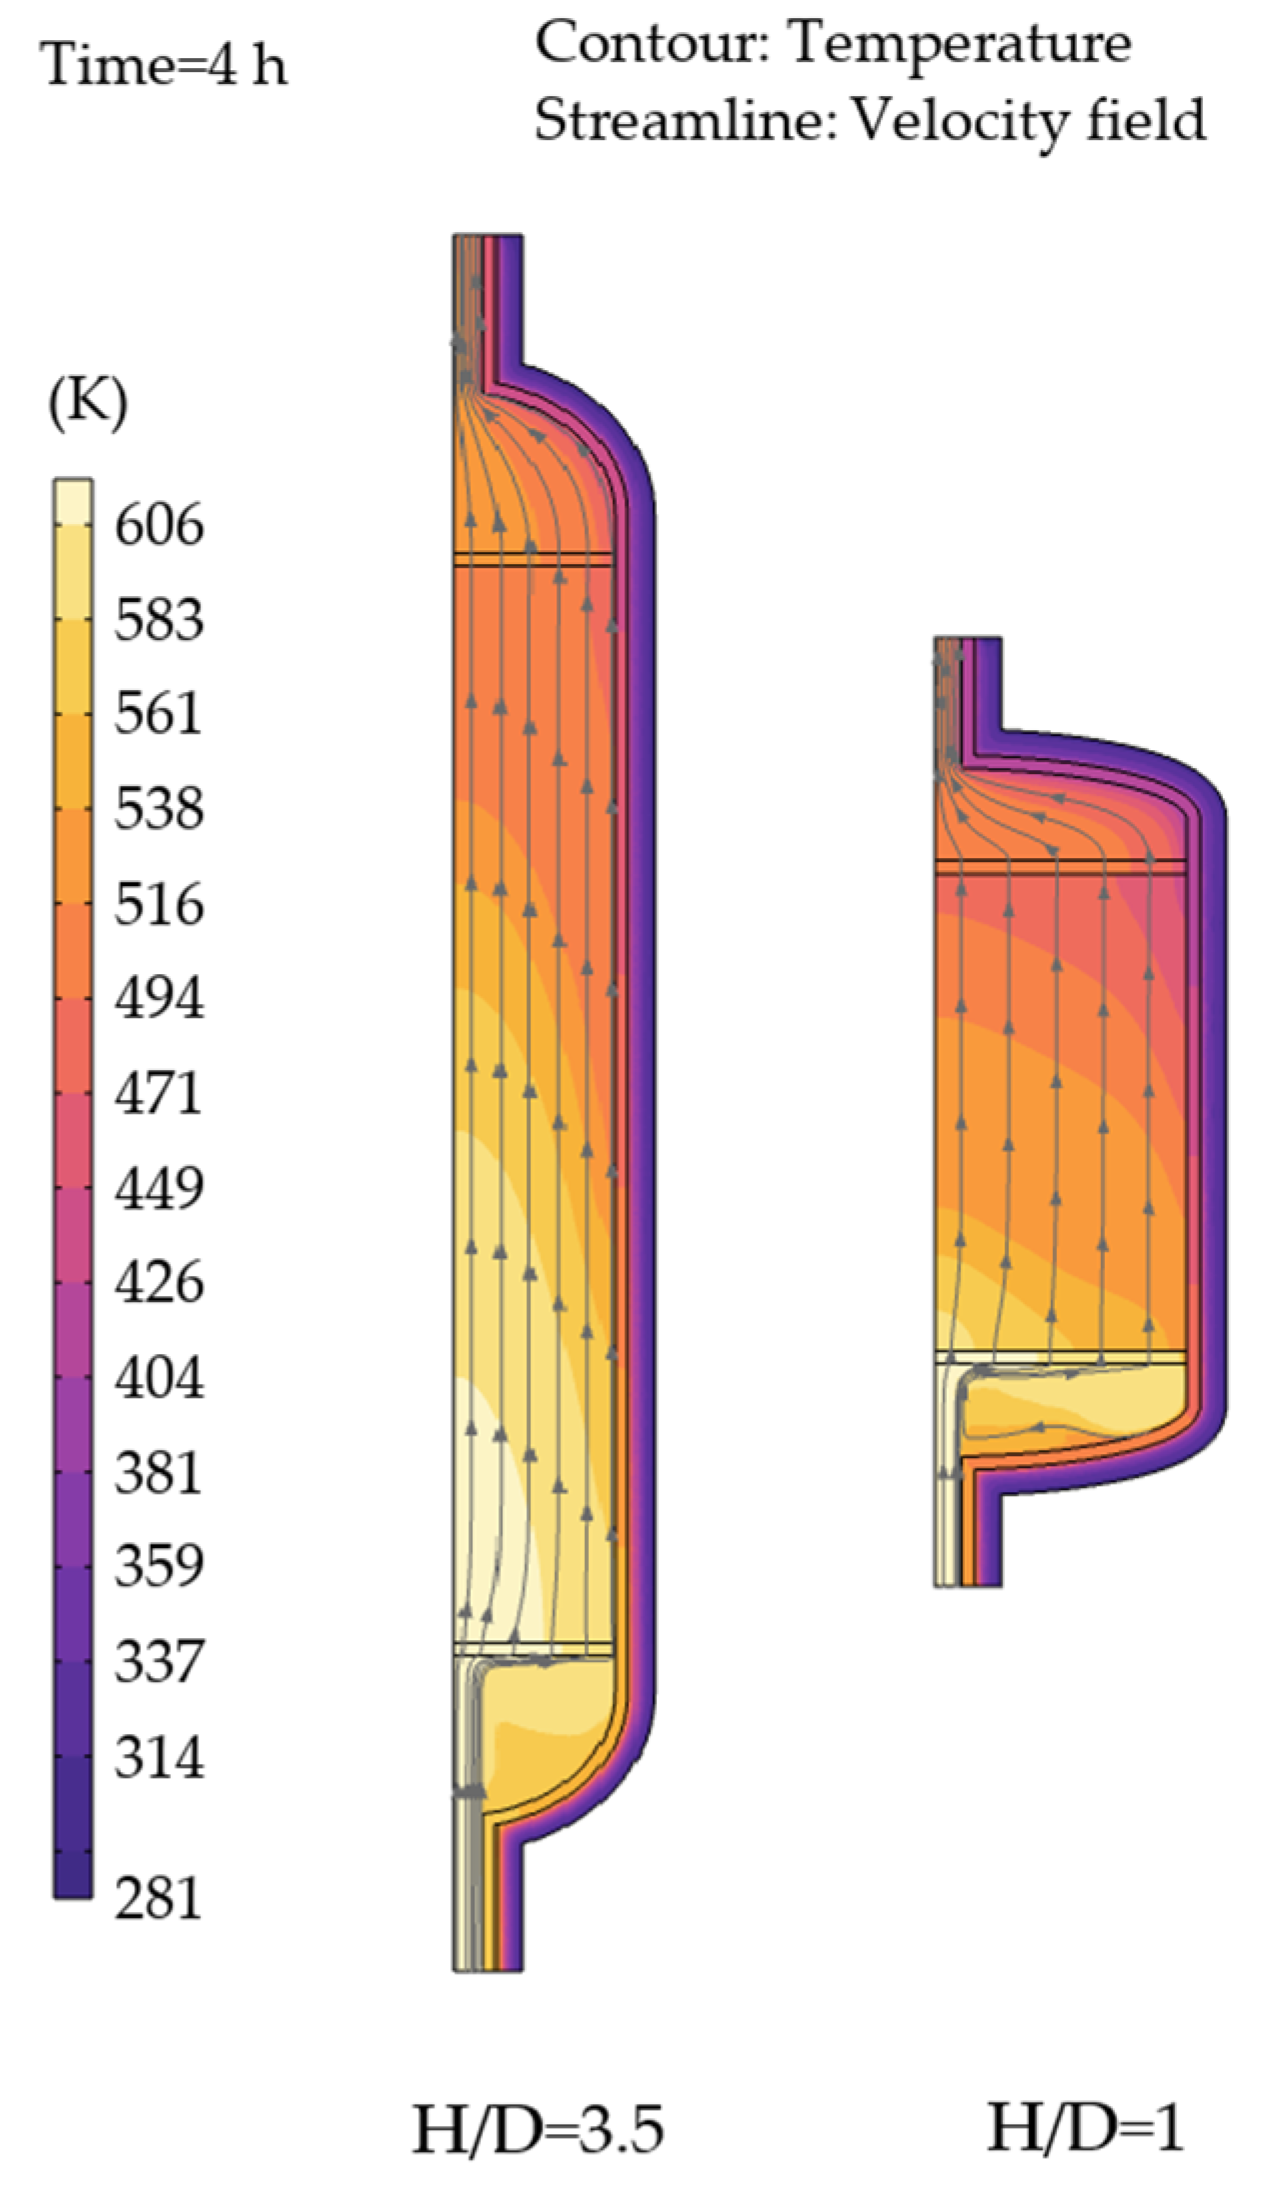
4.3.4. Effect of Bed Height-to-Diameter Aspect Ratio

Another important parameter affecting the performance in PBLHS is the height-to-diameter aspect ratio of the bed. It is possible to alter this aspect ratio of a packed bed to maintain a fixed volume. In this case, the maximum energy storage capacity remains almost the same. Charging is carried out with three different sizes in terms of the bed height-to-diameter aspect ratios, namely H/D = 1 (low), 1.9 (medium), and 3.5 (high), to evaluate the effect of this ratio on the charging characteristics.
The effect of the dimensions of the PBLHS system on the outlet temperature is depicted in Figure 8a. It is evident from the figure that the rate of rise in the air outlet temperature is highest for H/D = 3.5 and lowest for H/D = 1. Therefore, the difference between the inlet and outlet temperatures is highest for H/D = 1 and lowest for H/D = 3.5. Correspondingly, Figure 8b shows the evolution of the average temperature and liquid fraction of the PCM during the charging period. The average temperature of the PCM rises earlier when the aspect ratio is high. A delayed phase transition is seen for a low aspect ratio due to poor distribution of air throughout the bed. This phenomenon is illustrated in Figure 9 by using the temperature contour at the charging time, t = 4 h, for the high and low aspect ratio cases. At a low aspect ratio, the air flows up the bed without any significant heat exchange with the inner volume near the tank sides compared to the one with a higher aspect ratio. Therefore, the rate of increase in the PCM temperature for the low aspect ratio is less than that with a high aspect ratio. This results in a longer charging time due to the larger thermal gradient between the inlet and outlet of the bed.
To fully comprehend and quantify the charging processes for these three cases, the instantaneous charging rates, as well as accumulated charging capacities are computed and given in Figure 8c. For the high aspect ratio, the peak value is higher due to an efficient heat transfer between the air and PCM. Therefore, this case needs a lower energy input compared to the other two cases to fully charge the bed and, subsequently, speed up the process. In the low aspect ratio case, the larger temperature difference between inlet and outlet causes higher instantaneous charging capacity magnitudes, leading to higher charging capacity at the end of the process.
Increasing the aspect ratio from H/D = 1 to H/D = 1.9 reduces the charging capacity by 10.6% and the charging time by 3.3%. Similarly, increasing the aspect ratio from H/D = 1.9 to H/D = 3.5 reduces the charging capacity by 11% and charging time by 11.5%. Therefore, there is a clear advantage in terms of charging time with a higher aspect ratio.
The essential performance indicators for the three different bed height-to-diameter aspect ratio cases are extracted and presented in Table 5. While the bed volume remains constant, the maximum stored energy for each case study varies slightly due to changes in the size of the tank and distributors. For the high aspect ratio case, while the peak charging rate is higher, the average charging rate is lower. The smaller the aspect ratio, the higher the charging capacity, resulting in lower charging efficiency. Overall, due to the shorter charging time and more effective thermal dispersion, the high aspect ratio exhibits the best charging efficiency.

5. Conclusions

This study is a numerical thermal investigation of a PBLHS system loaded with encapsulated PCM. Based on the LTNE approach, a robust mathematical model is built to analyze the effect of porosity, capsule diameter, inlet velocity, and height-to-diameter aspect ratio on the key performance indicators of PBLHS. The following conclusions are drawn based on the extensive measurements and numerical modeling:
  • The charging rate, charging capacity, charging time, and charging efficiency increase for the bed with low porosity since there is more PCM to store the heat.
  • Decreasing the capsule diameter has both negative and positive effects on the bed performance. The lower the capsule diameter, the higher the surface-to-volume ratio and the lower the Re. This results in only a slight change in the charging efficiency.
  • The energy storage rate increases with increasing the inlet velocity, while the energy capacity remains rather constant and unaffected.
  • Faster heat transfer and higher peak energy are achieved by increasing the flow rate. Consequently, maximum energy storage is possible in a shorter period, resulting in higher charging efficiency.
  • Heat exchange becomes more effective with increasing the height-to-diameter aspect ratios due to greater dispersion of the air layers throughout the tank.
  • In general, the charging efficiencies of all the tested PBLHS systems decrease as the charging time increases.
  • Charging time is shorter for a bed with high porosity, low capsule diameter, high inlet velocity, and high height-to-diameter aspect ratio.
These findings can be applied to multi-criteria optimization in order to direct the planning and construction of individualized storage units of appropriate size. These results suggest that by making minor adjustments to the packed bed arrangement without changing the PCM, it is possible to improve the efficiency of the storage process.
Despite recent developments in the field, additional pilot plants should be constructed to evaluate PCM in conjunction with solar-powered thermal industrial processes. In particular, thermal processes operate under changing conditions over time, necessitating further research into the development of tailor-made and specific-purpose charging mechanisms. In future work, the performance of cascaded latent heat storage systems can be studied by employing two or more PCMs with varying melting points within the same storage tank. Alternatively, other low-cost PCMs can be investigated for medium-to-high-temperature applications to see their effect on the PBLHS performance.

Author Contributions

Conceptualization, M.M., I.T.; methodology, M.M.; software, M.M.; validation, M.M.; formal analysis, M.M., I.T.; investigation, M.M.; resources, I.T.; data curation, M.M.; writing—original draft preparation, M.M.; writing—review and editing, M.M., I.T.; visualization, M.M.; supervision, M.M., I.T.; project administration, I.T.; funding acquisition, I.T. All authors have read and agreed to the published version of the manuscript.

Funding

This work was supported in part by ODTÜ-GÜNAM Center for Solar Energy Research and Applications.

Conflicts of Interest

The authors declare no conflict of interest.

Nomenclature

Cinertial coefficient(1/m)
cpspecific heat (J/kgK)
Dtank diameter (m)
dpcapsule diameter (m)
Htank height (m)
hheat transfer coefficient (W/m2K)
hfslatent heat of fusion (J/kg)
kthermal conductivity (W/mK)
Kpermeability (m2)
mmass (kg)
m ˙ mass flow rate (kg/s)
NuNusselt number
Ppressure (Pa)
Ppower (W)
PrPrandtl number
Qenergy (J)
rradius (m)
RaRayleigh number
ReReynolds number
ttime (s)
Ttemperature (K)
uvelocity (m/s)
Vvolume (m3)
Subscripts
ambambient
distdistributor
effeffective
ffluid
ininlet
liqliquid phase
mmelting
pparticle
rradial direction
ssolid
solsolid phase
ststeel
volvolumetric
wwall
zaxial direction
Superscripts
max
Greek symbols
maximum
ε porosity
λ phase change function
α thermal diffusivity (m2/s)
β thermal expansion (1/K)
ν kinematic viscosity (m2/s)
ρ density (kg/m3)
η efficiency
μ dynamic viscosity (kg/ms)
ϕ melt fraction
Abbreviations
PBLHSpacked-bed latent heat storage
PCMphase change material
HTFheat transfer fluid
TESthermal energy storage

References

  1. Crespo, A.; Barreneche, C.; Ibarra, M.; Platzer, W. Latent Thermal Energy Storage for Solar Process Heat Applications at Medium-High Temperatures—A Review. Sol. Energy 2019, 192, 3–34. [Google Scholar] [CrossRef]
  2. Koçak, B.; Fernandez, A.I.; Paksoy, H. Review on Sensible Thermal Energy Storage for Industrial Solar Applications and Sustainability Aspects. Sol. Energy 2020, 209, 135–169. [Google Scholar] [CrossRef]
  3. Javadi, F.S.; Metselaar, H.S.C.; Ganesan, P. Performance Improvement of Solar Thermal Systems Integrated with Phase Change Materials (PCM), a Review. Sol. Energy 2020, 206, 330–352. [Google Scholar] [CrossRef]
  4. Sunku Prasad, J.; Muthukumar, P.; Desai, F.; Basu, D.N.; Rahman, M.M. A Critical Review of High-Temperature Reversible Thermochemical Energy Storage Systems. Appl. Energy 2019, 254, 113733. [Google Scholar] [CrossRef]
  5. Chen, X.; Zhang, Z.; Qi, C.; Ling, X.; Peng, H. State of the Art on the High-Temperature Thermochemical Energy Storage Systems. Energy Convers. Manag. 2018, 177, 792–815. [Google Scholar] [CrossRef]
  6. Du, K.; Calautit, J.; Wang, Z.; Wu, Y.; Liu, H. A Review of the Applications of Phase Change Materials in Cooling, Heating and Power Generation in Different Temperature Ranges. Appl. Energy 2018, 220, 242–273. [Google Scholar] [CrossRef]
  7. Shi, J.; Qin, M.; Aftab, W.; Zou, R. Flexible Phase Change Materials for Thermal Energy Storage. Energy Storage Mater. 2021, 41, 321–342. [Google Scholar] [CrossRef]
  8. Mohamed, S.A.; Al-Sulaiman, F.A.; Ibrahim, N.I.; Zahir, M.H.; Al-Ahmed, A.; Saidur, R.; Yılbaş, B.S.; Sahin, A.Z. A Review on Current Status and Challenges of Inorganic Phase Change Materials for Thermal Energy Storage Systems. Renew. Sustain. Energy Rev. 2017, 70, 1072–1089. [Google Scholar] [CrossRef]
  9. Al-Maghalseh, M.; Mahkamov, K. Methods of Heat Transfer Intensification in PCM Thermal Storage Systems: Review Paper. Renew. Sustain. Energy Rev. 2018, 92, 62–94. [Google Scholar] [CrossRef]
  10. Gautam, A.; Saini, R.P. A Review on Sensible Heat Based Packed Bed Solar Thermal Energy Storage System for Low Temperature Applications. Sol. Energy 2020, 207, 937–956. [Google Scholar] [CrossRef]
  11. De Gracia, A.; Cabeza, L.F. Numerical Simulation of a PCM Packed Bed System: A Review. Renew. Sustain. Energy Rev. 2017, 69, 1055–1063. [Google Scholar] [CrossRef] [Green Version]
  12. Guo, W.; He, Z.; Meng, Z.; Zhang, P. A Comprehensive Investigation of the Mathematical Models for a Packed Bed Latent Heat Thermal Energy Storage System. Int. J. Energy Res. 2021, 45, 15005–15021. [Google Scholar] [CrossRef]
  13. Felix Regin, A.; Solanki, S.C.; Saini, J.S. An Analysis of a Packed Bed Latent Heat Thermal Energy Storage System Using PCM Capsules: Numerical Investigation. Renew. Energy 2009, 34, 1765–1773. [Google Scholar] [CrossRef]
  14. Bhagat, K.; Saha, S.K. Numerical Analysis of Latent Heat Thermal Energy Storage Using Encapsulated Phase Change Material for Solar Thermal Power Plant. Renew. Energy 2016, 95, 323–336. [Google Scholar] [CrossRef] [Green Version]
  15. Mao, Q.; Zhang, Y. Thermal Energy Storage Performance of a Three-PCM Cascade Tank in a High-Temperature Packed Bed System. Renew. Energy 2020, 152, 110–119. [Google Scholar] [CrossRef]
  16. Peng, H.; Dong, H.; Ling, X. Thermal Investigation of PCM-Based High Temperature Thermal Energy Storage in Packed Bed. Energy Convers. Manag. 2014, 81, 420–427. [Google Scholar] [CrossRef]
  17. Nallusamy, N.; Sampath, S.; Velraj, R. Study on Performance of a Packed Bed Latent Heat Thermal Energy Storage Unit Integrated with Solar Water Heating System. J. Zhejiang Univ. Sci. 2006, 7, 1422–1430. [Google Scholar] [CrossRef]
  18. Bellan, S.; Alam, T.E.; González-Aguilar, J.; Romero, M.; Rahman, M.M.; Goswami, D.Y.; Stefanakos, E.K. Numerical and Experimental Studies on Heat Transfer Characteristics of Thermal Energy Storage System Packed with Molten Salt PCM Capsules. Appl. Therm. Eng. 2015, 90, 970–979. [Google Scholar] [CrossRef]
  19. Li, M.J.; Jin, B.; Ma, Z.; Yuan, F. Experimental and Numerical Study on the Performance of a New High-Temperature Packed-Bed Thermal Energy Storage System with Macroencapsulation of Molten Salt Phase Change Material. Appl. Energy 2018, 221, 1–15. [Google Scholar] [CrossRef]
  20. Wang, W.; He, X.; Shuai, Y.; Qiu, J.; Hou, Y.; Pan, Q. Experimental Study on Thermal Performance of a Novel Medium-High Temperature Packed-Bed Latent Heat Storage System Containing Binary Nitrate. Appl. Energy 2022, 309, 118433. [Google Scholar] [CrossRef]
  21. Wakao, N.; Kaguei, S.; Funazkri, T. Effect of Fluid Dispersion Coefficients on Particle-to-Fluid Heat Transfer Coefficients in Packed Beds: Correlation of Nusselt Numbers. Chem. Eng. Sci. 1979, 34, 325–336. [Google Scholar] [CrossRef]
  22. Churchill, S.W.; Chu, H.H.S. Correlating Equations for Laminar and Turbulent Free Convection from a Vertical Plate. Int. J. Heat Mass Transf. 1975, 18, 1323–1329. [Google Scholar] [CrossRef]
Figure 1. (a) The 3D view of the apparatus for the PBLHS system constructed based on [20]. (b) The schematic diagram of the axisymmetric two-dimensional model and its dimensions along with the locations of temperature measuring points. (c) The mesh for the model. (d) The resultant 3D model.
Processes 10 01382 g001
Figure 2. The velocity and the temperature fields for the charging process at t = 4 h.
Processes 10 01382 g002
Figure 3. Melt fraction evolution over time in the charging process.
Processes 10 01382 g003
Figure 4. (a) The temperature evolution of the air inside the TES tank along the axial direction during the charging process. The results of temperature measurements are compared with the ones presented in the experimental study [20]; (b) the average temperature of the air inside the bed during the charging process for different grid sizes.
Processes 10 01382 g004
Figure 5. Temporal variation of (a) the inlet and outlet temperatures of the air, (b) the average temperature of PCM and liquid fraction, and (c) the charging rate and charging capacity for different bed porosity cases.
Processes 10 01382 g005
Figure 6. Temporal variation of (a) the inlet and outlet temperatures of the air, (b) the average temperature of PCM and liquid fraction, and (c) the charging rate and charging capacity for different capsule diameter cases.
Processes 10 01382 g006
Figure 7. Temporal variation of (a) the inlet and outlet temperatures of the air, (b) the average temperature of PCM and liquid fraction, and (c) the charging rate and charging capacity for different inlet velocity cases.
Processes 10 01382 g007
Figure 8. Temporal variation of (a) the inlet and outlet temperatures of the air, (b) the average temperature of PCM and liquid fraction, and (c) the charging rate and charging capacity for different height-to-diameter aspect ratio cases.
Processes 10 01382 g008
Figure 9. The velocity and the temperature fields for two different bed height-to-diameter ratio cases at t = 4 h.
Processes 10 01382 g009
Table 1. Geometrical and physical properties used in the model adapted from [20].
PropertiesValueUnit
Height of the tank0.67m
Height of the packed bed0.58m
The inner diameter of the tank0.305m
The thickness of the tank0.01m
Diameter of the capsule0.051m
The porosity of the bed0.51-
Melting temperature224.58°C
Latent heat of fusion111.88kJ/kg
Density of solid PCM2200kg/m3
Density of liquid PCM1900kg/m3
Specific heat capacity of solid PCM1.81kJ/kgK
Specific heat capacity of liquid PCM2.24kJ/kgK
Thermal conductivity of solid PCM 0.55W/mK
Thermal conductivity of liquid PCM0.5W/mK
Specific heat capacity of steel0.5kJ/kgK
Thermal conductivity of steel45W/mK
Table 2. Performance metrics of PBLHS system for different bed porosity cases.
EffectParameter Charging Time (h)Peak Charging Rate (W)Charging Capacity (MJ)Average Charging Rate (W)Max. Stored Energy
(MJ)
Charging Efficiency (%)
Porosity ε = 0.555.72201631.4751528.5126.65783.37
ε = 0.56.21225234.5671546.2128.6483.82
ε = 0.456.62 242037.2741564.0331.55684.66
Table 3. Performance metrics of PBLHS system for different capsule diameter cases.
EffectParameter Charging Time (h)Peak Charging Rate (W)Charging Capacity (MJ)Average Charging Rate (MJ)Max. Stored Energy
(MJ)
Charging Efficiency (%)
Diameter d p = 60 mm 6.29 213433.5921483.4828.57785.07
d p = 51 mm6.2225234.1671530.7828.57783.64
d p = 40 mm6.08 239734.364157028.57783.15
Table 4. Performance metrics of PBLHS system for different inlet velocity cases.
EffectParameter Charging Time (h)Peak Charging Rate (W)Charging Capacity (MJ)Average Charging Rate (W)Max. Stored Energy
(MJ)
Charging Efficiency (%)
Inlet velocityu = 7.5 m/s6.22225234.1671525.8628.57783.64
u = 5.5 m/s7.74176734.8181249.5728.57782.07
u = 3.5 m/s10.77127835.176907.2528.57781.24
Table 5. Performance metrics of PBLHS system for different bed height-to-diameter aspect ratio cases.
EffectParameter Charging Time (h)Peak Charging Rate (W)Charging Capacity (MJ)Average Charging Rate (W)Max. Stored Energy
(MJ)
Charging Efficiency (%)
Bed height-to-diameter aspect ratioH/D = 3.55.6252230.5051513.1429.79197.66
H/D = 1.96.21225234.2671532.7928.57783.64
H/D = 16.49210037.751615.7327.45672.73
Publisher’s Note: MDPI stays neutral with regard to jurisdictional claims in published maps and institutional affiliations.

