Article

Spray Drying of PEG6000 Suspension: Reaction Engineering Approach (REA) Modeling of Single Droplet Drying Kinetics

1
Department of Chemical and Materials Engineering, King Abdulaziz University, Jeddah 21589, Saudi Arabia
2
Department of Pharmaceutics, King Abdulaziz University, Jeddah 21589, Saudi Arabia
*
Author to whom correspondence should be addressed.
Processes 2022, 10(7), 1365; https://doi.org/10.3390/pr10071365
Submission received: 27 June 2022 / Revised: 5 July 2022 / Accepted: 6 July 2022 / Published: 13 July 2022
(This article belongs to the Section Chemical Processes and Systems)

Abstract

:
The spray drying technique is suitable for different kinds of liquid dispersions and can be easily optimized to produce solid particles with tailored properties. The spray drying technique is a complex process. As an example, it is difficult to track drying kinetics, shape, and morphological changes on the scale of a single droplet. To better understand the effect of drying process variables on dried particle formation, it is useful to observe the drying of single droplets. Fundamental processes, such as mass and heat transfer, can then be easily monitored and compared with theoretical models. Acoustic levitation enables droplet/particle suspension in the air without any mechanical contact. Experiments in the acoustic levitator can be used to mimic the drying process in the spray dryer. The drying kinetics of single droplets of PEG6000 into solid particles was studied. Droplets with an initial polymer concentration (PEG6000 aqueous solution of 5%, 10%, and 15% (w/w)) were investigated at different gas drying temperatures. The size of the droplet, moisture content, and the shape evolution of the droplet/particle during the drying process were studied. The experimental drying curves were compared with the Reaction Engineering Approach (REA). The REA models were shown to provide a very good agreement for drying behavior, with a relative error of about ±3% between the initial and predicted droplet mass. This model can be implemented into the large-scale modeling of spray drying using Computational Fluid Dynamics (CFD).

1. Introduction

Polyethylene glycol (PEG) is a versatile polymer with many applications, especially in the pharmaceutical field. It is used to modify drug release and enhance the dissolution rate of poorly soluble drugs. In solid dispersions (SD), PEG can prevent drug crystallization, and thus increase the dissolution rate [1,2,3].
Polyethylene glycol 6000 (PEG6000) is a polymer that is widely used in pharmaceutical formulations, and it has a low glass transition temperature. PEG6000 is employed in solid dispersion manufacturing [4,5]. Solid dispersions with high PEG6000 concentrations usually have the best dissolution profiles. Lu et al. [6] used spray drying to prepare microparticles of PEG6000 embedded with a weakly soluble drug in water, then used tables to compare its dissolution properties. They demonstrated that formulation by spray drying maintained the crystallinity of the drugs during preparation and throughout the shelf life, having comparable dissolution profiles.
Particulate solids and powders are produced via the spray drying technique. The polymer carrier and the drug material are dissolved in a suitable solvent. Then, the suspension is spray-dried into solid particles [7,8].
The spray dryer is able to produce solid microparticles in a continuous and quick manner; it is also a scalable production process [9]. Spray drying has been widely utilized to produce solid microparticles in the chemical industry [10], food industry [11], and pharmaceutical industry [1,12]. Spray drying is a well-established preparation method for Amorphous Solid Desperations (ASD), which is an efficient method to overcome the weak solubility of drugs in water [2,13].
Spray dryers can produce micro- or nano-size particles in a very short time, ca. a few milliseconds. The wide range of operational parameters, such as the temperature of heated gas, gas flow rate, feed solution, and various nozzles types, make spray drying a very efficient technique for transforming solutions into powder with tunable physical and chemical properties [14,15].
As illustrated in Figure 1, the spray drying process involves a few sequential steps. A nozzle injects the feed solution or suspension into the drying chamber. The atomized droplets generated by the nozzle come into contact with the hot gas stream, co-current, or counter-current. Typically, the residence time for droplets in a spray dryer is a function of the process parameters and the size of the equipment, and can last for a few seconds. The liquid then evaporates from the droplet surface. Finally, a powder of dry particles is formed.
Atomization produces a large number of micron-size droplets. The larger the surface area of these droplets, the higher is the rate of drying. The spray drying process and the characteristics of the generated powder rely critically on heat and mass transfer rates.
Drying rates can influence the amorphization of dissolved pharmaceuticals. Drying kinetics is one of the factors that determine whether the molecule is fully crystallized or not. Moreover, the exposure time of the particles in the spray dryer is critical for materials sensitive to high temperatures.
To successfully formulate an engineered particle and design production units, various process parameters, such as air temperature, aspiration ratio, droplet flow interaction with air, heating and evaporation during spray transport, drying kinetics, and particle separation, are of utmost importance [16,17].
It is often difficult to investigate all steps of the drying process experimentally; for example, the atomization of the liquid through the nozzle generates a large number of small droplets. Each undergoes morphological change due to the drying kinetics occurring on the surface and inside the droplet. Tracking the temporal evolution of droplet size and shape in spray drying for a single droplet is impossible. One alternative is to use a device that mimics spray drying on a scale of one droplet using a single droplet drying device. Therefore, an effective method for examining the drying kinetics of single droplets is to suspend them in an acoustic levitator [18,19,20,21]. Furthermore, use of an ultrasonic levitator to suspend single droplets or particles has been demonstrated as a well-proven experimental approach for investigating transport processes at the surface of the droplet. It allows tracking of the droplet shape during the drying process [20,22,23].
Researchers have attempted to model the drying kinetics of a single droplet containing either dissolved or insoluble particles. Modeling drying kinetics is achieved by solving coupled heat and mass diffusion equations. Different approaches have been used to describe the dynamics of the drying process. Mutual diffusion coefficients are commonly used. Solute concentration, solvent activity, and droplet temperature are crucial to determine the diffusion coefficient at each time point [24,25,26,27].
Another approach that utilizes reaction kinetics principles is called the Reaction Engineering Approach (REA). Several researchers have succeeded in modeling single droplet drying kinetics using the REA model [18,28,29,30]. In this model, the moisture must overcome an energy barrier to depart from the droplet surface. The REA model has been used to model the resistance of moisture migration on both internal and external surfaces. Furthermore, the REA has been used to model binary solutes and binary solvent solution [31].
This study aimed to investigate, theoretically and experimentally, the drying of PEG6000 aqueous suspension droplets. The drying kinetics of aqueous PEG6000 droplets are not available in the scientific literature. The modeling of drying kinetics is implemented based on the Reaction Engineering Approach (REA). The major contribution of this study is the development of a new correlation to predict the drying kinetics of aqueous PEG6000 droplets, which can easily be embedded to simulate spray dryers, utilizing Computational Fluid Dynamics (CFD).

2. Materials and Methods

Polyethylene glycol 6000 was purchased from Sigma-Aldrich. Distilled water was used to prepare the sample solution. Drying experiments on a single droplet of PEG6000 solutions were conducted in an acoustic levitator. Three different initial concentrations were tested, specifically, 5%, 10%, 15% (w/w). The initial volume of the droplet was 1.0–1.2 µL. The drying of PEG6000 aqueous solution was investigated under air drying temperatures of 30 °C and 50 °C. For each process condition, experimental trials were repeated in triplicate.

2.1. Experimental Method and Procedure

A single droplet can be held in the air using the acoustic force of the levitator. A drying chamber that is temperature- and humidity-controlled isolates the suspended droplet. The droplet can be continuously observed inside the chamber during the drying process via a glass window.
Inside the levitator, ultrasonic sound waves are generated at a frequency of 58 kHz by an emitter (piezo crystal and flanges). The sound wave is reflected by a concave reflector forming the so-called standing wave. The acoustic radiation pressure that results from the droplet in the acoustic field generates the required acoustic force to suspend the droplet against the gravity force [32].
The acoustic levitator was modified to include two chambers (see Figure 2b): the double-wall heating chamber (red) and the cooling chamber (blue). The heating chamber was heated with hot air. The heated air flows inside internal pipes. The temperature is controlled via a thermocouple fitted inside the hot chamber and connected to a PID temperature thermostat controller. The upper part of the transducer, including the piezo crystal, was isolated from the cooling chamber’s heated zone. Keeping the piezo crystal temperature at around 30 °C in the cooling chamber provides stable droplet levitation and protects the piezo crystal from high temperatures, which may cause damage to the piezo crystal.
The droplet is continuously observed during the drying experiment via the mounted CMOS camera (1280 × 1024 pixels). The long-distance macro lens is adjusted to provide a sharp image, and is calibrated for the required magnification. A white LED source illuminates the droplet from behind, allowing for the collection of sharp images of the droplet’s outer contours. The shadow images of the droplet are captured at a pace of 0.5 Hz. The in-house developed image processing software enables online processing of the captured images. The volume equivalent diameter is determined using the major and minor axes, which are extracted from each image.
The interaction between the incident standing wave and the liquid droplet causes acoustic streaming around the droplet surface once it is placed into the acoustic field. This acoustic streaming process was defined by Schlichting [33]. The acoustic streaming can be divided into two types of flow, a thin layer located near the droplet surface, called the inner acoustic streaming, which is responsible for the convective heat and mass transfer from the droplet into the ambient air. The second type describes the toroidal vortices surrounding the inner acoustic streaming. These vortices are called outer acoustic streaming, and act as a trap for the liquid evaporated from the droplet. As the evaporation continues, more vapor is accumulated, and thus, the vapor concentration around the droplet is altered. Therefore, one can generate reproducible experimental results that can be used to validate the theoretical model. The outer acoustic streaming is demolished by inserting an airstream with defined airflow beneath the droplet. In order to ventilate the droplet, an airflow of 0.85 L/min was used. This step is necessary to prevent the evaporated solvent from accumulating around the droplet [34].

2.2. Drying Kinetics Modeling

In spray drying, once the droplet leaves the nozzle, it travels downwards in a hot gas stream, and the liquid solvent evaporates from the droplet surface. The solvent vapor is initially transferred from the unbound surface to the surrounding gas. This step is similar to pure solvent evaporation, where the solvent does not face any resistance to migrate from the droplet surface. This period is designated as the constant drying rate stage [35]. As the drying process proceeds, more solvent is evaporated. Hence, the solute concentration increases in the layers beneath the droplet surface. The solids load in the droplet influences the solvent evaporation at this stage. The solvent faces extra resistance to leave the droplet surface.
The drying kinetics can be described by implementing the REA model. The solvent evaporation in this approach is assumed to be an activation process similar to the reaction process. The REA model assumes that the solvent leaves the droplet surface if it overcomes an energy barrier [36]. As the solute concentration increases inside the droplet, the energy barrier becomes more prominent, i.e., more resistant to solvent evaporation.
The temporal change of the solvent mass is expressed as in [18]:
m ˙ A = A D g S h D ( ρ A s ρ A ) ρ ( ρ ρ A s )
where D g is the binary diffusion coefficient of the moisture in the air, and is estimated using Fuller’s equation [37]. It is worth mentioning that, for dilute systems, ρ ρ A s , and therefore, Equation (1), is reduced to:
m ˙ A = A h m ( ρ A s ρ A )
The convective mass transfer coefficient h m can be defined as:
h m = D g S h D
The temperature gradients are negligible inside the droplet, and temperature is assumed to be uniform throughout the cross-section of the droplet. The energy balance resulting from convective heat flux and the latent heat enables one to calculate the temporal evolution of the temperature of the droplet [24,34]:
m d · C p , d d T d d t = A h T ( T T d ) + λ d m L d t
where h T is the convective heat transfer coefficient, m L is the mass of liquid inside the droplet, and λ is the latent heat of vaporization.
The vapor mass concentration on the droplet surface is correlated with saturated vapor density ( ρ A s * ):
ρ A s = ψ ρ A s *
The transfer resistance of solvent vapor from the droplet surface to the surrounding ambient gas medium is expressed by the fractionality coefficient, ψ . The saturated vapor density ( ρ A s * ) is calculated as:
ρ A s * = M w A P v a p , s * R T
where P v a p , s * ( T s ) is the vapor pressure at the droplet’s surface temperature.
The Arrhenius equation is used as the main postulate of the REA model in order to correlate activation energy ( E v ) [38,39]:
ψ = exp ( E v R T )
where R is the universal gas constant. The activation energy acts as a barrier during evaporation and moisture removal. The vapor mass flow rate is then found by substituting Equations (5) and (7) into Equation 1 and solving for E v :
E v = R T ln ( m ˙ A / ( A h m ) + ρ A m ˙ A / ( A h m ) · ρ A s * ρ + ρ A s * )
It can be derived from Equation (8) that the activation energy estimation depends on the solids content inside the droplet, the convective mass transfer coefficient, and the drying temperature of the droplet [39].
The average moisture content on a dry basis (X) can be linked to the normalized activation energy, as follows:
E v E v , e = f ( X X e )
Physical properties of the drying air, such as the relative humidity (RHg) and temperature, can be used to calculate the “equilibrium” activation energy ( E v e ):
E v , e = R T g ln ( R H g )
The moisture-to-solids ratio ( X ) is defined as:
X ( t ) = m d ( t ) m s m s
where ms is the mass of the polymer inside the droplet, and md is the total mass of the liquid and the dissolved polymer.
The exerted vapor pressure on the droplet surface is calculated using Equation (5). The fractionality coefficient (ψ) is linked to the activation energy via the well-known Arrhenius equation [39]. The activation energy ( E v ) is estimated from Equation (8), and depends on gas temperature and initial polymer concentration.
The activation energy is then used to determine the moisture content on a dry basis (X):
d X d t = A h m ( exp ( E v R T ) · ρ A s * ρ A ) ρ m s ( ρ exp ( E v R T ) · ρ A s * )    
The acoustic boundary layer surrounding the droplet controls the evaporation process in the acoustic field. The convective mass and heat transfer coefficients calculated from Sherwood and Nusselt numbers developed by Yarin et al. [40] are used:
S h = 2 · K B ( Ω A c D g ) 1 2 N u = 2 · K B ( Ω A c α g ) 1 2
where Ω A c   is the angular frequency of the incident sound wave. The gas particle velocity B = A0e/(ρgvs) depends on sound pressure amplitude A0e, which can be calculated as [41]:
S P L = 20 log 10 A 0 e + 74
A piezoelectric pick-up sensor embedded inside the reflector is utilized to measure the sound pressure level (SPL) [32].

3. Results and Discussion

3.1. Drying Curves of Aqueous PEG Droplets at a Different Initial Solids Content

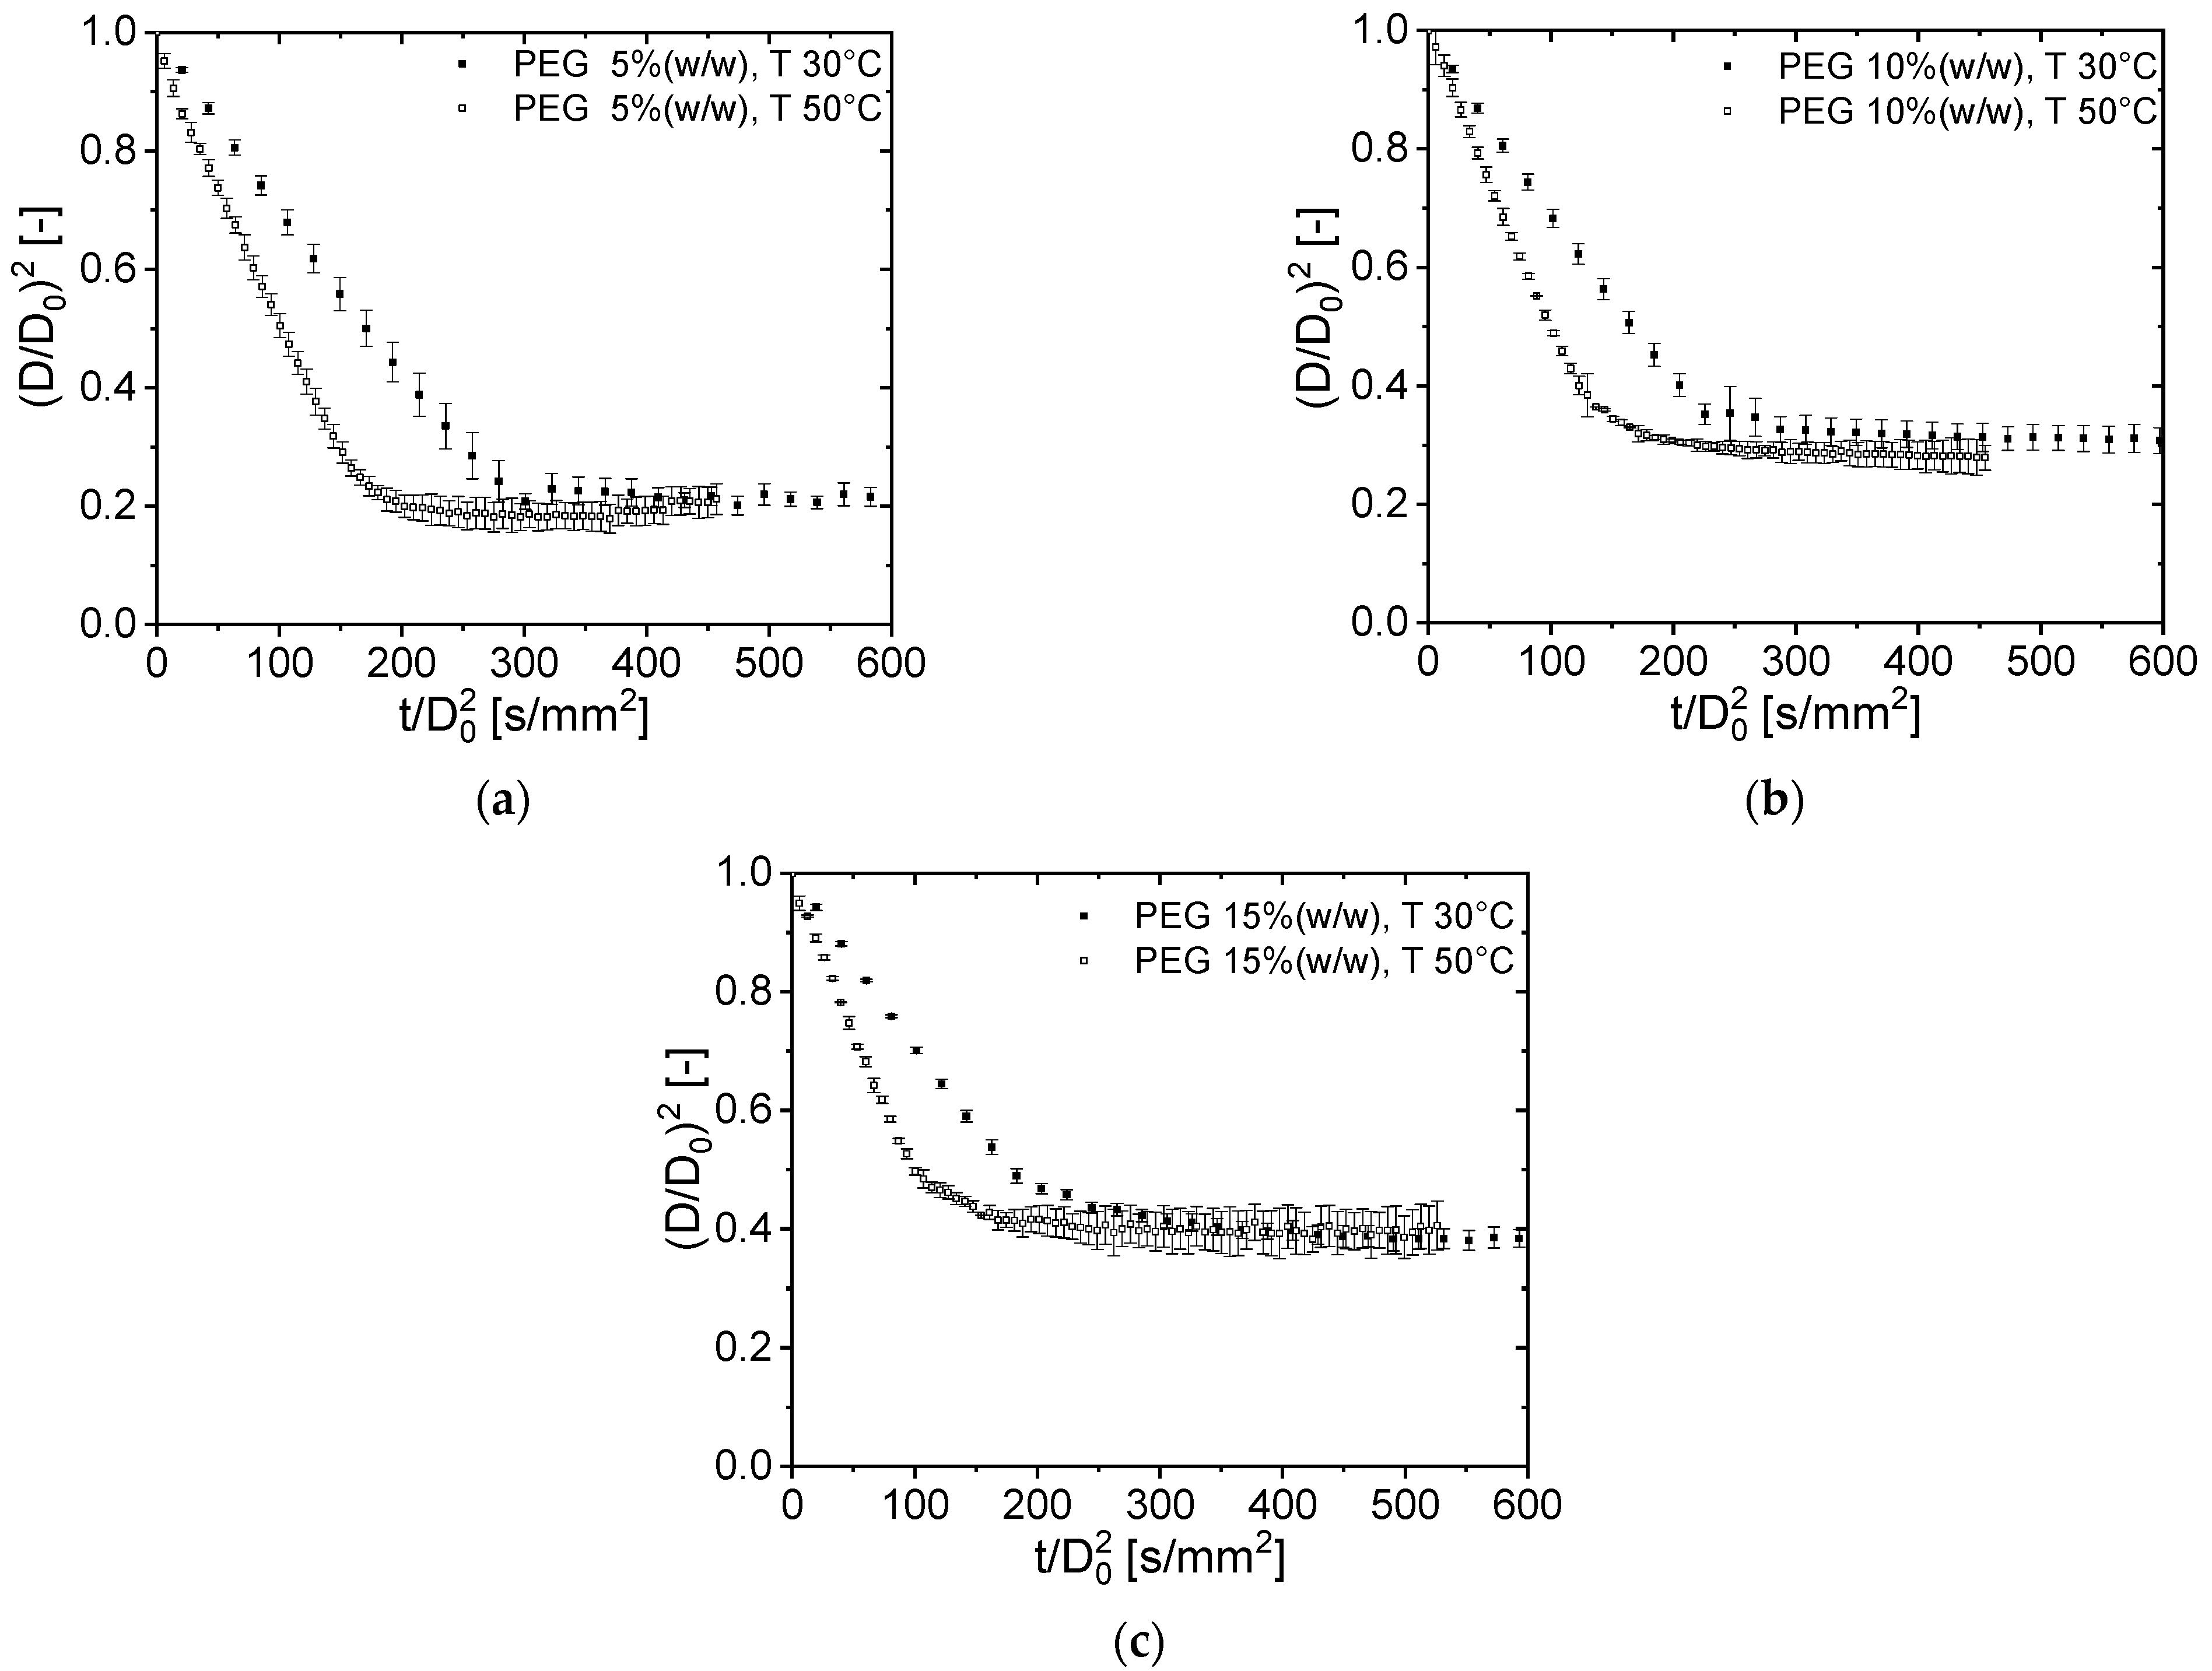
The PEG6000 solutions were used in drying experiments conducted at initial solids mass fractions of 5%, 10%, 15% (w/w), and performed under air drying temperatures of 30 °C and 50 °C. The drying curves in terms of the dimensionless droplet surface area are depicted in Figure 3. The drying rates and the size reduction of the droplet are faster at a higher temperature. The driving force of evaporation increased due to the increased vapor pressure at the droplet surface. The drying curves follow the well-known D2-law in the first drying period. The polymer concentration on the surface increases as the drying goes on and a polymer layer forms. Thus, the evaporation of the solvent is decreased dramatically. Initially, a constant drying rate is accompanied by a steep decrease in droplet size, the slope of the curve stays constant, then bends slightly.
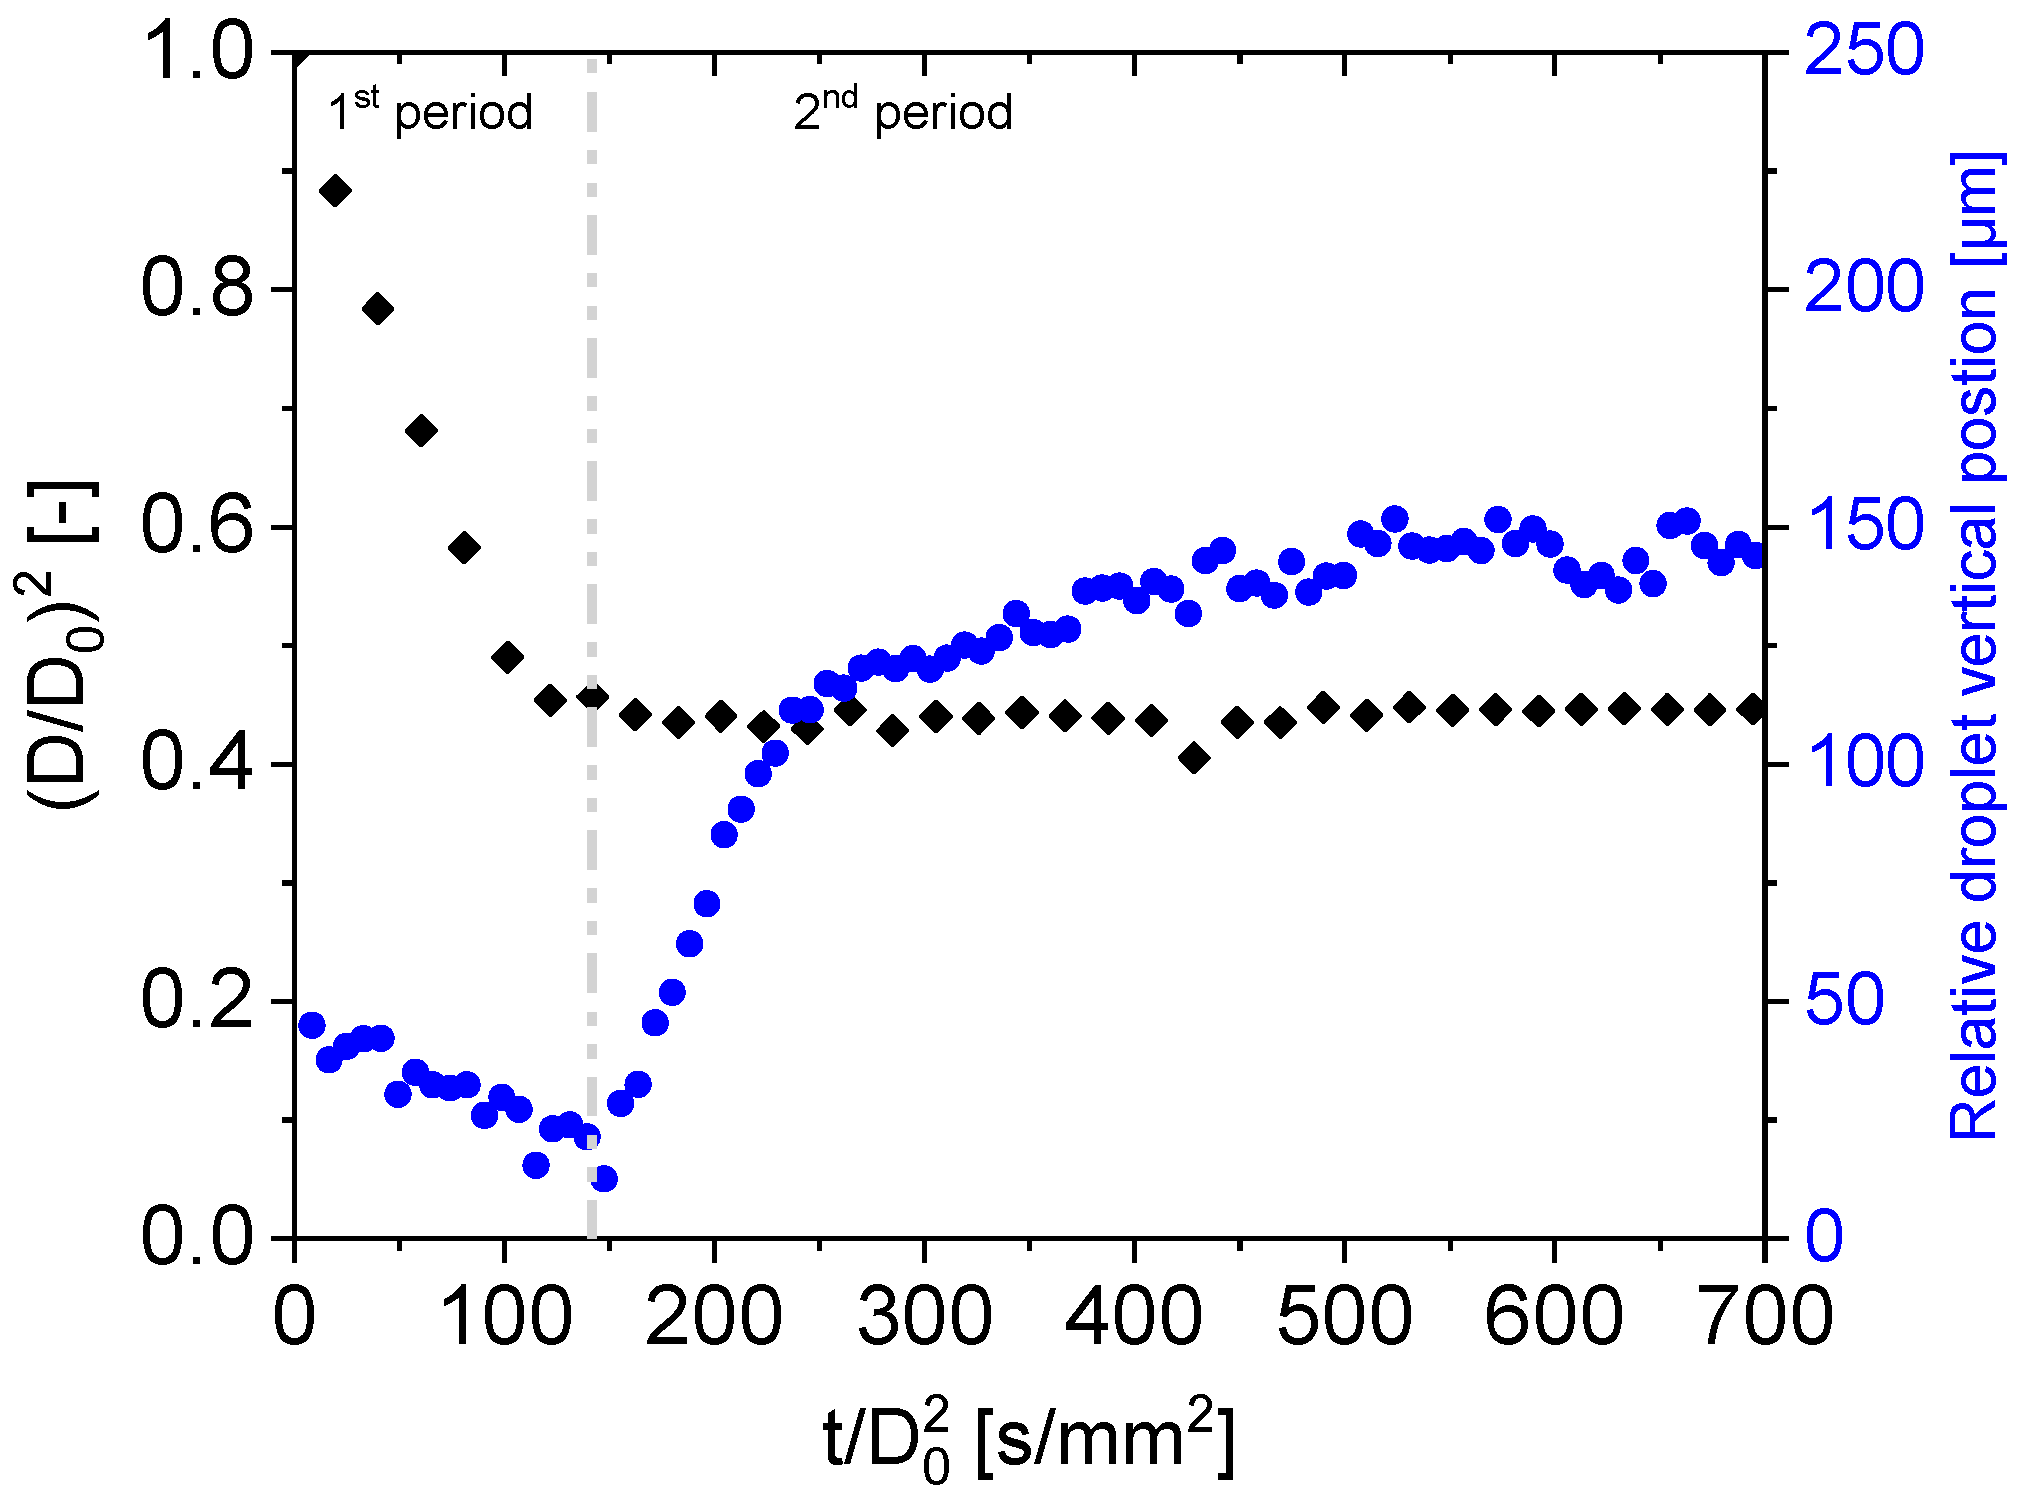
Finally, a particle of constant size is evolved (Figure 4). Solvent evaporation continues in this stage. However, a higher resistance to evaporation exists due to the formation of the polymer layer. Figure 5 depicts the experimental drying curve of 15% (w/w) PEG solution and air drying temperature of 50 °C. The rendered surface area evolution of the droplet shows a decrease in the droplet size with time. Initially, the solvent evaporates once the droplet is inserted into the acoustic field. The evaporation at this stage is similar to that of a pure liquid droplet. The drying curve follows a linear trend described by the well-known D2 law [34]. The evaporation rate of the moisture depends on the temperature gradient between the surrounding gas medium and the droplet surface, as well as the humidity of the drying gas.
The solvent vapor leaves the droplet surface easily in the first drying stage, i.e., the constant rate period. The vapor then migrates into the bulk gas stream, resulting in convective mass transfer driven by the inner acoustic boundary layer. The droplet surface temperature takes an equilibrium value, called the wet-bulb temperature.
The diameter of the droplet decreases as more solvent is evaporated and is also accompanied by weight reduction of the droplet. The rate of mass change can be calculated from the drying experiments as:
( d m d t ) c o n s t = ρ d Δ V Δ t
where ρ d is the average droplet density, and ΔV represents the volume difference between two consecutive time points.
The PEG6000 concentration increases inside the droplet upon drying, leading to a change in the droplet density and viscosity [42]. A skin forms on the surface of the droplet as it begins to solidify. Therefore, the droplet/particle volume is seized, which signifies that the end of the constant rate period has been reached. In Figure 5, the normalized evolution of the surface area of the droplet is plotted. The shadow image of the droplet was analyzed to estimate the diameter. During the drying course, the polymer content increases, which increases the droplet viscosity. The droplet surface eventually solidifies, preventing the solvent from escaping. As a result, the drying kinetics shift from a constant to a falling rate stage, and the particle size remains constant until the drying process is completed. A decrease in the drying rate accompanies the falling rate period.
The content of the solids determines how fast the solvent evaporates into the gas medium. The solvent must diffuse through the solid particle surface. The higher the thickness of the solid layer, the greater the solvent evaporation resistance. Unfortunately, the shadow imaging method cannot determine the loss of the solvent from the droplet, and Equation (15) cannot be applied. In order to calculate the mass loss of the particle per time, the properties of acoustic levitation to suspend a droplet were utilized [43]. The force balance between the gravity force and the acoustic force enables the levitation of the droplet. As the particle volume stays constant, the loss of the solvent leads to a decrease in the particle weight. Thus, the acoustic force pushes the particle up due to the force balance. Figure 5 depicts the temporal evolution of the vertical position of the center of the particle. The rise of the particle vertically in the acoustic field can be used to estimate the weight of the particle. It must be mentioned that this method requires a constant particle size, and the only physical property that can change is the density of the particle. In the first period of drying, both the density and the volume change, and a fall in vertical height is observed. Therefore, the vertical location of the droplet in the acoustic field can only be connected to particle density once the particle volume is constant (second stage), which would then permit the estimation of the droplet mass loss.
Once the constant rate period ends, the mass of the droplet can be estimated. The temporal mass of the particle, md,f, can be calculated during the falling rate period as:
m d , f ( t ) = Δ m f , m a x Δ y f , m a x · ( v e r t . p o s ( t ) v e r t . p o s ( t f 0 ) ) + m d ,   f 0
where tf0 is the time when the falling rate period begins, vert.pos(t) is the time-dependent vertical location of the particle,   m d ,   f 0 is the mass of the particle at the beginning of the falling rate period, estimated by subtracting evaporated mass, in first period, from the original mass. The quantities Δ m f , m a x   and Δ y f , m a x   represent the maximum differences in the particle mass and vertical distance, respectively.

3.2. Modeling of PEG600 Drying Behavior via the REA Model

The drying kinetics of PEG6000 aqueous solutions was modeled using the REA method. Equation (8) is the primary step for evaluating the activation energy from the experimental drying curves. The drying step is analogous to chemical reaction kinetics. The required resistance for the solvent to depart the droplet surface is represented by the activation energy [36]. Therefore, the higher the resistance for evaporation, the more hindrances encountered in the evaporation process. For example, the crust/skin formation on the droplet surface hinders the evaporation step. The skin thickness increases as more solvent evaporates. Liquid solvent must now diffuse through the pores in the crust, which adds extra internal resistance. Other parameters such as humidity, gas temperature, and initial solids content, also play a crucial role in determining the drying kinetics of the droplet. The activation energy represents drying-related dynamics during the drying process, with a lumped value that can be easily estimated from the drying experiments.
The normalized activation energy was related, via a power law, to moisture content on a dry basis ( X ):
E v E v , e = a · e x p ( b ( X X ) c )
where the factors a, b, and c are correlated to the initial polymer load and the gas drying temperature via a multiparametric fitting analysis.
The drying course may be modeled by combining Equations (12) and (17) without the need to define a transition point between drying stages; i.e., constant and falling rate periods.
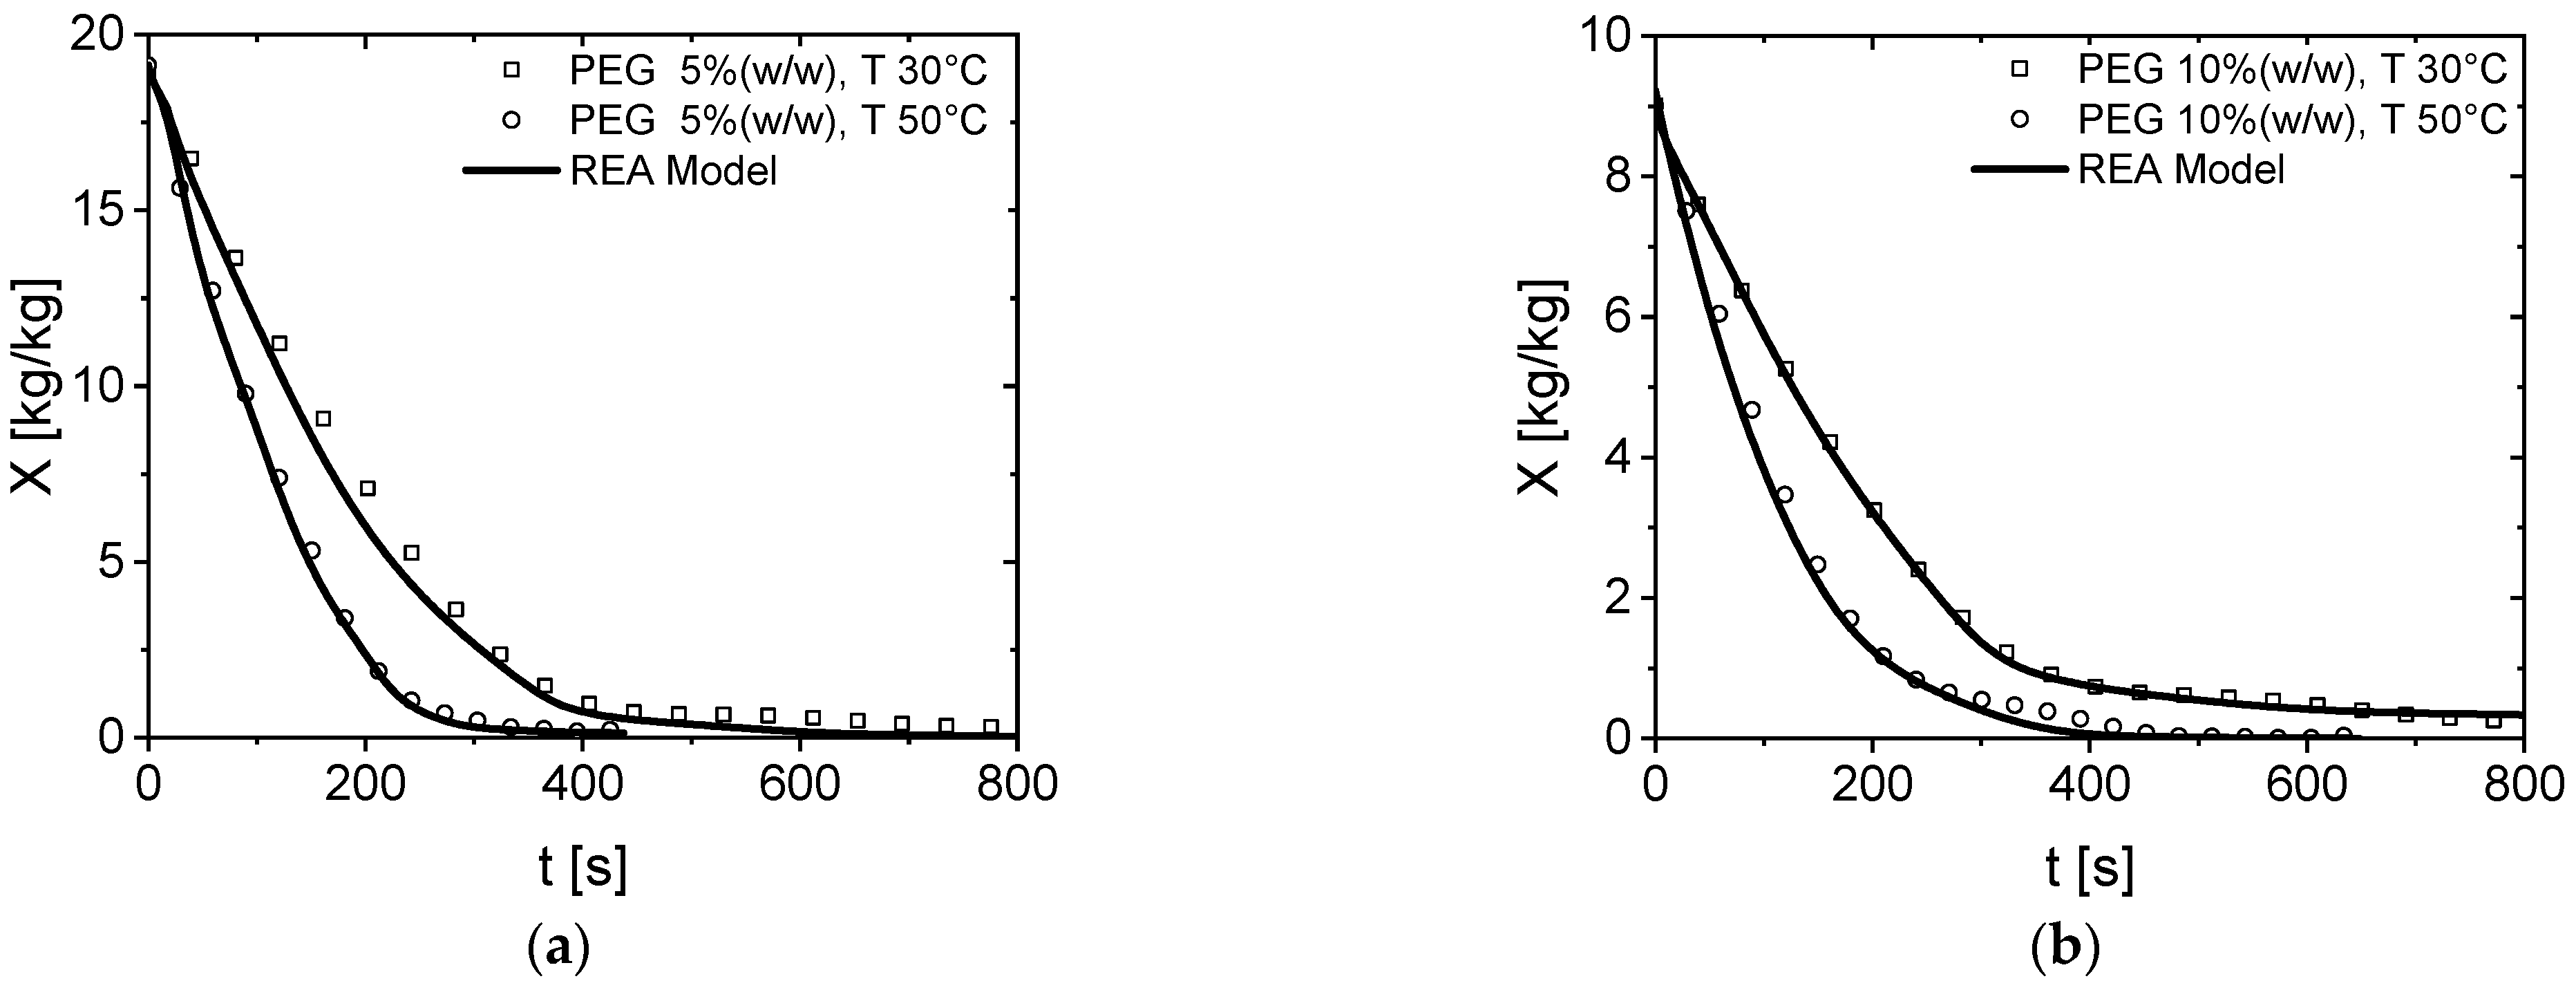
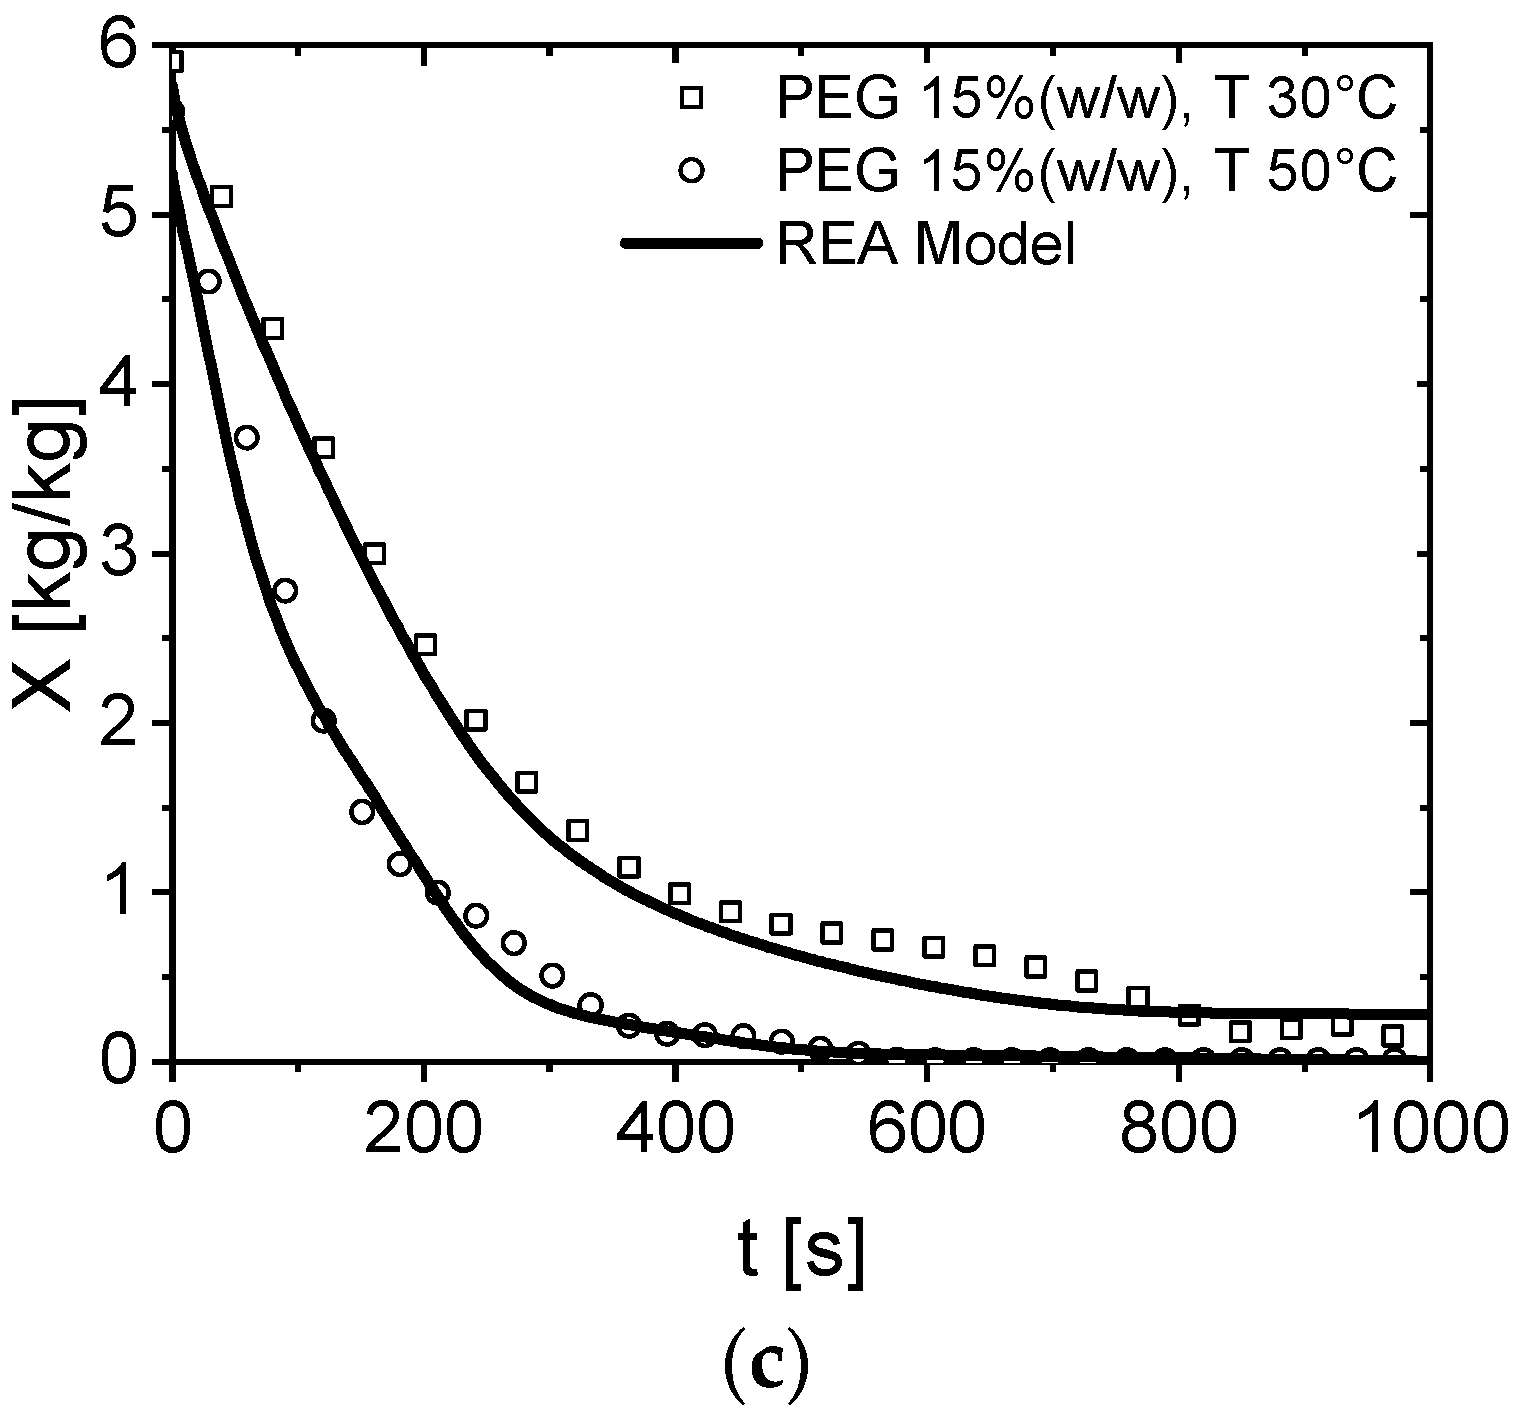
The experimental drying curves modeled by REA are depicted in Figure 6. There is a good agreement between the model and the experimental data. In terms of initial droplet weight, comparing experimental data with the REA model reveals a deviation error of about ±3.0%.
Activation energy is a key factor in the implementation of the REA model. It is calculated by lumping together multiple process variables, such as gas drying temperature and solid content. The activation energy was estimated with the help of Equation (8). The power law correlation of the activation energy, as a function of the experimental dry basis moisture content (X), was obtained from drying experiments, the coefficients a, b, and c are estimated via a multiparametric fitting (fitnlm, MATLAB 2021a):
a = 2.352 · 10 2 T 17.72 ω s o l i d + 0.3695 T · ω s o l i d + 1.942 ,     R 2 = 0.91 b = 1.667 · 10 2 T + 6.320 ω s o l i d 0.245 T · ω s o l i d 0.624 ,     R 2 = 0.96 c = 3.237 · 10 2 T 9.055 ω s o l i d 7.350 · 10 2 T · ω s o l i d + 4.109 ,     R 2 = 0.98
where T is the temperature of the drying gas and ω s o l i d is the initial polymer content.
The experimental drying curves are connected to the REA model via Equations (8) and (17). The REA model is very attractive because it can be expressed as ordinary differential equations [36]. The REA model is material-specific, and can be tested for any required set of parameters, such as temperature, initial concentration, or type of solution. A spray drying process model based on the REA can be used for large-scale modeling, such as computational fluid dynamics (CFD) simulations [7,44,45].

4. Conclusions

Simulations of single droplets have great potential for analyzing drying steps of various materials. The experiments require only small amounts of material. A single droplet drying device was used to examine the drying kinetics of aqueous PEG6000 solutions. Two process parameters were studied for their influence on the drying rate; the initial polymer concentration and the drying gas temperature. The results show that the volume of the droplet shrinks faster at higher drying temperatures. An REA model was developed to simulate the drying curves. A power law fit was found to be the most suitable way to represent the experimental drying curves. It was found that the parameters of the power law fit depending on the air temperature and the initial loading of the polymer. In this study, experimental results were compared with the model’s predictions, and showed good agreement.
The acoustic levitator enables researchers to observe droplets individually throughout the drying process. The drying kinetics predicted for PEG6000 single droplets in the presented study can be helpful in large-scale modeling of the spray drying process.

Author Contributions

Conceptualization, B.A.Z. and A.A.-Z.; methodology, U.S.; software, B.A.Z.; validation, A.A.T., U.S. and O.A. formal analysis, A.A.T.; investigation, B.A.Z.; resources, A.A.-Z.; data curation, O.A.; writing—original draft preparation, B.A.Z.; writing—review and editing, A.A.T.; visualization, U.S.; supervision, A.A.-Z.; project administration, B.A.Z.; funding acquisition, B.A.Z. All authors have read and agreed to the published version of the manuscript.

Funding

This research was funded by the Deanship of Scientific Research (DSR), King Abdulaziz University, Jeddah, under grant number G: 246-135-38.

Institutional Review Board Statement

Not applicable.

Informed Consent Statement

Not applicable.

Data Availability Statement

Data is contained within the article.

Acknowledgments

This project was funded by the Deanship of Scientific Research (DSR), King Abdulaziz University, Jeddah, under grant No. G: 246-135-38. The authors, therefore, acknowledge with thanks, the DSR for technical and financial support.

Conflicts of Interest

The authors declare no conflict of interest.

Nomenclature

A(m2)the surface area of the droplet
A0e(N m−2)sound pressure amplitude
B(m s−1)gas particle velocity
D(m)droplet diameter
D0(m)initial droplet diameter
E v (J mol−1)activation energy
hm(m s−1)mass transfer coefficient
m ˙ A (kg s−1)the mass flow rate of A
m d (kg)the total mass of the droplet
m L (kg)mass of the liquid inside the droplet
m s (kg)mass of the solids inside the droplet
Nu(-)Nusselt number
RHg(-)relative humidity of drying air
Sh(-)Sherwood number
SPL(dB)sound pressure level
T(k)temperature
vs(m s−1)sound velocity
X(kg kg−1)dry basis moisture content
Greek symbol
αg(m2 s−1)thermal diffusivity of the gas
λ (J kg−1)latent heat of vaporization
ρ(kg m−3)mass concentration of the droplet
ρ A s (kg m−3)vapor mass concentration at the droplet surface
ρ A s * (kg m−3)saturated vapor mass density
ρg(kg m−3)the density of the air
D g (m s−2)diffusion coefficient of vapor
ωA(-)mass fraction of the vapor
ωsolids(-)mass fraction of the solids
Ω A c (Hz)angular frequency
ψ (-)fractionality coefficient
Subscripts
eequilibrium
ggas
Lliquid
ssurface of droplet

References

  1. De Mohac, L.M.; Raimi-Abraham, B.; Caruana, R.; Gaetano, G.; Licciardi, M. Multicomponent solid dispersion a new generation of solid dispersion produced by spray-drying. J. Drug Deliv. Sci. Technol. 2020, 57, 101750. [Google Scholar] [CrossRef]
  2. Weuts, I.; Kempen, D.; Verreck, G.; Decorte, A.; Heymans, K.; Peeters, J.; Brewster, M.; Mooter, G.V.d. Study of the physicochemical properties and stability of solid dispersions of loperamide and PEG6000 prepared by spray drying. Eur. J. Pharm. Biopharm. 2005, 59, 119–126. [Google Scholar] [CrossRef] [PubMed]
  3. Papadimitriou, S.A.; Barmpalexis, P.; Karavas, E.; Bikiaris, D.N. Optimizing the ability of PVP/PEG mixtures to be used as appropriate carriers for the preparation of drug solid dispersions by melt mixing technique using artificial neural networks: I. Eur. J. Pharm. Biopharm. 2012, 82, 175–186. [Google Scholar] [CrossRef] [PubMed]
  4. Janssens, S.; de Armas, H.N.; Roberts, C.J.; Van den Mooter, G. Characterization of ternary solid dispersions of itraconazole, PEG 6000, and HPMC 2910 E5. J. Pharm. Sci. 2008, 97, 2110–2120. [Google Scholar] [CrossRef]
  5. Borde, S.; Paul, S.K.; Chauhan, H. Ternary solid dispersions: Classification and formulation considerations. Drug Dev. Ind. Pharm. 2021, 47, 1011–1028. [Google Scholar] [CrossRef]
  6. Lu, T.; Sun, Y.; Ding, D.; Zhang, Q.; Fan, R.; He, Z.; Wang, J. Study on enhanced dissolution of azilsartan-loaded solid dispersion, prepared by combining wet milling and spray-drying technologies. AAPS PharmSciTech 2017, 18, 473–480. [Google Scholar] [CrossRef]
  7. Poozesh, S.; Lu, K.; Marsac, P.J. On the particle formation in spray drying process for bio-pharmaceutical applications: Interrogating a new model via computational fluid dynamics. Int. J. Heat Mass Transf. 2018, 122, 863–876. [Google Scholar] [CrossRef]
  8. Singh, A.; Van den Mooter, G. Spray drying formulation of amorphous solid dispersions. Adv. Drug Deliv. Rev. 2016, 100, 27–50. [Google Scholar] [CrossRef]
  9. Thybo, P.; Hovgaard, L.; Lindeløv, J.S.; Brask, A.; Andersen, S.K. Scaling up the spray drying process from pilot to production scale using an atomized droplet size criterion. Pharm. Res. 2008, 25, 1610–1620. [Google Scholar] [CrossRef]
  10. Masters, K. Spray Drying Handbook; Longman Scientific & Technical: London, UK, 1991. [Google Scholar]
  11. Jayasundera, M.; Adhikari, B.; Aldred, P.; Ghandi, A. Surface modification of spray dried food and emulsion powders with surface-active proteins: A review. J. Food Eng. 2009, 93, 266–277. [Google Scholar] [CrossRef] [Green Version]
  12. Hadiwinoto, G.D.; Kwok, P.C.L.; Tong, H.H.Y.; Wong, S.N.; Chow, S.F.; Lakerveld, R. Integrated continuous plug-flow crystallization and spray drying of pharmaceuticals for dry powder inhalation. Ind. Eng. Chem. Res. 2019, 58, 16843–16857. [Google Scholar] [CrossRef]
  13. Pandi, P.; Bulusu, R.; Kommineni, N.; Khan, W.; Singh, M. Amorphous solid dispersions: An update for preparation, characterization, mechanism on bioavailability, stability, regulatory considerations and marketed products. Int. J. Pharm. 2020, 586, 119560. [Google Scholar] [CrossRef] [PubMed]
  14. Corrigan, D.O.; Healy, A.M.; Corrigan, O.I. The effect of spray drying solutions of polyethylene glycol (PEG) and lactose/PEG on their physicochemical properties. Int. J. Pharm. 2002, 235, 193–205. [Google Scholar] [CrossRef]
  15. Nishad, J.; Selvan, C.J.; Mir, S.A.; Bosco, S.J.D. Effect of spray drying on physical properties of sugarcane juice powder (Saccharum officinarum L.). J. Food. Sci. Technol. 2017, 54, 687–697. [Google Scholar] [CrossRef] [PubMed] [Green Version]
  16. Thybo, P.; Hovgaard, L. Droplet size measurements for spray dryer scale-up. Pharm. Dev. Technol. 2008, 13, 93–104. [Google Scholar] [CrossRef]
  17. Velaga, S.P.; Nikjoo, D.; Vuddanda, P.R. Experimental studies and modeling of the drying kinetics of multicomponent polymer films. AAPS PharmSciTech 2018, 19, 425–435. [Google Scholar] [CrossRef] [Green Version]
  18. Al Zaitone, B.; Al-Zahrani, A.; Al-Shahrani, S.; Lamprecht, A. Drying of a single droplet of dextrin: Drying kinetics modeling and particle formation. Int. J. Pharm. 2020, 574, 118888. [Google Scholar] [CrossRef]
  19. Al Zaitone, B.; Lamprecht, A. Single droplet drying step characterization in microsphere preparation. Colloids Surf. B-Biointerfaces 2013, 105, 328–334. [Google Scholar] [CrossRef]
  20. Mondragon, R.; Hernandez, L.; Julia, J.E.; Jarque, J.C.; Chiva, S.; Zaitone, B.; Tropea, C. Study of the drying behavior of high load multiphase droplets in an acoustic levitator at high temperature conditions. Chem. Eng. Sci. 2011, 66, 2734–2744. [Google Scholar] [CrossRef]
  21. Rehder, S.; Wu, J.X.; Laackmann, J.; Moritz, H.U.; Rantanen, J.; Rades, T.; Leopold, C.S. A case study of real-time monitoring of solid-state phase transformations in acoustically levitated particles using near infrared and Raman spectroscopy. Eur. J. Pharm. Sci. Off. J. Eur. Fed. Pharm. Sci. 2013, 48, 97–103. [Google Scholar] [CrossRef]
  22. Al Zaitone, B.; Al-Zahrani, A. Modeling drying behavior of an aqueous chitosan single droplet using the reaction engineering approach. AAPS PharmSciTech 2020, 21, 315. [Google Scholar] [CrossRef] [PubMed]
  23. Kastner, O.; Brenn, G.; Rensink, D.; Tropea, C. Mass transfer from multiple droplets during drying in a tube levitator. In Proceedings of the International Conference on Liquid Automization and Spray Systems, Pasadena, CA, USA, 16–20 July 2000. [Google Scholar]
  24. Ford, I.J. Models of crystallisation in evaporating droplets. Mater. Res. Soc. Symp. Proc. 1996, 398, 637–642. [Google Scholar] [CrossRef]
  25. Cheong, H.W.; Jeffreys, G.V.; Mumford, C.J. A receding interface model for the drying of slurry droplets. AIChE J. 1986, 32, 1334–1346. [Google Scholar] [CrossRef]
  26. Handscomb, C.S.; Kraft, M. Simulating the structural evolution of droplets following shell formation. Chem. Eng. Sci. 2010, 65, 713–725. [Google Scholar] [CrossRef]
  27. Gregson, F.K.A.; Robinson, J.F.; Miles, R.E.H.; Royall, C.P.; Reid, J.P. Drying kinetics of salt solution droplets: Water evaporation rates and crystallization. J. Phys. Chem. B 2019, 123, 266–276. [Google Scholar] [CrossRef] [Green Version]
  28. Haque, M.A.; Hosain Oliver, M.M.; Putranto, A.; Adhikari, B. Drying and denaturation kinetics of Beta-Lactoglobulin during convective drying. J. Food Eng. 2018, 237, 9–17. [Google Scholar] [CrossRef] [Green Version]
  29. Chen, X.D.; Putranto, A. Reaction engineering approach (REA) to modeling drying problems: Recent development and implementations. Dry. Technol. 2015, 33, 1899–1910. [Google Scholar] [CrossRef]
  30. Al Zaitone, B.; Al-Zahrani, A. Spray drying of cellulose nanofibers: Drying kinetics modeling of a single droplet and particle formation. Chem. Eng. Technol. 2021, 44, 1270–1277. [Google Scholar] [CrossRef]
  31. Putranto, A.; Chen, X.D. Drying of a system of multiple solvents: Modeling by the reaction engineering approach. AIChE J. 2016, 62, 2144–2153. [Google Scholar] [CrossRef]
  32. Lierke, E.G. Akustische positionierung—Ein umfassender überblick über grundlagen und anwendungen. Acustica 1996, 82, 220–237. [Google Scholar]
  33. Schlichting, H. Boundary Layer Theory; McGraw-Hill, Inc.: New York, NY, USA, 1978. [Google Scholar]
  34. Al Zaitone, B.; Tropea, C. Evaporation of pure liquid droplets: Comparison of droplet evaporation in an acoustic field versus glass-filament. Chem. Eng. Sci. 2011, 66, 3914–3921. [Google Scholar] [CrossRef]
  35. Farid, M. A new approach to modelling of single droplet drying. Chem. Eng. Sci. 2003, 58, 2985–2993. [Google Scholar] [CrossRef]
  36. Chen, X.D.; Xie, G.Z. Fingerprints of the drying behaviour of particulate or thin layer food materials established using a reaction engineering model. Food Bioprod. Processing 1997, 75, 213–222. [Google Scholar] [CrossRef]
  37. Fuller, E.N.; Schettler, P.D.; Giddings, J.C. New method for prediction of binary gas-phase diffusion coefficients. Ind. Eng. Chem. 1966, 58, 18–27. [Google Scholar] [CrossRef]
  38. Chen, X.D.; Lin, S.X.Q. Air drying of milk droplet under constant and time-dependent conditions. AIChE J. 2005, 51, 1790–1799. [Google Scholar] [CrossRef]
  39. Chen, X.D. The basics of a reaction engineering approach to modeling air-drying of small droplets or thin-layer materials. Dry. Technol. 2008, 26, 627–639. [Google Scholar] [CrossRef]
  40. Yarin, A.l.; Brenn, G.; Kastner, O.; Rensink, D.; Tropea, C. Evaporation of acoustically levitated droplets. Fluid Mech. 1999, 399, 151–204. [Google Scholar] [CrossRef] [Green Version]
  41. Morse, P.M. Vibration and Sound, 2nd ed.; McGraw-Hill: New York, NY, USA, 1948. [Google Scholar]
  42. Chen, X.D.; Sidhu, H.; Nelson, M. Theoretical probing of the phenomenon of the formation of the outermost surface layer of a multi-component particle, and the surface chemical composition after the rapid removal of water in spray drying. Chem. Eng. Sci. 2011, 66, 6375–6384. [Google Scholar] [CrossRef]
  43. Kastner, O.; Brenn, G.n.; Rensink, D.; Tropea, C. The acoustic tube levitator—A novel device for determining the drying kinetics of single droplets. Chem. Eng. Technol. 2001, 24, 335–339. [Google Scholar] [CrossRef]
  44. Salem, A.; Ahmadlouiedarab, M.; Ghasemzadeh, K. CFD approach for the moisture prediction in spray chamber for drying of salt solution. J. Ind. Eng. Chem. 2011, 17, 527–532. [Google Scholar] [CrossRef]
  45. Poozesh, S.; Bilgili, E. Scale-up of pharmaceutical spray drying using scale-up rules: A review. Int. J. Pharm. 2019, 562, 271–292. [Google Scholar] [CrossRef] [PubMed]
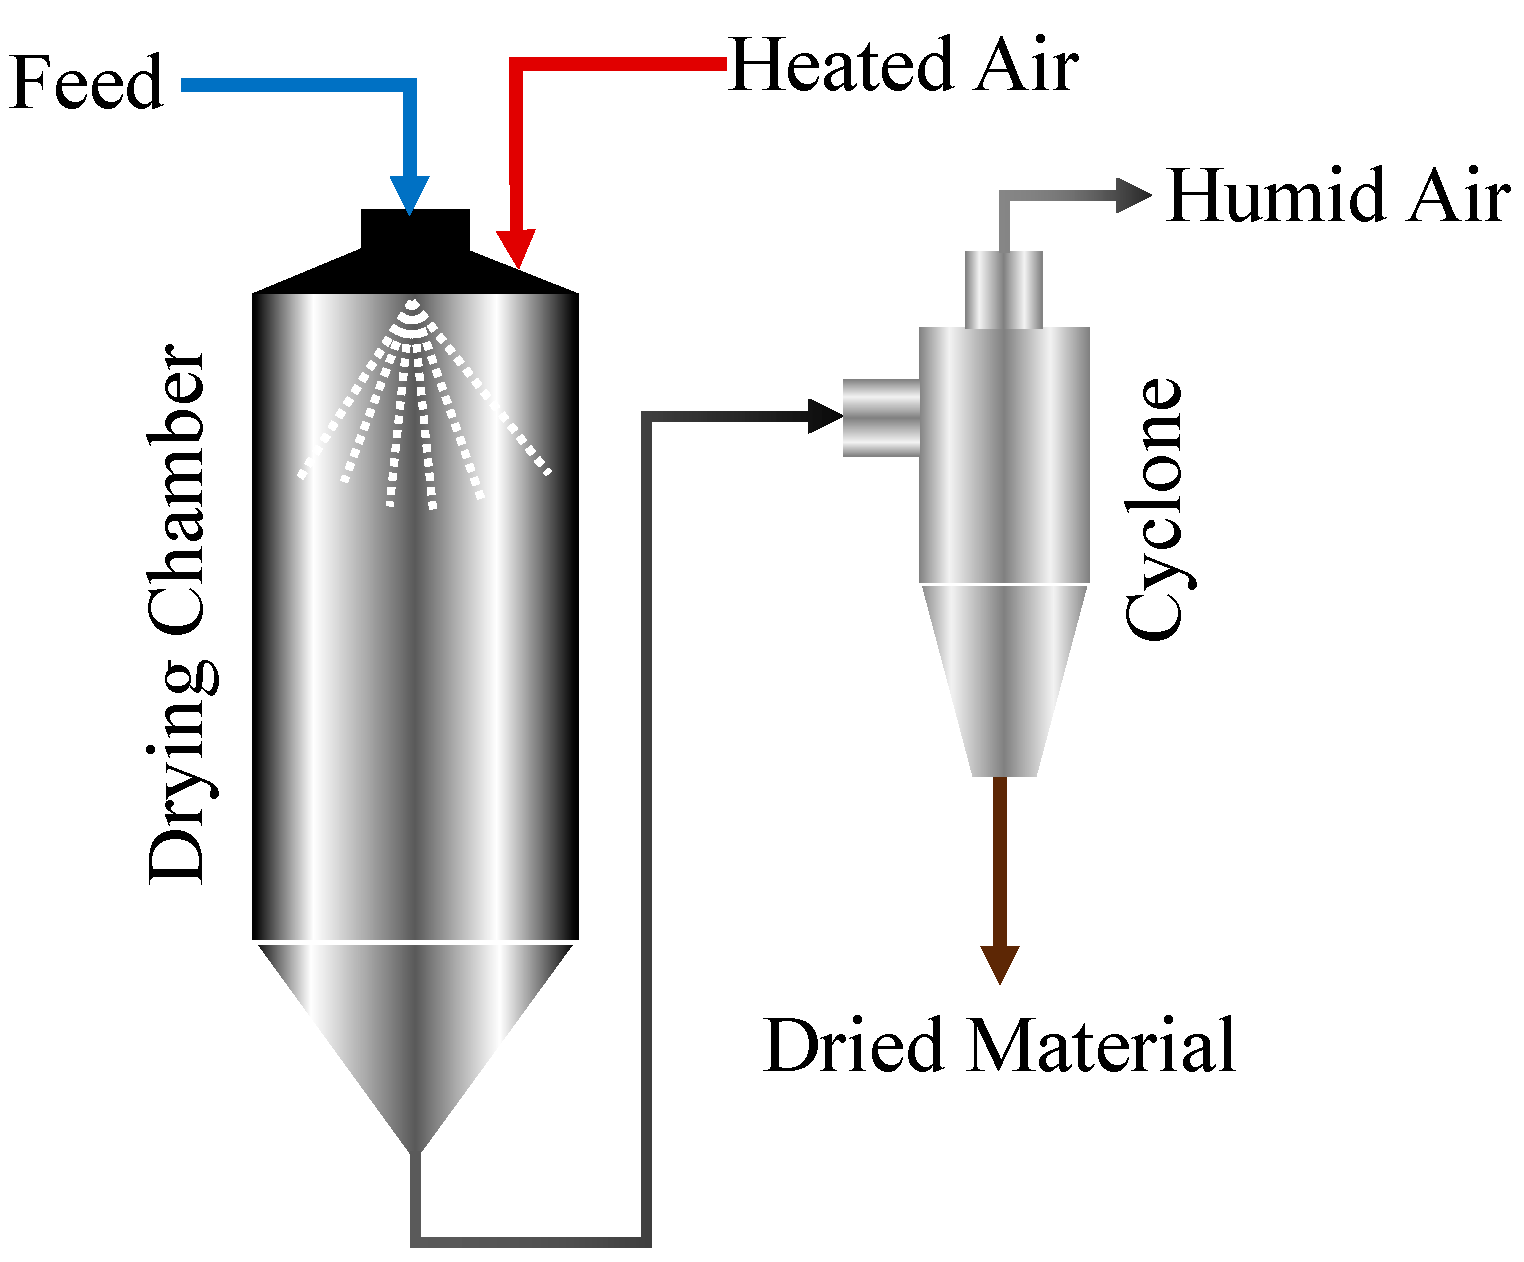
Figure 1. Schematic of spray drying unit.
Processes 10 01365 g001
Figure 2. Sketch of the experimental setup: (a) the ultrasonic levitator, the video camera (CMOS MQ013xG-ON, XIMEA GmbH), and long-distance macro lens. (b) Backlighting LED source and the drying chamber, which consists of heating and cooling chambers.
Processes 10 01365 g002
Figure 3. Dimensionless droplet surface evolution, initial PEG600 mass fractions in the levitated droplet were (a) 5%, (b) 10%, and (c) 15% (w/w).
Processes 10 01365 g003
Figure 4. Images of dried PEG6000 particles under the scanning electron microscope (SEM) show the evolved particle structure at the end of the drying process. (a) T = 50 °C, 10% (w/w) and (b) T = 30 °C, 15% (w/w).
Processes 10 01365 g004
Figure 5. Experimental drying curve plotted in terms of the dimensionless droplet surface for 15% (w/w) initial PEG concentration, the air drying temperature was set at 50 °C. The droplet’s relative vertical position in the acoustic field is plotted in blue.
Processes 10 01365 g005
Figure 6. The drying curves of PEG600 in terms of dry mass content (X) versus time, and the corresponding REA model (solid lines). The initial polymer mass fractions are (a) 5%, (b) 10%, and (c) 15% (w/w). The temperature of the drying gas is 30 °C and 50 °C.
Processes 10 01365 g006aProcesses 10 01365 g006b
Publisher’s Note: MDPI stays neutral with regard to jurisdictional claims in published maps and institutional affiliations.